
Enhancing Power System Frequency with a Novel Load Shedding Method Including Monitoring of Synchronous Condensers’ Power Injections

Abstract
:1. Introduction
- (1)
- The importance of the frequency stability for an AC power system increases with decreasing power system size due to decreasing system inertia and increasing rate of change of frequency (ROCOF) during loss-of-generation incidents;
- (2)
- Synchronous condenser technology can be used to increase the system inertia and simplify the solution to the frequency control problem. In the event of a loss of large generating capacities, the use of SC makes it easier to solve the task of frequency control, but the problem of emergency frequency control remains to be acute;
- (3)
- Attempts to improve the efficiency of UFLS schemes have until now been based on the use of ROCOF in one or another way. However, to the best of our knowledge, there are no studies aimed at improving UFLS based on the monitoring the SC response in transient conditions.
2. Materials and Methods
2.1. Inertia and Inertial Response
2.2. Classic/Static UFLS and Its Challenges
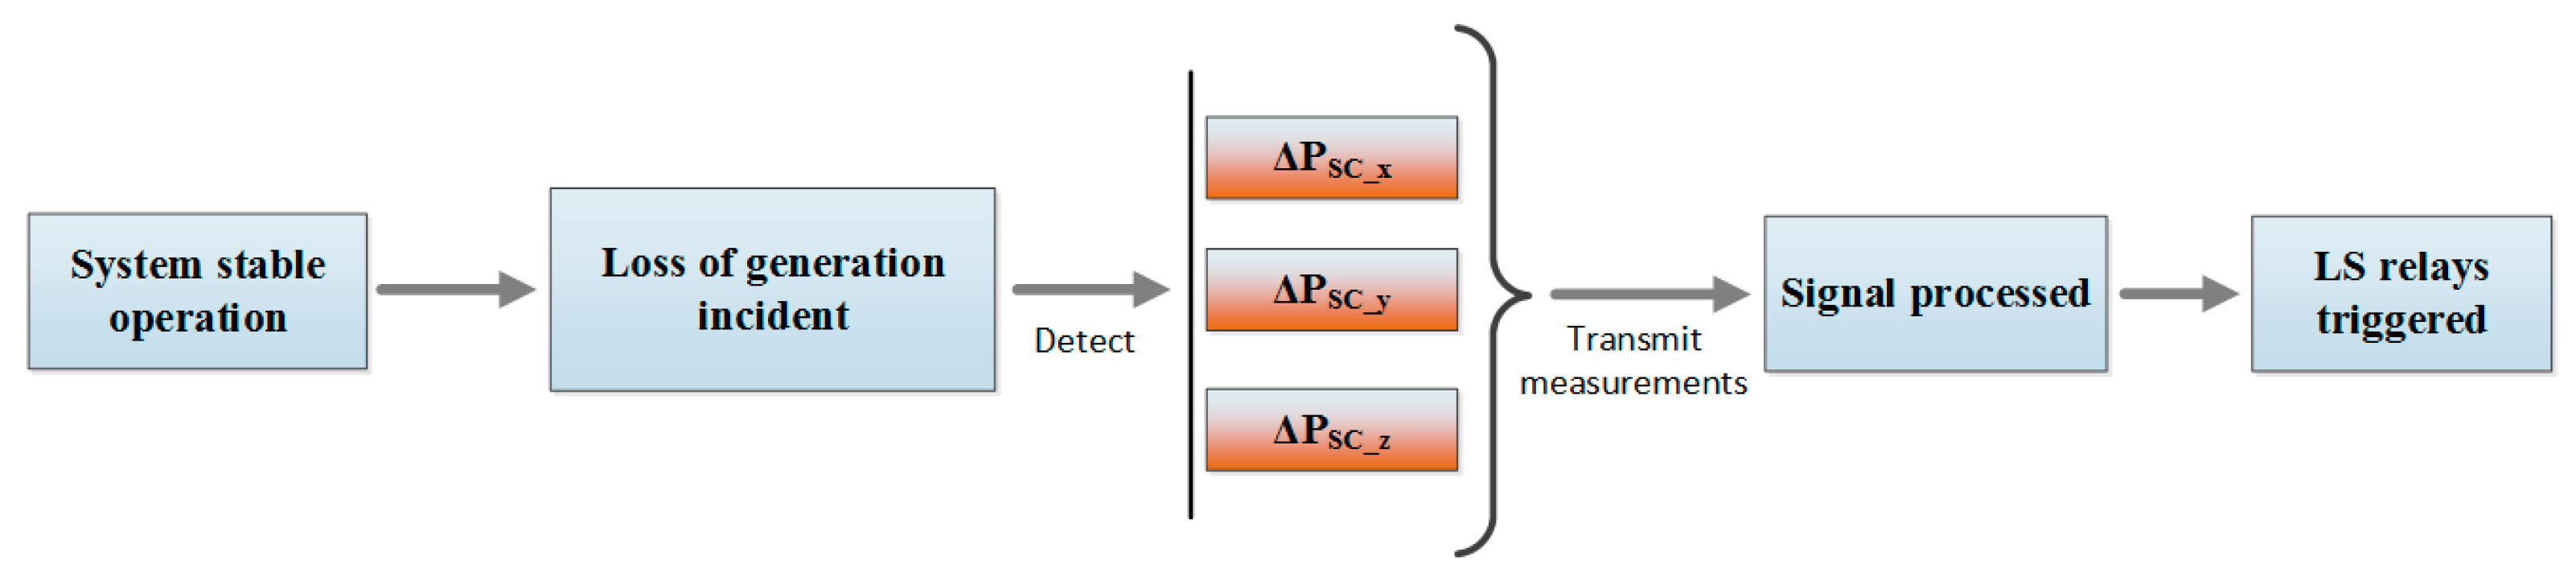
2.3. The Concept
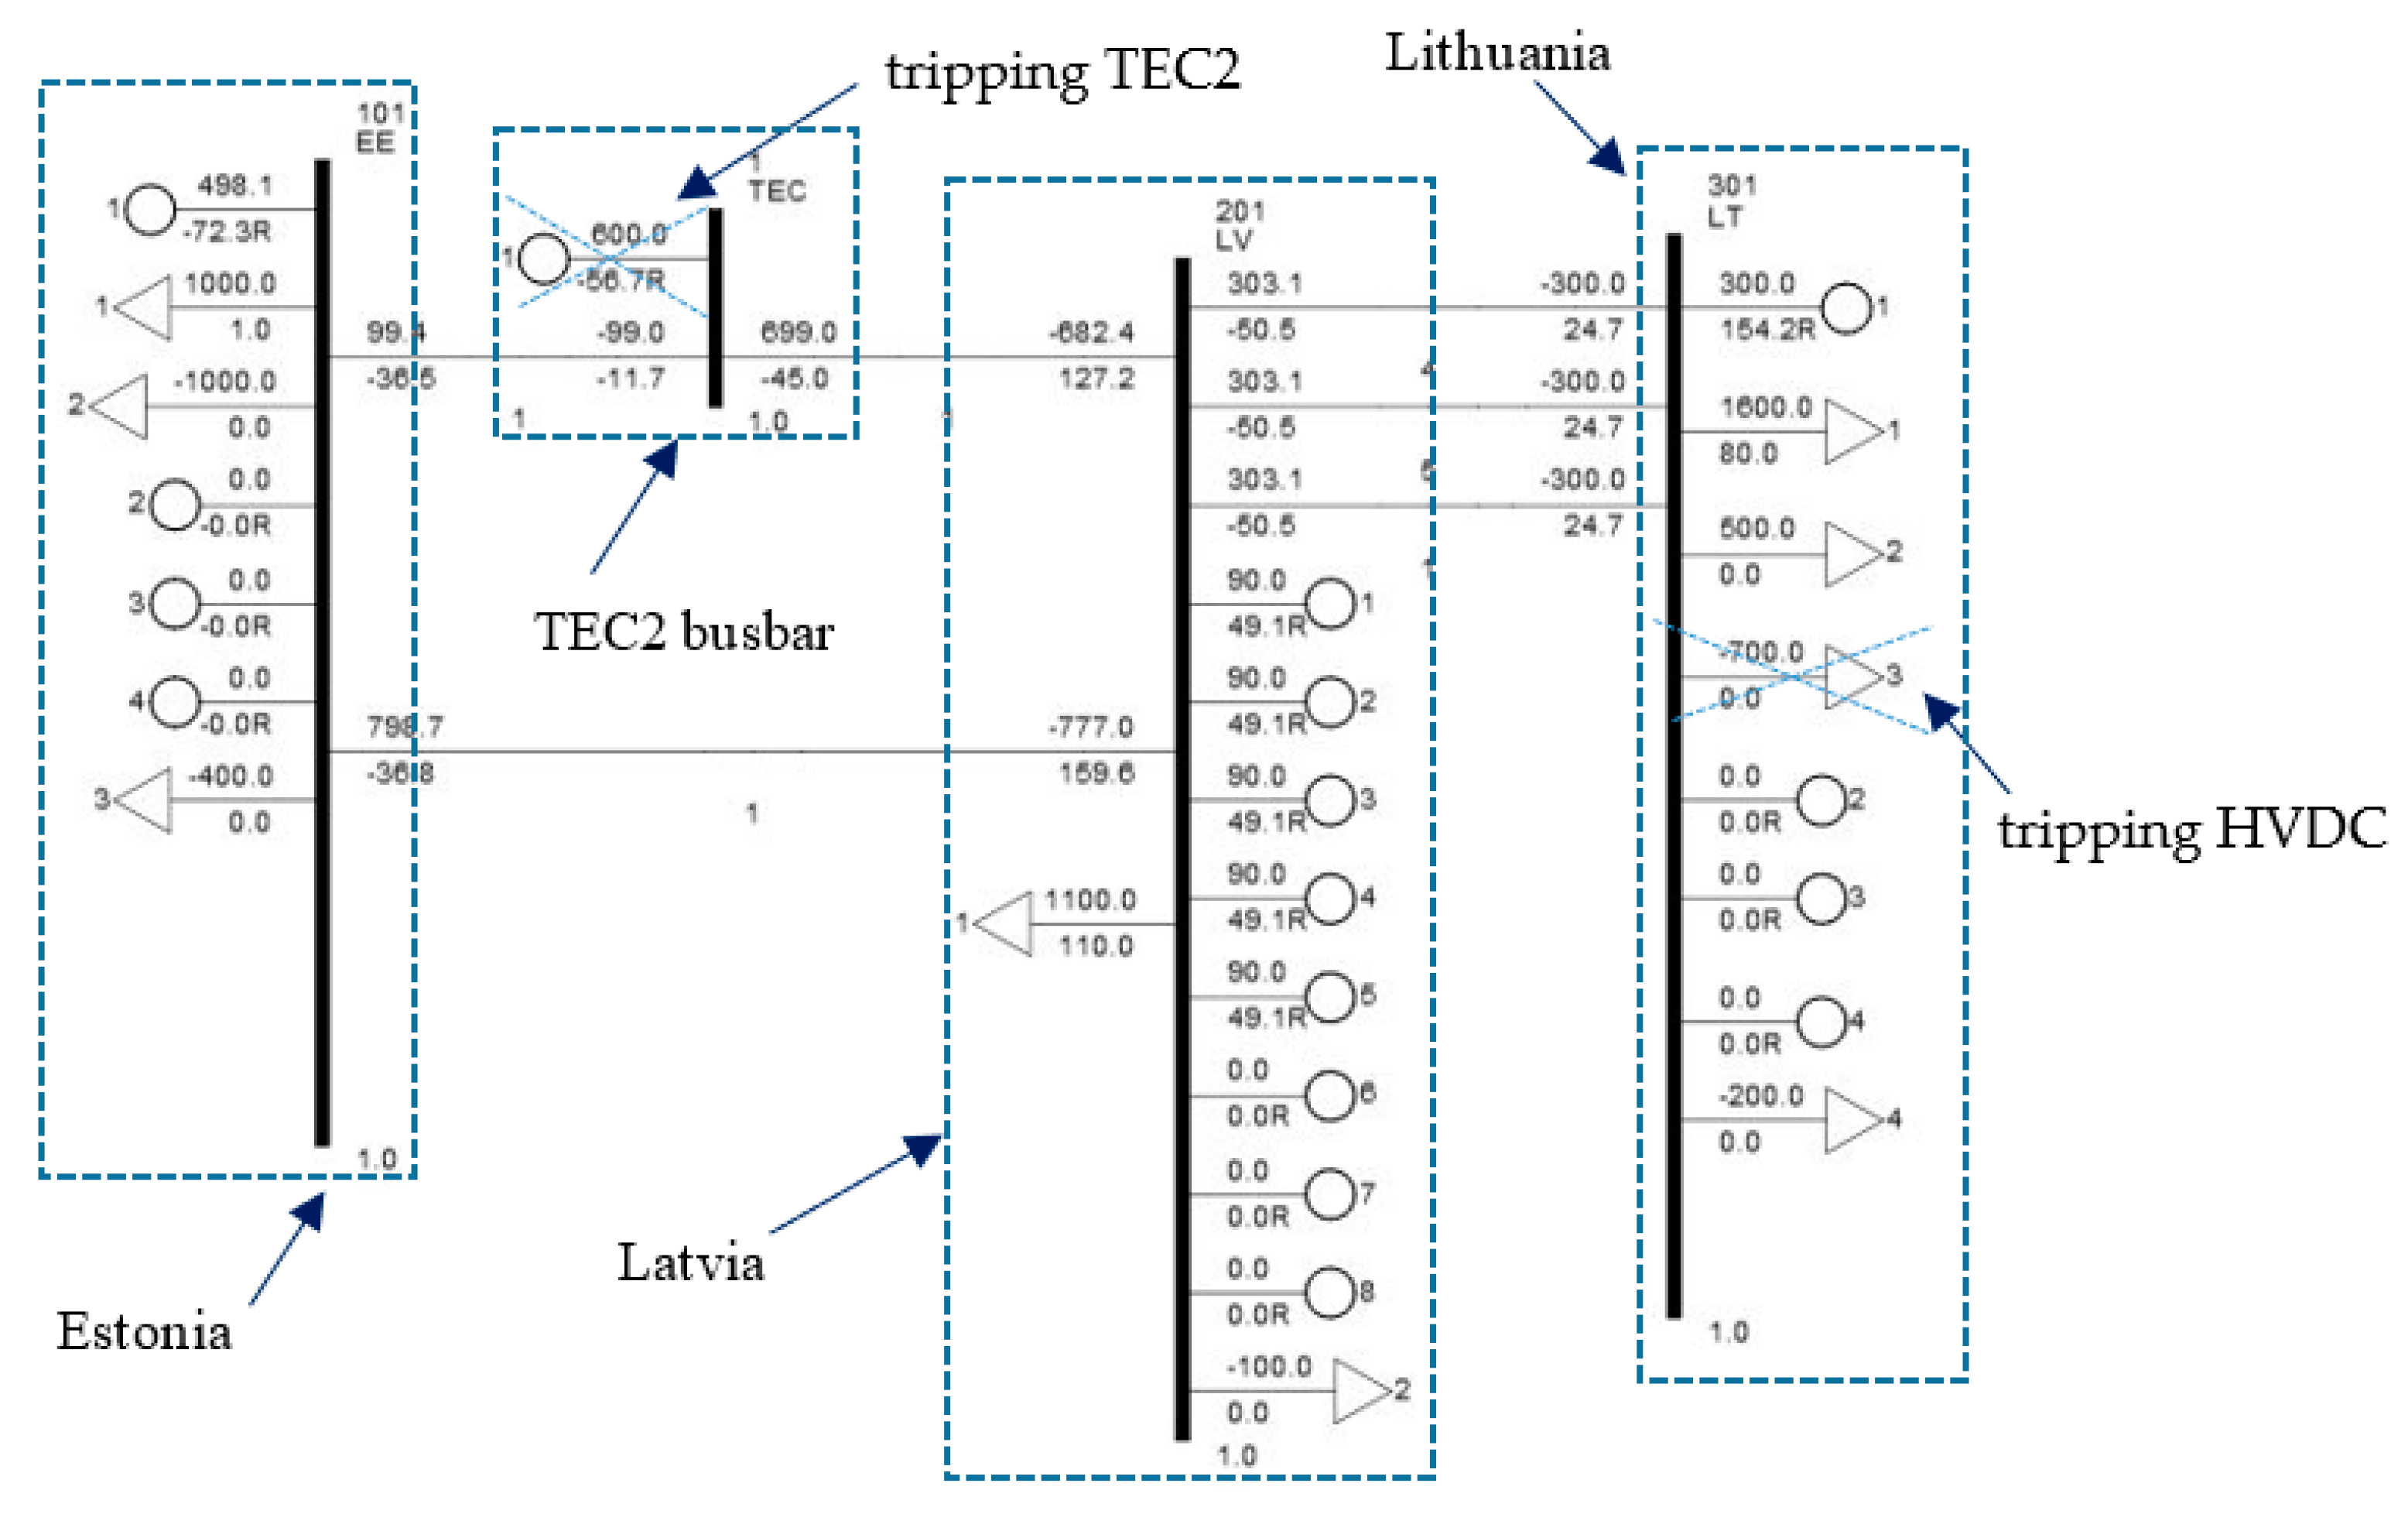
3. Case Study
3.1. Methodology and Results. Test Case Set No. 1
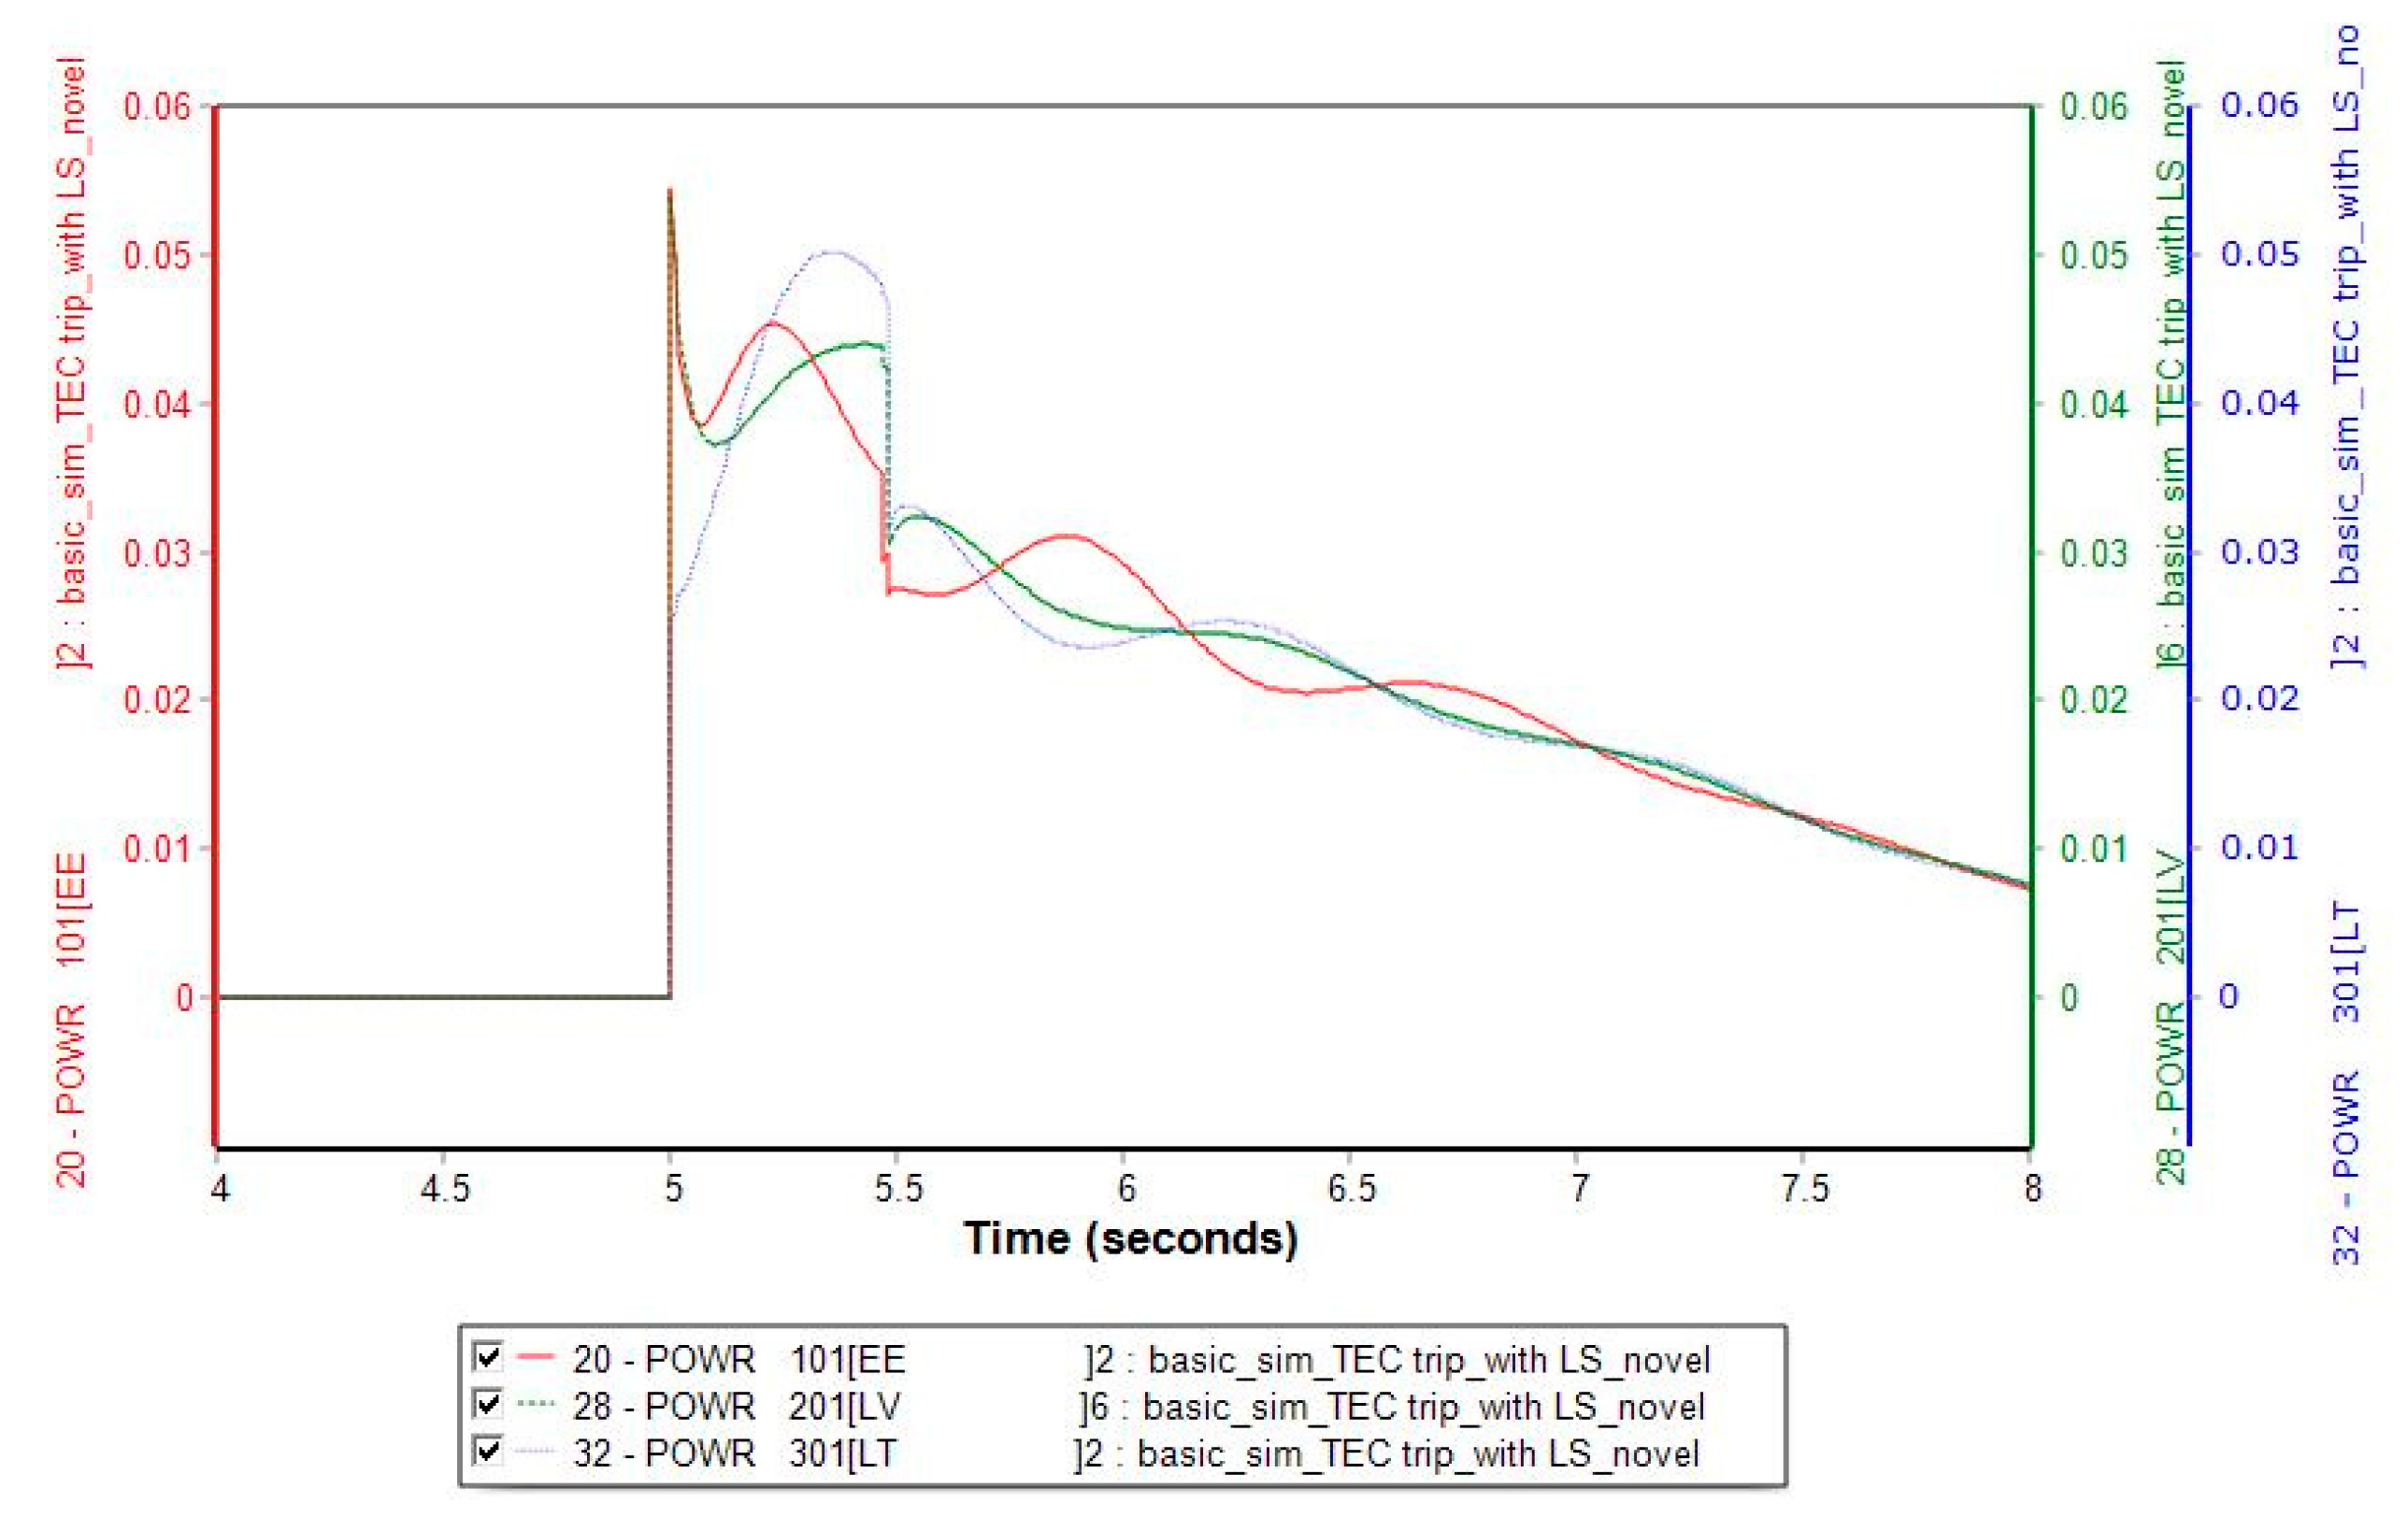
3.1.1. Scenario A
3.1.2. Scenario B
3.1.3. Scenario C
3.1.4. Scenario D
3.2. Methodology and Results. Test Case Set No. 2
4. Discussion
- -
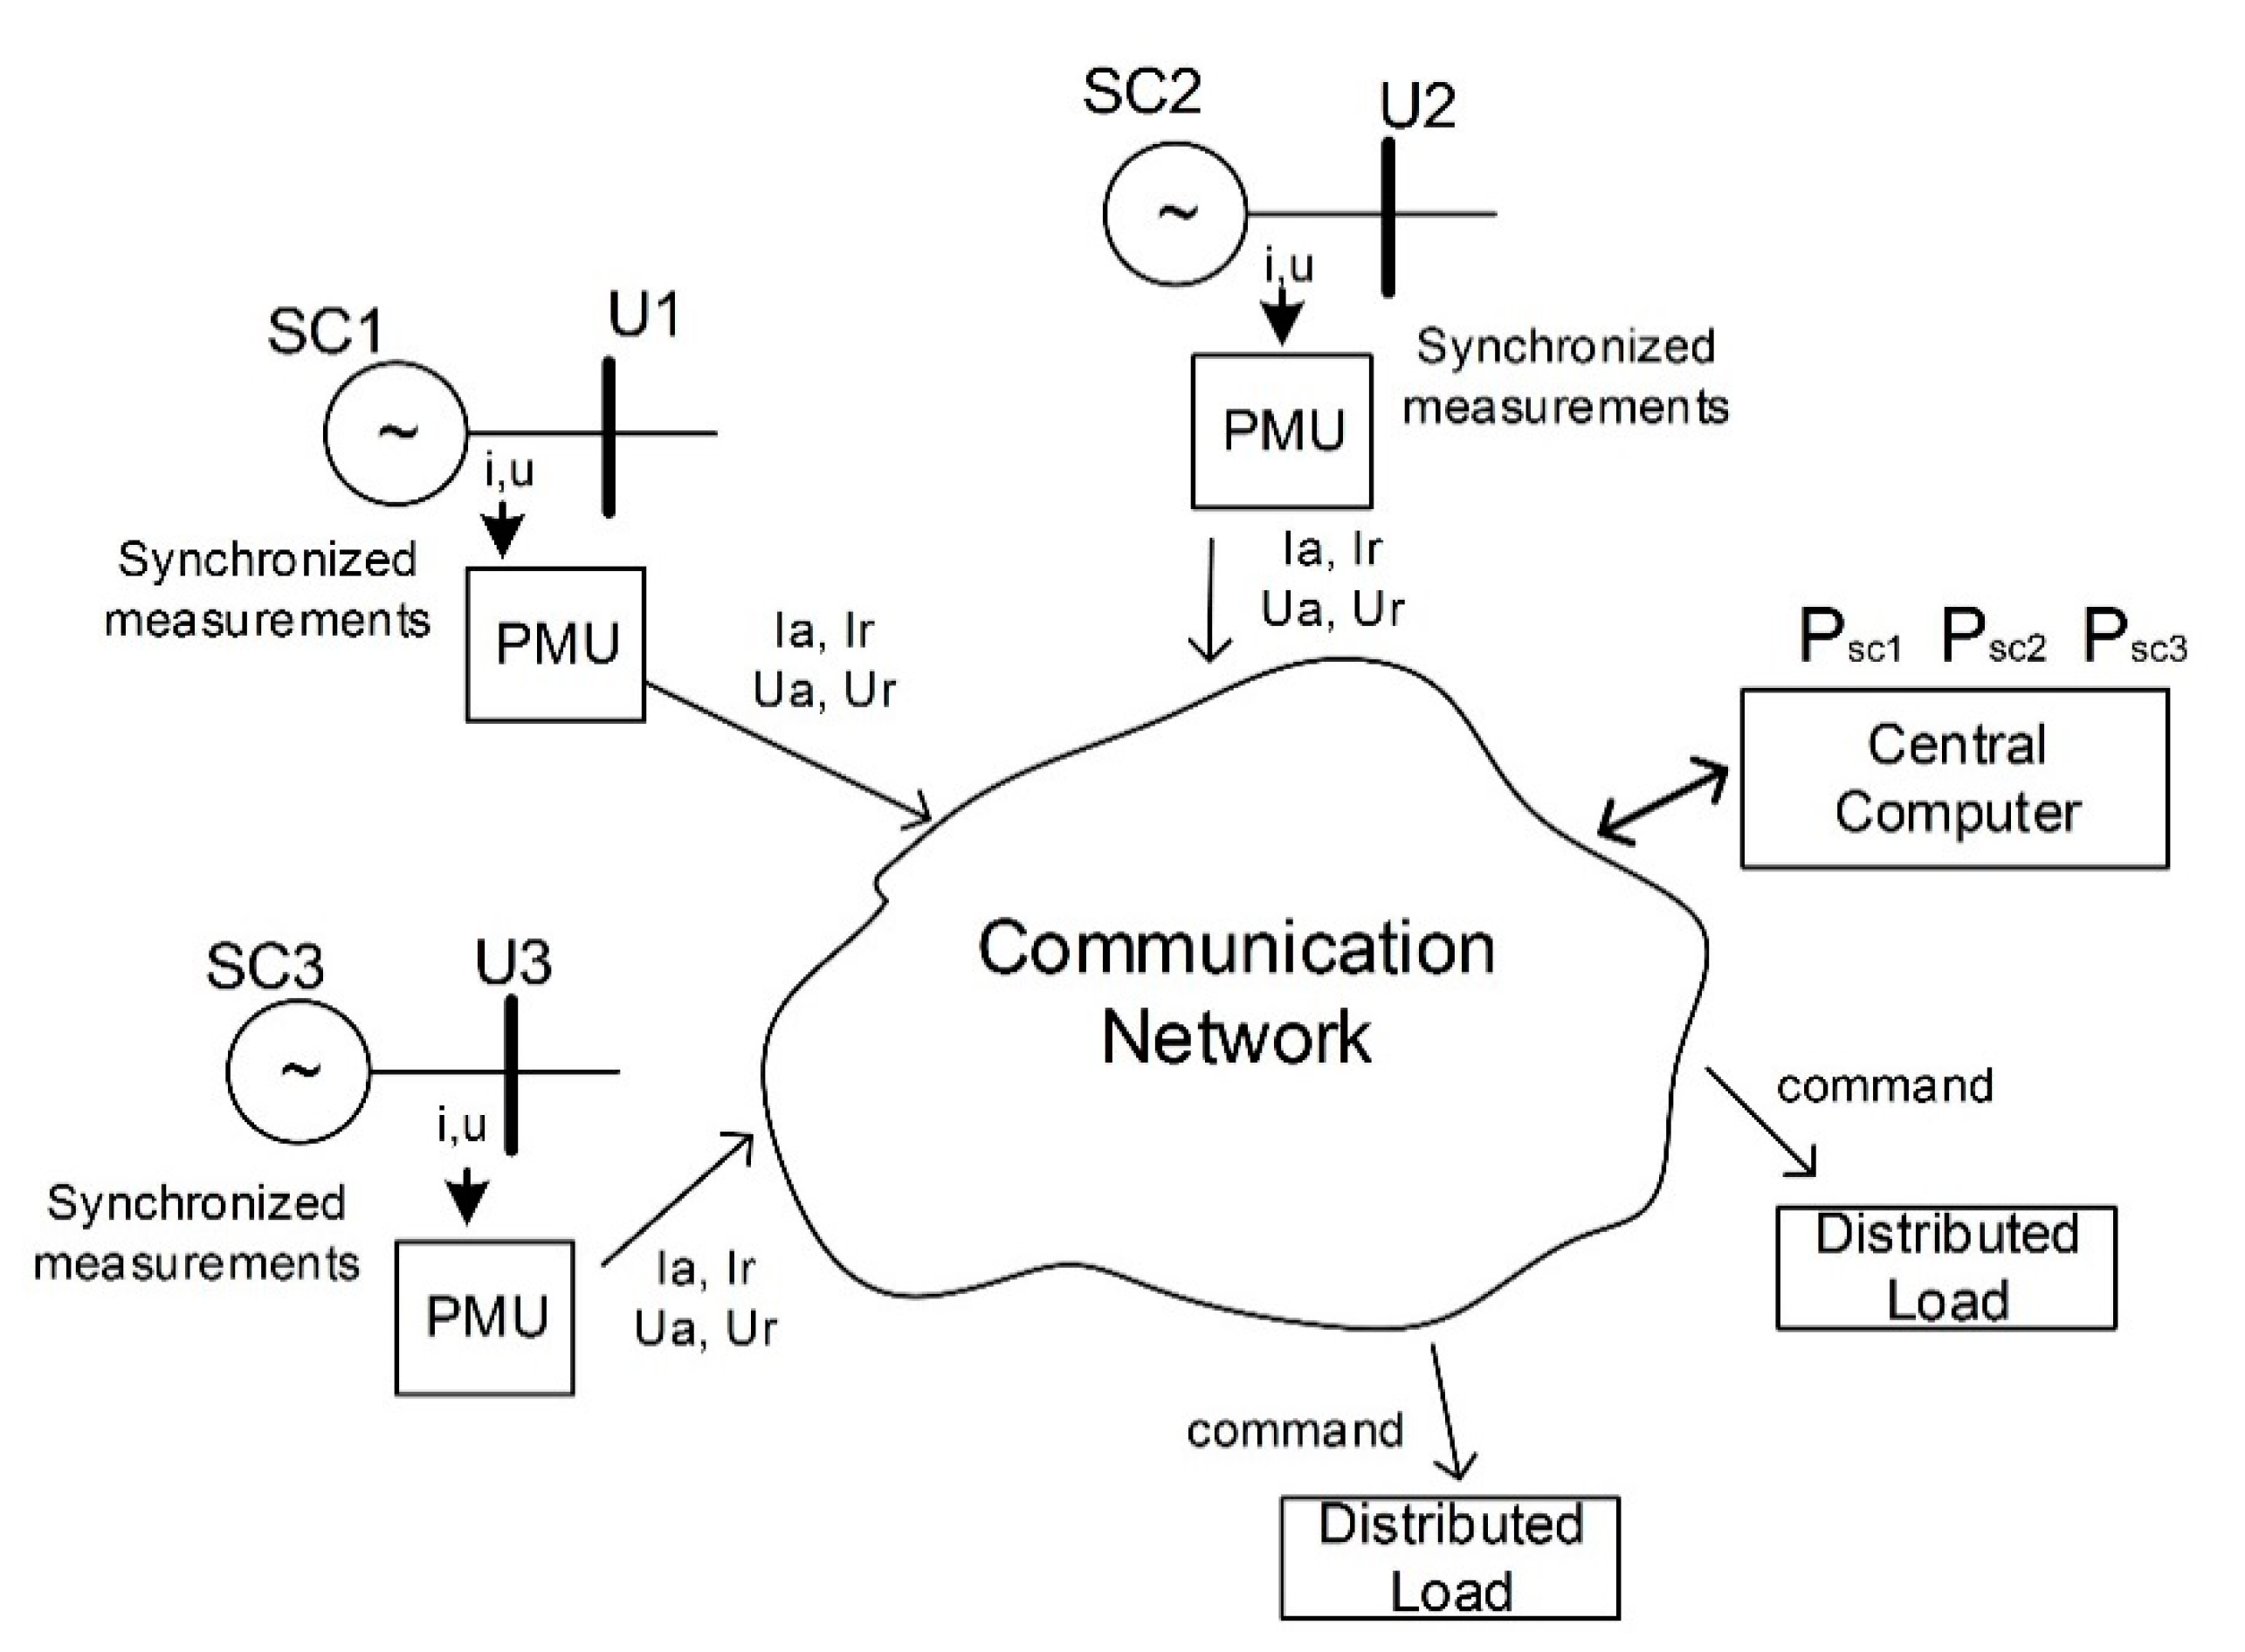
- the SC active power injections
- -
- the total system inertia level
5. Conclusions
Author Contributions
Funding
Institutional Review Board Statement
Informed Consent Statement
Data Availability Statement
Conflicts of Interest
Abbreviations
| LS | Load shedding |
| UFLS | Under-frequency load shedding |
| ROCOF | Rate of change of frequency |
| AC | Alternating current |
| EU | European Union |
| MV/HV | Medium voltage/high voltage |
| UPS | Unified Power System of Russia |
| HVDC | High voltage direct current |
| CHP | Combined heat and power |
| ENTSO-E | European Network of Transmission System Operators for Electricity |
| TSO | Transmission systems operator |
| SC | Synchronous condenser |
| COI | Centre of inertia |
| TEC2 | Riga TEC2 CHP power plant |
| HPP | Hydro power plant |
References
- UN Framework Convention on Climate Change. The Paris Agreement; UN Framework Convention on Climate Change: Rio de Janeiro, Brazil, 2016. [Google Scholar]
- European Union. 2030 Climate & Energy Framework; European Union: Brussels, Belgium, 2020. [Google Scholar]
- European Union. Integrated National Energy and Climate Plan; European Union: Brussels, Belgium, 2020.
- Germany Trade & Invest. Business Opportunities in Germany; Germany Trade & Invest: Berlin, Germany, 2018; p. 4. [Google Scholar]
- Dreidy, M.; Mokhlis, H.; Mekhilef, S. Inertia response and frequency control techniques for renewable energy sources: A review. Renew. Sustain. Energy Rev. 2017, 69, 144–155. [Google Scholar] [CrossRef]
- Tielens, P.; van Hertem, D. Grid Inertia and Frequency Control in Power Systems with High Penetration of Renewables. In Proceedings of the Young Researchers Symposium in Electrical Power Engineering, Delft, The Netherlands, 16–17 April 2012. [Google Scholar]
- Moser, A. Planung und Betrieb von Elektrizitätsversorgungssytemen, Skriptum zur Vorlesung; IAEW: Aachen, Germany, 2012; pp. 151–153. [Google Scholar]
- Machowski, J.; Bialek, J.W.; Bumby, J.R. Power System Dynamics, 2nd ed.; John Wiley & Sons: Aachen, Germany, 2008; p. 171. [Google Scholar]
- Delfino, B.; Massucco, S.; Morini, A.; Scalera, P.; Silvestro, F. Implementation and comparison of different under frequency load-shedding schemes. In Proceedings of the 2001 Power Engineering Society Summer Meeting (Cat. No.01CH37262), New York, NY, USA, 16–18 October 1989; IEEE: Piscataway, NJ, USA, 2001; Volume 1, pp. 307–312. [Google Scholar]
- Rudez, U.; Mihalic, R. Comparison of adaptive UFLS schemes in modern power systems. In Proceedings of the 2010 IEEE Electrical Power & Energy Conference, San Diego, CA, USA, 22–26 July 2012; IEEE: Piscataway, NJ, USA, 2011; pp. 233–238. [Google Scholar]
- Ben Kilani, K.; Elleuch, M.; Hamida, A.H. Dynamic under frequency load shedding in power systems. In Proceedings of the 2017 14th International Multi-Conference on Systems, Signals & Devices (SSD), Marrakech, Morocco, 28–31 March 2017; IEEE: Piscataway, NJ, USA, 2017; pp. 377–382. [Google Scholar]
- Zare, F.; Ranjbar, A.; Faghihi, F. Intelligent topology-oriented load shedding scheme in power systems. In Proceedings of the 2019 27th Iranian Conference on Electrical Engineering (ICEE), Yazd, Iran, 30 April–2 May 2019; IEEE: Piscataway, NJ, USA, 2019; pp. 652–656. [Google Scholar]
- Jianjun, Z.; Dongyu, S.; Dong, Z.; Yang, G. Load Shedding Control Strategy for Power System Based on the System Frequency and Voltage Stability (Apr 2018). In Proceedings of the 2018 China International Conference on Electricity Distribution (CICED), Tianjin, China, 17–19 September 2018; IEEE: Piscataway, NJ, USA, 2018; pp. 1352–1355. [Google Scholar]
- Talaat, M.; Hatata, A.; Alsayyari, A.S.; Alblawi, A. A smart load management system based on the grasshopper optimization algorithm using the under-frequency load shedding approach. Energy 2020, 190, 116423. [Google Scholar] [CrossRef]
- Rudez, U.; Mihalic, R. Trends in WAMS-based under-frequency load shedding protection. In Proceedings of the IEEE EUROCON 2017-17th International Conference on Smart Technologies, Ohrid, Macedonia, 6–8 July 2017; IEEE: Piscataway, NJ, USA, 2017; pp. 782–787. [Google Scholar]
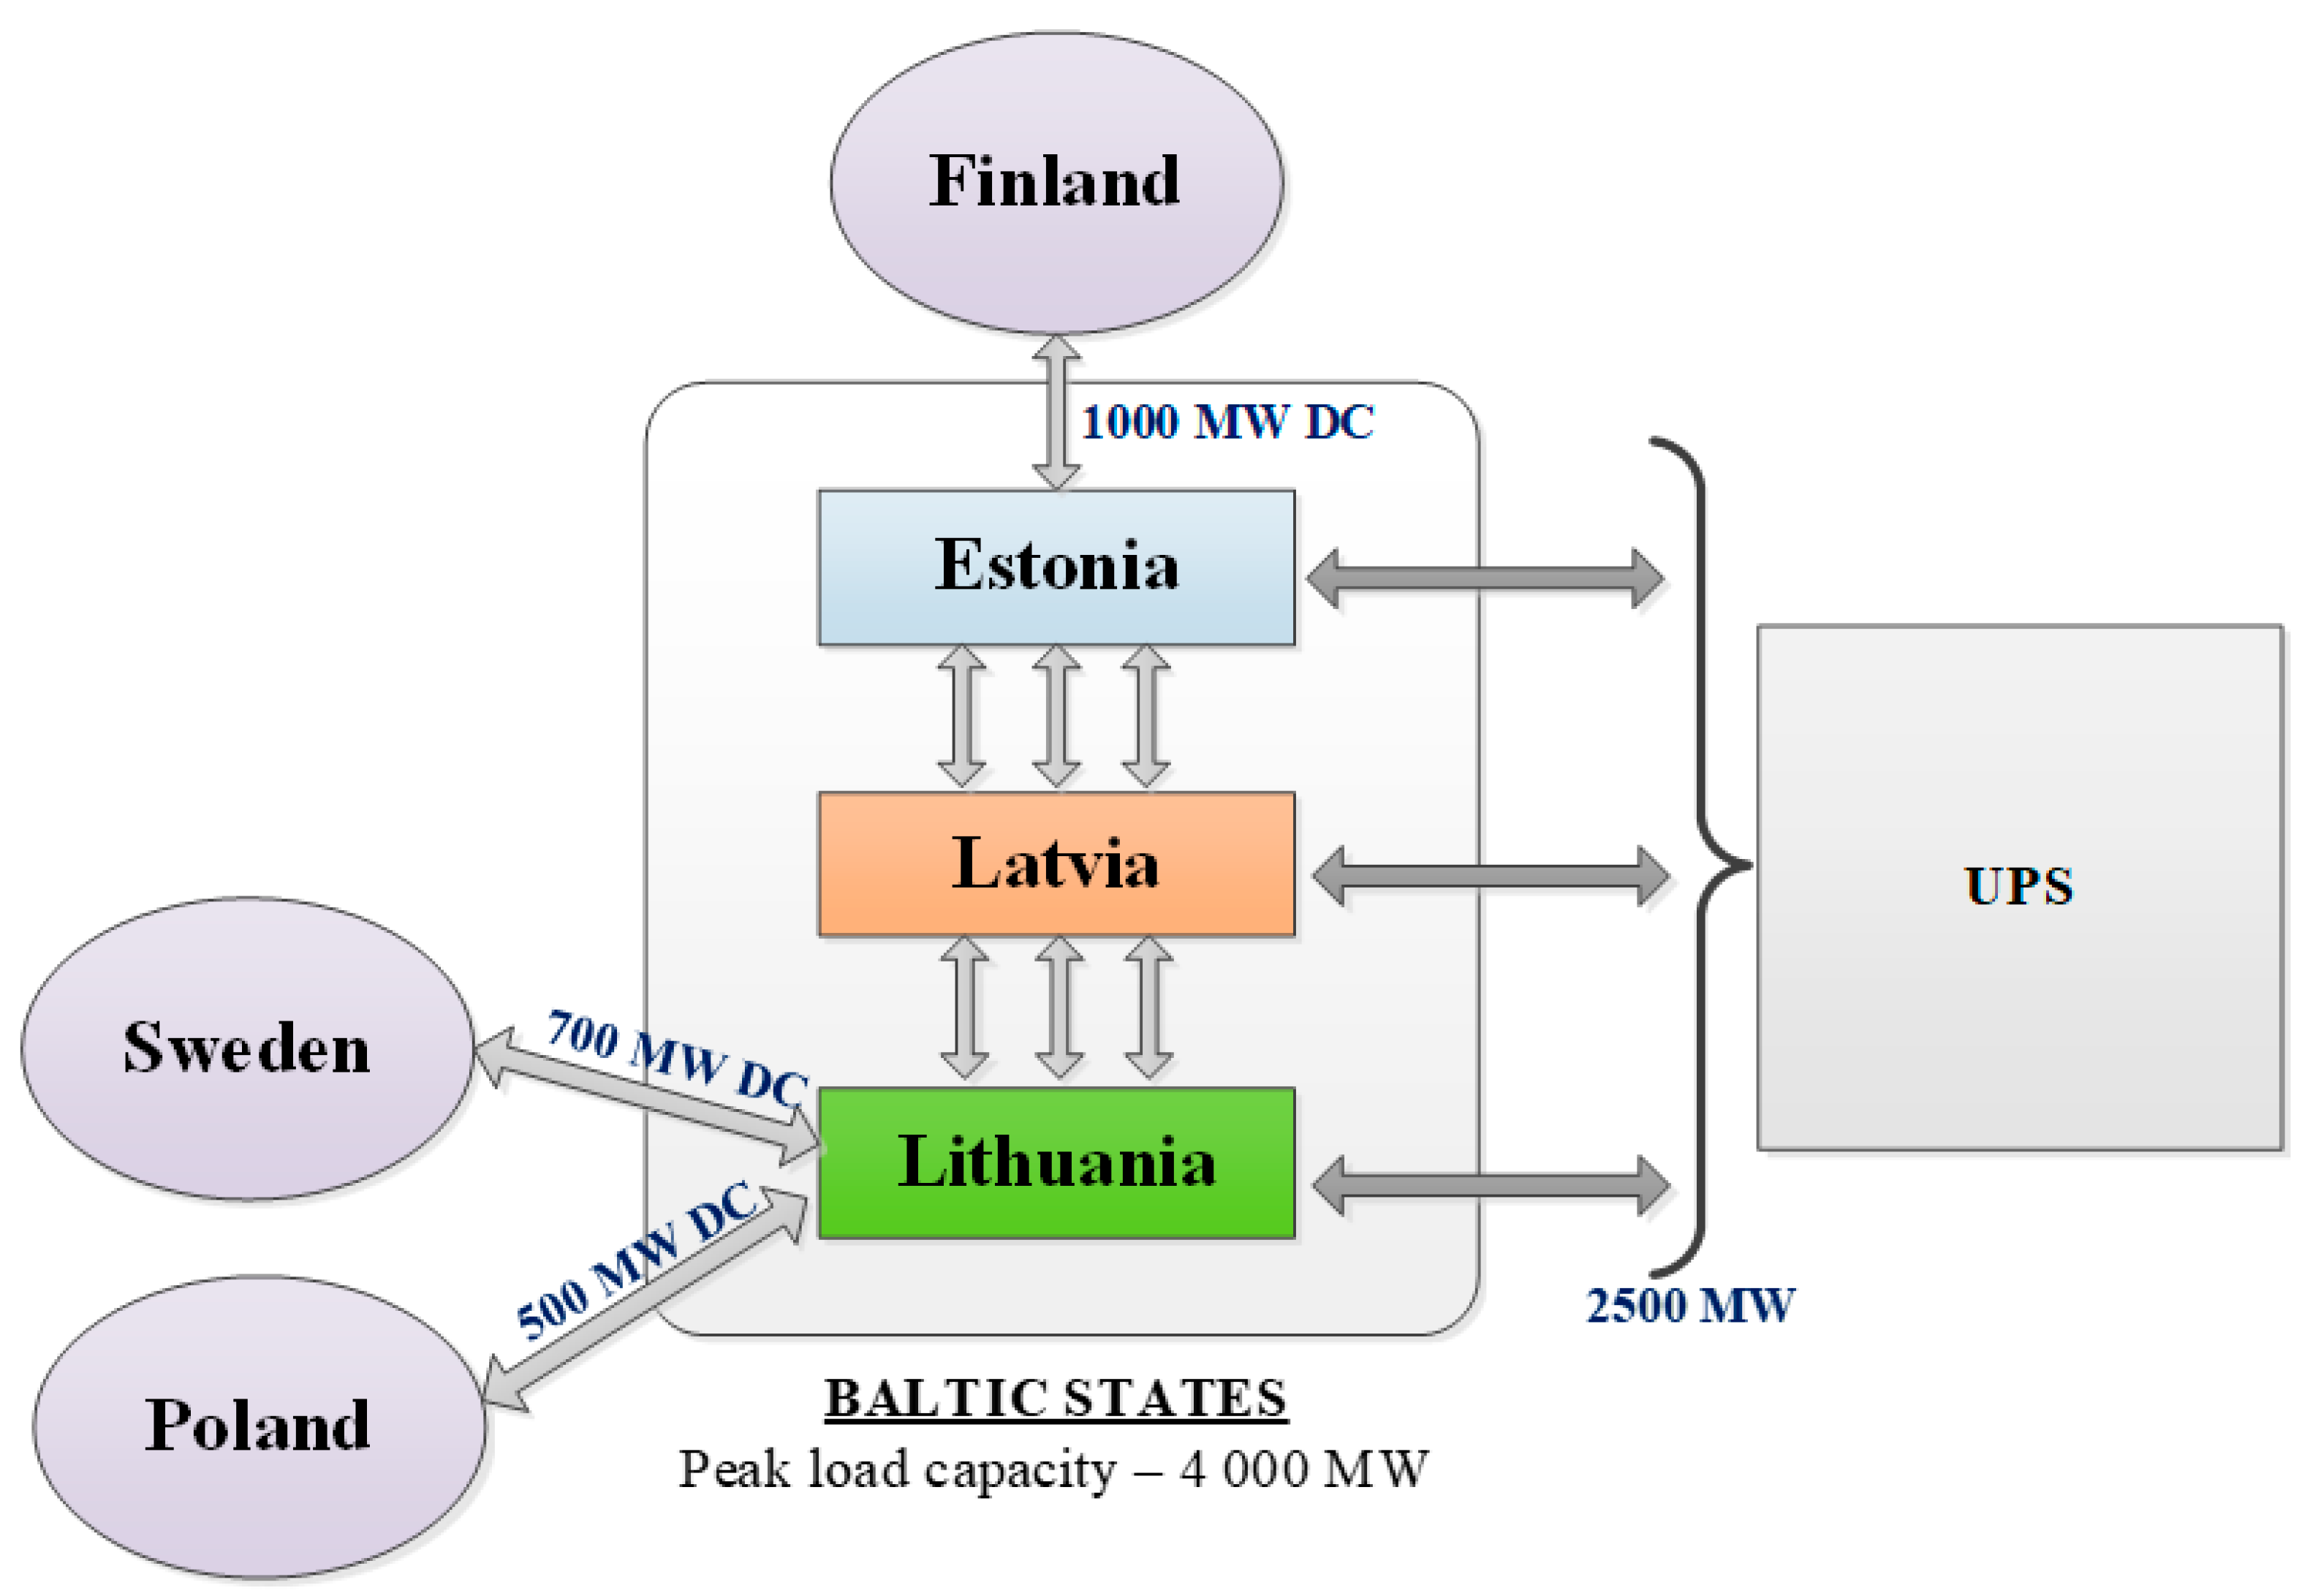
- European Commision. The Baltic Power System Between East and West Interconnections, JRC Science for Policy Report; European Commision: Brussels, Belgium, 2016. [Google Scholar]
- AS Augstsprieguma Tīkls; Latvian TSO; Riga, Latvia. Personal communication, 2020.
- NordPoolSpot. Available online: https://www.nordpoolgroup.com/ (accessed on 15 December 2020).
- European Commision. Energy Security: The Synchronisation of the Baltic States’ Electricity Networks—European Solidarity in Action; European Commision: Brussels, Belgium, 2019. [Google Scholar]
- Junghans, G.; Silis, A.; Marcina, K.; Ertmanis, K. Role of Balancing Markets in Dealing with Future Challenges of System Adequacy Caused by Energy Transmission. Latv. J. Phys. Tech. Sci. 2020, 57, 48–56. [Google Scholar] [CrossRef]
- Republic of Estonia. Estonia’s 2030 National Energy and Climate Plan; Republic of Estonia: Talin, Estonia, 2019.
- Republic of Latvia. Latvia’s National Eenergy and Climate Plan 2021–2030; Republic of Latvia: Riga, Latvia, 2020.
- Republic of Lithuania. National Eenergy and Climate Action Plan of the Republic of Lithuaniafor 2021–2030; Republic of Lithuania: Vilnius, Lithuania, 2021.
- Ivanova, P.; Sauhats, A.; Linkevics, O. Towards optimization of combined cycle power plants’ start-ups and shut-down. In Proceedings of the 2016 57th International Scientific Conference on Power and Electrical Engineering of Riga Technical University (RTUCON), Riga, Latvia, 13–14 October 2016; IEEE: Piscataway, NJ, USA, 2016; pp. 1–6. [Google Scholar]
- Payerl, C. Introduction to ABB Synchronous Condenser Offering—A Solution to Improve Grid Strength; IEEE: Piscataway, NJ, USA, 2020. [Google Scholar]
- Szaba, C. Synchronous condensers. An old tool rediscovered to address new grid challenges. Power Eng. Int. 2017, 11, 1782–1789. [Google Scholar]
- Terzija, V.V. Adaptive Underfrequency Load Shedding Based on the Magnitude of the Disturbance Estimation. IEEE Trans. Power Syst. 2006, 21, 1260–1266. [Google Scholar] [CrossRef]
- Anderson, P.M.; Mirheydar, M. An adaptive method for setting underfrequency load shedding relays. IEEE Trans. Power Syst. 1992, 7, 647–655. [Google Scholar] [CrossRef]
- Rudez, U.; Mihalic, R. Monitoring the First Frequency Derivative to Improve Adaptive Underfrequency Load-Shedding Schemes. IEEE Trans. Power Syst. 2011, 26, 839–846. [Google Scholar] [CrossRef]
- Laghari, J.A.; Mokhlis, H.; Karimi, M.; Abu Bakar, A.H.; Mohamad, H. A New Under-Frequency Load Shedding Technique Based on Combination of Fixed and Random Priority of Loads for Smart Grid Applications. IEEE Trans. Power Syst. 2014, 30, 2507–2515. [Google Scholar] [CrossRef]
- Deb, N.; Papari, B.; Ozkan, G.; Badr, P.R.; Hoang, P.H.; Edrington, C.S. An Intelligent Load Shedding Scheme for the Mi-cro-grid in Shipboard Power System Using Probabilistic Methods. In Proceedings of the 2020 Clemson University Power Systems Conference (PSC), Clemson, SC, USA, 10–13 March 2020. [Google Scholar]
- Rudez, U.; Mihalic, R. Analysis of Underfrequency Load Shedding Using a Frequency Gradient. IEEE Trans. Power Deliv. 2011, 26, 565–575. [Google Scholar] [CrossRef]
- Frigo, G.; Derviskadic, A.; Zuo, Y.; Paolone, M. PMU-Based ROCOF Measurements: Uncertainty Limits and Metrological Significance in Power System Applications. IEEE Trans. Instrum. Meas. 2019, 68, 3810–3822. [Google Scholar] [CrossRef] [Green Version]
- Guzs, D.; Utans, A.; Sauhats, A.; Junghans, G.; Silinevics, J. Resilience of the Baltic power system when operating in island mode. In Proceedings of the 2020 IEEE 61th International Scientific Conference on Power and Electrical Engineering of Riga Technical University (RTUCON), Riga, Latvia, 5–7 November 2020; Institute of Electrical and Electronics Engineers (IEEE): Piscataway, NJ, USA, 2020; pp. 1–6. [Google Scholar]
- Rubio, A.; Behrends, H.; Geißendörfer, S.; von Maydell, K.; Agert, C. Determination of the Required Power Response of Inverters to Provide Fast Frequency Support in Power Systems with Low Synchronous Inertia. Energies 2020, 13, 816. [Google Scholar] [CrossRef] [Green Version]
- Siemens Power Technologies Inc. PSS/E-34 Program Operational Manual; Siemens Power Technologies Inc.: New York, NY, USA, 2019. [Google Scholar]
- Operation Technology Inc. ETAP Products & Solutions Comprehensive, Integrated Suite of Power System Software Modules from Design to Operation; ETAP Electrical Power System Analysis Software; Operation Technology Inc.: Irvine, CA, USA, 1995. [Google Scholar]
- Sauhats, A.; Svalova, I.; Svalovs, A.; Antonovs, D.; Utans, A.; Bochkarjova, G. Two-terminal out-of-step protection for mul-ti-machine grids using synchronised measurement. In Proceedings of the 2015 IEEE Eindhoven PowerTech, Eindhoven, The Netherlands, 29 June–2 July 2015. [Google Scholar]
- Sauhats, A.; Utans, A.; Antonovs, D.; Svalovs, A. Angle Control-Based Multi-Terminal Out-of-Step Protection System. Energies 2017, 10, 308. [Google Scholar] [CrossRef] [Green Version]
- Palensky, P.; Dietrich, D. Demand Side Management: Demand Response, Intelligent Energy Systems, and Smart Loads. IEEE Trans. Ind. Inform. 2011, 7, 381–388. [Google Scholar] [CrossRef] [Green Version]
- Jabir, H.J.; Teh, J.; Ishak, D.; Abunima, H. Impacts of Demand-Side Management on Electrical Power Systems: A Review. Energies 2018, 11, 1050. [Google Scholar] [CrossRef] [Green Version]


| Scenario | ||||
|---|---|---|---|---|
| A | B | C | D | |
| Total generation before disruption | 2567 | 2548 | 2623 | 2686 |
| -of it renewable non-synchronous | 100 | 700 | 1500 | 2500 |
| Total load | 3700 | 3700 | 3700 | 3700 |
| Total import | 1700 | 1700 | 1600 | 1530 |
| Total export | 500 | 500 | 500 | 500 |
| Total post-contingency system inertia Htot_post | 29,779 | 36,739 | 24,768 | 18,091 |
| Gen. loss event | TEC2, 800 MW | HVDC, 700 MW | HVDC, 700 MW | HVDC, 700 MW |
| Load Shedding Step Number, n | ||||||
|---|---|---|---|---|---|---|
| 1 | 2 | 3 | 4 | 5 | 6 | |
| Freq. threshold, Hz | 48.8 | 48.6 | 48.4 | 48.2 | 48.0 | 47.8 |
| Pload_UFLS_n, % | 5.4 | 6.1 | 7.5 | 6.4 | 5.4 | 4.4 |
| Scenario | ||||
|---|---|---|---|---|
| A | B | C | D | |
| ΔPSC, MW | 420 | 438 | 475 | 666 |
| Pload_UFLS, MW | 200 | 0 | 425.5 | 703 |
| Pload_UFLS, % of total load | 5.4 | 0 | 11.5 | 19 |
| Pload_novel_LS, MW | 200 | 200 | 425.5 | 703 |
| Frequency nadir when UFLS does not activate (scenario B), Hz | - | 48.81 | - | - |
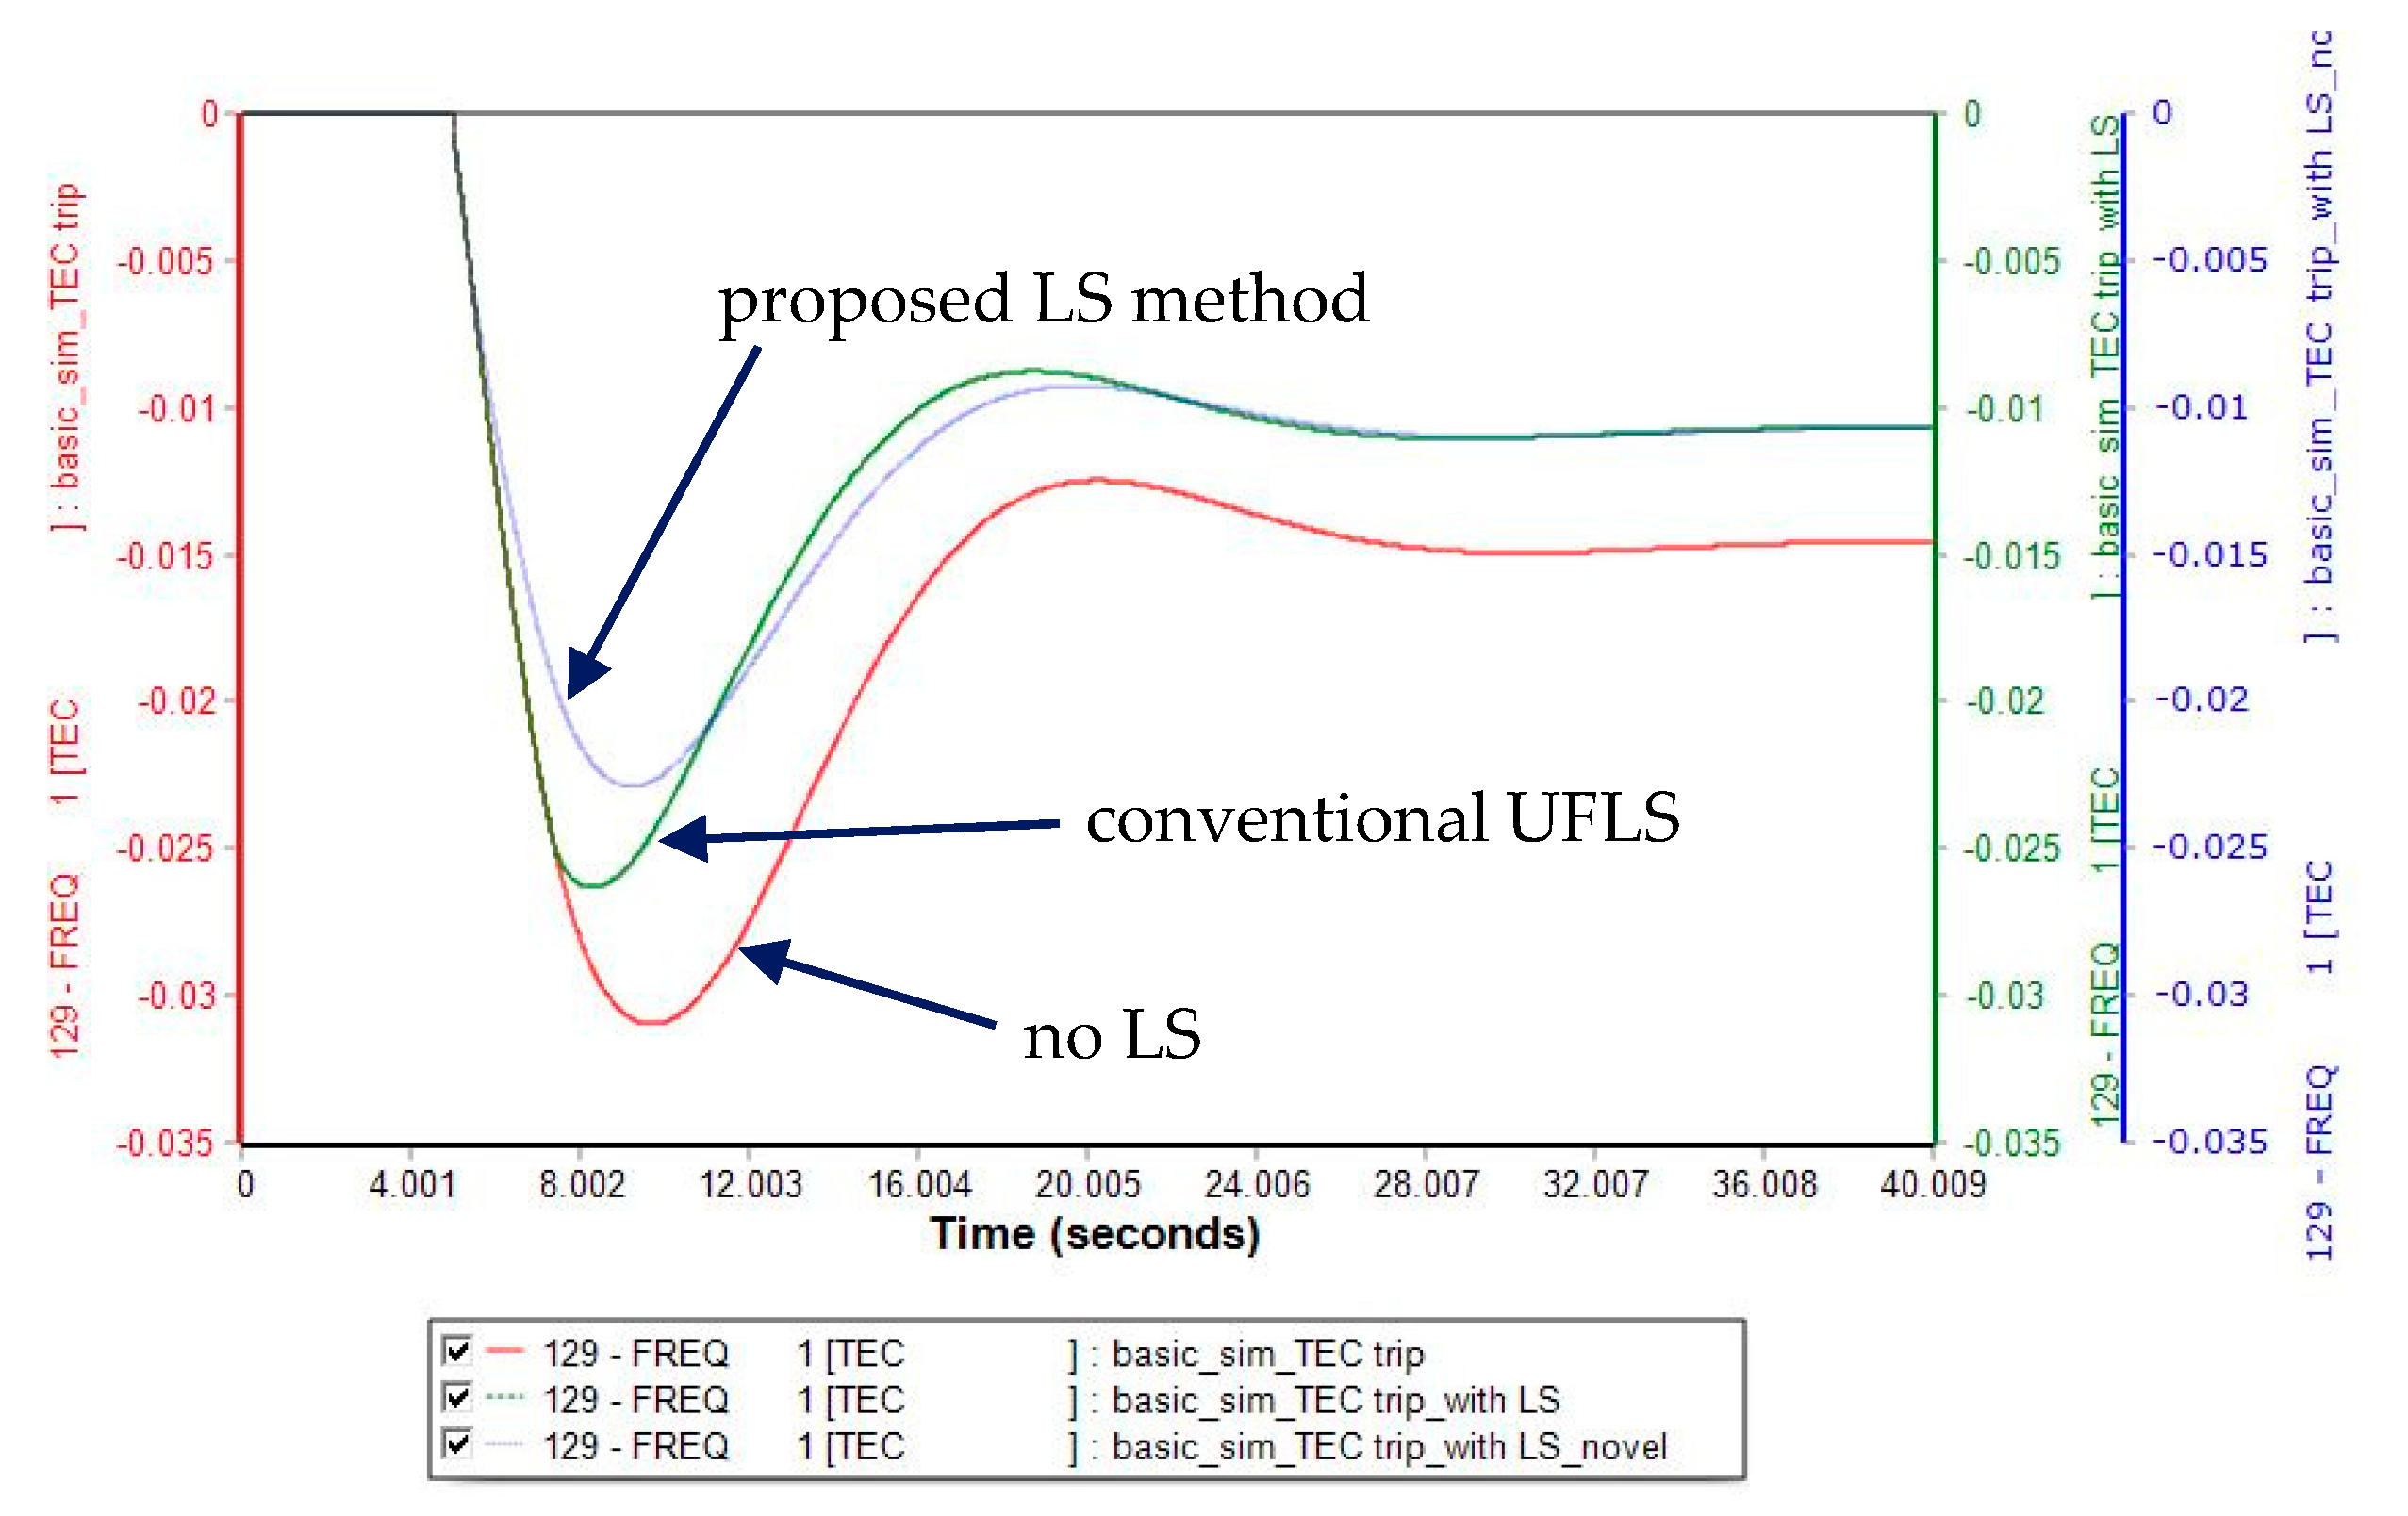
| Frequency nadir conventional UFLS, Hz | 48.7 | - | 48.6 | 48.3 |
| Frequency nadir novel LS method, Hz | 48.85 | 49.1 | 49.15 | 49.6 |
| Scenario | CHP2 | HPP | EE | LT | WTG2 | WTG4 | WTG6 | WTG10 | Gen. Loss Event | Total System Inertia |
|---|---|---|---|---|---|---|---|---|---|---|
| A | 800 | 220 | 670 | 380 | 128 | 40 | 120 | x | EE | 15,760 |
| B | x | 800 | 990 | 400 | 128 | 40 | 120 | x | HPP | 12,150 |
| C | 800 | x | 50 | 350 | 128 | 40 | 120 | 640 | CHP2 | 5790 |
| D | 800 | x | 50 | 350 | 128 | 40 | 120 | 640 | CHP2 | 12,148 |
| Load Shedding Step Number, n | ||||||
|---|---|---|---|---|---|---|
| 1 | 2 | 3 | 4 | 5 | 6 | |
| Freq. threshold, Hz | 49.0 | 48.8 | 48.6 | 48.4 | 48.2 | 48.0 |
| Pload_UFLS_n, % | 5 | 5 | 10 | 10 | 10 | 10 |
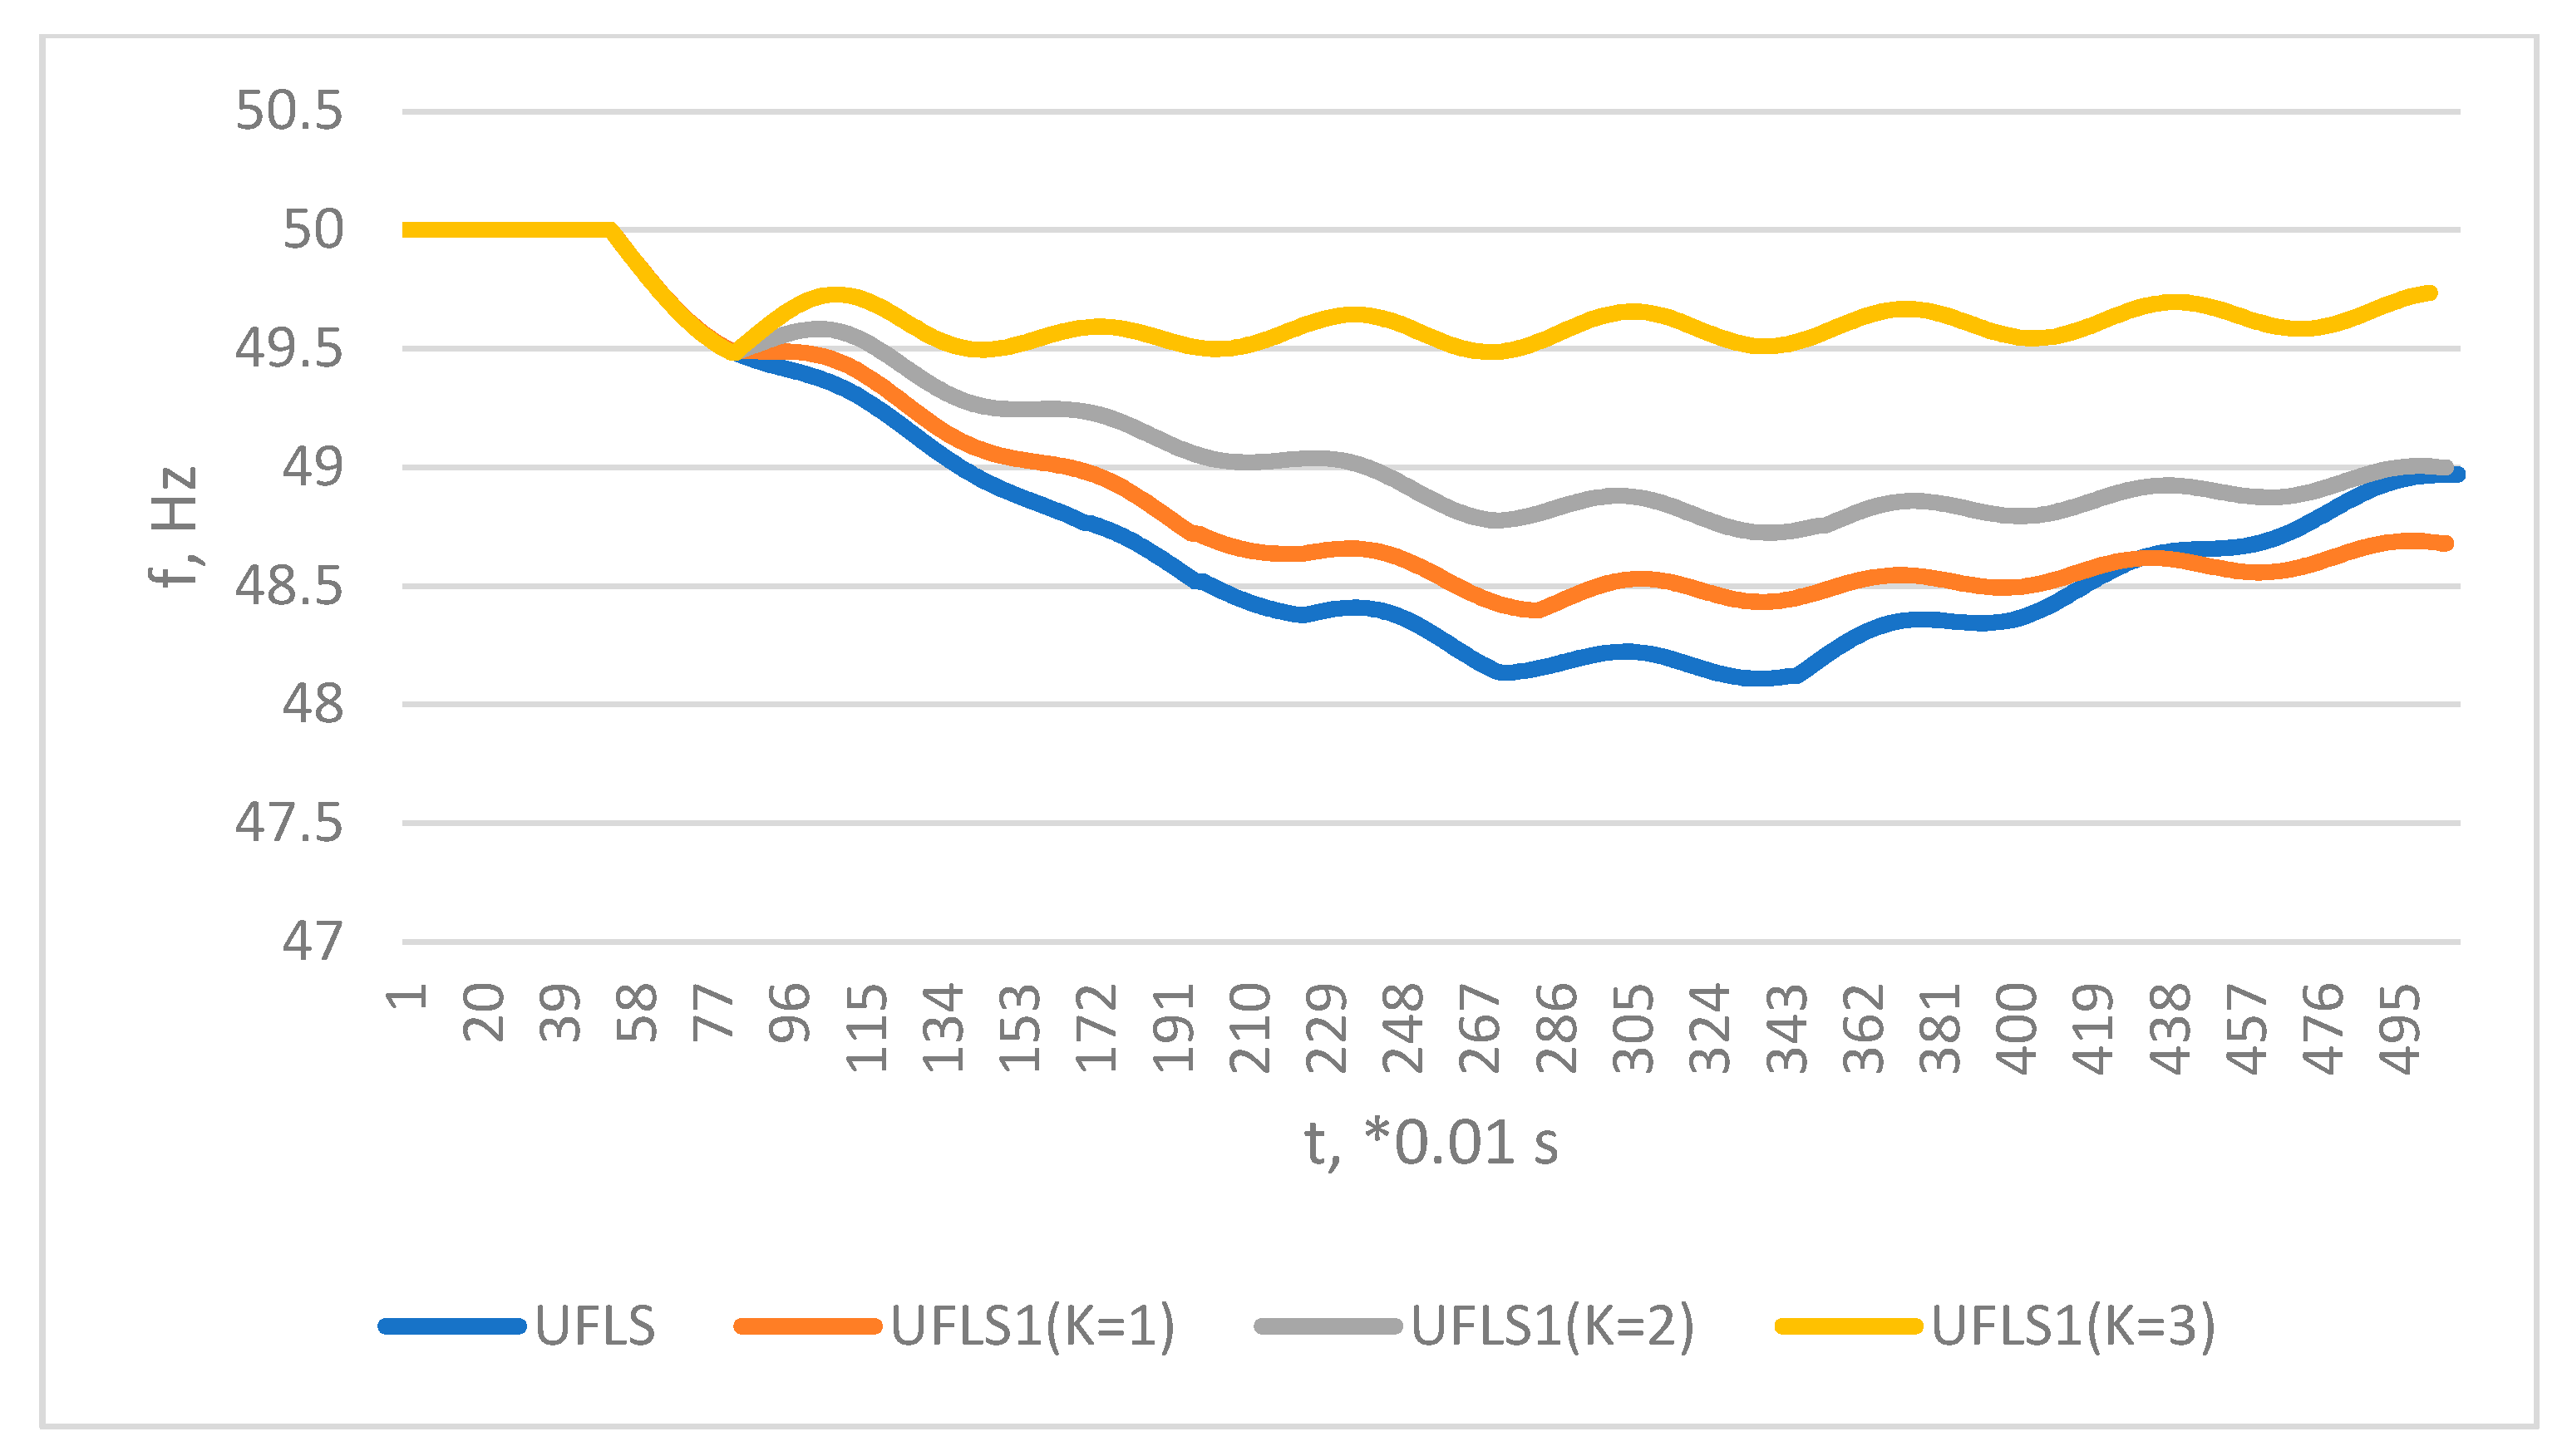
| Scenario | ∆Pgen_loss, MW | ∆Pload_UFLS, MW | Conventional UFLS fmin, Hz | ∆PSC, MW | Novel Approach LS with K = 1 + Additional Load Shed by Conv. UFLS | Novel Approach LS with K = 2 + Additional Load Shed by Conv. UFLS | Novel Approach LS with K = 3 + Additional Load Shed by Conv. UFLS | |||
|---|---|---|---|---|---|---|---|---|---|---|
| fmin, Hz | Add. Conv. UFLS, MW | fmin, Hz | Add. Conv. UFLS, MW | fmin, Hz | Add. Conv. UFLS, MW | |||||
| A | 670 | 120 | 48.9 | 150 | 49.06 | - | N/A | - | N/A | - |
| B | 800 | 960 | 48.1 | 280 | 48.4 | 480 | 48.72 | 240 | 49.48 | - |
| C | 800 | 720 | 48.29 | 800 | 49.4 | - | N/A | - | N/A | - |
| D | 800 | 480 | 48.45 | 330 | 48.9 | 120 | N/A | - | N/A | - |
Publisher’s Note: MDPI stays neutral with regard to jurisdictional claims in published maps and institutional affiliations. |
© 2021 by the authors. Licensee MDPI, Basel, Switzerland. This article is an open access article distributed under the terms and conditions of the Creative Commons Attribution (CC BY) license (http://creativecommons.org/licenses/by/4.0/).
Share and Cite
Sauhats, A.; Utans, A.; Silinevics, J.; Junghans, G.; Guzs, D. Enhancing Power System Frequency with a Novel Load Shedding Method Including Monitoring of Synchronous Condensers’ Power Injections. Energies 2021, 14, 1490. https://doi.org/10.3390/en14051490
Sauhats A, Utans A, Silinevics J, Junghans G, Guzs D. Enhancing Power System Frequency with a Novel Load Shedding Method Including Monitoring of Synchronous Condensers’ Power Injections. Energies. 2021; 14(5):1490. https://doi.org/10.3390/en14051490
Chicago/Turabian StyleSauhats, Antans, Andrejs Utans, Jurijs Silinevics, Gatis Junghans, and Dmitrijs Guzs. 2021. "Enhancing Power System Frequency with a Novel Load Shedding Method Including Monitoring of Synchronous Condensers’ Power Injections" Energies 14, no. 5: 1490. https://doi.org/10.3390/en14051490