1. Introduction
The concept of Living Lab (LL) started emerging at the beginning of 2000 [
1], and the initial focus was to test new technologies within home-like constructed environments. The concept has grown since then, and nowadays, one precondition of LL activities is their location in a real-world context. Throughout the concept design, an LL has been defined as a methodology [
2], as an environment [
3,
4], and as a system [
5]. These three different definitions may act more as complementary rather than contradictory aspects. Depending on the perspective taken, certain issues come into focus. From the “methodology” viewpoint, processes such as methods for user involvement and data transfers come to the forefront. From the “environment” viewpoint, objects such as user communities and technological platforms are highlighted. The “system” viewpoint focuses on the connection between LL as an entire entity and its individual parts.
LLs have attracted interest recently and have addressed a number of societal and innovative issues including food consumption, health, energy use, crime, urban planning and others. Indicatively, a LL that tested the impacts of different office environmental conditions (thermal, acoustic, lighting) on people’s workday satisfaction was presented in Jamrozik et al. [
6]. A Sustainable LL in Germany was presented in Alexandrakis [
7], focusing on the integration of Urban Design Thinking, to achieve urban sustainability transitions. The Agile Space LL in Scotland was presented in Vidmar [
8], preparing for the expansion of the ‘New Space’ Industry in the area, i.e., the development of smaller space-related products in various services. Noublanche et al. [
9] presented the ALLEGRO LL, which was a hospital-based LL in France aiming at promoting open gerontechnology innovation techniques in hospitals through tests by elderly people. Of particular interest are LLs within the energy sector. Indicative examples of energy-related LLs are the Apollon LL, consisting of 30 organizations from 12 different countries, focusing on energy consumption with the use of ICT tools such as smart meters, to affect behavioral change [
3], and the GRASPINNO project, mainly focusing on supporting small and medium-sized enterprises to enter the green energy sector [
10,
11]. Similarly, the H2020 ENERGISE project was performed in 8 different countries, aiming at reducing household energy use and, more specifically, at lowering indoor temperatures and reducing laundry cycles [
12].
Energy-related LLs have been also employed in the “STEP-IN—Using Living Labs to roll out Sustainable Strategies for Energy Poor Individuals” project, which is funded by the EU Horizon 2020 research program. The project was designed to provide low-cost methods to energy vulnerable households in order to tackle energy poverty issues, primarily by reducing energy consumption and by improving energy efficiency. In order for STEP-IN to achieve this, three different LLs were launched in three challenging locations with different characteristics across Europe, including an urban area in the United Kingdom, a rural area in Hungary, and a mountainous area in Greece, which is analyzed in this paper. The three LLs of the STEP-IN project took place in real-life conditions, intending to bring together energy vulnerable households, academic experts, and local/national stakeholders.
As regards the research object, energy poverty refers to the general difficulty/inability of households to meet their domestic energy needs at an affordable cost, which is a phenomenon that has evolved into a crucial social–economic problem within Europe over the last few decades. Overall, taking into account the multidimensional nature of the problem, various definitions and measurement methods have been suggested over time, which are focused on different base parameters/conditions. Some of these are, indicatively, adequate warmth at home [
13,
14]; adequate meeting of all domestic energy needs [
15,
16,
17]; excessive energy cost, e.g., the 2M indicator [
18]; excessive energy cost in relation to household income, e.g., the 10% indicator [
19] and the “Stochastic Model of Energy Poverty” (SMEP) indicator [
20]; low household income, e.g., the M/2 indicator [
18] and the “Minimum Income Standard” (MIS) [
21,
22,
23,
24]; poverty combined with high energy cost, e.g., the “Low Income High Cost” (LIHC) indicator [
19]; compression of energy needs [
25]; qualitative aspects of the problem, i.e., inability to keep home adequately warm, damp/mold problems, arrears on energy bills, e.g., [
26,
27,
28,
29,
30]; composite indicators, e.g., [
31,
32] and many others. Apart from targeted-to-indicators approaches, some studies attempt to capture a holistic picture of the problem by integrating micro- and macro-drivers, e.g., [
33] and others address the wider notion of energy vulnerability and deprivation, e.g., [
34,
35,
36,
37,
38,
39]. In any case, and whatever the indicator chosen to approach energy poverty, it is generally agreed that the problem mainly arises as a combination of three drivers: low income, high energy cost, and low energy efficiency of the house [
40,
41,
42,
43].
The problem of energy poverty in Greece has become a crucial issue especially since 2009 due to the outbreak of an economic crisis in the country. Furthermore, research has shown that mountainous areas in Greece are more vulnerable to energy poverty compared to lowlands due to certain special features: (a) colder climatic conditions and higher heating degree-days, thus higher thermal energy needs; (b) higher fuel costs due to remoteness; (c) lower incomes due to the low productivity base; and (d) higher energy losses due to the typically old building stock. For instance, it has been shown that thermal energy needs at 1000 m are 170% higher versus the sea-level in Greece, fuel prices at isolated mountainous areas are 5–7% higher versus the country level [
44], the average income of the Greek mountainous population is 15% lower versus the country level [
45,
46], and the majority of mountain residences (57%) have been built before the year that the first Thermal Insulation Regulation was applied in Greece (1979), thus presenting significantly high thermal losses.
Apparently, the peculiarities of Greek mountainous regions in terms of energy issues create unique challenges for experiencing a Mountainous LL in Greece. In particular, the Mountainous LL, operated by the National Technical University of Athens (NTUA) in cooperation with the Municipality of Metsovo, has taken place in Metsovo, a typical mountainous town of the country located in the Northern mountainous Pindos range at an altitude of 1100 m. The settlement is part of the municipality, along with other local communities. The Municipality of Metsovo occupies a geographical area of 363.34 km
2, with Metsovo covering the largest part of it (102.08 km
2). According to the last census, the population of Metsovo is 2503 people, or else 888 households [
47]. The main climatic characteristics of Metsovo are low temperatures and high precipitation. Historically, based on the last 10 years’ data, the average annual temperature ranges between 9.2 and 10.2 °C, the average annual maximum temperature is between 13.5 °C and 14.5 °C and the average annual minimum temperature is between 5.5 °C and 6.5 °C. Due to the cold climate, heating degree-days of the area are significantly high, ranging between 2270 °C days and 3190 °C days, implying the high energy demand of buildings. Remarkably, heating degree days in Metsovo are 50% higher compared to the nearby city of Ioannina, which is located at a distance of only 50 km from Metsovo and 200% higher compared to the city of Athens, the Greek capital.
The area has presented increasing rates of energy-vulnerable households in recent years. Previous surveys conducted by NTUA revealed that certain groups in the area have been especially vulnerable to energy poverty, i.e., elderly households, households living in old dwellings, low-income households, and households with inefficient heating systems such as old wood stoves, open fireplaces, and poorly—or never—maintained central heating systems, e.g., [
46,
48].
The above-mentioned vulnerability issues within mountainous areas need to be further explored. The present study aims to contribute to the body of knowledge of energy vulnerability in Greek mountainous areas through the operation of a LL, for the first time in Greece, to the best of the authors’ knowledge. The whole experience gained from the Mountainous LL implementation is presented in detail, to explore whether and how the suggested methodology—including tools, processes, and actions—may help toward tackling energy vulnerability in the study area. The study is based on a holistic approach, which is divided into two main parts: (a) the practical implementation, including numerous activities, such as six (6) questionnaire surveys, Energy Advisors visits, monitoring equipment, etc., and (b) the processing part. The whole methodological approach is described in
Section 2, the results are presented and discussed in
Section 3, and the Conclusions, along with lessons learned from the whole experience, are provided in
Section 4.
2. Materials and Methods
Based on the methodology developed in the STEP-IN project, a basic set-up process was followed by the Mountainous LL, including several activities, as presented below (by order of occurrence):
Conduction of information campaigns
Benchmarking
Home Energy Advisors training
Organization of Energy Cafés
Recruitment of LL participants
Market segmentation
Home visits from the Energy Advisors
Installation of monitoring equipment (electricity consumption meters; temperature and humidity monitors)
Operation of an Information Centre
ICT tools
Evaluation of impacts.
In more detail, the information campaign aimed at motivating citizens of the local community to actively participate in the project. Leaflets were shared and were available at specific locations, along with announcements on Facebook and informative posters, which were targeted to further increase awareness of local people about the LL. The benchmarking step aimed at gaining a deep understanding of the energy vulnerability problem in the study area, prior to setting up the LL, through the conduction of a primary social survey, along with the use of existing data (last census, reports and scientific papers). The Mountainous LL employed three Home Energy Advisors who were responsible for (a) collecting households’ data via questionnaire-based surveys, (b) installing monitoring equipment in selected houses, (c) inspecting heating systems, and (d) providing specific-household energy advice. During the LL operation, ICT tools were also used to collect data, often via the home Energy Advisors. Energy Cafés, i.e., interactive meetings between citizens, experts, policymakers, representatives of the local authorities and the local trade stakeholders, were a core part of the overall methodology, allowing the local people to discuss and receive advice from all involved parties. In total, three Energy Cafés took place, during which various issues were discussed, such as understanding of electricity bills, low-cost methods for lowering thermal energy expenses, etc. During the operation of the LL, an information center was also set up for providing information to citizens on energy-related issues.
The Mountainous LL consisted of three different and independent rounds, with 150 households participating in total; each round included 50 households. The first round took place from March 2019 to August 2019, the second one was from November 2019 to May 2020, and the third one was from July 2020 to December 2020. In the first and the second round, monitoring equipment was installed in 30 out of 50 households, including the following:
Indoor temperature and humidity meters (meteorological monitors) with external sensors, located in three different rooms.
Electricity consumption meters, measuring in real time the electricity consumption of households.
The monitoring equipment allowed recording of the above parameters (i.e., electricity consumption, temperature, and humidity) in the form of actual time-series data.
As a result, households were divided into two groups; the first with monitoring equipment installed, along with the Energy Advisors’ visits and advice and the second with no monitoring equipment installed but with Energy Advisors’ visits and advice.
It is noted that no installation of monitoring equipment was implemented in the third round of the LL, due to the restrictive measures of the COVID-19 pandemic crisis in the country.
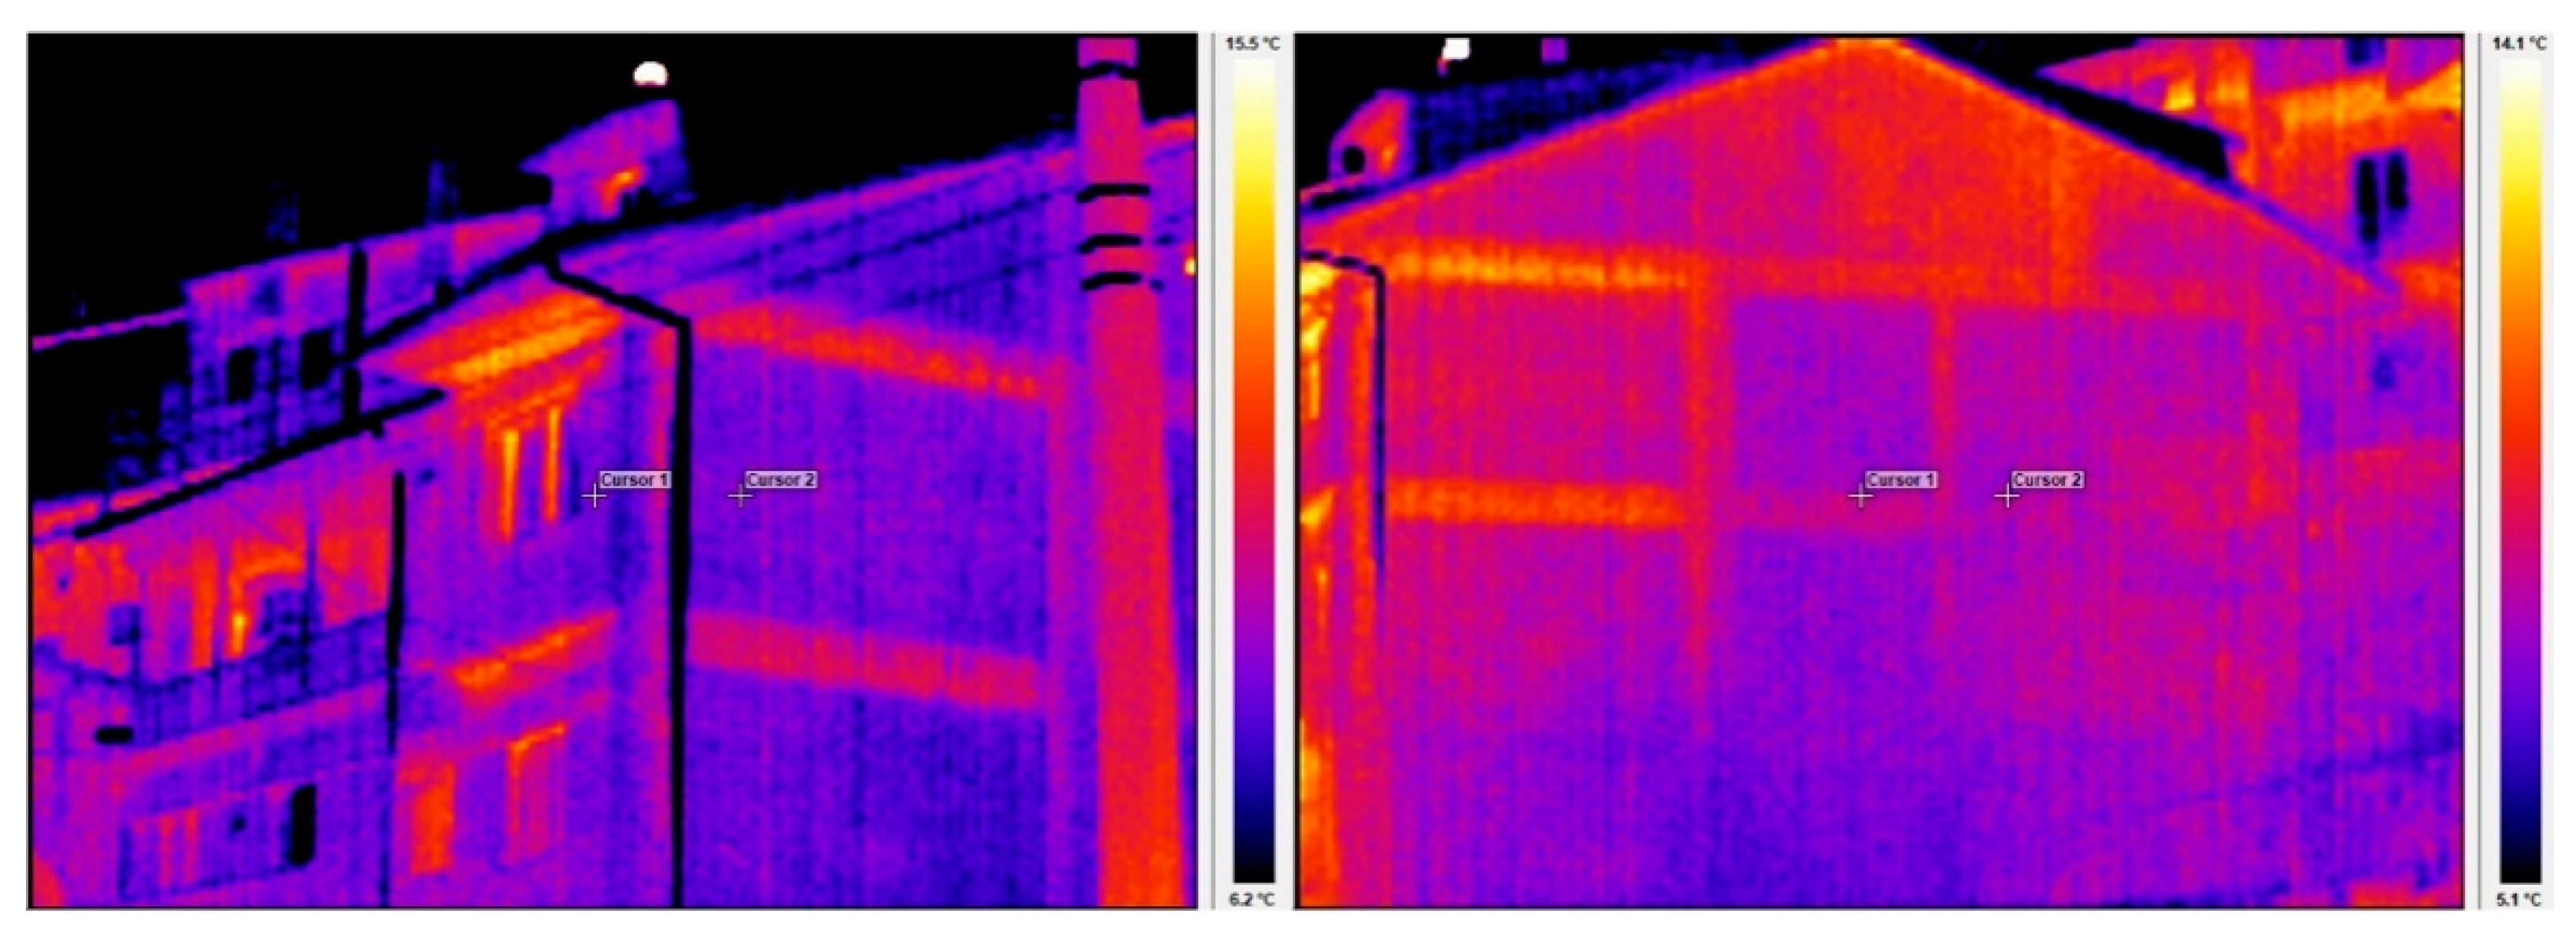
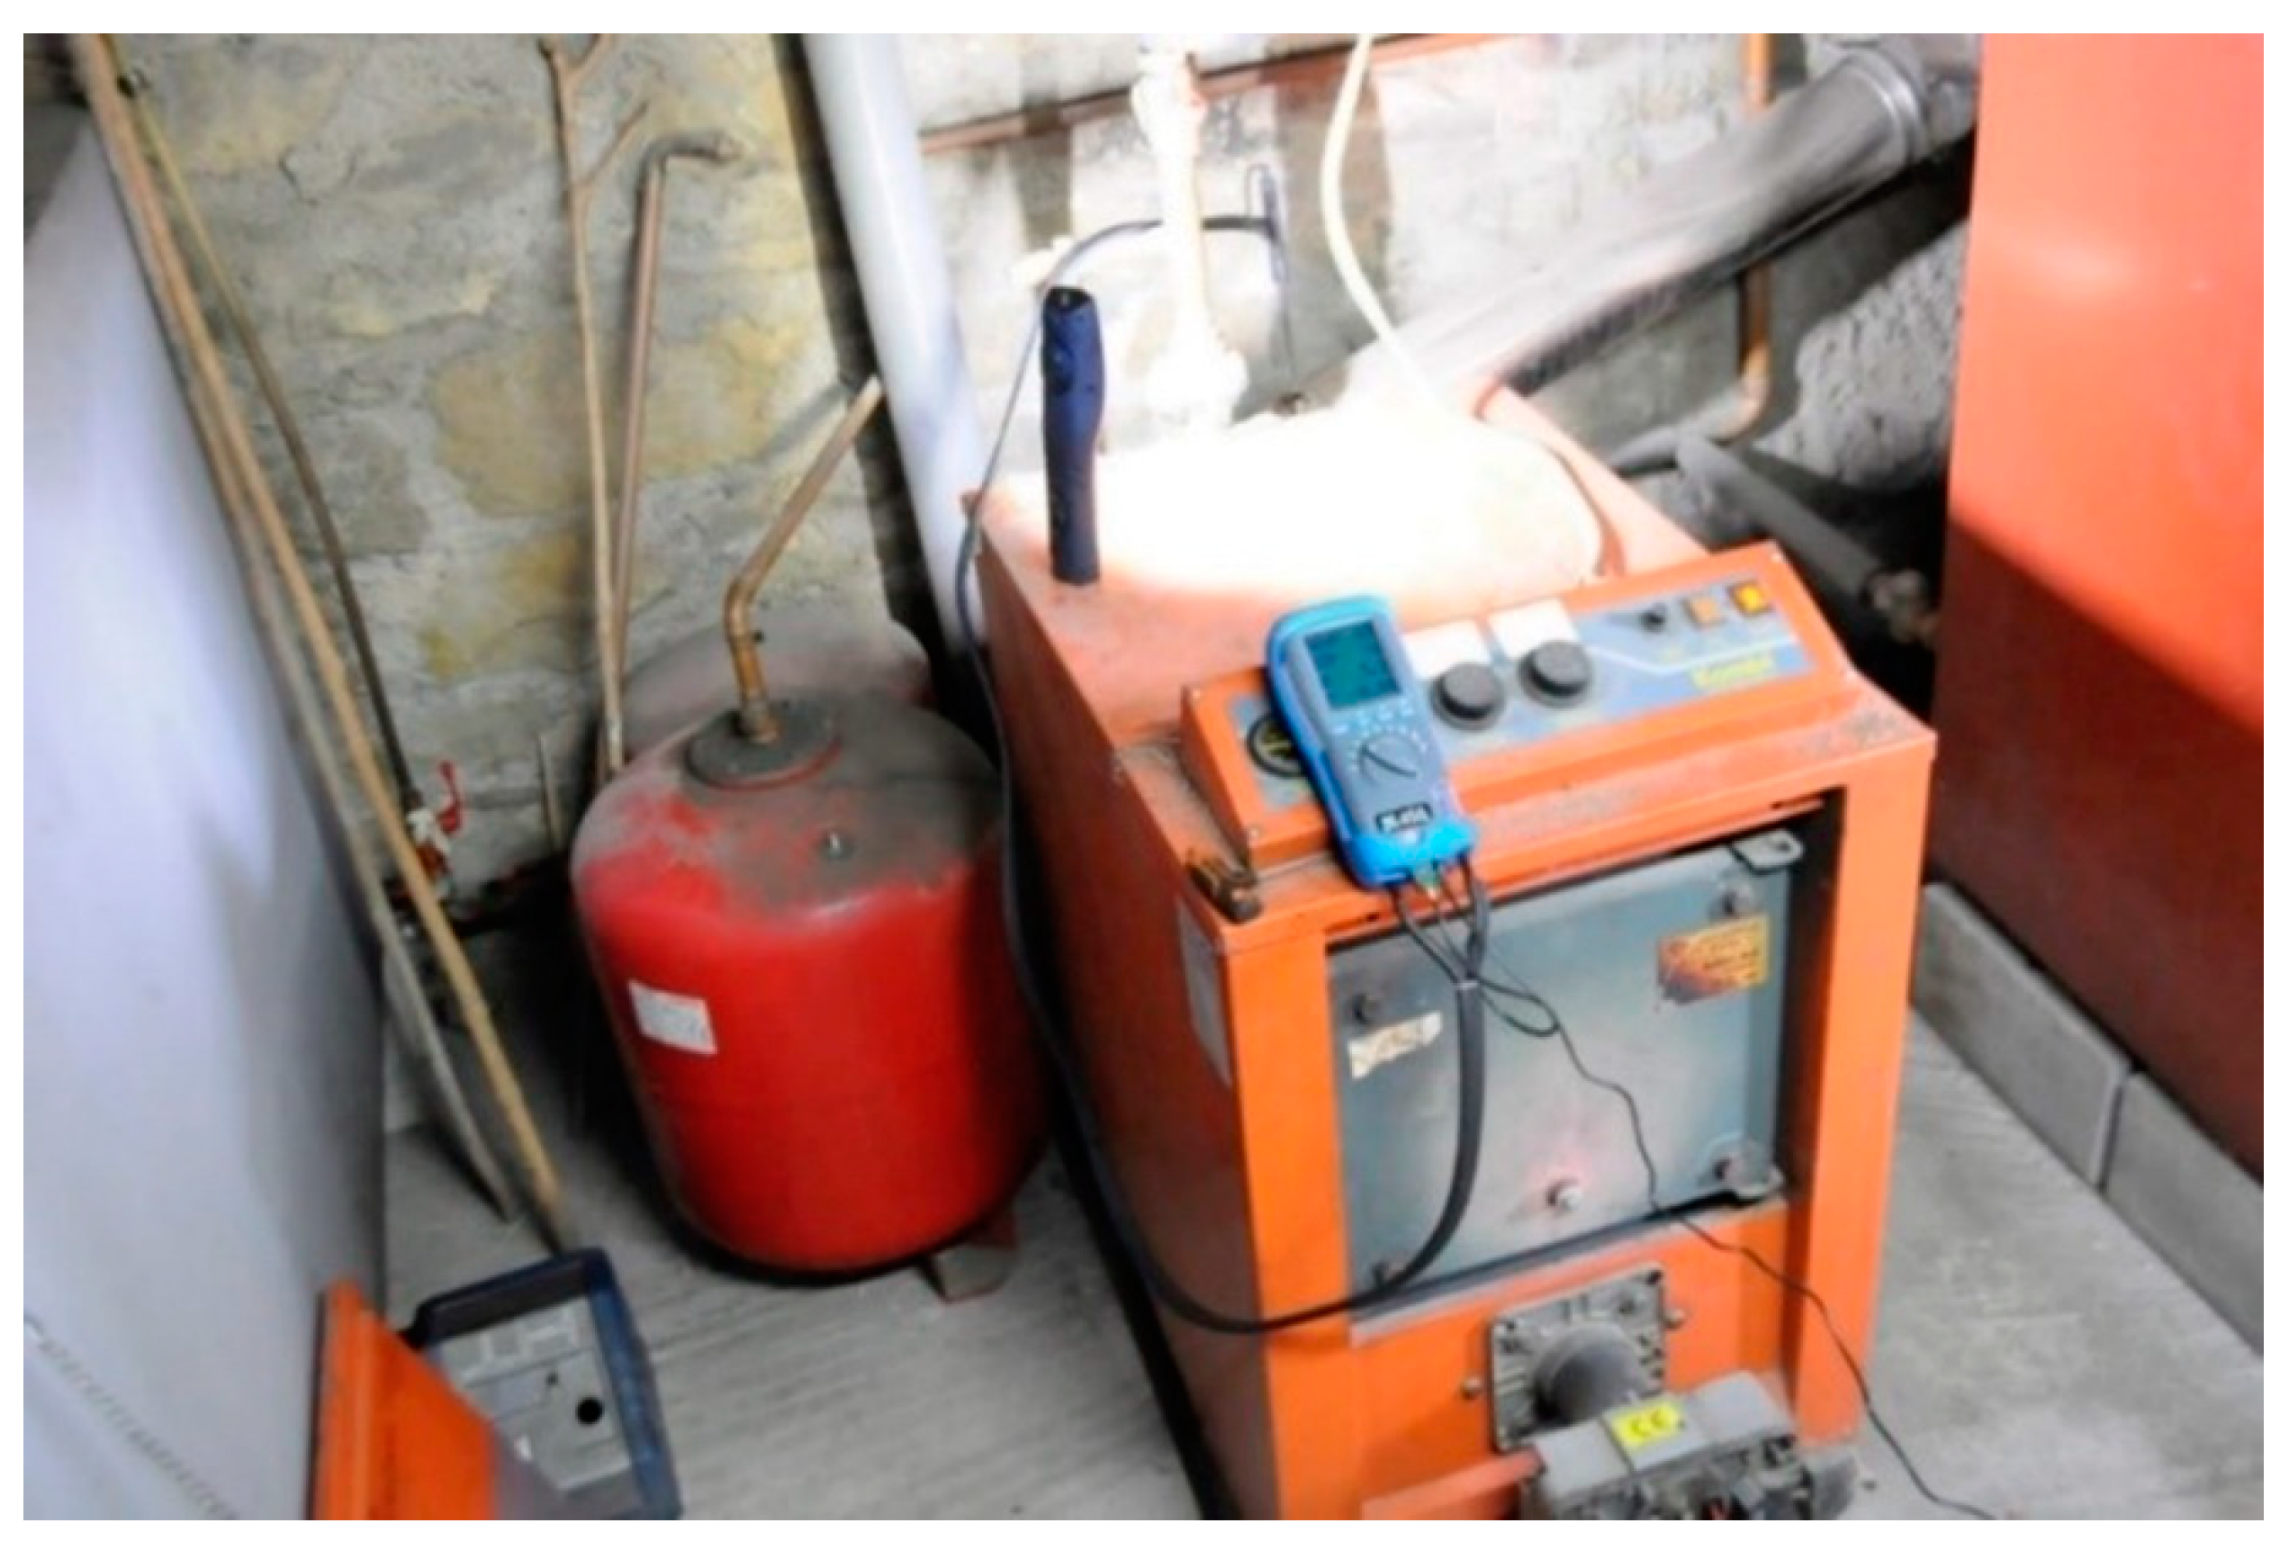
Energy Advisors visited households more than three times per round in order to collect information through questionnaires, which included a wide range of issues, i.e., housing and living conditions, heating systems, housing infrastructure, subjective perceptions of thermal comfort and quality of life, quantitative data about energy expenses, socio-demographic data, etc. These kinds of data are necessary for calculating the heating energy needs and consumption of each household and evaluating the impacts of the project. In some cases, Energy Advisors used a thermal imaging camera to detect “weak” areas of the building shell (badly insulated walls, thermal bridges, etc.) (
Figure 1) and an exhaust-gas analyzer to measure exhaust gases’ characteristics from the heating systems (
Figure 2).
The time-series data obtained by the monitoring equipment were appropriately processed by the Energy Advisors to draw conclusions about the houses’ energy efficiency and households’ behavioral patterns. Then, the outcomes were used by them in order to provide household-specific instructions on energy conservation practices and possible energy efficiency measures, by creating a unique, detailed leaflet. This leaflet provided tailor-cut information on each household’s heating and electricity consumption along with “personalized” advice on ways to reduce energy costs. Each suggested intervention was briefly described, including an assessment of the investment cost and the annual savings.
The rest households (i.e., those with no metering equipment installed) were also given a common and general bunch of energy interventions, including information on possible investment costs and annual savings.
The last visit of the Energy Advisors aimed at the final evaluation of the project, during which several impacts were monitored, i.e., energy consumption, thermal comfort, adoption of energy measures or advice by households, participants’ assessment about the usefulness of the project in terms of improvement in their everyday lives, etc.
Once all activities of the LL were complete, various statistical analyses were performed. For statistical analysis purposes, univariate and bivariate methods were employed, and various statistical tests were used in order to determine empirical relationships between critical variables. All statistical analyses were performed using a 95% confidence interval and 5% significance level.
3. Results and Discussion
The analysis of the results is presented in three distinct levels:
Initial assessment, which includes analysis of the basic information gathered by the Energy Advisors through questionnaires, during their first—one or two—visits, regarding housing features, heating system characteristics, heating and electricity costs, etc.
Monitoring assessment, which includes calculations performed based on the results of the monitoring equipment (data on electricity consumption, temperature, humidity).
Evaluation assessment, which includes information gathered by the Energy Advisors through questionnaires during their last visit, aiming to capture quantitative and qualitative impacts of the mountainous Living Lab on households, in terms of improvement in their quality of life, reduction in energy costs, etc.
3.1. Initial Assessment
3.1.1. Housing Characteristics
As far as housing characteristics are concerned, the research includes 150 houses, 17% of which are detached houses, 8% are maisonettes, and 75% are apartments. Regarding the age of houses, 45% were built before 1979, the year that the first Thermal Insulation Regulation was applied in Greece, 51% were built between 1980 and 2000, and only 4% are newly built, after 2000. The majority of the respondents (60%) live in houses of about 70–110 m2, while smaller portions live in smaller or bigger houses (13% and 27%, respectively).
As regards residences’ energy efficiency, only half of the houses have insulated external walls (51%) or insulated roof (53%), which is related to the old building stock of the area. Moreover, there is a significant portion (38%) with single-pane windows, which negatively affects thermal comfort inside the house as well as energy costs. Consequently, local properties present increased thermal losses.
3.1.2. Heating and Electricity Characteristics
About 86% of households stated that the total area of their house is heated, while 15% claimed that they cannot afford to heat the whole house, with 10% heating less than 80% of it. As regards the primary heating system, the majority (80%) uses central heating systems. The main fuel used in central heating systems is diesel oil (about 51%), followed by firewood (23%), pellet (3%), and LPG (2%). The rest of the houses mainly use firewood stoves (10%), energy fireplaces (4%), and heat accumulators (2%). Moreover, about 40% of households use a secondary heating system as well in order to manage to meet—at least to a degree—energy needs.
Regarding the electricity sector, about 21% of households reported using special electricity schemes/special invoices to enjoy lower electricity prices. More specifically, 6% have the “Social Residential Tariff” and benefit from a discount on the competitive electricity charge and 15% use the “Residential Night Tariff”, i.e., a tariff that includes two distinct charging prices for the different periods of the day (reduced price within the off-peak period). With respect to lighting, less than 8% of households use old-type bulbs. The vast majority uses Light-Emitting Diode (LED) bulbs and Compact Fluorescent Lamps (CFLs).
3.1.3. Energy-Related Behavioral Aspects
Regarding energy-related behavioral parameters, the majority of households (80%) use the heating system more than 8 h per day, 10% use it 6–8 h per day, 8% use it 4–6 h per day, and only 2% use it less than 4 h per day. Among those who have thermostats (either analogue or digital, although digital thermostats are rare), 7% reported that they set the thermostat below 18 °C, 38% said that the thermostat is set between 18 and 20 °C, and the rest (i.e., 55%) claimed that they set the thermostat to over 20 °C.
As regards the stated temperature inside the home, most households stated that the average temperature during the winter period ranges between 18 and 20 °C, while around 40% stated that the average temperature exceeds 20 °C. The above statements were further explored and cross-validated with the temperature monitoring data presented in
Section 3.2 “Monitoring assessment”, presenting consistency.
However, it is noteworthy that the average indoor temperature varies but is not correlated in a statistically significant way with the construction period of the house (Kruskal–Wallis: χ2 = 2.183, d.f. = 2, p = 0.336), the insulation of the external walls (Mann–Whitney: U = 286.5, p = 0.852), or the use of double-glazing windows (Kruskal–Wallis: χ2 = 1.291, d.f. = 3, p = 0.731). This unexpected outcome is probably associated with the fact that heating is an “inelastic” need, or else, a condition of survival in Metsovo, due to the harsh climatic conditions, which means that people have to keep their houses warm regardless of the building age and thermotechnical characteristics.
As far as the natural ventilation of houses is concerned, about 10% of households said that they do not open the windows at all during winter. The rest responded that they ventilate their homes mainly early in the morning (77%), before midday (9%), or at midday (14%). Considering that the outdoor temperature in the area is very low early in the morning, opening the windows at that part of the day allows the house to cool down quickly and, hence, more thermal energy is required to restore the indoor temperature.
3.1.4. Energy Costs for Heating and Electricity
On average, households spend €2100 annually for heating (Std. Dev: €964). More explicitly, 51% spend between €1000 and €2000 per year, 29% spend between €2000 and €3000, and smaller portions spend less (<€1000 per year) or more (>€3000 per year) on heating, 9% and 11%, respectively.
The average heating cost is correlated with the year of house construction, the size of the house, the type of the primary heating system, and the average daily use of the heating system, as shown by the Kruskal–Wallis test. More specifically, the variable of heating cost does not follow a normal distribution according to the Kolmogorov–Smirnov (K-S) test (
p = 0.04 < 0.05); hence, the non-parametric Kruskal–Wallis (K-W) test was selected as appropriate for testing the relationships examined. The null hypothesis for the non-parametric Kruskal–Wallis test is rejected for the four above-mentioned parameters, showing that there is a statistically significant difference between them and heating cost. The results of the Kruskal–Wallis test are presented in
Table 1.
The findings showed that the annual heating cost increases along with the increase in the size of the house, as well as along with the longer daily use of the heating system. On the contrary, a negative relationship is shown between annual heating cost and the year of house construction, i.e., greater costs are observed at older houses, especially of the period 1967–1979.
As regards electricity, the average (stated) annual electricity cost is around €890 (Std. Dev: €427). More specifically, 22% of households spend less than €600 per year on electricity, 22% spend between €600 and €900, 16% spend between €900 and €1200, and just 9% spend more than €1200.
The average (stated) electricity cost is correlated with the type of the primary heating system, the number of household members and the existence of a special invoice. The null hypothesis for the non-parametric K-W test is rejected for the three above parameters, showing that there is a statistically significant difference between them and electricity cost. The results of the K-W test are presented in
Table 2.
The relationships showed that the annual electricity cost increases as the household size increases (a reduction is noticed for households having more than five members). However, households under special electricity schemes were found to spend more on electricity on an annual basis. This finding is worrying, possibly indicating that households enjoying lower electricity prices finally consume higher amounts of electricity or, in the case of Night Tariff, households do not take advantage of the reduced price within the off-peak period. The specific finding was cross-validated in
Section 3.2 by examining electricity consumption monitored by equipment in relation to the tariff scheme.
3.1.5. Qualitative Indicators of Energy Vulnerability
Three qualitative indicators were used to measure energy vulnerability: (a) thermal discomfort or inability to keep home adequately warm, (b) housing condition, including moisture/mold problems, and (c) arrears in energy bills. As shown in
Figure 3, the presence of moisture/mold detected in 30% of households emerges as the main problem in the area, exceeding by far the Greek average at country level (17.9%) according to EU-SILC survey’s latest data [
50], followed by arrears in energy bills (14%) and thermal discomfort (14%).
3.2. Monitoring Assessment
Indoor temperature was monitored throughout the whole period of the LL operation, in an attempt, among others, to reach conclusions about thermal comfort within houses, given that most people feel comfortable at the room temperature of 20 °C in winter. During the whole period examined, 38% of households had an average temperature above the comfort temperature of 20 °C, 30% had a temperature at the comfort level of 20 °C and 32% had a temperature below the comfort level. The finding that 32% of the households had an average temperature below the comfort temperature during the project is worrisome, if taking into account the greatly “inelastic” conditions of Metsovo and that the harsh climatic conditions practically leave no space for “discounts” in the home’s temperature.
The average temperature increases proportionally with the property’s size, possibly implying that households with a higher income level can afford a higher temperature level in the house (
Figure 4), with no statistically significant difference appearing, though. Moreover, the average indoor temperature proves to be higher for households using their heating system fewer hours per day (4–6 h), as shown in
Figure 5. This seemingly unexpected finding is probably associated with the fact that households with central heating systems use them for fewer hours compared to households with local heating systems, i.e., stoves, fireplaces, etc.
The average annual electricity consumption was estimated at around 4362 kWh
el, according to monitoring data. Comparatively, the final electricity consumption of all Greek households was about 16,762 GWh
el in 2018, based on recent Eurostat’s data [
50], which corresponds, approximately, to 4014 kWh
el per household/per year. If examining the consumption categories, it arises that 45% of households consume between 1750 and 3500 kWh
el annually, 26% consume between 3500 and 5250 kWh
el, and 12% consume between 5250 and 7000 kWh
el, as shown in
Figure 6. The facts show that on average, one out of two households consumes less than the country’s average and one out of four consumes more than this.
Annual electricity consumption varies by the property’s size, although not proportionally, as shown in
Figure 7. Higher electricity consumption is observed in smaller (less than 70 m
2) and bigger houses (over 110 m
2), with no statistically significant differences occurring though.
In general, annual electricity consumption increases proportionally to the household size, with households consisting of three members presenting higher consumption (
Figure 8). Interestingly, the annual electricity consumption is considerably higher for households using special tariffs, i.e., night and social tariffs (
Figure 9), coinciding with the “stated” electricity cost in relation to the tariff scheme (
Section 3.1).
3.3. Evaluation Assessment
During the evaluation stage, different behavioral aspects were captured by households with and without monitoring equipment. At first, households without monitoring equipment were asked if they give attention to energy bills and charges. Actually, while the majority (62%) answered that they always read electricity bills, 38% claimed that they do so sometimes or never. Moreover, 56% stated that they rarely—or never—keep records of heating bills and heating fuel consumption. As regards indoor thermal conditions, 82% stated that they measure their home’s temperature, while only 17% measure their home’s humidity through some meter.
As regards households with monitoring equipment installed in their houses, the majority (73%) stated that they monitored/checked the electricity consumption meter during the LL duration through the app on their mobile or computer. Among them, about 51% stated that they did so several times per week and 12% did so once per day. Even more households (93%) stated that they monitored/checked the temperature and humidity sensors installed in their houses, most of them several times per week (63%) and others once per day (26%). Moreover, 85.5% of households stated that the monitoring equipment motivated them toward taking certain energy-efficiency decisions, i.e., the maintenance/change of the heating system (15%), the change of analogue to digital thermostats (14%), insulation measures (13%), the purchase of some energy-efficient appliance (12%), change of light bulbs (9%), change of habits/reduction in consumption (7%), change of time-of-use of home appliances (6%), purchase of dehumidifiers (5%), and others, as shown on
Figure 10.
Remarkably, there were cases in which households were nudged to apply significant energy-efficiency measures. Indicatively, one of them applied thermal insulation on both the walls and the roof of the house. This led to actual energy savings for heating of about 9690 kWh
th, which is interpreted in an annual energy costs savings of about €750. Moreover, another household replaced an old and faulty refrigerator with an energy-efficient one. This, in turn, led to electricity energy savings of about 1500 kWh
el, which is interpreted in annual energy costs savings of about €300 (assuming that the average electricity price equals €0.19/kWh
el), given that the base electricity consumption decreased by 40% (
Figure 11). Furthermore, 24 diesel oil-fired central heating systems were checked in the context of STEP-IN, from which 12 were maintained, according to the standards applied in Greece. The outcome was a significant increase in the burners’ energy-efficiency ratio, resulting in considerable energy savings and a reduction of the households’ energy costs, as depicted in
Table 3. In total, more than 11,530 kWh
th were saved (about €1286).
Apart from expensive energy decisions, there were cases of households in which specific energy advice was considered particularly useful. Indicatively, there were cases in which the trend of the daily electricity consumption differed significantly from the profile of the average household in Metsovo, with the maximum loads emerging at totally different hours from the average level (the peaks appeared at specific evening and night hours as opposed to the usual peak hours of the most households in the area). After investigating these cases, it was found that this happened in households using a specific primary heating system, i.e., heat accumulators. These households were informed about this different electricity consumption profile related to their heating system in order to adjust accordingly their energy use. Finally, in cases of over-consuming thermal energy, the advice provided in terms of better temperature control or a slight behavioral change delivered important energy savings at households without lowering their quality of life.
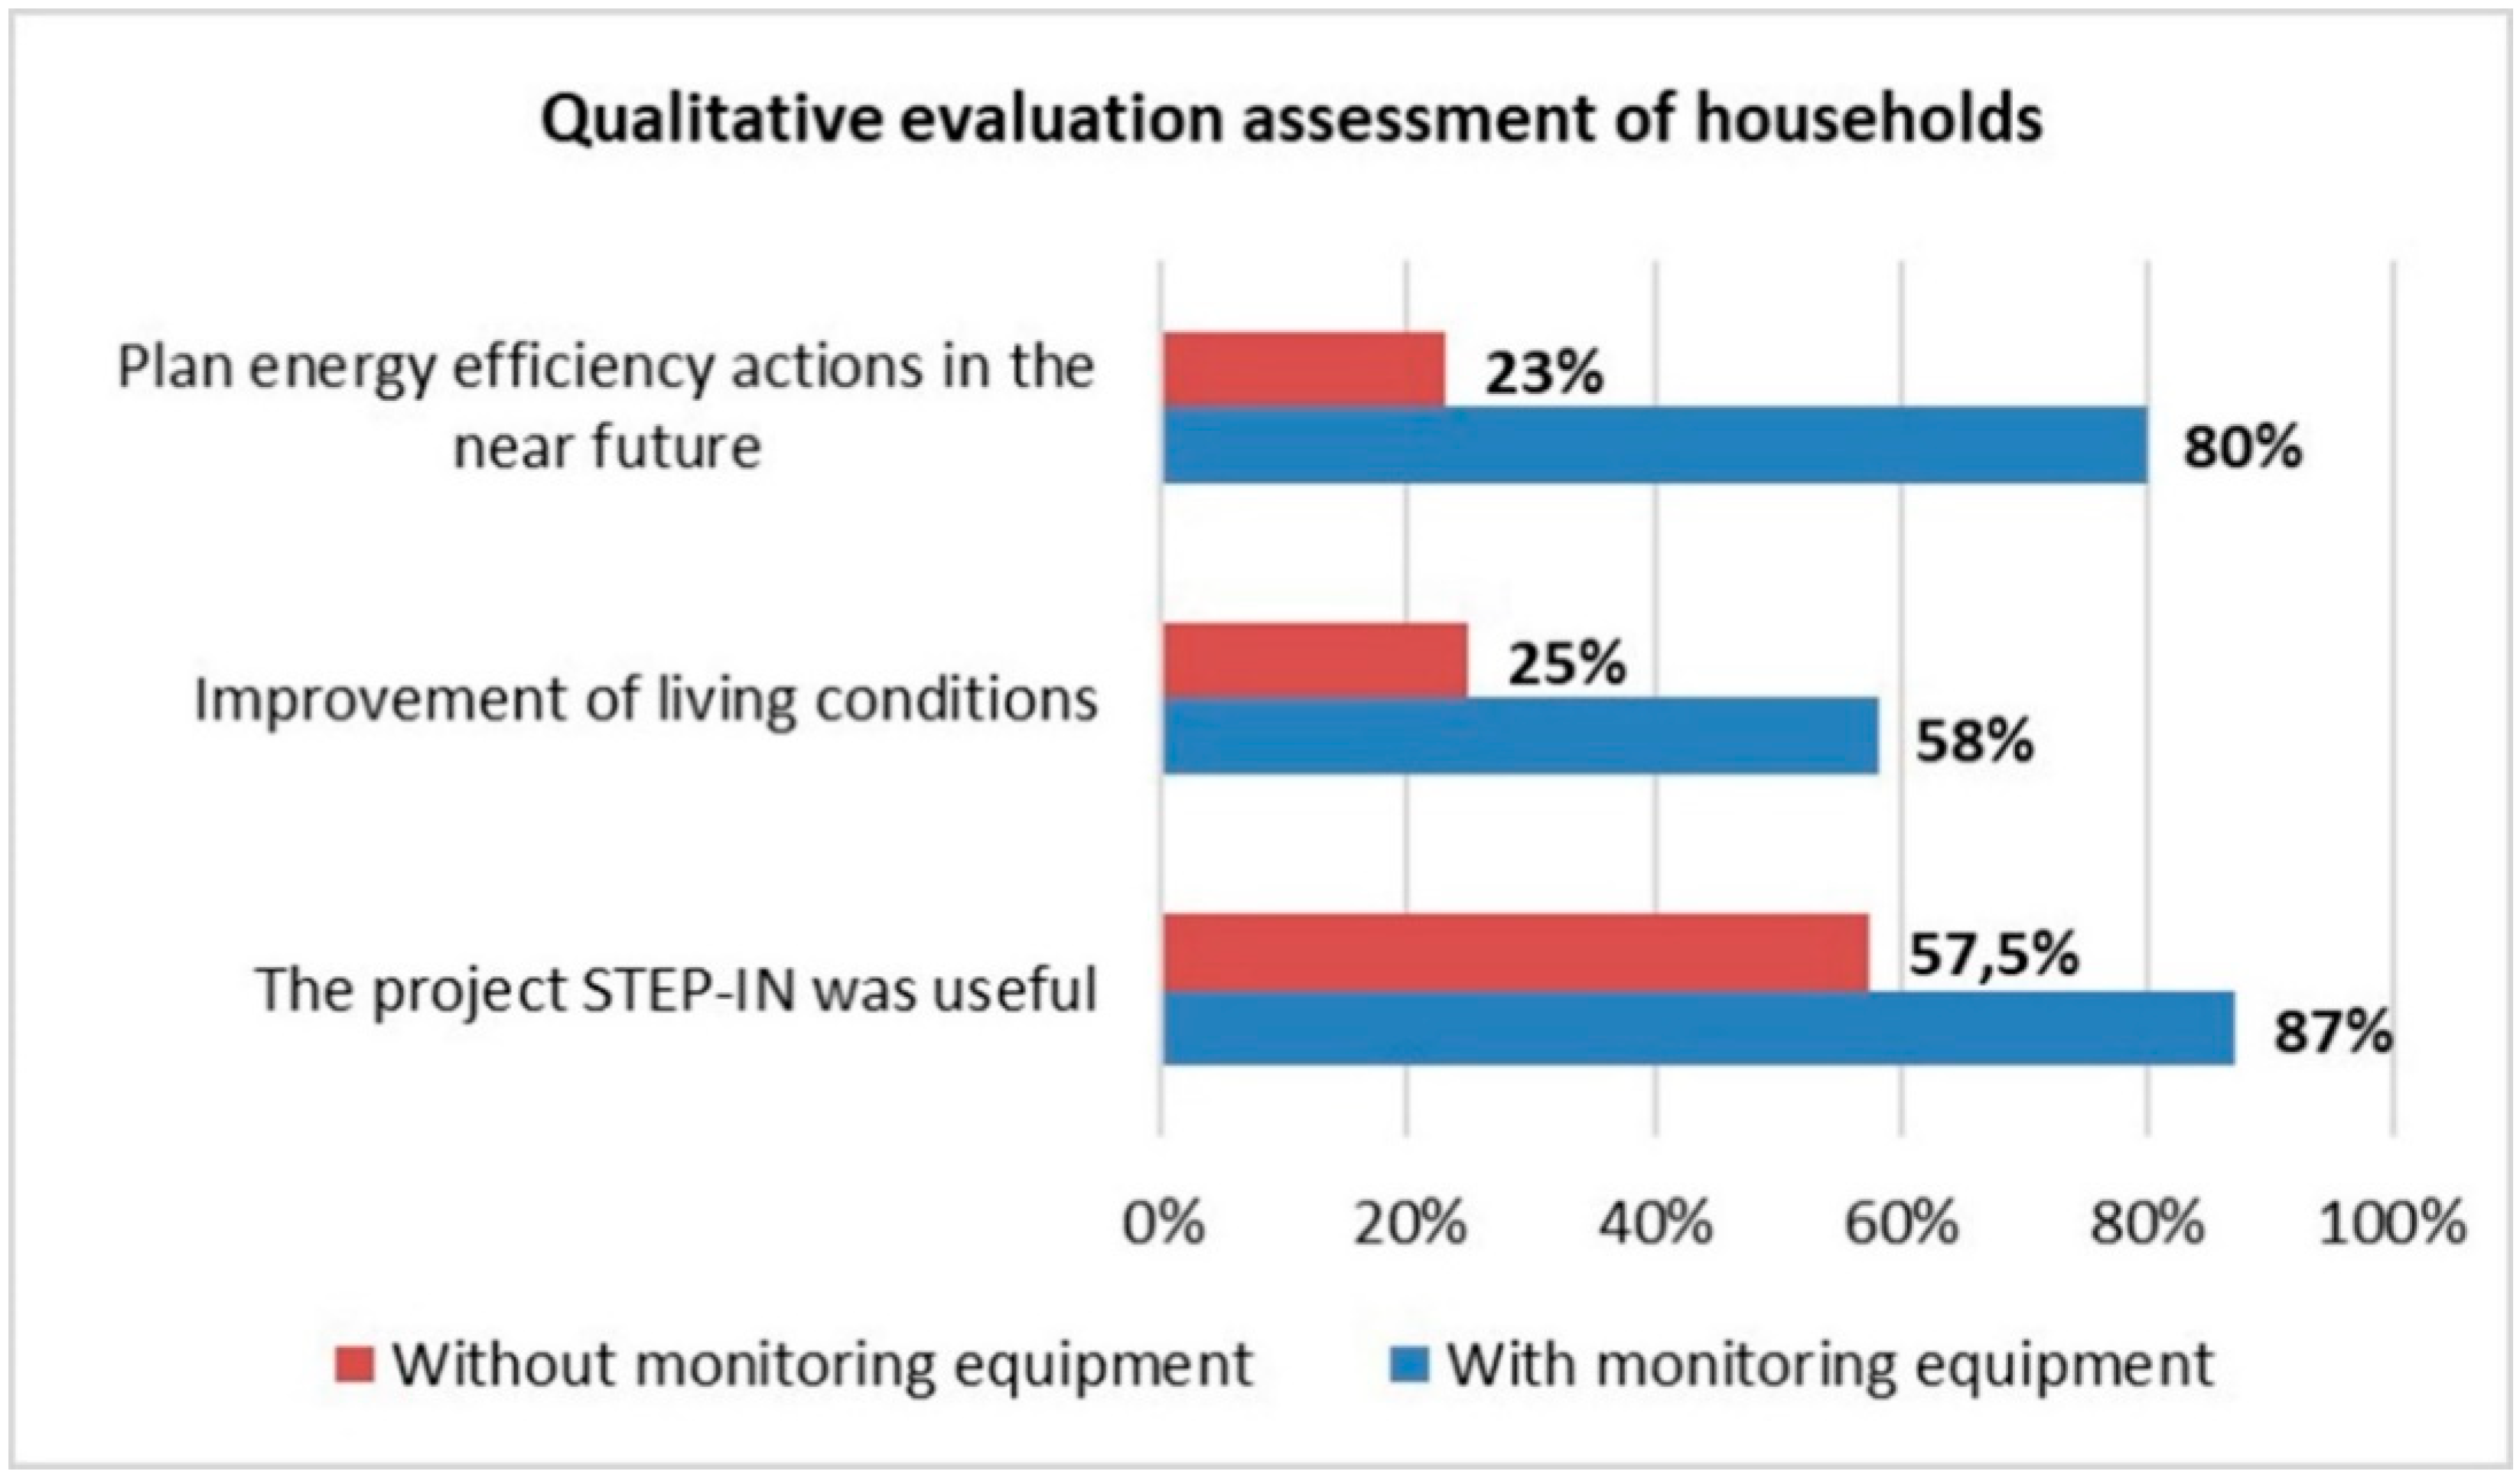
In total, 76% of those taking part in the LL activities stated that the project was finally useful to them. More specifically, given the qualitative responses of the evaluation stage, 29% changed energy-related everyday habits, 23% were helped toward a better understanding of electricity charges and bills, 17% proceeded to maintaining their heating system, 16% learned ways to use their heating system more efficiently, 9% were motivated toward implementing insulation measures and smaller portions started taking advantage of the Residential Night Tariff or switched to another electricity supplier (3.5% and 3%, respectively). It is noteworthy that there appears to be a statistically significant difference between households with monitoring equipment and those without equipment in terms of their satisfaction with the project, according to the Chi-square test of Independence (χ2 = 10.872, d.f. = 1, p-value = 0.001). More specifically, 87% of households with monitoring equipment installed found the project useful, whereas a significantly smaller percentage of households (57.5%) that were visited by energy advisors but not equipped with monitoring tools found the project useful.
Around 40% of households stated that they realized an improvement in their quality of life during the LL’s operation, mainly by improving the level of thermal comfort at home (42%), by facing less moisture/mold problems (26%) and by reducing energy costs (23%). Once again, more households—more than double—with monitoring equipment noticed that improvement in their everyday lives versus households without equipment (58% vs. 25%). The difference proved to be statistically significant (χ
2 = 10.338, d.f. = 1,
p-value = 0.001). Finally, as arising by the evaluation stage, 56.4% stated that they plan to apply energy efficiency actions in the near future, with a statistically significant difference between households with and without monitoring equipment (χ
2 = 31.043, d.f. = 1,
p-value = 0.000). In more detail, 80% of households with monitoring equipment reported plans regarding energy efficiency measures, instead of 23% of households without equipment, as shown in
Figure 12 for all the three variables described. Overall, it is apparent that households with monitoring equipment appear to be substantially more affected by the project compared to households without equipment.
4. Conclusions and Lessons Learned
In this paper, the experience gained by operating a Mountainous LL of the STEP-IN project in Metsovo, Greece is presented. The main goal was to learn from practice, i.e., to see in what ways and how much energy-vulnerable households can be helped in their everyday lives through such an initiative, as regards energy-related behavior, costs, and consumption. The methodological approach as well as the outcomes derived from the three rounds of the LL is provided in detail.
In general, the activities during the three rounds of the LL showed that engaging households fully in the LL activities is not an easy endeavor. Although in general, local people were interested at first in taking part in the project, aiming at reducing energy costs and consumption, or improving the level of thermal comfort in their homes, this turned out to change to some extent throughout the project. In fact, often and long visits for collecting all the required information or assigning tasks such as keeping a daily energy diary on the use of electrical appliances and heating systems was not finally possible without annoying the participants somehow.
In this context, certain actions were decisive in terms of gaining the trust and support of the local community. One of them was the involvement of local people in the LL activities. For instance, there were cases in which people were reluctant to allow Energy Advisors to install the monitoring equipment. Yet, they changed their mind when electricians from the local community were hired together with the Energy Advisors. In the same direction, people were more convinced to get involved in energy-saving measures and to adopt advice from the Energy Advisors when the last ones presented actual measurements of the houses’ consumption and specific-household directions. In addition, the initiative to service for free some diesel oil heating systems was strongly discussed within the local community, along with allowing them to gain a better understanding of the benefits derived from such an action. Hence, a balance between planned and acceptable activities from the local community had to be found.
All in all, overcoming certain difficulties faced through the implementation of the LL, the acceptance from the local community, as well as their sincere engagement in the project was unexpectedly good. This was practically shown by the energy decisions already adopted by a large number of households taking part in it (85.5% within households with monitoring equipment), as well as by their plans for future energy-efficiency measures (56% in total, 80% within households with monitoring equipment). Hence, the overall result from the project is considered positive, especially for households with monitoring equipment installed in their houses.
Certainly, some things can be improved for future endeavors, in terms of organization and operation of the LL, to ensure an even higher engagement of local people and a broader stakeholder group within the project. Moreover, since mountainous areas stand at the backstage of Greece’s major political–economic decisions, the project wishes, apart from affecting the local society, to produce longer-term sustainable impacts through expanding the network of stakeholders and bringing the problems to the forefront, thereby managing to address more effectively energy vulnerability in mountainous societies.


 ,
, 


