Article

A Novel Open-Source Simulator Of Electric Vehicles in a Demand-Side Management Scenario †

by
Lucio Ciabattoni
1,*,
Stefano Cardarelli
2,
Marialaura Di Somma
3,
Giorgio Graditi
3 and
Gabriele Comodi
2
1
Information Engingeering Department, Università Politecnica delle Marche, 60131 Ancona, Italy
2
Industrial Engingeering and Mathematical Sciences Department, Università Politecnica delle Marche, 60131 Ancona, Italy
3
Italian National Agency for New Technologies, Energy and Sustainable Economic Development (ENEA), 0010 Roma, Italy
*
Author to whom correspondence should be addressed.
This paper is an extended version of our paper published in 2020 IEEE International Conference on Environment and Electrical Engineering, Madrid, Spain, 9–12 June 2020.
Energies 2021, 14(6), 1558; https://doi.org/10.3390/en14061558
Submission received: 31 December 2020 / Revised: 23 February 2021 / Accepted: 4 March 2021 / Published: 11 March 2021

Abstract

:
Recently, due to the growth of the electric vehicle (EV) market, the investigation of grid-to-vehicle and vehicle-to-grid strategies has become a priority in both the electric mobility and distribution grid research areas. However, there is still a lack of large-scale data sets to test and deploy energy management strategies. In this paper, a fully customizable EV population simulator is presented as an attempt to fill this gap. The proposed tool is designed as a web simulator as well as a Matlab/Simulink block, in order to facilitate its integration in different projects and applications. It provides individual and aggregated charge, discharge and plugin/out event data for a population of EVs, considering both home and public charging stations. The population is generated on the basis of statistical data (which can be fully customized) including commuting distances, vehicle models, traffic and social behavior of the owners. A peak-shaving case study is finally proposed to show the potential of the simulator.

1. Introduction

Recent forecasts of the penetration rate of electric vehicles (EVs) into the market [1] and their potential impact on the electricity grid will enable a new realm of applications. Nowadays the majority of the electricity demand is still inflexible, causing a higher cost to the overall system. Indeed, modern power systems should change this paradigm in order to accommodate rising shares of variable renewable energy production and match with the electricity demand. One way to achieve this goal is to adjust (i.e., reduce, increase or shift) the electricity demand by using implicit or explicit demand-side flexibility approaches [2]. An increased flexibility level can be achieved by sector coupling, for example in the form of electrification of the mobility (electric vehicles) and the heating sectors (power to heat), or via smart appliances. The integration of electric vehicles in the electricity grid can provide flexibility due to the daily cycles of charging of their batteries. Another viable technique is the coupling of the heating and electricity sectors, which can provide flexible short-term demand by using heat pumps, heat storage and electric cooling loads. Finally, demand-side flexibility (DSF) can be obtained through aggregated residential demand-side management in smart homes [3].
In this scenario, vehicle-to-grid (V2G) is one of the most promising technologies, which may have a significant impact on power system operation [4] by offering several services to the grid itself, such as power grid regulation, spinning reserves, peak load shaving, load leveling and reactive power compensation. When EVs are parked in a charging station, their batteries can be used to let electricity flow between the vehicles and the grid, thus creating economic benefits for both owner and grid [5]. In this scenario, the EV is no longer a simple means of transportation, but communicates with the power grid to deliver electricity into it and control the charging rate for EVs, thus becoming a form of mobile electrical energy storage [6]. Economically, the V2G concept will be a new business, namely the energy arbitrage between the power utilities and the EV drivers [7]. V2G operation has been identified to have two important applications. Firstly, since renewable power generation is intermittent by nature, the use of standby generators to backup the intermittent power outage is expensive and inefficient, while V2G operation can be a viable solution [8]. Secondly, in a demand-side flexibility (DSF) scenario, the V2G operation can utilize the EV batteries to absorb (or buy) electrical energy from the grid during the off-peak period (load leveling), or generate (or sell) electrical energy to the grid during peak period (load shaving) [9]. Furthermore, the corresponding charging and discharging processes are much faster than the shutoff and startup processes of standby generators.
Since a single EV can store only a small amount of kWh [10], an individual V2G operation (also known as vehicle-to-building or V2B when dealing with home charging stations) may be ineffective and inefficient in some cases. Therefore, the concept of an aggregator [11] has been introduced to gather a number of EVs and control them properly to achieve smart charging and discharging cycles.
In the actual context, V2G is facing different challenges, not only from the regulatory side but also from a technological point of view. Indeed, V2G techniques typically increase the number of charging/discharging cycles of EVs (thus reducing battery lifetime), require knowledge of parking patterns and strongly depend on the actual and forecast EV market penetration, geographical area, availability of charging stations, and so on. This implies, for engineers and grid operators, the need to face different scenarios in a context where large-scale datasets are unavailable. Due to the lack of solutions, in this work we attempt to fill the gap by presenting a bottom-up EV simulation platform used to assist the deployment of DSF algorithms, the design of optimization procedures and the evaluation of grid load from a V2B to an aggregated V2G scale. The simulator, namely ePopSimulator, introduced in a preliminary version in [12] and accessible from www.energysystems.diism.univpm.it, accessed on 10 March 2021 (provisionally at http://193.206.121.28:32000, accessed on 24 February 2021), allows easy obtaining of charging and parking profiles, state of charge, minutes to hourly energy demand and potential surplus for each considered EV, having as input statistical data from a certain geographical area (assumed, forecast or eventually computed through data analysis techniques). A Matlab Simulink block has been designed in order to extend the possibilities of the tool, allowing users to simulate and test algorithms, supervisors and aggregators to provide flexibility. To the best of our knowledge, the full set of features of the presented simulator is not included in any other platform currently available (as shown in Table 1). The paper is organized as follows. Section 2 presents the current available EV simulators and their limitations, Section 3 describes the structure of the simulator, explaining both the web interface and the Matlab Simulink features. Finally, Section 4 shows the proposed case study, which is useful for demonstrating the potential of the simulator.

2. State of the Art

In recent years, the electrification of the transportation market and the lack of large datasets has led to many predictive models of different scenarios of EV introduction into the power grid. In 2009, Karnouskos and De Holanda [21] proposed an agent-based tool, simulating the discrete heterogeneous devices that consume and/or produce energy, that are able to act autonomously and collaborate in a smart city, including EVs and smart homes. Both house appliances and EVs were modeled as objects changing their outputs according to events that may occur during the simulation (such as the unplugging of a device) or to probabilities (such as the chance of unforeseen adverse traffic conditions).
In 2010, Pillai and Bak-Jensen [20] published a case study, simulating the load of EVs onto a Danish distribution system with two kinds of recharging modes: 10% of the total vehicles were EVs with “dump recharging” (no time constraints) and another 40% with “smart recharging” (fixed hours and loads shifted towards hours of low electricity prices). In both listed studies neither geographical/traffic information nor customer habits were explicitly implemented in the simulators.
During the following years, part of the scientific interest focused on the actual modeling of EVs and recharging stations at circuit level, in order to implement novel fast-recharging modalities and vehicle-to-grid (V2G) oriented bidirectional AC/DC, DC/DC converters [19,22].
Again, in the five-year period of 2014–2019, a series of studies was published showing both custom and commercial simulators, adapted and combined to achieve hourly distributed data for energy consumption in relatively large-scale scenarios, mainly focusing on the deployment and testing of strategies to address energy investments, scheduling problems, power loss minimization and optimal topological planning of charging station distribution [13,14,15,16,17,18]. In particular, the work of Bedogni et al. [16] featured a series of existing simulators (Omnet++, SUMO and VEINS) modeling event-based recharging operations, along with traffic conditions and geographic information. The paper strongly focused on public recharging stations and a simulator, which offered recharging spot reservation. On the other hand, customer behavior was modeled only as a fixed time and distance constraint and home-recharging events were not taken into account. Novosel et al. [17] proposed another interesting case study, modeling the energy impact on Croatia, similarly to the work of Pillai et al., featuring the MATSim and EnergyPLAN tools. This time customer activities and accurate commuting distances were taken into consideration, and the first ones were modeled as parametric probability distribution functions, resulting in distance vs. traveling time realistic outputs. However, EV modeling was sacrificed in favor of more accurate modeling of energy production, import and export. Furthermore, a custom Java-based simulator by the name of EVLibSim was proposed by Rigas et al. [14]. In their paper, a thorough comparison with other existing tools was presented, and the cited tools were compared in terms of V2G EVs and charging station modeling, electricity prices and scheduling. The tool presented an event-based kind of simulation to manage EV activities at a charging station level with particular attention on recharging station modeling and customizability. The strong focus on the charging station as a simulation object allowed the accurate simulation of charges, discharges and queues, although it missed the behavioral aspects of a district of EV owners with different commuting distances, EV models and home recharging capabilities. Finally, the work of Canizes et al. [13] presented a tool to study the impact of the variation of electricity prices on the behavior of EV users. Again, an extensive comparison with current available tools was reported, and a simulation tool was presented, featuring charging station customization (home and public), travel conditions and user behavior simulation. In the same paper the tool was then integrated with an optimization model to permit to determine the variable charging price. In the end, the final aim of the paper was to show that variable-rate of electricity prices demonstrate to be more advantageous to the users, enabling them to reduce charging costs while contributing to the required flexibility for the system, rather than providing a tool to simulate distribution grid energy load and behavior-based recharging events.

3. Materials and Methods

The proposed electric vehicle (EV) model architecture is composed of a cloud-based simulator and a Simulink block. While the former can work as a stand-alone tool, the latter, which can be added to any custom Simulink project, needs to be initialized with the output data provided by the cloud-based simulator.
An overview of the software architecture can be found in Figure 1.
In the following, the detailed description of the model as well as its usage guide will be covered.

3.1. Cloud-Based Tool

As mentioned before, the first tool consists of a standalone simulator that can be configured and launched through the link www.energysystems.diism.univpm.it, accessed on 10 March 2021 (provisionally at http://193.206.121.28:32000, accessed on 24 February 2021). This tool offers the ability to simulate the behavior and the electrical demand of a district of EV users. The main simulation parameters, i.e., the number of consumers to be simulated, the number of days and the sampling time of the simulator engine, can be set through the form shown in Figure 2a, while a set of Advanced Options will be explained in the following section.

3.1.1. Configuration

The proposed model is structured in a bottom-up approach, where the Consumer class is the basic block, therefore it allows analysis of data from the single customer perspective to the aggregate output. Each customer is modeled by the means of the following class arguments:
  • Commuting distance (km)
  • -
    Electric vehicle
    -
    Car model
    -
    Battery capacity (kWh)
    -
    Declared vehicle autonomy (km)
    -
    Average vehicle fuel consumption (kWh/km)
    -
    Domestic charging point capacity (kW)
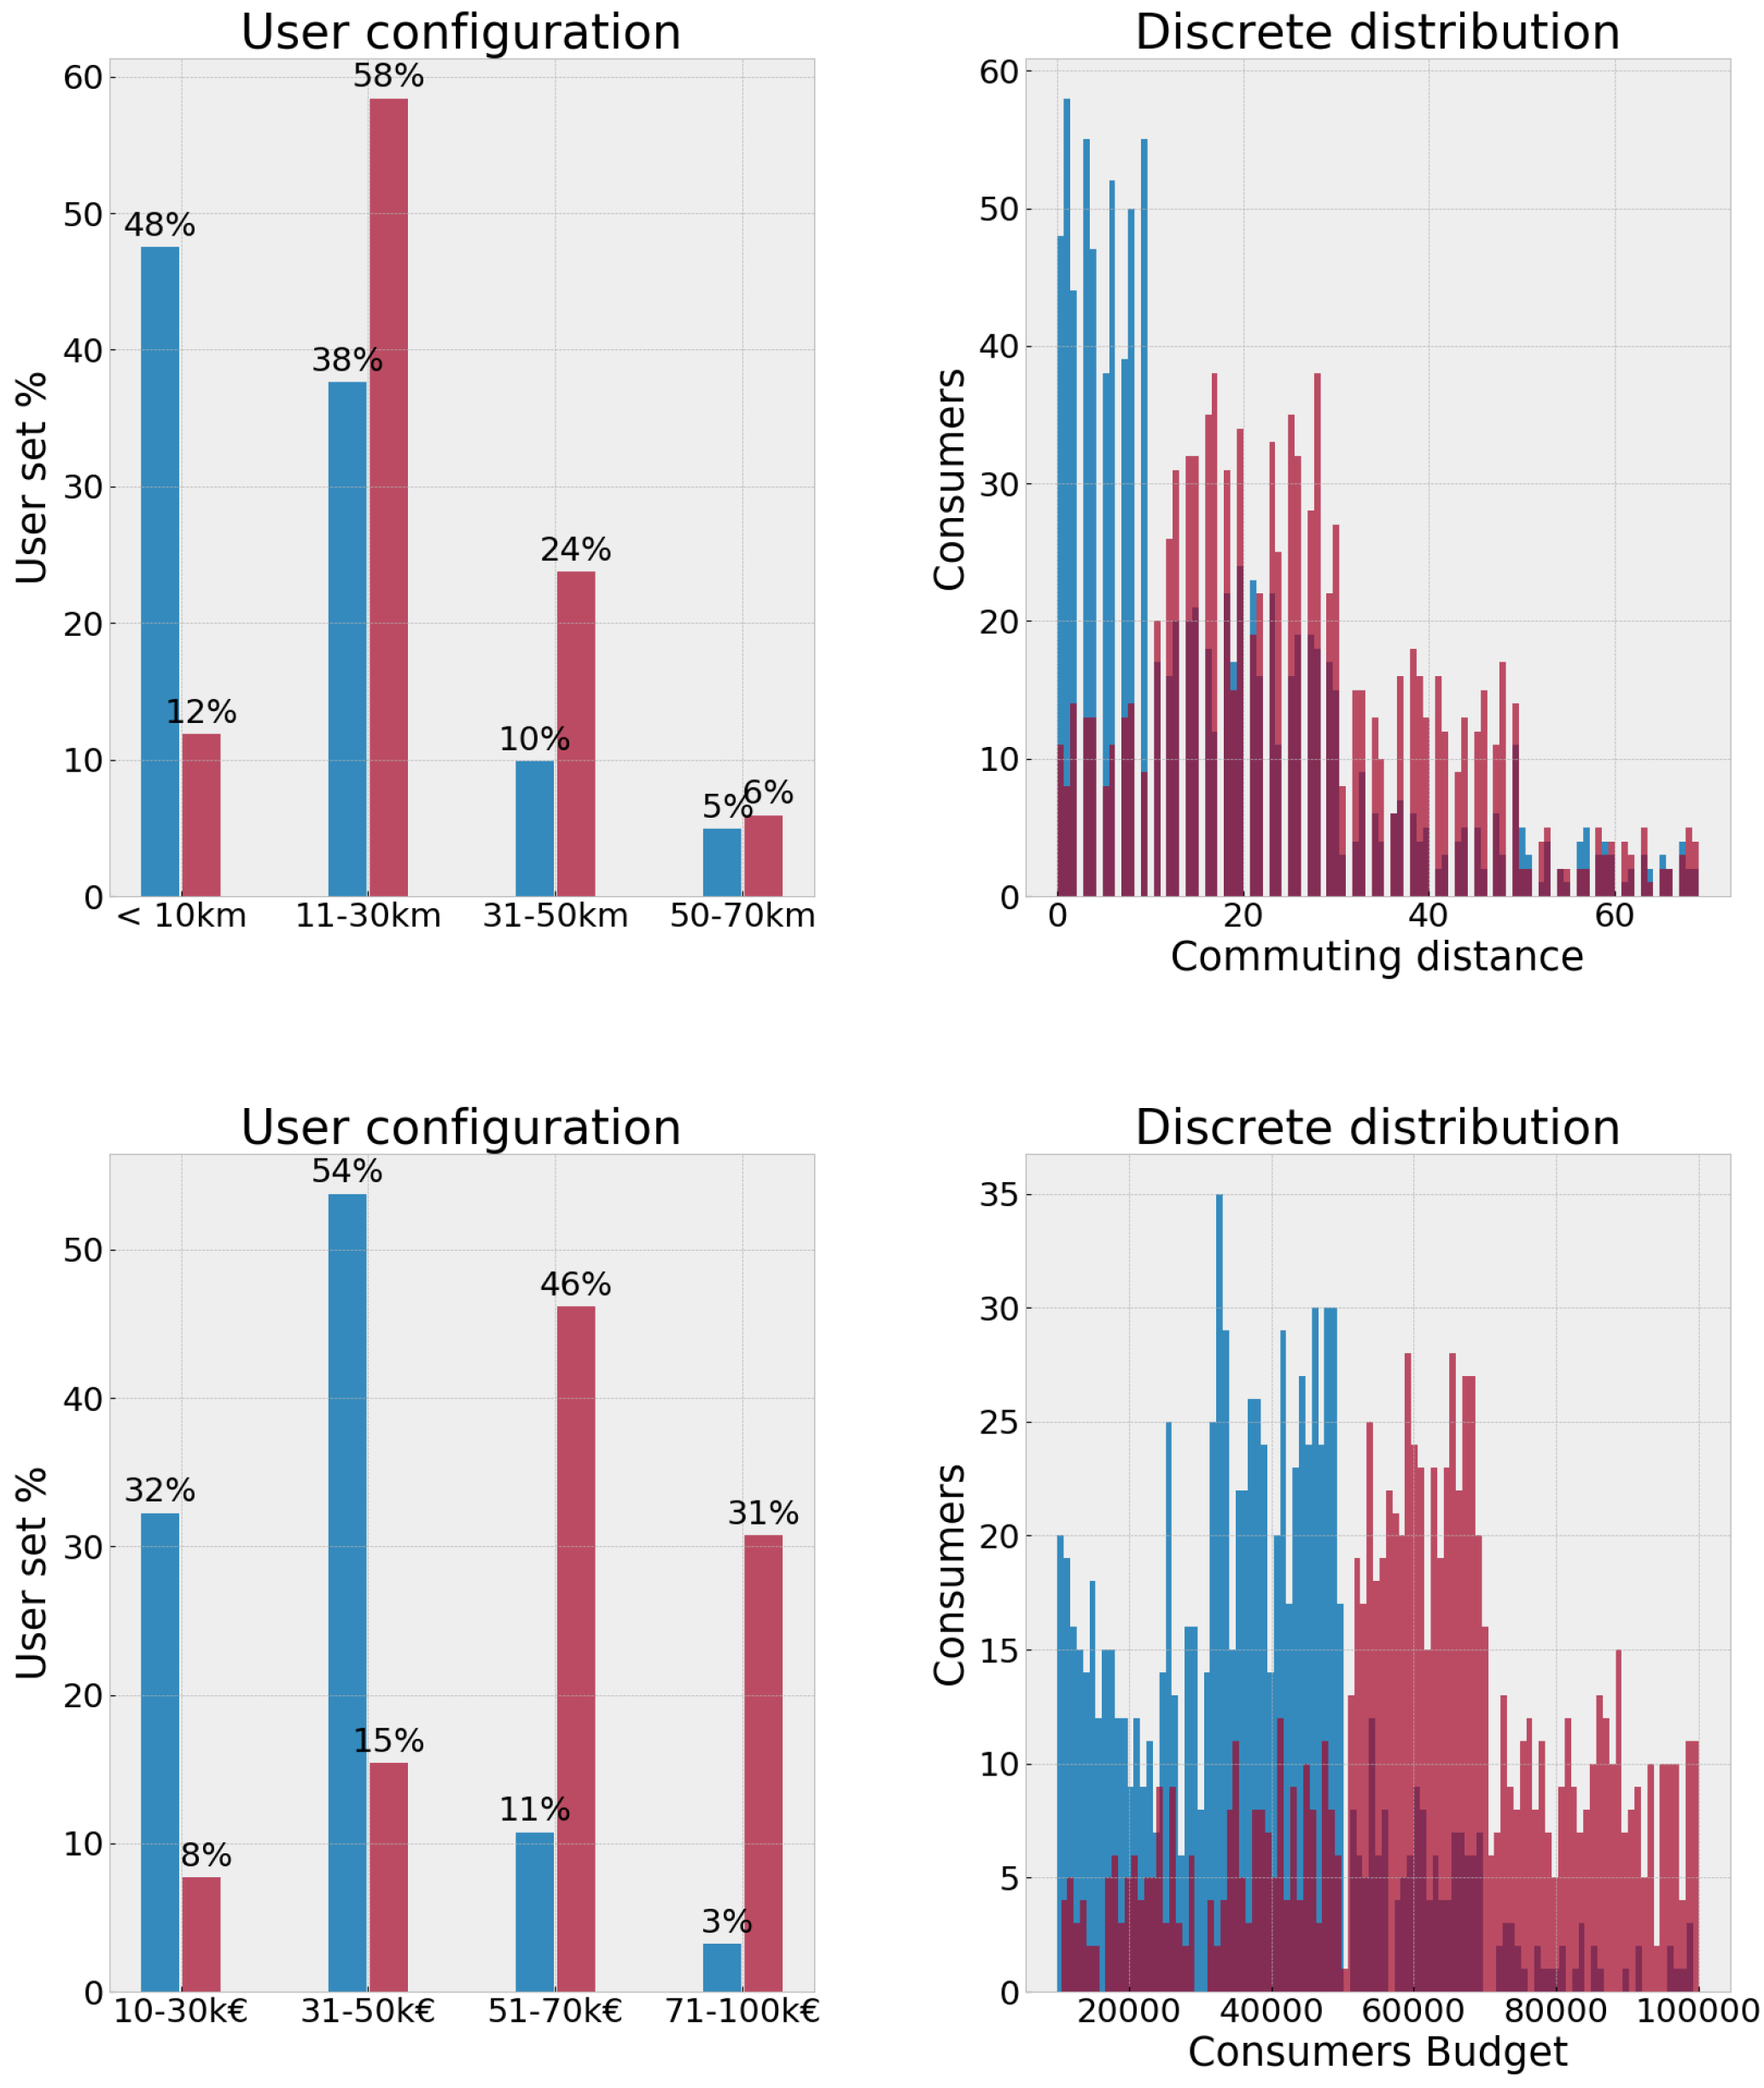
    The average commuting distances for the consumer population can be assumed, computed from available data (or surveys) or generated pseudo-randomly from statistical data. The default value used by the simulator, depicted in Figure 4 (blue bars), is obtained from an Italian Statistic Institute survey, while users can vary the commuting values in the Advanced Options form (see Figure 3).
    The EV population is generated by matching an EV model and a customer based on the commuting distances and a second input: the distribution of prices paid by customers, settable in the Advanced Options form. The default price ranges are shown in Figure 4. EV features and specs (model, price, battery capacity, autonomy and average fuel consumption) are obtained from the manufacturers web pages and automatically updated quarterly.
    Each customer’s domestic charging point capacity can be assigned randomly or with a custom distribution among 3, 4.5 and 6 kW.
    The simulator core logic is an event-based process where the event represents a portion of each consumer’s daily routine, i.e., charge/discharge cycles, taking into account the different configurations.
    In particular, in order to effectively reflect the variability of these charge/discharge cycles, these events are generated by using probability plugin/plugout functions. As an example, in Figure 5 are reported the probability distribution density and cumulative functions of the evening plugin and morning plugout events. The user can customize these distributions in the Advanced Options form.
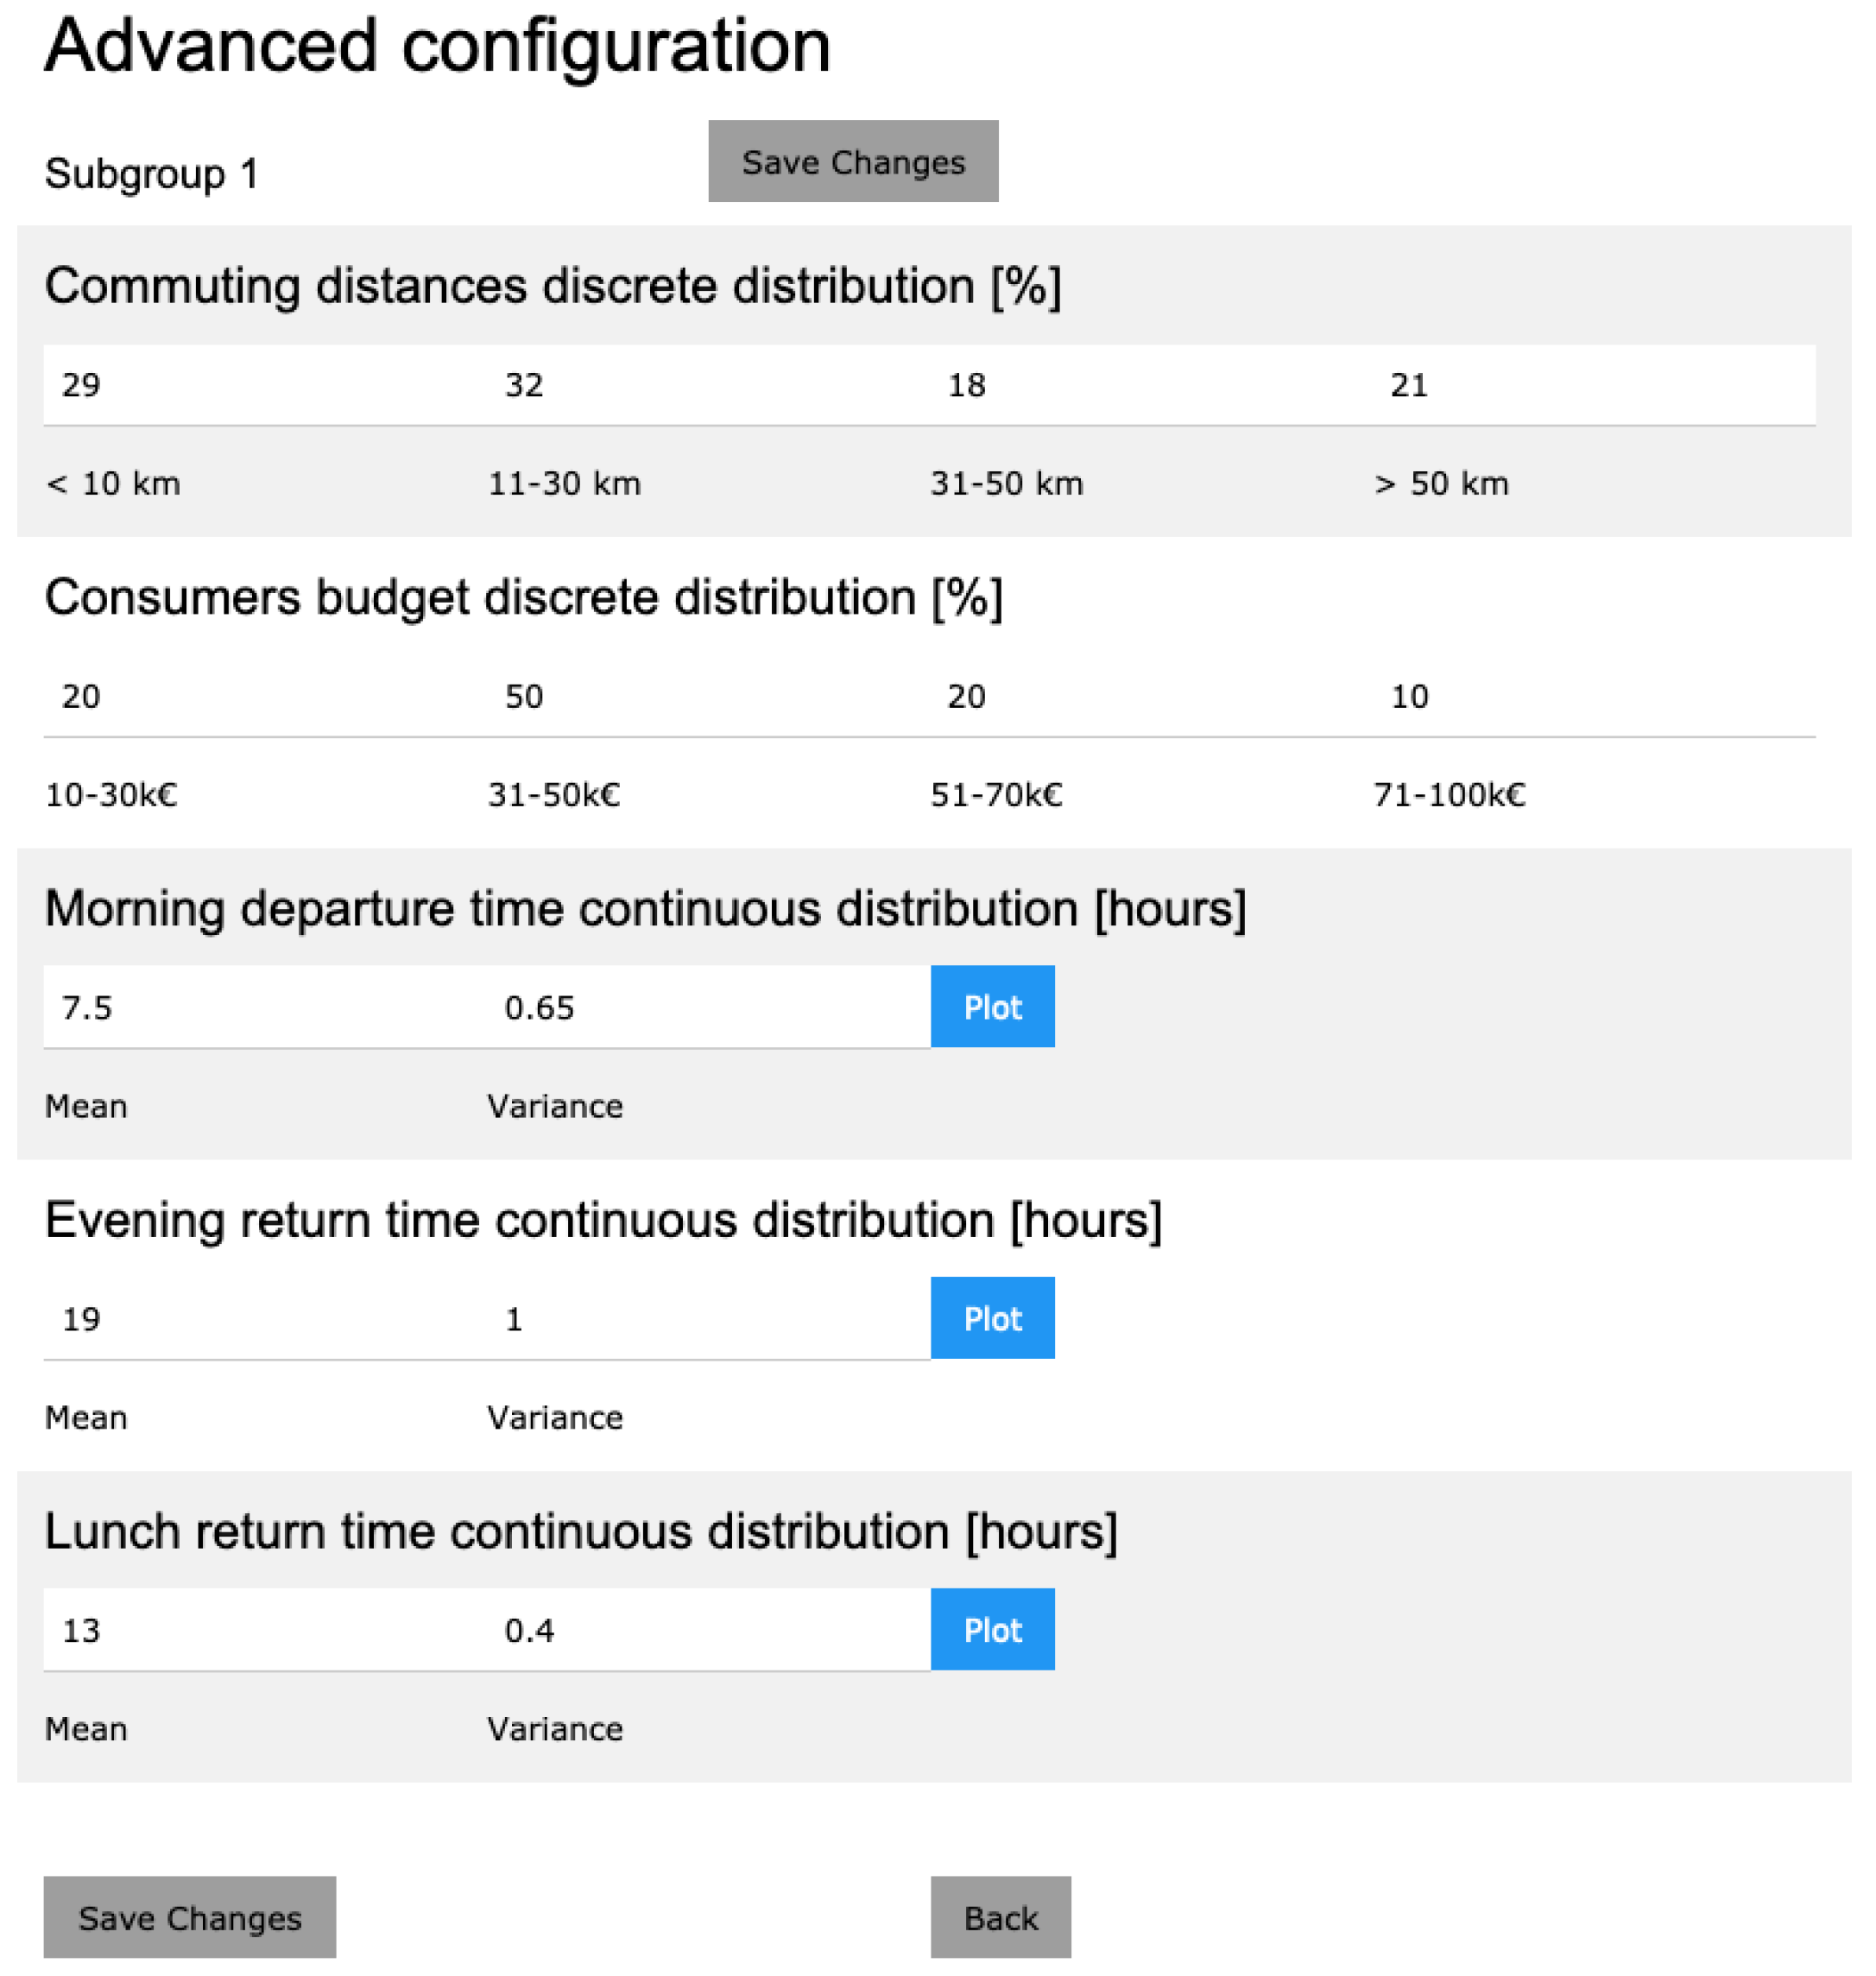
    Furthermore, the configuration settings described above can be applied to four different subgroups of customers as a percentage over the total number expressed in the form of Figure 2a, and can be set in the form as in Figure 2b. This additional feature was introduced in order to give the user the ability to simulate a more heterogeneous array of consumers with different habits, incomes and commuting distances.

    3.1.2. Simulation Engine

    For each customer, during the simulation a daily routine is executed as shown in Figure 6.
    Each simulation day cycle is divided into five main events:
    1.
    Night: The customer charges his/her EV until it reaches a SOC of 100% or until plugout time. Depending on the commuting distance plus a percentage buffer, the domestic recharging device simulates the minimal quantity of charge that would allow the customer to cover the expected mileage for the next day.
    2.
    Morning: The consumer travels from his/her dwelling to the workplace. The plugout time is generated from the morning plugout probability distribution. Traffic conditions are computed to positively or negatively affect the actual energy consumption as shown in (1) and (2):
    d e f f = d + k · v ; with k { 1 , 1 , 0 }
    Where d is the commuting distance traveled by the customer, d e f f models how much the traffic conditions affect the actual distance, v N ( 0 , σ 2 ) is a normal distribution with σ as the traffic variance parameter (expressed in km), and k is a control parameter ( σ and k can be changed in the Advanced Options form). When k = 1 , then d e f f d , and traffic conditions are forced to be “adverse”. When k = 1 then d e f f d , hence traffic conditions are forced to be “favorable”. When k = 0 then d e f f = d and no variability is applied. When a user does not set the parameter k, the formula becomes:
    d e f f = d + v
    3.
    Lunchtime: This event may happen only if a customer has a low commuting distance and is pseudo-randomly triggered. In such case, the customer will consider a brief EV recharge during lunchtime, with an operation analogous to the “Night” phase. After this time lapse, the customer will return to the workplace as in the “Morning” phase. This step requires a further computation of d e f f , since the customer actively travels toward home and back again (to the workplace) to have lunch and charge the EV.
    4.
    Afternoon: This phase is triggered pseudo-randomly; the customer may decide to recharge his/her EV in a public charging station for a variable time lapse before the trip home from the workplace. This could affect the SOC of the vehicle for the evening plugin.
    5.
    Evening: The consumer travels home a distance equal to d e f f and plugs the vehicle into the home charging station according to the evening plugin probability distribution.

    3.1.3. Output Graphs

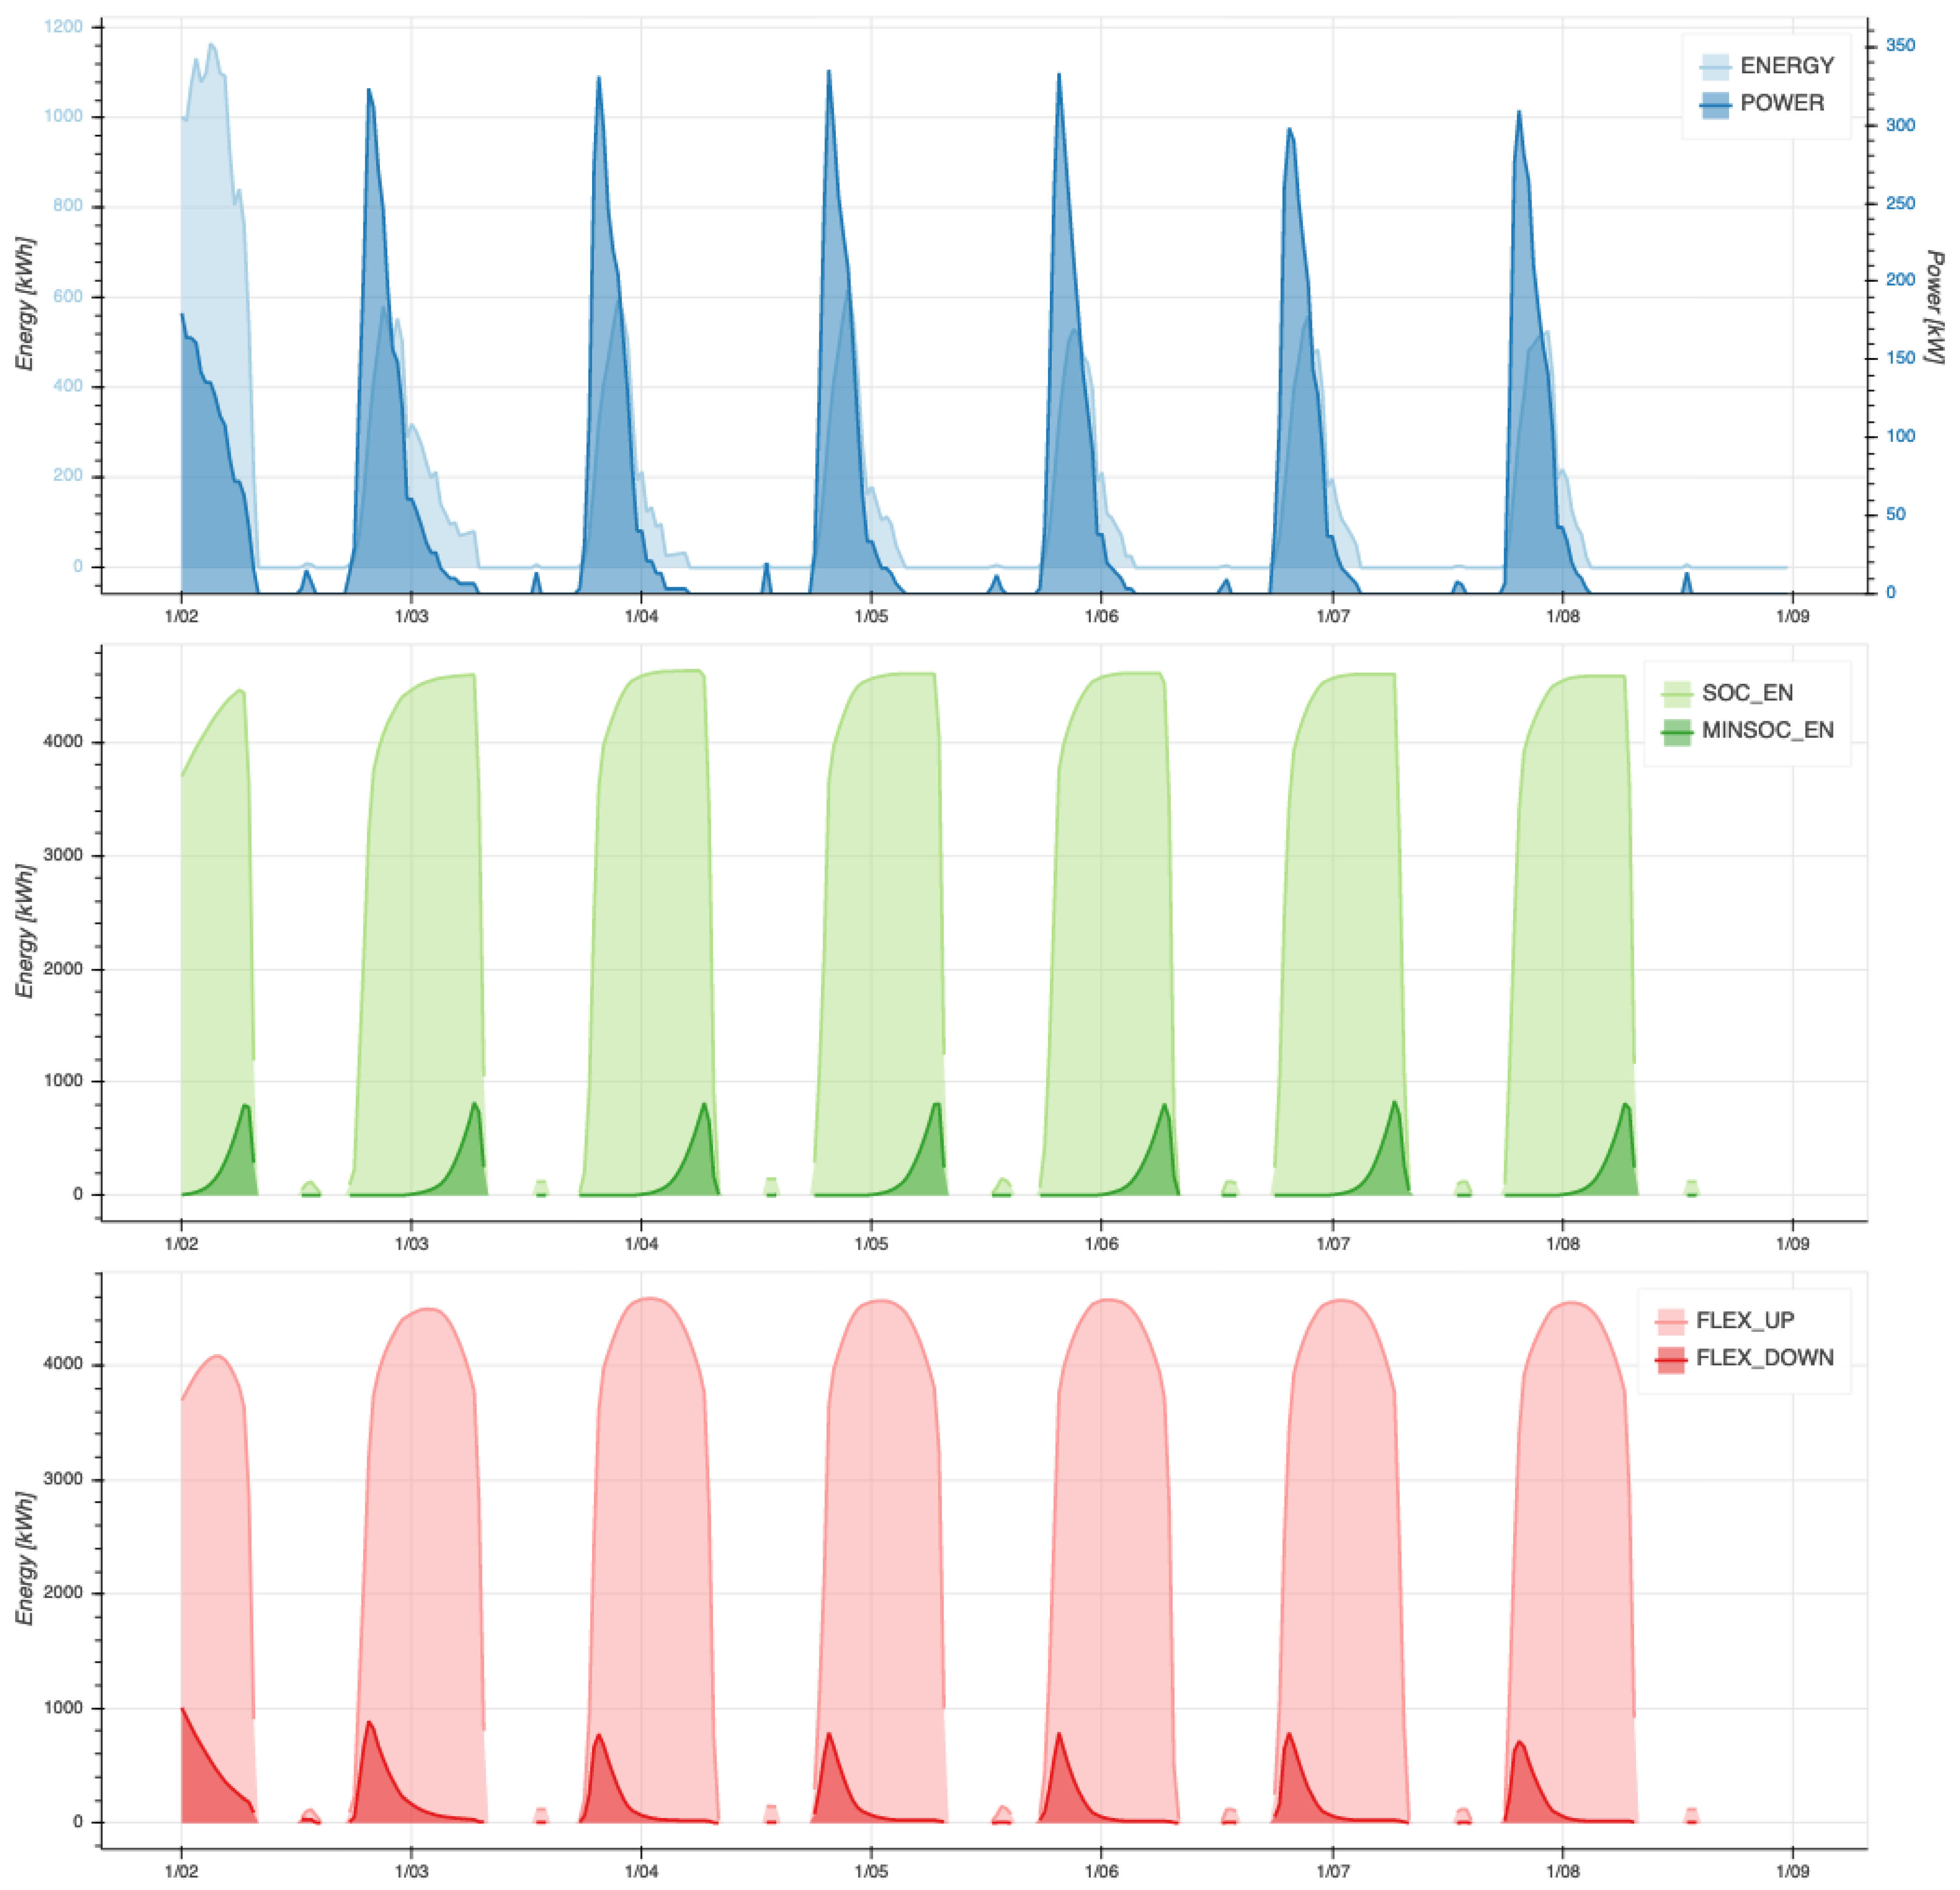
    At the end of the simulation the user is allowed to browse the interactive results in terms of single consumers (see Figure 7) and aggregate (see Figure 8) behavior and energy consumption. In particular, Figure 7 shows for each time step the variables simulated for the time in which the EV is plugged into the charging station: the energy charged into the EV since plug-in (kWh, light blue line); the charging power (kW, blue line); the present SOC of the EV (%, light green dotted line); the MINSOC, which is the minimum amount of energy to be charged in the EV to travel the mileage foreseen after plug-out (%, green dotted line). Figure 8 shows the flexibility available in each time step to an aggregator of the EV charging stations in terms of both energy to be supplied to the grid (V2G strategy, pink curve) and energy to be purchased from the grid (G2V strategy, red curve). In particular, the starting point of the red curve corresponds the sum of the residual energy (SOC) of all the vehicles at the moment in which they plug-in. It is clear that the availability to purchase electricity from the grid decreases while the charging process progresses and it becomes nil when all the EVs are fully charged. All the generated data are downloadable.
    The lists of charging events for each of the consumers’ home recharging stations, including plugin and plugout time instants and car model/recharging device-related information, are available in downloadable json files.

    3.1.4. Output Files

    The user can download the results of the online simulation in the form of json or csv files. All downloadable data are available in the form of single EVs (Figure 7) and also in the aggregate form (Figure 8). Here follows a detailed list of the data arrays available from the simulator:
    • Power: Power supplied to the EV (or fleet of EVs) expressed in kW.
    • Energy: Energy supplied to the EV (or fleet of EVs) expressed in kWh.
    • SOC: State of charge of the EV (or fleet of EVs) expressed in kWh.
    • MINSOC: Represents the minimal amount of SOC that should be present in the EV battery (or fleet of EV batteries) for each time instant, in order to ensure the user required minimal SOC by the time of plugout. Expressed in kWh.
    • FLEXIBILITY UP: Amount of energy of the EV (or fleet of EVs) potentially available to the grid for each time instant, expressed in kWh.
    • FLEXIBILITY DOWN: Amount of energy the grid can potentially supply to the EV (or fleet of EVs) for each time instant, expressed in kWh.
    • PLUGIN/PLUGOUT: Plugin and plugout events for each EV in the fleet expressed in simulator time index and date-time format.

    3.2. Simulink Online Block

    This section deals with the description of the configuration of the Simulink block, its inputs, outputs and the way to interact with it. Taking into account Figure 1, in the following the description of the Initializer.m and Aggregator Online Assistant will be provided.

    3.2.1. Configuration

    The Initializer.m block covers a “bridge” role to handle the dependency of the Simulink block from the cloud-based tool described in the previous section. The initialization of the Simulink tool requires the following steps:
    1.
    Run a batch simulation on the cloud-based tool with the chosen parameters, sampling time, number of vehicles and number of days and download the resulting json files.
    2.
    Run Initializer.m on MATLAB to populate the workspace with the Simulink dependencies and variables.

    3.2.2. Aggregator Online Assistant Core Logic

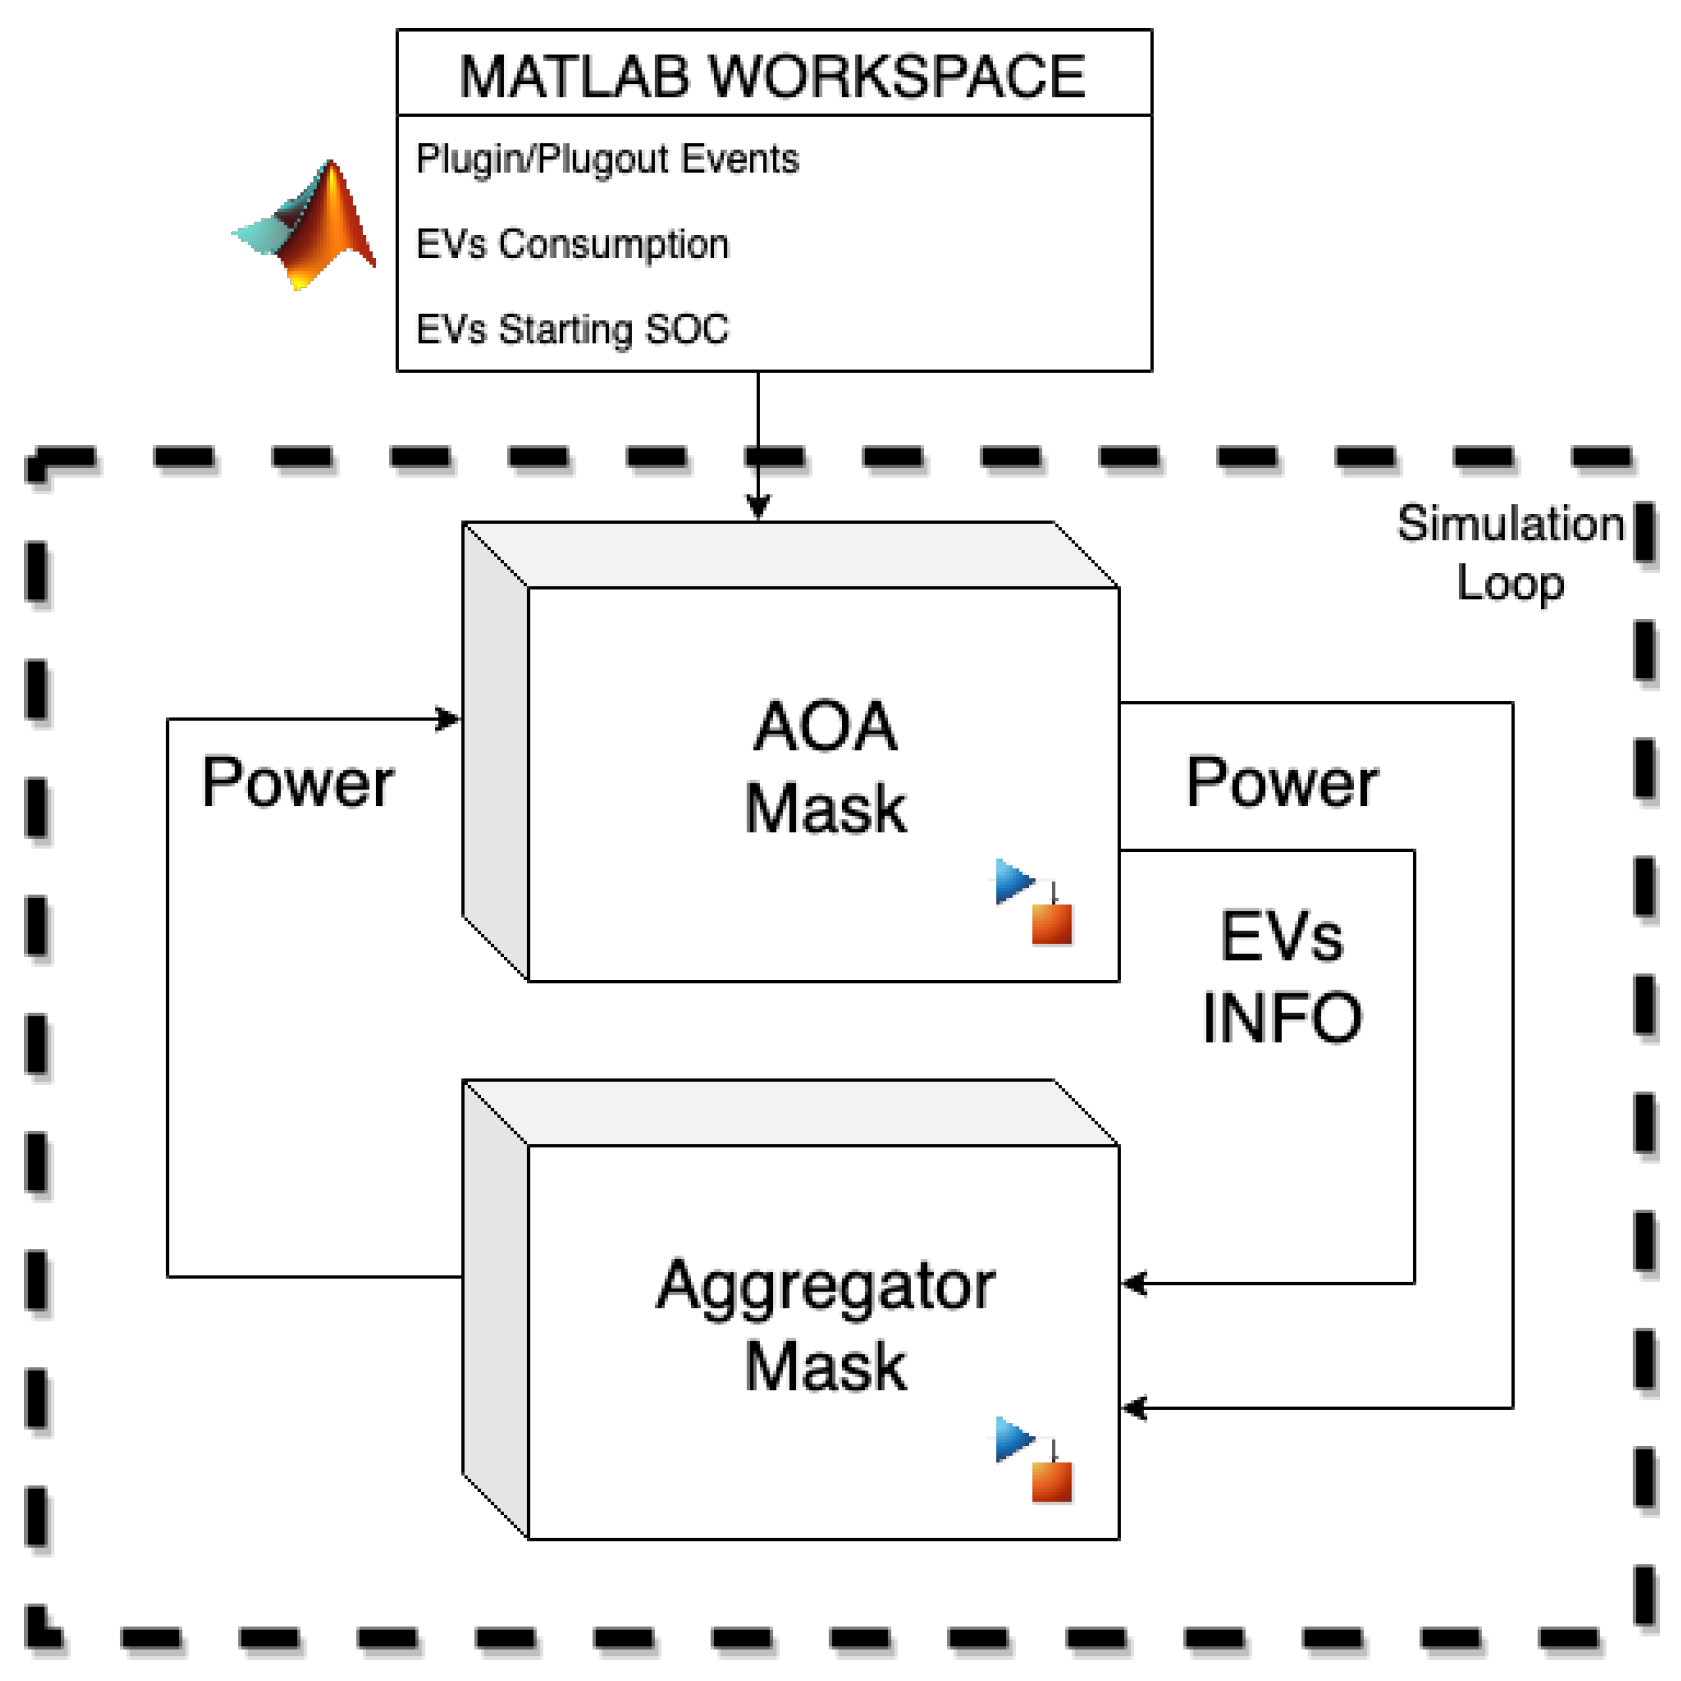
    The Aggregator Online Assistant (AOA) has one input and two outputs. If the input is disconnected it can work as a standalone block and its core logic is the same as that of the cloud-based simulator (i.e., each vehicle, when plugged in, will charge the battery until SOC reaches 100% or until plugout time). The information about the EV model, plugin/plugout instants, energy consumption and actual commuted distances is retained from the cloud-based simulation, while the power setpoint for each EV charging phase can be externally set. This implies that an external block (e.g., an aggregator, the owner of the charging stations, a grid operator, a scheduler, etc.) can simulate and control in real time the charging and discharging power for each EV, while at the same time monitoring their status (see Figure 9).
    The I/Os of the AOA block in Figure 9 are detailed in the following sections.

    3.2.3. AOA Inputs

    • Power: an array of power values (kW) used as charging/discharging setpoints of the charging stations. The length of the array is equal to the number of EVs considered and each element of the array will refer to a particular EV.
      -
      Positive values will be considered as a charging action for the given time instant in a G2V strategy. If the power value exceeds the capability of the given consumer’s station it is saturated to the maximum.
      -
      Negative values are treated as a discharge action for the given time instant in a V2G strategy.
      -
      Zeroes are treated as an “hold on” command. The given EV will neither discharge nor recharge for the given time instant.
      -
      NaNs (Not a Number) are treated as a “maximum power” instruction. The given EV will recharge at the maximum power allowed (as the cloud-based tool does).

    3.2.4. AOA Outputs

    • Power: As for the input, this is an ordered array containing the actual charged/discharged power for each EV at the given time instant.
    • SOC: Ordered array of each EV’s actual state of charge expressed in % value with respect to the maximum Battery Capacity.
    • Time Until Plugout: Ordered array where each value represents the remaining time instants until the given EV will be plugged out. In case an EV is not plugged in the corresponding value is zero.
    • Minimal SOC: Ordered array representing the minimum amount of SOC required by each EV at the given time instant in order to satisfy the user’s requirements at the plugout time (Time Until Plugout). In case the EV is not plugged in at the time this array is read, the respective returned value is zero.
    • Battery Capacity: Ordered array containing the maximum battery capacity for each EV in terms of kWh. This array contains constant values for the whole simulation time. Future updates will allow the variability of this parameter for each EV in order to model (or to externally predict) the battery state of health degradation.
    • Home Recharging Capability: Ordered array containing the maximum home charging station power (kW). This array contains constant values for the whole simulation time.

    4. Case Study

    Although the simulator is able to deal with both G2V and V2G actions for an aggregate of EVs (depending on the sign of the input power to the vehicles), in this section a real peak shaving application is presented. In particular, a cap for the global charging power absorbed from the grid is set while constraints regarding the commuting distances and minimum SOC for all the EVs are still valid. This condition would require the design of a supervisor able to schedule the charging of the vehicles.
    A population of 100 EVs is created via the online tool and their charging/commuting constraints are generated for the period of one month. The options used to run the simulation can be found in Figure 2a,b.
    Inside the Simulink environment a custom power regulator is then realized through a fuzzy inference system, detailed in the following, able to provide a charging priority rank based on the following inputs:
    ChargeRequisite = M I N S O C S O C
    RechAvailability = t p l u g o u t · h o m e p w b a t t c a p
    SOC
    The priority rank is then used to pick the vehicles based on a deterministic descending order until the power cap is reached.

    4.1. Fuzzy Inference

    A zero-order Takagi–Sugeno (TS) FIS is designed to obtain priorities from the input features. The membership functions considered for the inputs are trapezoidal functions. The trapezoidal fuzzy set S in the universe of discourse U R with the membership function μ S is parameterized by four real scalar parameters: ( a , b , c , d ) where a < b < c < d . The trapezoidal membership function is described mathematically as follows:
    μ S ( x ) = 0 , x < a x a b a , a < x < b 1 , b < x < c d x d c , c < x < d 0 , x > d
    When b = c , the triangular function can be considered as a particular case of the trapezoidal one. The fuzzy system is composed of three inputs and one crisp output (the priority level) and a weighted average is used as the defuzzification method. The values of the fuzzy sets are reported in Table 2.

    4.2. Results

    Different scenarios with a variable power cap are considered. In particular the cap is set to 70, 50, 23, 18, 14 and 10% of the maximum power required when all vehicles are charging at the same time (equal to 450 kW in our scenario).
    For each test a set of performance indicators is computed to assess the effectiveness of the solution in terms of “charging buffer”, i.e., the difference between the SOC at plugout time and the minimum SOC required to perform the next commuting distance:
    buff = SOC MINSOC
    Results are reported in Table 3. A one-week plot depicting the global instant power provided by the grid in the different power limit scenarios is shown in Figure 10.
    As reported in Table 3, the fuzzy-based charging priority allocation ensures a positive mean buffer down to a 14% power limit. For limit values equal to or below 10% the mean buffer results are negative, implying requirements are not met for a certain number of EVs at the time of plugout (morning or post-lunch departure).
    The buff-perc column shows the percentage of plugout events (among all EVs and during the whole trial time) where the EV requirements are completely fulfilled. Around the 23% limit it shows 13.3% of plugout events where the value expressed by Equation (7) is negative in spite of the positive buffer mean value. This may imply low absolute values of buff distributed among a large array of vehicles, thus determining a decrease in the buff-perc value while maintaining positive buff-mean values.
    Finally, in Figure 11 it is possible to appreciate the implemented logic in action during an actual nighttime recharging session for a small batch of vehicles. The power cap is 10% and the height of the SOC step varies depending on the capacity of the domestic charging station. Four different heights of the steps are evident, corresponding to 3.3, 4.5, 6 and 11 kW. The beginning of each series (curve) corresponds to the plugin time of the EV; the end of the series corresponds to the plugout. The sampling time is 30 minutes. Whenever the charging stops and starts a plateau this happens because that EV has reached a lower priority level than another vehicle. As regards the profile of the individual EVs, the following considerations can be made. EV1: at the plugin time, the battery SOC is already sufficient for the next day, giving as output a very low priority. This explains why the vehicle starts charging very late. EV2: at the time of connection to the charging station, the SOC is quite low (20%) but other EVs have higher priority because its MINSOC is lower than others and the capacity of the charging station is higher than others (6 kW). EV9: starts from a very low SOC but does not start the charge immediately because it is connected to a charging station with high capacity (6 kW); in addition, other vehicles have higher priority since it does not have to reach a very high SOC and, since the estimated plugout time is sufficient to reach the goal, it starts charging later. EV3: has a similar behavior to EV9 but with even more capacity for its charging station (11 kW). EV4 arrives first with a rather low SOC; the first useful moment starts charging and keeps a high priority for a long time; when its SOC approaches MINSOC, it loses priority over other vehicles. EV5: has charged the car before entering the house and connects it despite it being 100% charged; this EV may provide flexibility to the domestic microgrid or to the national electricity grid in the case of V2B or V2G. EV6: this behaves like EV9 with a lower priority because it has a lower MINSOC and a higher SOC at the plugin time. EV7: at the plugin time, the SOC of the battery is high enough, thus it has a lower priority than the other EVs, even connected in subsequent instants; the power of its charging station is low (3.3 kW). EV8: at the time of connection to the charging station, the SOC of the battery is very low and it has a high MINSOC. At the first available instant the charge begins with a very high priority compared to the other EVs; the priority decreases as the SOC approaches the MINSOC. EV10: has the same behavior as EV8.

    5. Conclusions

    Recently, due to the growing interest in electric vehicles (EVs), the investigation of grid-to-vehicle and vehicle-to-grid strategies has become a key concern in many research areas. Indeed, each EV can be seen as a distributed energy storage unit, thus giving each customer a potentially active role in the energy distribution scenario. Due to the lack of solutions, in this paper a scalable EV population simulator, namely ePopSimulator, has been presented as a test and deploy environment for demand-side management strategies. The proposed tool provides individual and aggregated charge, discharge and plug-in/-out event data of a custom, geographically defined population of EVs, considering both home and public charging stations. The population is generated on the basis of statistical data (which can be obtained by data-driven approaches or a priori assumptions) including commuting distances, vehicle models, traffic and social behavior of the owners. A case study has been presented to show a potential application in a peak-shaving scenario. The current version of the simulator is accessible from www.energysystems.diism.univpm.it, accessed on 10 March 2021 (provisionally at http://193.206.121.28:32000, accessed on 24 February 2021).

    Author Contributions

    Conceptualization, L.C., S.C. and M.D.S.; methodology, L.C., M.D.S. and S.C.; software, S.C.; validation, M.D.S., G.G. and G.C.; writing—original draft preparation, L.C., S.C., G.C., M.D.S. and G.G.; writing—review and editing, L.C. and G.C.; supervision, G.C. and G.G.; funding acquisition, G.C., G.G. and M.D.S. All authors have read and agreed to the published version of the manuscript.

    Funding

    The work is part of the Research and Innovation Project “Community Energy Storage: Gestione Aggregata di Sistemi d’Accumulo dell’Energia in Power Cloud (ComESto)”—cod. ARS01_01259. The project has been jointly funded by the European Union and Italian Research and University Ministry (MIUR) under the Programma Operativo Nazionale “Ricerca e Innovazione” 2014–2020 (PON “R&I” 2014–2020).

    Institutional Review Board Statement

    Not Applicable.

    Informed Consent Statement

    Not Applicable.

    Data Availability Statement

    All data can be found on the simulator webpage.

    Conflicts of Interest

    The authors declare no conflict of interest.

    References

    1. International Energy Agency (IEA). Global EV Outlook 2019: Scaling up the Transition to Electric Mobility. Available online: https://www.iea.org/reports/global-ev-outlook-2019 (accessed on 20 February 2020).
    2. Expert Group 3 (EG3). Final Report: Demand Side Flexibility, Perceived Barriers and Proposed Recommendations. European Smart Grid Task Force, EU Commission April 2019. Available online: https://ec.europa.eu/energy/sites/ener/files/documents/eg3_final_report_demand_side_flexiblity_2019.04.15.pdf (accessed on 23 February 2021).
    3. Ciabattoni, L.; Comodi, G.; Ferracuti, F.; Foresi, G. AI-Powered Home Electrical Appliances as Enabler of Demand-Side Flexibility. IEEE Consum. Electron. Mag. 2020, 9, 72–78. [Google Scholar] [CrossRef]
    4. Tan, K.M.; Ramachandaramurthy, V.K.; Yong, J.Y. Integration of electric vehicles in smart grid: A review on vehicle to grid technologies and optimization techniques. Renew. Sustain. Energy Rev. 2016, 53, 720–732. [Google Scholar] [CrossRef]
    5. Rodríguez-Molina, J.; Castillejo, P.; Beltran, V.; Martínez-Núñez, M. A Model for Cost-Benefit Analysis of Privately Owned Vehicle-to-Grid Solutions. Energies 2020, 13, 5814. [Google Scholar] [CrossRef]
    6. Di Somma, M.; Ciabattoni, L.; Comodi, G.; Graditi, G. Managing plug-in electric vehicles in eco-environmental operation optimization of local multi-energy systems. Sustain. Energy Grids Netw. 2020, 23, 100376. [Google Scholar] [CrossRef]
    7. Kern, T.; Dossow, P.; von Roon, S. Integrating Bidirectionally Chargeable Electric Vehicles into the Electricity Markets. Energies 2020, 13, 5812. [Google Scholar] [CrossRef]
    8. Mohammad, A.; Zamora, R.; Lie, T.T. Integration of Electric Vehicles in the Distribution Network: A Review of PV Based Electric Vehicle Modelling. Energies 2020, 13, 4541. [Google Scholar] [CrossRef]
    9. Zhang, J.; Che, L.; Wang, L.K.; Madawala, U. Game-Theory Based V2G Coordination Strategy for Providing Ramping Flexibility in Power Systems. Energies 2020, 13, 5008. [Google Scholar] [CrossRef]
    10. Cano, Z.P.; Banham, D.; Ye, S.; Hintennach, A.; Lu, J.; Fowler, M.; Chen, Z. Batteries and fuel cells for emerging electric vehicle markets. Nat. Energy 2018, 3, 279–289. [Google Scholar] [CrossRef]
    11. Zhang, H.; Hu, Z.; Xu, Z.; Song, Y. Evaluation of Achievable Vehicle-to-Grid Capacity Using Aggregate PEV Model. IEEE Trans. Power Syst. 2017, 32, 784–794. [Google Scholar] [CrossRef]
    12. Ciabattoni, L.; Cardarelli, S.; Di Somma, M.; Graditi, G.; Comodi, G. A New Hybrid Software Tool for the Simulation of Energy Usage in a Population of Electric Vehicles. In Proceedings of the 2020 IEEE International Conference on Environment and Electrical Engineering and 2020 IEEE Industrial and Commercial Power Systems Europe (EEEIC/I CPS Europe), Madrid, Spain, 9–12 June 2020; pp. 1–6. [Google Scholar] [CrossRef]
    13. Canizes, B.; Soares, J.; Costa, A.; Pinto, T.; Lezama, F.; Novais, P.; Vale, Z. Electric vehicles’ user charging behaviour simulator for a smart city. Energies 2019, 12, 1470. [Google Scholar] [CrossRef] [Green Version]
    14. Rigas, E.S.; Karapostolakis, S.; Bassiliades, N.; Ramchurn, S.D. EVLibSim: A tool for the simulation of electric vehicles’ charging stations using the EVLib library. Simul. Model. Pract. Theory 2018, 87, 99–119. [Google Scholar] [CrossRef] [Green Version]
    15. Alegre, S.; Míguez, J.V.; Carpio, J. Modelling of electric and parallel-hybrid electric vehicle using Matlab/Simulink environment and planning of charging stations through a geographic information system and genetic algorithms. Renew. Sustain. Energy Rev. 2017, 74, 1020–1027. [Google Scholar] [CrossRef]
    16. Bedogni, L.; Bononi, L.; Di Felice, M.; D’Elia, A.; Mock, R.; Morandi, F.; Rondelli, S.; Cinotti, T.S.; Vergari, F. An integrated simulation framework to model electric vehicle operations and services. IEEE Trans. Veh. Technol. 2015, 65, 5900–5917. [Google Scholar] [CrossRef]
    17. Novosel, T.; Perković, L.; Ban, M.; Keko, H.; Pukšec, T.; Krajačić, G.; Duić, N. Agent based modelling and energy planning–Utilization of MATSim for transport energy demand modelling. Energy 2015, 92, 466–475. [Google Scholar] [CrossRef] [Green Version]
    18. Cardoso, G.; Stadler, M.; Bozchalui, M.C.; Sharma, R.; Marnay, C.; Barbosa-Póvoa, A.; Ferrão, P. Optimal investment and scheduling of distributed energy resources with uncertainty in electric vehicle driving schedules. Energy 2014, 64, 17–30. [Google Scholar] [CrossRef]
    19. Arancibia, A.; Strunz, K. Modeling of an electric vehicle charging station for fast DC charging. In Proceedings of the 2012 IEEE International Electric Vehicle Conference, Greenville, SC, USA, 4–8 March 2012; pp. 1–6. [Google Scholar]
    20. Pillai, J.R.; Bak-Jensen, B. Impacts of electric vehicle loads on power distribution systems. In Proceedings of the 2010 IEEE Vehicle Power and Propulsion Conference, Lille, France, 1–3 September 2010; pp. 1–6. [Google Scholar]
    21. Karnouskos, S.; De Holanda, T.N. Simulation of a smart grid city with software agents. In Proceedings of the 2009 Third UKSim European Symposium on Computer Modeling and Simulation, Athens, Greece, 25–27 November 2009; pp. 424–429. [Google Scholar]
    22. Shumei, C.; Xiaofei, L.; Dewen, T.; Qianfan, Z.; Liwei, S. The construction and simulation of V2G system in micro-grid. In Proceedings of the 2011 International Conference on Electrical Machines and Systems, Beijing, China, 20–23 August 2011; pp. 1–4. [Google Scholar]
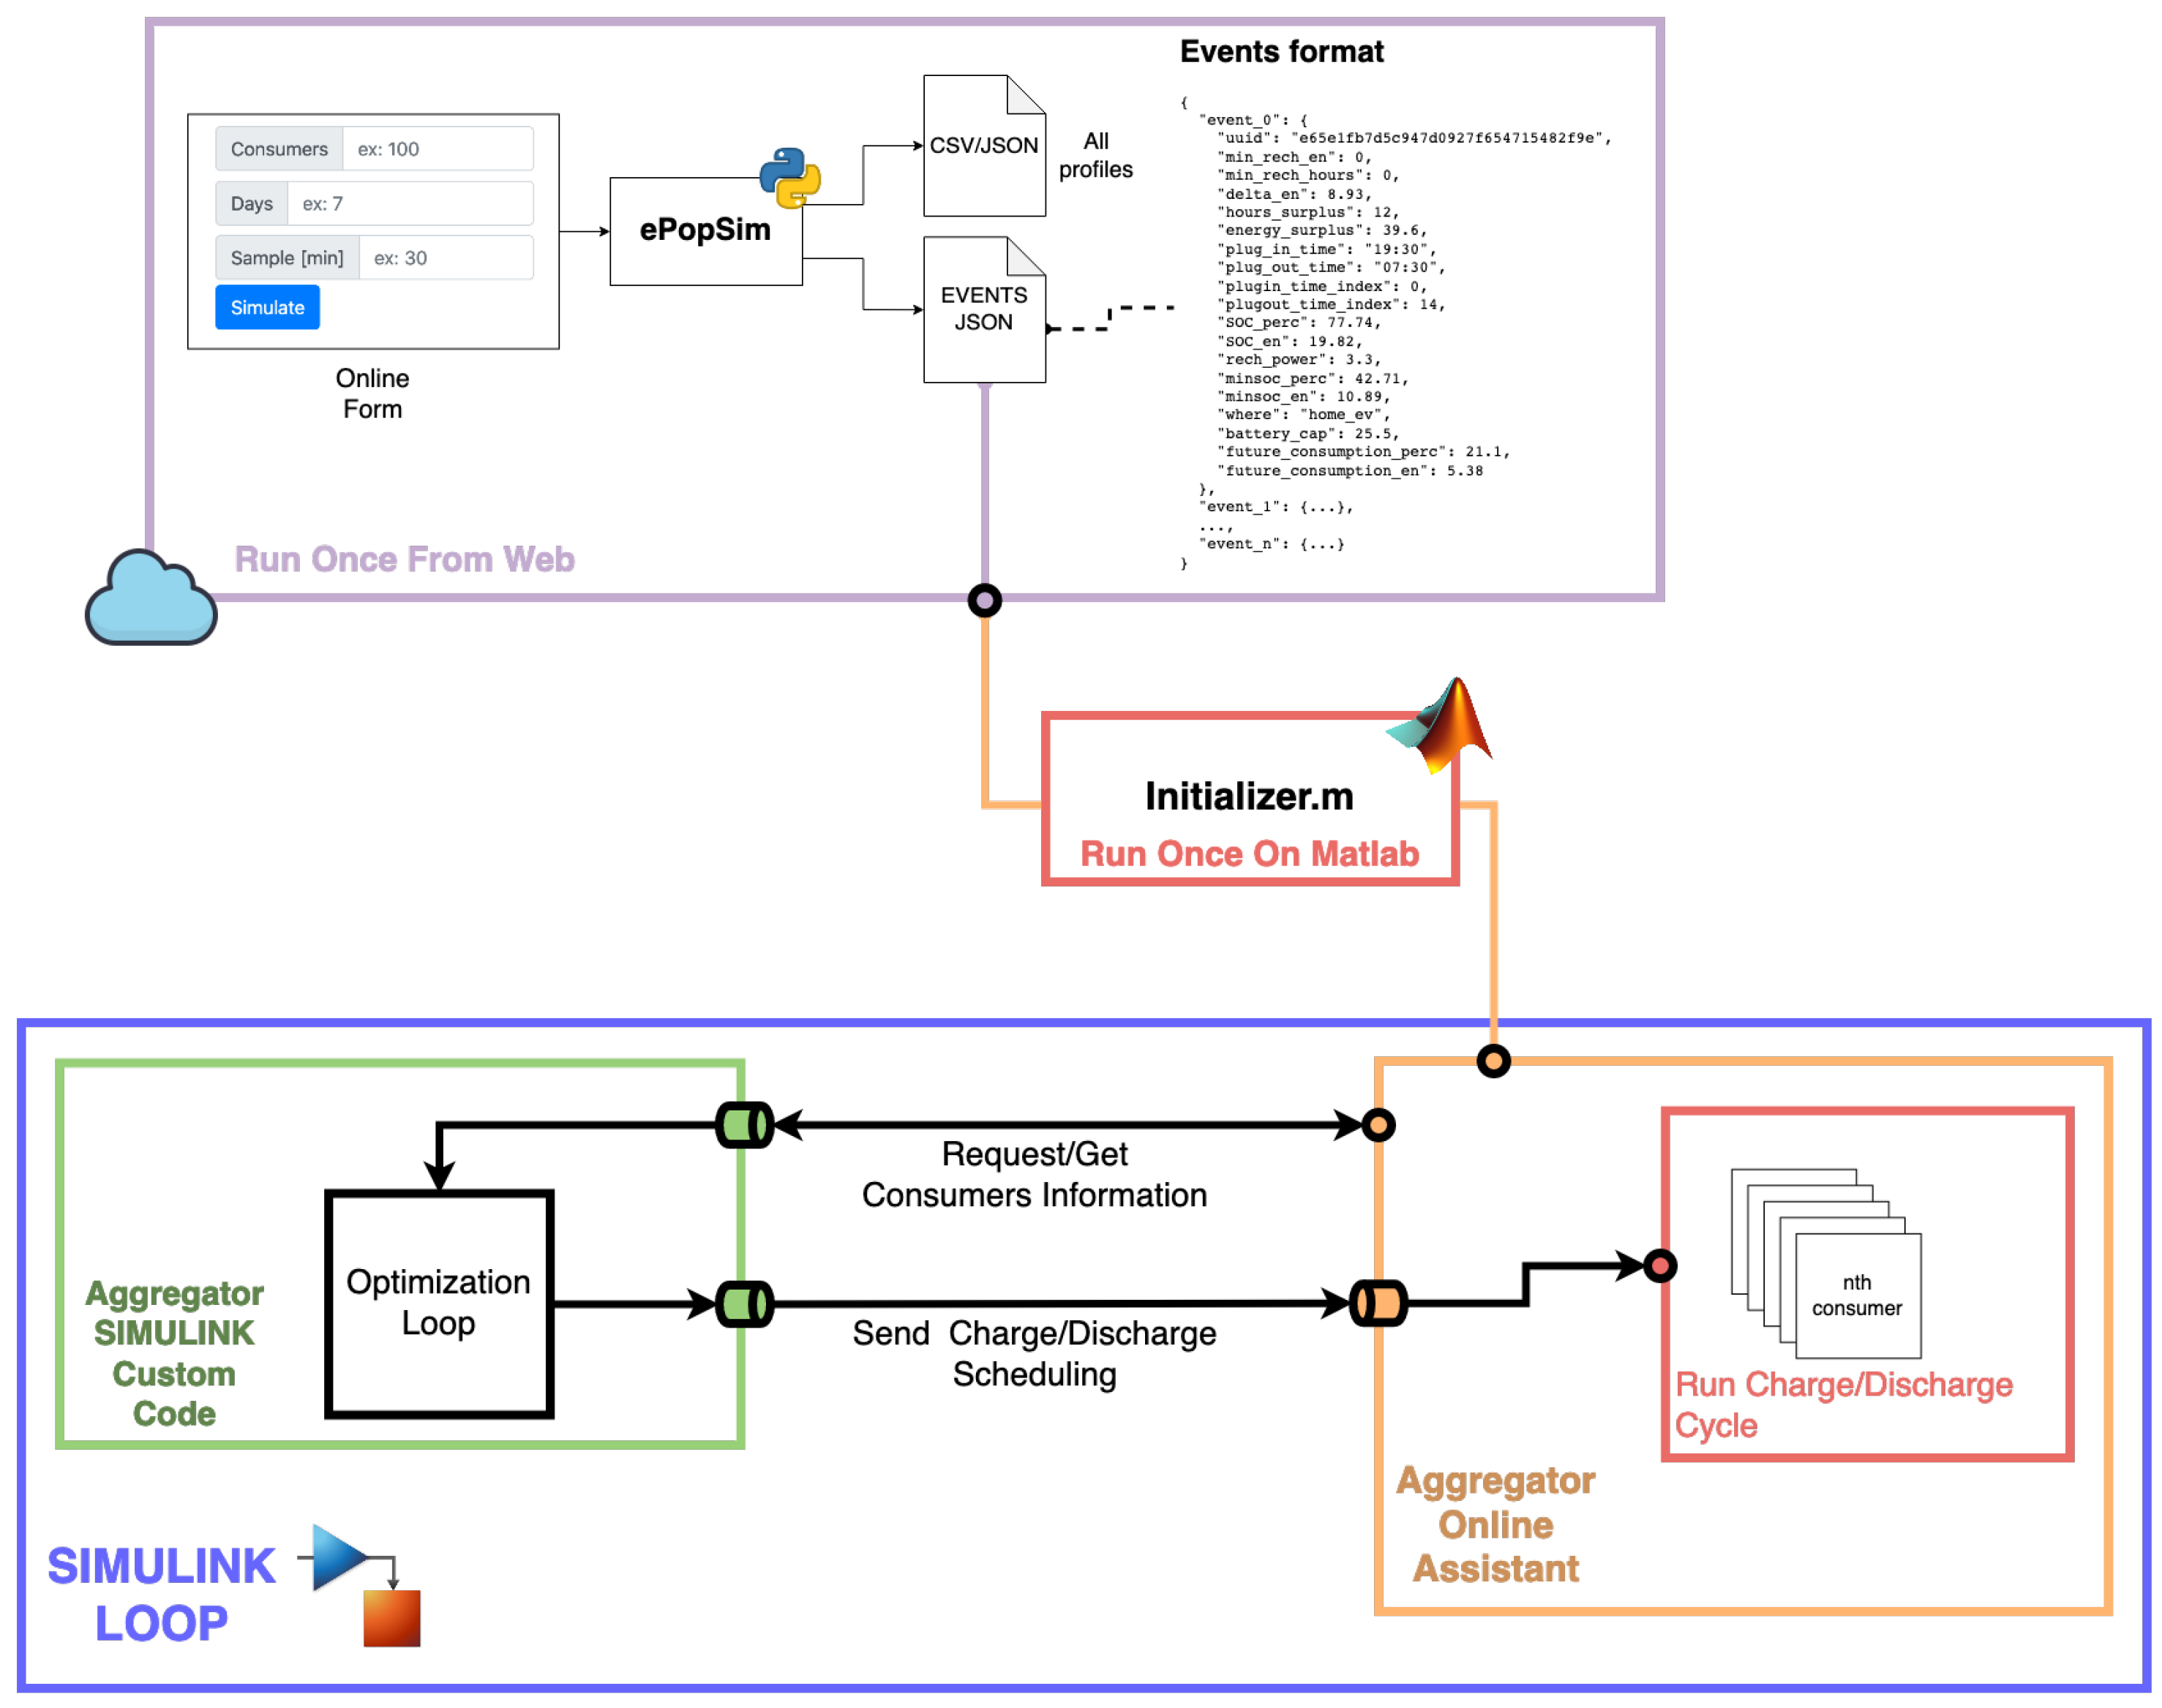
    Figure 1. Graphical representation of the currently implemented architecture of the presented software. The top frame represents the cloud-accessible software to operate an aggregator-less simulation. Simulated customer requirements and habits are then downloaded and fed to the offline Simulink block through an Initializer.m script. The bottom frame represents the customizable offline Simulink-based simulator. The orange box, or Aggregator Online Assistant (AOA), explained in detail in the following sections, is in charge of applying the recharging rules imposed by the green box (custom aggregator logic), following the simulated habits and requirement constraints of the EV owners simulated in the online block.
    Figure 1. Graphical representation of the currently implemented architecture of the presented software. The top frame represents the cloud-accessible software to operate an aggregator-less simulation. Simulated customer requirements and habits are then downloaded and fed to the offline Simulink block through an Initializer.m script. The bottom frame represents the customizable offline Simulink-based simulator. The orange box, or Aggregator Online Assistant (AOA), explained in detail in the following sections, is in charge of applying the recharging rules imposed by the green box (custom aggregator logic), following the simulated habits and requirement constraints of the EV owners simulated in the online block.
    Energies 14 01558 g001
    Figure 2. Initial steps of the online simulation tool.
    Figure 2. Initial steps of the online simulation tool.
    Energies 14 01558 g002
    Figure 3. The user has access to a number of tweakable parameters for each subgroup, including commuting distance distribution and budget distribution (Figure 4), as well as morning, lunch and evening plugin/plugout time continuous distributions (Figure 5).
    Figure 3. The user has access to a number of tweakable parameters for each subgroup, including commuting distance distribution and budget distribution (Figure 4), as well as morning, lunch and evening plugin/plugout time continuous distributions (Figure 5).
    Energies 14 01558 g003
    Figure 4. Two different option settings for commuting distances and budget distributions (red and blue bars, respectively, in the two lines). The left panels show different examples of user inputs. The right panels show the generated discrete distribution for 1000 consumers.
    Figure 4. Two different option settings for commuting distances and budget distributions (red and blue bars, respectively, in the two lines). The left panels show different examples of user inputs. The right panels show the generated discrete distribution for 1000 consumers.
    Energies 14 01558 g004
    Figure 5. Morning and evening distribution density and cumulative functions relative to plugin events (first row) and plugout events (second row). The different curve colors highlight the possible user choices in order to determine different customers’ behavior.
    Figure 5. Morning and evening distribution density and cumulative functions relative to plugin events (first row) and plugout events (second row). The different curve colors highlight the possible user choices in order to determine different customers’ behavior.
    Energies 14 01558 g005
    Figure 6. Customer’s daily routine.
    Figure 6. Customer’s daily routine.
    Energies 14 01558 g006
    Figure 7. Plot of a single consumer’s simulated week of charge/discharge cycles. The blue and light-blue curves represent the power and energy supplied to the EV by the grid for each time sample. The dotted curves represent the SOC and MINSOC (i.e., minimum amount of energy to be charged in the EV)values of the EV for each time sample. The light-blue frames represent the time epochs in which the EV is actually connected to the grid.
    Figure 7. Plot of a single consumer’s simulated week of charge/discharge cycles. The blue and light-blue curves represent the power and energy supplied to the EV by the grid for each time sample. The dotted curves represent the SOC and MINSOC (i.e., minimum amount of energy to be charged in the EV)values of the EV for each time sample. The light-blue frames represent the time epochs in which the EV is actually connected to the grid.
    Energies 14 01558 g007
    Figure 8. Aggregate output for 100 consumers, 7 days and a sampling time of 30 min. The first panel shows the supplied power and energy from the grid to the EVs. The second panel shows the EV fleet SOC and MINSOC in terms of energy for each time sample. The third panel shows the energy available to the grid from the EV fleet (pink curve) and the energy that could be supplied to the EV fleet (red curve) for each time sample.
    Figure 8. Aggregate output for 100 consumers, 7 days and a sampling time of 30 min. The first panel shows the supplied power and energy from the grid to the EVs. The second panel shows the EV fleet SOC and MINSOC in terms of energy for each time sample. The third panel shows the energy available to the grid from the EV fleet (pink curve) and the energy that could be supplied to the EV fleet (red curve) for each time sample.
    Energies 14 01558 g008
    Figure 9. Schematic of the offline simulator architecture. See Figure 1 for a more detailed representation.
    Figure 9. Schematic of the offline simulator architecture. See Figure 1 for a more detailed representation.
    Energies 14 01558 g009
    Figure 10. One week of global charging profiles. The power limits depicted are 100% (i.e., no limit, blue line), 70% (cyan line), 50% (green line), 23% (yellow line), 18% (yellow orange line), 14% (orange line) and 10% (red line).
    Figure 10. One week of global charging profiles. The power limits depicted are 100% (i.e., no limit, blue line), 70% (cyan line), 50% (green line), 23% (yellow line), 18% (yellow orange line), 14% (orange line) and 10% (red line).
    Energies 14 01558 g010
    Figure 11. Extract from a simulation depicting the behavior of EV1, EV2 and EV3 as they are stopped until more urgent minimum requirements are met by other vehicles, such as EV7.
    Figure 11. Extract from a simulation depicting the behavior of EV1, EV2 and EV3 as they are stopped until more urgent minimum requirements are met by other vehicles, such as EV7.
    Energies 14 01558 g011
    Table 1. Overview of the different simulation approaches presented in Section 2.
    Table 1. Overview of the different simulation approaches presented in Section 2.
    CitationVehicle
    Type
    Vehicle
    Modeling
    Price Driven
    Vehicle Choice
    Plug-In/-Out
    Scheduling
    Customer Daily
    Routine Modeling
    Daily Charge
    Data Generation
    Traffic/Trip
    Simulation
    Home
    Recharging
    Public Station
    Recharging
    Simulator
    (Language)
    Present workEV, HybridYesYesYesYesYes (1,10,15,30)
    minutes resolution
    YesYesYesCustom (Python, Matlab)
    [13]EVPartialNoNoPartialNoNoYesYesCustom (R - RStudio)
    [14]EVYesNoNoNoNoNoNoYesEVLibSim (Java)
    [15]EV, HybridYes (autonomy
    estimation)
    NoNoNoNoYesNoYesCustom (Matlab/Simulink)
    [16]EVPartialNoPartialPartialYesYesNoYesOmnet++,
    SUMO, VEINS
    [17]EV + CO 2 NoNoNoPartial
    (Statistical)
    NoYesNoNoMATSim,
    EnergyPLAN
    [18]EVNoNoNoPartialYesYesYesYesDER-CAM
    [19]EVYes
    (Battery model)
    NoNoNoPartialNoNoYesCustom (Matlab/Simulink)
    [20]EVYesNoYesYesYesNoYesNoCustom
    [21]EVYesNoNoYesYesNoYesNoJADE
    Table 2. Fuzzy sets of the input and output variables: linguistic terms and their corresponding trapezoidal fuzzy set parameters.
    Table 2. Fuzzy sets of the input and output variables: linguistic terms and their corresponding trapezoidal fuzzy set parameters.
    Input VariablesLinguistic TermsFuzzy Sets ( a , b , c , d )
    ChargeRequisite [%]Negative−100, −100, −20, 0
    Zero−20, 0, 0, 10
    Lightly positive0, 10, 20, 30
    Positive10, 30, 100, 100
    RechAvailability [%]Low0, 0, 30, 45
    Medium30, 45, 60, 75
    High60, 75, 100, 100
    SOC [%]Low0, 0, 30, 40
    Medium30, 40, 60, 70
    High60, 70, 100, 100
    Output VariableLinguistic TermsFuzzy Sets (Value)
    PriorityNull0
    Low0.4
    Medium0.6
    High0.8
    Absolute1
    Table 3. Charging buffer values, computed as in Equation (7), are reported in terms of mean, median, standard deviation, minimum value and maximum value over the whole number of charge cycles and EV. The buff-perc term indicates the percentage of EVs that are above the MINSOC value at the end of each charge cycle. The last two columns of the table report the mean and standard deviation of the instant power provided by the power regulator.
    Table 3. Charging buffer values, computed as in Equation (7), are reported in terms of mean, median, standard deviation, minimum value and maximum value over the whole number of charge cycles and EV. The buff-perc term indicates the percentage of EVs that are above the MINSOC value at the end of each charge cycle. The last two columns of the table report the mean and standard deviation of the instant power provided by the power regulator.
    %Buff-Mean (%)Buff-Median (%)Buff-Min (%)Buff-Max (%)Buff-Perc (%)PW-Max (kW)
    Test
    nolimit66.866.29.897.9100.0435
    limit7066.866.25.297.9100.0297
    limit5061.454.34.997.9100.0198
    limit2330.217.8−13.397.980.399
    limit1811.4−4.9−37.897.932.278
    limit142.9−9.3−60.897.924.760
    limit10−9.2−26.5−85.297.923.433
    Publisher’s Note: MDPI stays neutral with regard to jurisdictional claims in published maps and institutional affiliations.

    Share and Cite

    MDPI and ACS Style

    Ciabattoni, L.; Cardarelli, S.; Somma, M.D.; Graditi, G.; Comodi, G. A Novel Open-Source Simulator Of Electric Vehicles in a Demand-Side Management Scenario. Energies 2021, 14, 1558. https://doi.org/10.3390/en14061558

    AMA Style

    Ciabattoni L, Cardarelli S, Somma MD, Graditi G, Comodi G. A Novel Open-Source Simulator Of Electric Vehicles in a Demand-Side Management Scenario. Energies. 2021; 14(6):1558. https://doi.org/10.3390/en14061558

    Chicago/Turabian Style

    Ciabattoni, Lucio, Stefano Cardarelli, Marialaura Di Somma, Giorgio Graditi, and Gabriele Comodi. 2021. "A Novel Open-Source Simulator Of Electric Vehicles in a Demand-Side Management Scenario" Energies 14, no. 6: 1558. https://doi.org/10.3390/en14061558

    APA Style

    Ciabattoni, L., Cardarelli, S., Somma, M. D., Graditi, G., & Comodi, G. (2021). A Novel Open-Source Simulator Of Electric Vehicles in a Demand-Side Management Scenario. Energies, 14(6), 1558. https://doi.org/10.3390/en14061558

    Note that from the first issue of 2016, this journal uses article numbers instead of page numbers. See further details here.

    Article Metrics

    Back to TopTop