1. Introduction
The construction sector is an important field of economy, responsible for approximately 10% of Gross Domestic Product in European Union member states. Due to the high energy consumption, this sector is responsible for over 36% of the world’s carbon dioxide emissions, which signals a high reduction potential [
1,
2]. A major part of the environmental costs related to buildings is connected to their operational stage [
3]. With the increased attention paid to greenhouse gases, many reduction policies were addressed to this branch, including a thermal-refurbishment actions support.
Financial support programs implemented in Poland since 1998 [
4] included and still include public buildings owned by local government units, which are used to carry out the tasks of these units [
5,
6]. This applies to buildings regardless of their location, i.e., in urban and rural areas. First of all, local government units indicated educational facilities for thermal retrofitting investments, and then others, such as offices, related to medical services or cultural activities of the city or commune [
7,
8]. Co-financing programs were particularly useful in units that did not have a sufficient budget to carry out a thermal retrofitting investment from their own funds [
9,
10]. Among other things, due to the lack of financial resources, many buildings remained in an unsatisfactory technical condition and were characterized by a low energy standard, which made it impossible to maintain the thermal comfort parameters required by the regulations in the rooms. Therefore, when opportunities appeared, many units took advantage of various types of support programs [
7,
10]. The main goal of each of the programs was to determine the scope of improvements that can be implemented in the building in order to conduct its comprehensive retrofitting.
Only comprehensive actions, including the external envelopes of the buildings and technical systems that constitute its equipment, such as heating, cooling, hot water preparation and lighting systems, bring about significant energy savings, and thus usually a reduction in the emission of pollutants into the atmosphere [
11,
12]. The analysis of the structure of the building’s final energy demand shows that in buildings not modernized in terms of energy, built in the last century, regardless of their function, the energy necessary to cover the needs related to space heating has the largest share [
13,
14]. Therefore, actions leading to the reduction of heat loss through transmission and increasing the efficiency of the heating system have a great impact on improving the energy quality of the building [
15,
16].
A building’s energy assessment can be performed by determining its annual energy demand indexes, most often expressed in kWh·m
−2∙year
−1. The analysis of these indexes and their comparison with the indexes characterizing other buildings, as well as comparing them to national standards, allows the energy quality of a building to be determined. Calculating the energy balance of a building, taking into account the total efficiency of the heating system, as well as the type of fuel or energy used for heating, allows for the determination of three energy indexes. The first one is related to the usable energy demand index for heating and ventilation (
UEH). The second one, which takes into account the total efficiency of the heating system, is called the final energy consumption for heating (
FEH). The third is called the non-renewable primary energy index for heating (
PEH), the value of which additionally depends on the type of fuel or energy used to cover the heating needs of the building [
8,
17].
The above description shows that the
UEH index characterizes only the quality of the external envelopes of the buildings, which is influenced, among other things, by the insulation of building partitions, the degree of glazing, the shape of the body, and orientation towards the directions of the world [
18,
19]. On the other hand, the
FEH index represents the quality of the building along with its technical system, so the value of the index depends on the efficiency of heat-generating devices in the building, the amount of heat distribution losses and the efficiency of heat regulation and use, i.e., the quality of technical parameters and solutions in general. In operational conditions, this index can be determined on the basis of the measured values of the fuel used or the energy used to heat the building. The
PEH index should rather be used in assessing a building’s environmental impact and considering environmental aspects [
9,
12,
15].
In case of each of the indexes, the lower its value is, the better is the building’s energy quality and standard. Based on the adopted applicable methodologies and standards, all the above-mentioned indexes can be determined by calculations. However, it should be noted that they are determined assuming standard boundary conditions of the internal environment inside the building and the external environment outside its balance cover. The theoretical values of the indexes are calculated in such studies as energy audit or building energy certificate. The actual values obtained in operating conditions concern only the FE
H index, and on the basis of its value, it is only possible to calculate the
PEH value in accordance with applicable legal acts [
20,
21,
22]. Estimated
PEH values ought to be compared with the national EPBD requirements to verify the environmental quality of the building. In Poland, maximal allowable values of the primary energy index were successively decreased by the Regulation of Polish Ministry of Transport, Construction and Maritime Economy [
23]. In case of the newly erected non-healthcare public buildings
PEH+W (heating and hot water production) limits changed from 65 kWh·m
−2∙year
−1 in 2014 to 45 kWh·m
−2∙year
−1 in 2021. For the old, refurbished buildings, the only limitation is the overall heat transfer
U coefficient value of the external barriers. For walls, it equaled 0.25 W·m
−2·K
−1 in 2014 to reach the value of 0.20 W·m
−2·K
−1 (since 2021); for the roofs, 0.20 W·m
−2·K
−1 (in 2014) and 0.15 W·m
−2·K
−1 (since 2021); windows, 1.30 W·m
−2·K
−1 (in 2014) and 0.90 W·m
−2·K
−1 (since 2021); doors, 1.70 W·m
−2·K
−1 (in 2014) and 1.30 W·m
−2·K
−1 (since 2021).
Recent studies and publications show that there are differences between the calculated and actual values obtained in operating conditions [
24,
25], which is called the performance gap [
26]. In energy audits prepared for the purpose of carrying out an investment consisting in comprehensive thermal retrofitting of a building, it is necessary to indicate the scope of works and technologies for their implementation, determine the projected level of energy savings for heating, estimate the amount of investment costs and financial operating effects, and determine environmental benefits [
2,
3,
27]. Building owners and managers should be aware that at the stage of auditing a building for thermal retrofitting purposes, forecasted values are obtained, and the actual ones depend on many factors, e.g., indoor temperature, ventilation intensity, method of use, and energy management in building before and after thermal retrofitting [
28]. The energy quality of buildings after thermal refurbishment is assessed primarily by comparing the heat transfer coefficients of building partitions to the limit values imposed by legal acts and the applied technical solutions of the heating system, which must at least meet the standards in terms of efficiency of heat generating devices, thermal insulation of pipelines and fittings, automatic central and local regulation influencing the most effective heat collection in heated rooms. Therefore, after thermal refurbishment, transparent and solid partitions should be characterized by low values of the heat transfer coefficient, and the heating system should be characterized by the highest overall efficiency [
29]. However, unrealistic theoretical efficiencies of heating systems and insulation materials properties are the factors causing the performance gap, resulting in lower energy savings than expected [
30,
31].
Buildings located in cities are most often supplied from centralized municipal heating systems through heating transmission networks. On the other hand, buildings located in rural areas are most often equipped with local heat sources, equipped with boilers fired with a given type of solid or liquid fuel. In Poland, in rural areas, where there is an access to natural gas supplied via networks, individual gas boiler houses are built to produce heat for the needs of a given building. The decrease in energy demand for heating as a result of thermal retrofitting translates into a decrease in gas consumption; therefore, the operating costs decrease, and the additional effect is a reduction in carbon dioxide emissions to the atmosphere. In fact, except for the effects related to energy savings, which translate into ecological ones, thermal retrofitting also includes economic aspects (which is involved in energy audits). Other areas of thermal retrofitting are also social and technological aspects including Planning, Quality and Administration, which is discussed in the article [
32], constituting the Key Performance Indicators (KPIs). According to the literature, energy savings are one of the most important and widely used KPIs [
33,
34]; therefore, this indicator was the basis of analysis in this study.
The article presents a long-term evaluation of thermal retrofitting effects based on an extensive and complex dataset including monitoring data, which brings an important contribution to the knowledge on the thermal retrofitting of buildings in Poland. A literature review finds a dearth of empirical studies that illustrate the correlation between the performed retrofitting and the predicted and measured gas consumption, in particular in the case of performance gap observed in buildings with poor energy standard and reduced conditions of thermal comfort. Although similar studies were previously published, they usually referred to other locations and involved simulation data on the energy performance before and after refurbishment [
16,
19], included shorter observation periods and limited number of buildings [
35,
36] or discussed other types of objects [
37].
The results of this study aimed at providing the comprehensive set of data on the thermal retrofitting of public buildings, including long term monitoring data gathered for 14 objects with common features. Furthermore, on the basis of the breakdown of the analysis of the energy reduction performance, some critical remarks and detailed explanations were stated in view of planning a thermal retrofitting investment.
3. Results
Using the measurement readouts, the described methodology and statistical research, the calculation results presented below were obtained. First, in each building, on the basis of the corrected averaged values of heat consumption before and after thermal-refurbishment (
QFH), the percentage decrease in final energy consumption for heating was calculated. The trends are shown in
Figure 1, while the average values before and after and the percentage decrease (savings) in
Table 7.
In the M1 group, an average decrease in final energy consumption was achieved at the level of 35.2%, while in the M2 group it was 42.7%. Then, with the usable area heated in each building known, the index of the annual final energy consumption for heating was determined, expressed in kWh·m
−2·year
−1 and denoted as
FEH. The decrease in
FEH index value is presented in
Figure 2, while its averaged values before and after thermal refurbishment are presented in
Table 8.
The average value of the
FEH index obtained after thermal-refurbishing in the M1 group was 95.5 kWh·m
−2∙year
−1, while in the M2 group it was 107.9 kWh·m
−2∙year
−1. With the assumed value of the non-renewable primary energy input index of
wH = 1.1 (energy production in the building, energy carrier in the form of natural gas), the consumption rate of non-renewable primary energy was calculated in each building. It was expressed in kWh·m
−2∙year
−1 and denoted as
PEH. The values obtained in the condition before and after thermal refurbishment in each building are presented in
Table 9. The average, minimum, maximum and median values of the
PEH index divided into M1 and M2 groups before and after thermal-refurbishment are presented in
Table 10.
The mean values of the FEH index after thermal refurbishment are 1.1 times higher than the FEH values due to the assumed value of the coefficient wH = 1.1. In the M1 group, the PEH index was 105.1 kWh·m−2∙year−1, while in the M2 group it was 118.7 kWh·m−2∙year−1.
The last stage of the calculations included the comparison of:
estimated decreases, under operating conditions, in final energy consumption QFH with forecast drops calculated in energy audits;
FEH, PEH values calculated on the basis of gas consumption measurements with values calculated in energy audits;
the obtained results of improving the energy quality of buildings in operational conditions to the requirements contained in legal acts in force during the period of thermal-refurbishment works.
Table 11 provides a summary of the obtained calculation results, data contained in energy audits of buildings and the required
PEH values resulting from legal acts.
Figure 3 shows a comparison of energy consumption drops expressed by the
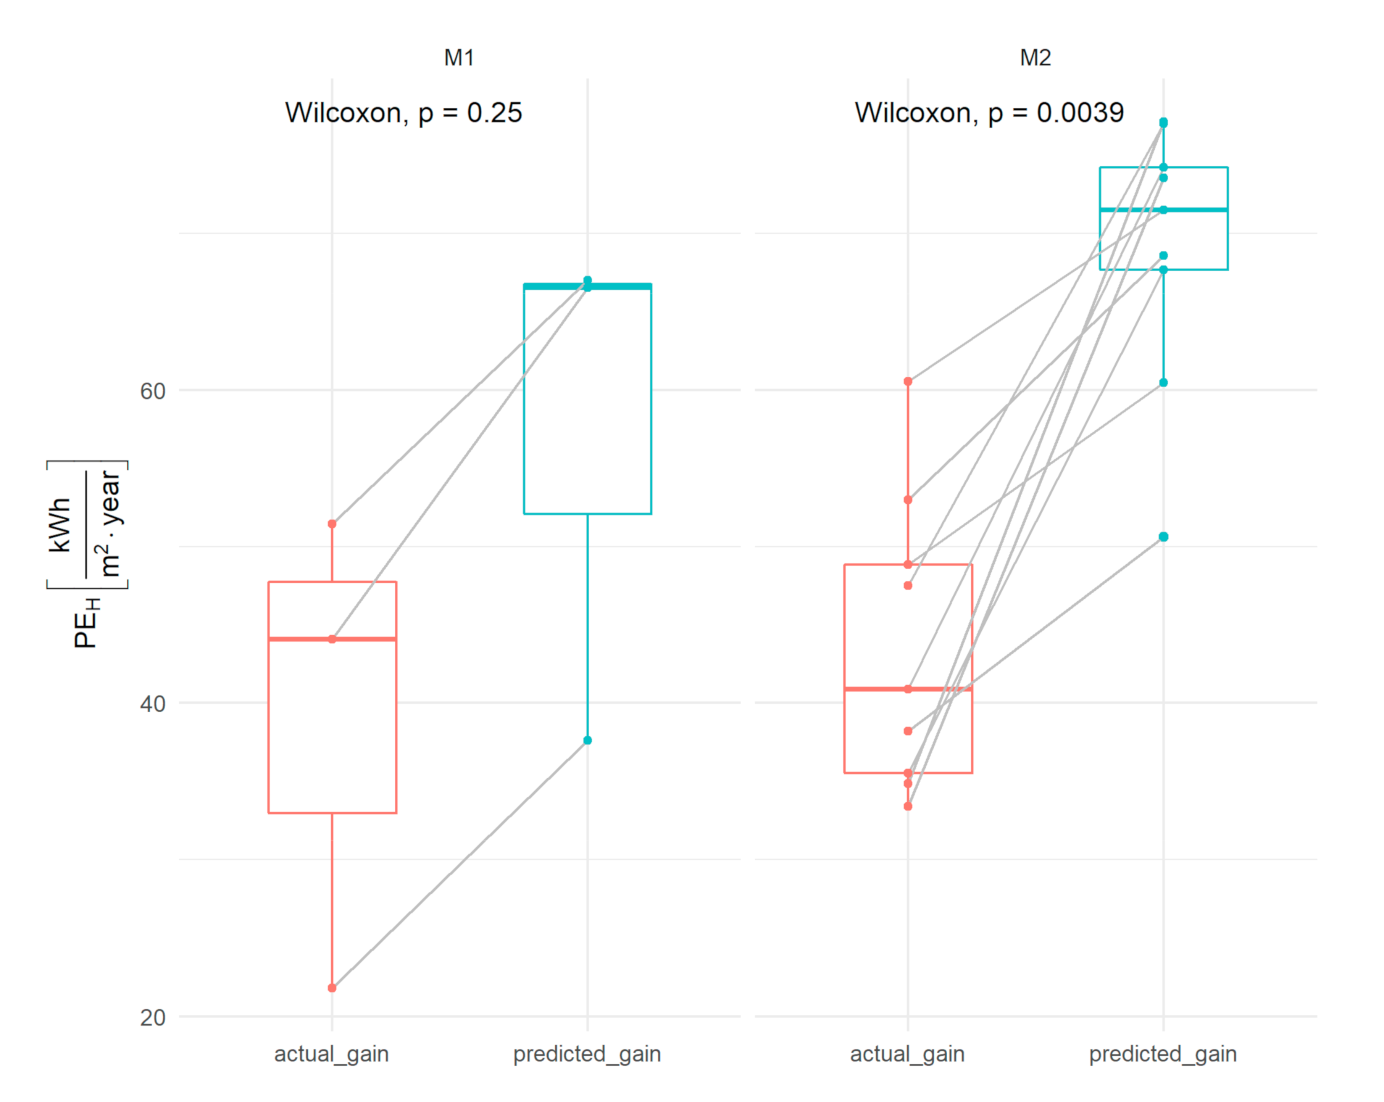
PEH index in each building, obtained under operating conditions based on the results of gas consumption measurements, to the decrease predicted by the audit.
Figure 4 presents the comparison of the actual values of the obtained
PEH index with the calculated values included in the audits before the retrofitting.
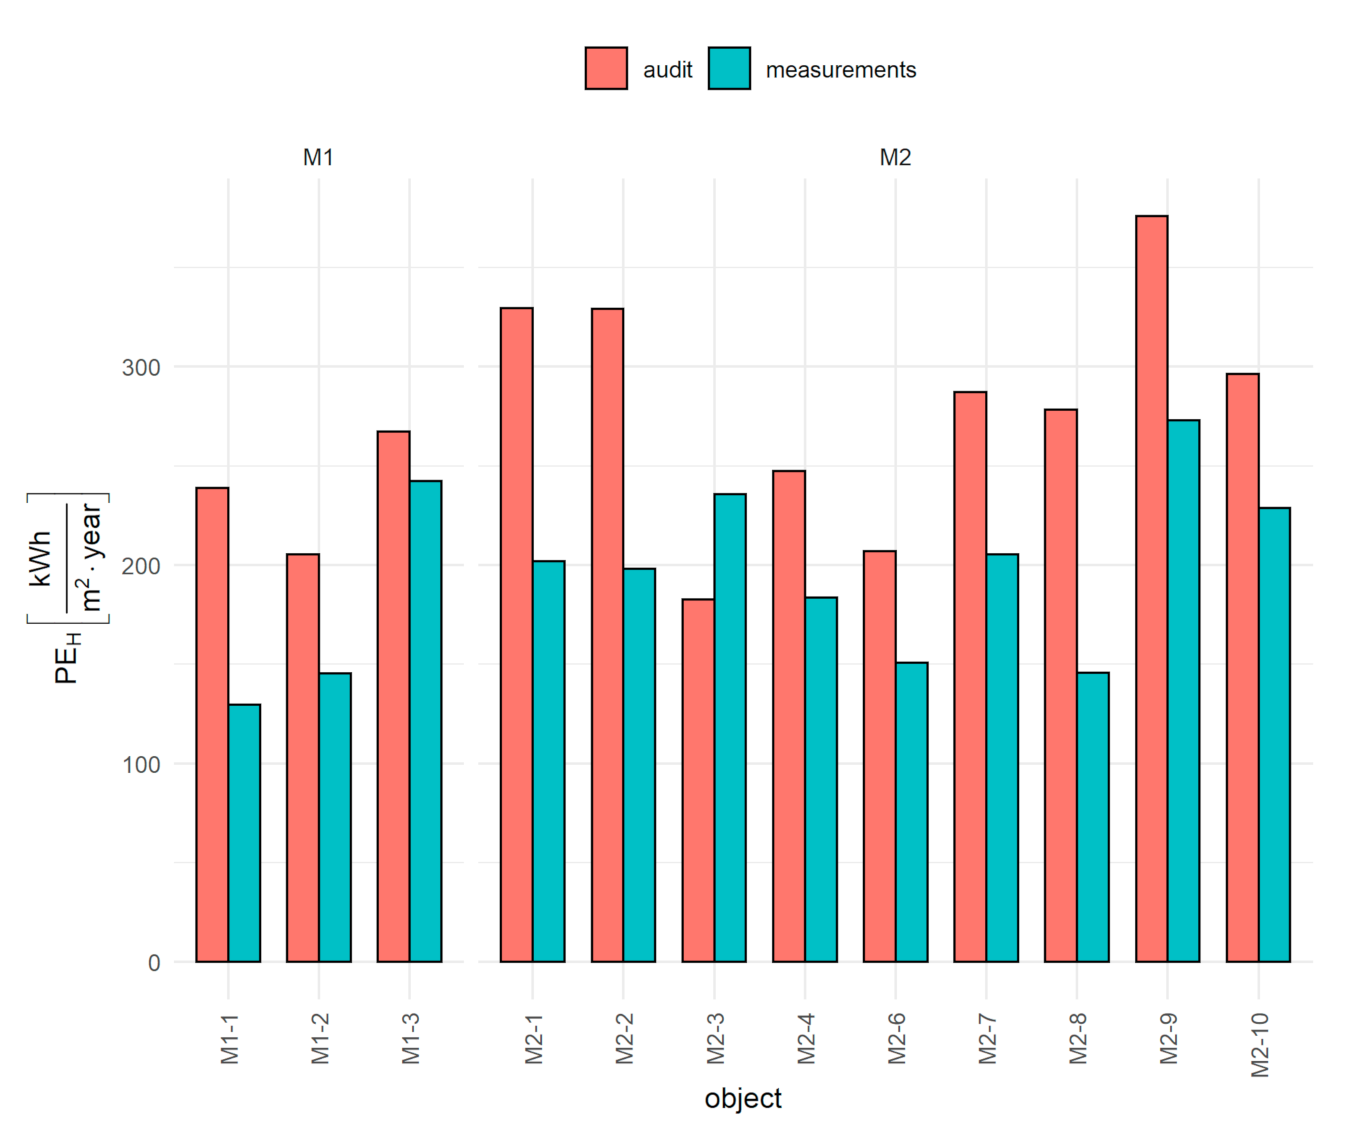
On the other hand,
Figure 5 compares the actual results obtained with the calculation values contained in the audits after thermal refurbishment and with the required values resulting from the Polish technical regulations.
4. Discussion
The research included in this publication aimed at:
estimation of the level of final energy savings obtained in operating conditions for heating the building due to the implementation of the thermal refurbishment investment and comparing it to the calculation values contained in the energy audit,
comparison of the value of the PEH energy index determined on the basis of actual measurements before and after the thermal refurbishment of the building with the theoretical values obtained in an energy audit prepared on the basis of the applicable algorithms, standards and calculation guidelines,
comparison of the forecasted and actual values of the PEH index with the Polish requirements of the energy standard applicable in the period of thermal refurbishment of the building.
The analysis of data on individual buildings shows that 12 buildings were covered by comprehensive measures aimed at improving the efficiency of the heating system and improving the insulation of building partitions. Out of the group of 14 buildings, only in two, marked as M1-2 and M2-3, did the heating system not require refurbishment. Before the start of the thermal refurbishment, the respective building partitions differed in the heat transfer coefficients (U expressed in W·m−2·K−1), while in the final state, they were similar to each other. The calculations and analyses carried out show that, as a result of thermal retrofitting in each building, a decrease in final energy consumption in operating conditions was achieved, ranging from 21.8% to 60.5%. The lowest value in this range applies to building M1-2, in which only building partitions were thermo-modernized, while the largest one concerns building M2-10, which among all the buildings had the highest U coefficients of partitions before the retrofitting. The obtained average value of final energy savings for heating in the M1 building group was 35.0%, while it equaled 42.7% in the M2 group. The comparison of final energy consumption before and after thermal refurbishment showed significant differences (p = 0.002) for buildings from the M2 group. This is confirmed by a noticeable decrease in final energy consumption resulting from the performed investments.
The most favorable configurations of the thermal refurbishing are the most complex ones. Additionally, the most satisfactory values of the energy consumption decrease are achieved for the objects that were characterized by the lowest energy quality before refurbishing. As an example, data contained in the
Table 1,
Table 2 and
Table 7 can be given. The M1-2 object before refurbishing previously had an insulated roof, which is why after refurbishing a lower level of savings was achieved (only 21.8% of energy consumption decrease). On the other hand, the M1-3 object had a thermally poor external envelope (high U values of the walls and the roof). After their thermal properties were aligned to the other objects (by thermal refurbishment), the level of the energy savings increased (51.4% decrease in energy consumption). The level of energy savings in the case of the M2-2 object was higher (47.5%) because of the non-heated flat roof compared to the M2-3 and M2-4 buildings, with thermally insulated flat-roofs before refurbishing and comparable values of the overall heat transfer coefficients.
Although in the M1 group the significance of the differences was not statistically significant (
p = 0.12), which most likely results from the fact that a small sample size was used for testing, in all analyzed cases, there was a decrease in energy consumption. The estimated values of energy savings for heating obtained under operating conditions are in each case lower than the forecast calculated in the energy audits. The decrease in final energy demand calculated in audits based on commonly used European standards and in conjunction with the methodology in force in Poland was much greater (
Figure 3) and ranged from 37.6% to 77.1%. It should be noted that these values are forecast values and are calculated assuming the standard boundary conditions of the internal environment in rooms and the external environment surrounding the building’s balance zone before and after thermal retrofitting. This is one of the basic assumptions of the methodology of preparing an energy audit of a building. The results obtained in this study confirm the general trend observed in thermal restoration of buildings. According to the literature concerning multifamily buildings in Poland, the actual energy savings range between 8.8% and 74.8% of energy savings calculated in audits, depending on the various renovations [
35]. In another paper, the economic effects resulting from thermal refurbishment of schools were compared after several operation seasons and were calculated (59–71%), and real savings (33%) differed significantly [
37].
To try to explain this, the
PEH index obtained on the basis of measurements in operating conditions with the same index calculated in the building energy audit was compared in 12 buildings (in two the audit results were not available), in the condition before thermal refurbishment (
Figure 4). The comparison of the values of the
PEH index shows that in eleven cases examined in this respect, they were higher in the audit than in the operating conditions. These differences ranged from 9.4% to 47.7%, and the average for both groups was 26.1%. It turned out that in the examined group of buildings, only in the case of M2-3 were the theoretical values of the indicator describing the energy performance of the building lower than the results obtained on the basis of measurements. In the remaining cases, these results were much higher, as presented in
Figure 4. It should be assumed that before the thermal retrofitting, the buildings were heavily underheated, and the standard indoor air temperature was not reached in the rooms. This means that the thermal needs of the building were not fully covered in the conditions before thermal refurbishment, so the level of final energy savings achieved in operating conditions was lower than the forecast calculated in the audit. The final effects of energy savings are influenced by user behavior, as evidenced by literature reports [
51], especially the use of control fittings of radiators (thermostatic valves) and programming of internal temperature. However, this influence of individual behavior is greater in residential buildings than in public buildings, where one person is responsible for energy management.
The analysis of the FEH index values shows that its decrease in each building was significant. The mean value of the index in the M1 group of buildings decreased from 152.1 kWh·m−2∙year−1 to 95.5 kWh·m−2∙year−1, which means a decrease by 37.2%, while that in the M2 group decreased from 190.2 kWh·m−2∙year−1 to 107.9 kWh·m−2∙year−1, which is a decrease of 43.3%. The same percentage reductions were obtained for the PEH index, because in each building, the input coefficient wH was equal to 1.1, which in this case means a linear relationship between the two indexes. Additionally, since FEH and PEH values are derivatives of the QFH index as its linear combinations, the comparisons of energy consumption decreases expressed by the above-mentioned indexes are also characterized by the same level of significance of differences. The study comparing the PEH value obtained in real conditions with the one calculated in the audit after thermal refurbishment shows that the relations between them developed in different ways. In three buildings, the PEH value resulting from gas consumption measurements was lower than the one specified in the audit, from 6.1% to 11.4%; in the remaining nine buildings, it was greater than 6.8% up to 86.8%, and on average, for both groups, it is a 28.4% higher value. A comparison of the PEH index values obtained on the basis of measurements with the values required in legal acts as for reconstructed buildings shows that after thermal retrofitting in nine buildings the requirement was met with an excess of 0.4% to 29.4%, while in four buildings, 1.4% to 19.1% was missing. However, on average for both groups in total, the value was 6.4% lower. There may be several reasons for this, e.g., inadequate adjustment of the central heating system, maintaining higher temperatures in the rooms than required, not using the heating weakening outside the building’s working hours or worse than assumed thermal parameters of the building partitions and lower overall efficiency of heating systems. Considering the impact of thermal refurbishment on the improvement of the energy performance of a building, it should be clearly stated that it is diversified but always leads to a reduction in energy consumption and thus its carriers.
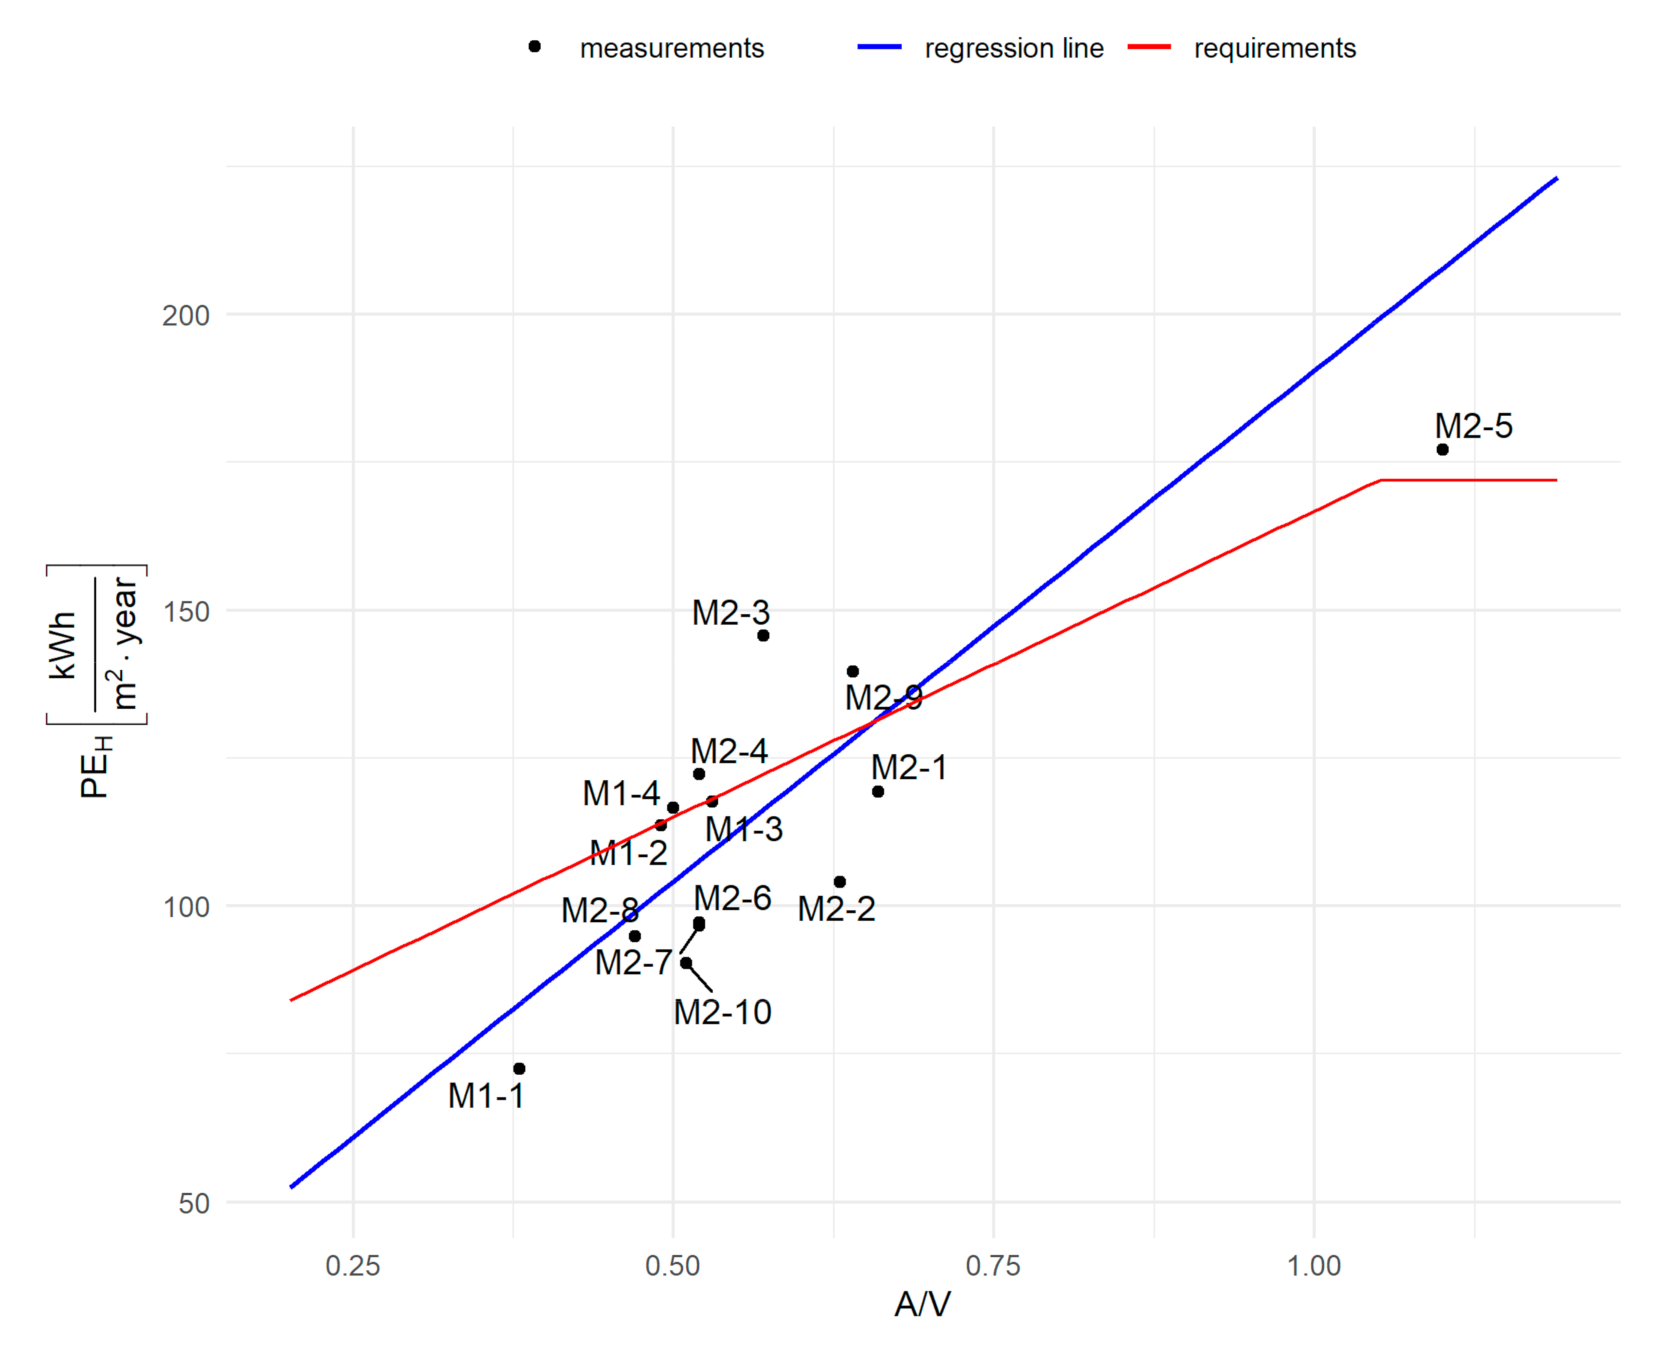
Figure 6 aims to better illustrate the relationship between the required
PEH,0 values depending on the building shape factor (
A/
V), and the values obtained on the basis of measurements. The continuous red line indicates the required values of the index at a given value of the
A/
V ratio, while the points on the graph show the average values of the
PEH index obtained after the thermal refurbishment of the building. Additionally, the relation between the building shape ratio and Annual Primary Energy Consumption Index for Heating
PEH was checked. From the diagram, it can be noticed that after the refurbishment, the values of
PEH index were in most cases lower than required. It was noticed that in the case of low
A/
V ratio values, the influence of building shape was not significant for
PEH. Hence, it can be interpreted that analyzed buildings functioned differently, and some of them could be underheated before the retrofitting. In the case of the high value of
A/
V ratio (building M2-5), energy consumption expressed as Annual Primary Energy Consumption Index for Heating
PEH was higher than in other cases and exceeded the required
PEH,0 index value, which may result from both building shape ratio and the manner of operation. These relations are similar to those previously described in the literature [
7].


 ,
, 


