Article

Pulsed LED-Lighting as an Alternative Energy Savings Technique for Vertical Farms and Plant Factories

1
Laboratorio de Iluminación Artificial, Tecnológico Nacional de México Campus Pabellón de Arteaga, Carretera a la Estación de Rincón Km. 1, Pabellón de Arteaga, Aguascalientes 20670, Mexico
2
Collage of Agriculture and Human Sciences, Prairie View A&M University, Prairie View, TX 77446, USA
3
Campus UAZ Siglo XXI, Universidad Autónoma de Zacatecas, Carretera Zacatecas-Guadalajara Km. 6, Zacatecas 98160, Mexico
4
Centro de Física Aplicada y Tecnología Avanzada (CFATA), Universidad Autónoma de México, Boulevard Juriquilla 3001, Queretaro 76230, Mexico
*
Author to whom correspondence should be addressed.
Energies 2021, 14(6), 1603; https://doi.org/10.3390/en14061603
Submission received: 3 February 2021 / Revised: 28 February 2021 / Accepted: 5 March 2021 / Published: 13 March 2021

Abstract

:
Different strategies are reported in the literature for energy saving in Closed Plant Production Systems (CPPS). However, not reliable evidences about energy consumption with the use of pulsed LED light technique in lighting system available in Plant Factory and Vertical Farm. In this work, three key points to determine the effects of pulsed LED light versus continuous LED light are presented: (1) A mathematical model and its practical application for stabilizing the energy equivalence using LED light in continuous and pulsed mode in different light treatments. (2) The quantum efficiency of the photosystem II was used to determine positive and/or negative effects of the light operating mode (continuous or pulsed) on chili pepper plants (Capsicum annuum var. Serrano). (3) Evaluation of energy consumption with both operation modes using ten recipes from the literature to grow plants applied in Closed Plant Production Systems, different Photosynthetic Photon Flux Density at 50, 110, and 180 µmol m−2 s−1, Frequencies at 100, 500, and 1000 Hz, and Duty Cycles of 40, 50, 60, 70, 80, and 90%. The results show no significant statistical differences between the operation modes (continuous and pulsed LED light). For each light recipe analyzed, a pulsed frequency and a duty cycle were obtained, achieving significant energy savings in every light intensity. The results can be useful guide for real-life applications in CPPS.

1. Introduction

LED lamps have been demonstrated a versatile illumination source to grow plants in controlled environments agriculture systems, as a supplemental lighting for greenhouses [1,2], replacement of sun light in growth chambers, growth rooms, indoor vertical farms [3,4,5,6], for the crop production in space [7] and as plant factories [8,9,10,11,12]. Furthermore, LED lighting has improved the shelf life and nutritional quality of horticulture products at a lower cost [13], since correct treatments can increase the concentration of important metabolites like vitamins or compounds with pharmacological properties [14,15,16,17]. To address the potential of LED treatments as a light source different studies have been carried out on fruits and vegetables including lettuce, tomato, spinach, cucumber, potato, and radishes [18,19,20,21,22,23,24,25].
Energy consumption of artificial light sources in Closed Plant Production Systems (CPPS), such as greenhouses, vertical farms, plant factories, or even for plant growth systems, outer space [10,26,27], contributes to about 30% of the total cost of production [28]. Therefore, reducing the energy cost of illumination systems in CPPS along with the fabrication of efficient light devices, are the challenges for the near future [11]. A previous study estimated that 3500 kW y−1m−2 of energy was used to grow lettuce in a vertical farm with an artificial light system in the UK [29]. Several light sources have been evaluated for different CPPS, namely, filament lamps and gas discharge lamps with mercury and sodium [30,31]; however, LED technology improved lamps with a longer lifespan and lower energy consumption [5,32,33]. Important advantages of LED lamps include the application of light in specific bands (λ) of the light spectrum which reduces energy consumption considerably, and the creation of possibilities to match the specific plant light requirements [34,35].
Commonly LED lamps are programmed to provide continuous light for plants in controlled environments [1,36], but they can also be adjusted to produce pulsed light. LED lamps have the capability to blink or flash in short time spans in which the lamp emission is turned on and off at fast intervals (μs) producing pulsed light with high intensity and less consumption of energy. Several works have demonstrated the advantages of treatments with pulsed LED light applied to diverse varieties of plants. Steinitz and Poff [37] applied a white light at 125 µmol m−2 s−1 pre-irradiation with a photoperiod of 30 h for Arabidopsis thaliana plants, after that, the plants were exposed in a single wavelength at 450 nm (blue light) in continuous and pulse irradiation. The pulse light configuration (five pulses) was during 10.0, 2.0, 1.0, 0.10, and 0.01 s, at fluence rates for 1.88 × 10⁻¹, 3.76 × 10⁻¹, 3.76, 37.6, and 376 pmol cm−2 s−1, respectively. Then, the authors kept the fluence constant at 18.8 pmol cm−2 s−1 per pulse and established the duration with a combination for the three types mentioned above. The results indicated that the employed treatments for lettuce plants was only one with a positive response. Tennessen et al. [38] set the relative photon requirements of photosynthesis in pulsed and continuous light for tomato plants. The authors measured the photon requirements using a continuous light emitted by LEDs at 658 nm (0–50 µmol m−2 s−1) on tomato plants. An energy conversion was carried out employing electricity in photosynthetically fixed carbon. In the pulsed light configuration, the lamps were turned on/off at a frequency of 6.7 kHz (150 us total cycle time). The photosynthesis parameter was estimated in light/dark times of 15/135, 7.5/142.5, and 1.5/148.5 by pulses of 500, 1000, and 5000 µmol m−2 s−1, respectively, reach an intensity of 50 µmol m−2 s−1 in continuous light. Jao and Fang [39,40,41] determined that LEDs at 720 Hz (1.4 ms) frequency with a 50% duty ratio with 16-h light/8-h stimulated the growth of potato sprouts. The authors established eight treatments modifying the light, frequency, duty cycle, and photoperiod. The lamps used were fluorescent tubes. They suggested if the reduction of energy consumption was the goal, a frequency of 180 Hz (5.5 ms), 50% duty ratio, and 16-h light/8-h was the best choice for plants without sacrificing their growth and high energy consumption. The author did show results obtained about energy consumption. Yoneda and Mori [42] developed an artificial lighting system for irradiating pulsed light to measure photosynthetic activity and fresh weight in crops of leaf lettuce, head lettuce, as well as aquatic plants. The system configuration had the following parameters: a period between 2 μs and 1 ms and duty cycles between 20 and 70% using LED light with different qualities (two different white lights and red light). However, this design did not consider higher frequency ranges. Olvera-Gonzalez et al. [43] analyzed the effects of pulsed light compared to continuous light concerning the parameters of chlorophyll fluorescence in tomato plants. The pulsed LED light was configured with eleven frequencies (0.1–100 Hz), 50% duty ratio, and PPFD levels at 450 and 750 µmol m−2 s−1. The author showed that exist significant effects between pulsed light frequencies and φPSII parameters. An experiment under greenhouse conditions for the cultivation of carnations was carried out with the configuration of a PWM dimming system with Red-Blue LEDs. Four different operating modes were programmed. One treatment powered by direct current (DC) setting Red-Blue (R+B) at 20 μmol m−2 s−1 as control. The pulsed light treatments were configured in Red-Blue (R+B, R, B) at an average of 20 μmol m−2 s−1, the parameters for the PWM (pulsed light) were frequency (f) at 5 kHz and 1 kHz, duty at 50%, period (T) at 200 µs and 1ms, phase difference (φ) at 0, 180°, and intensity at 40 μmol m−2 s−1. The physical and morphological parameters were evaluated. The obtained results showed that carnation leaves changed the number and sizes of photosynthetic apertures [44]. Pulsed irradiation with LEDs was applied for different frequencies (20, 10, 4, 2, 1.3, and 1 kHz, and 500, 50, 5, 2.5,1.3, 1, and 0.5 Hz) at a 50% duty cycle in lettuce plants A continuous light treatment at a PPFD of 200 μmol m−2 s−1 with a 16-h photoperiod was the control. The effects on growth, the quantum efficiency of photosystem II (φPSII) and electron transport rate (ETR) were evaluated. The results showed that there were no significant differences between the chlorophyll fluorescence. The experiments were carried out in a plant factory and they showed a possible energy saving [45]. Pardo et al. [46] evaluated the effect of pulsed LED light on germinating, hypocotyl length, fresh weight, dry weight, and plant pigments. Eight LED light treatments (red, blue, green, and white) with two frequencies (25, and 50 Hz) and duty cycle at 20% were established. The control was programmed with continuous white light. The highest values of absorbance corresponded to blue light pulses in both frequencies. The treatment with the best result was the pulsed red light at 50 Hz at 20% of the duty cycle, except in plant pigments. In general, the application of pulsed light had positive effects on all treatments lettuce plants. Vaštakaitė et al. [47] determined the changes produced in the photochemical levels of microgreens (Red pak choi, mustard, and tatsoi) by applying pulsed light compared to continuous light. Different frequencies were configured (2, 32, 256, and 1024 Hz) with a 50% duty cycle. The total phenolic content, anthocyanins, and antiradical activity (DPPH) were determined. The LED light pulsed at different frequencies produces levels of accumulation int the phenolic compound, anthocyanins and the antiradical activity of the secondary metabolites depending on the species of microgreens. Son et al. [48] evaluated the effects of various frequencies (0.3, 1, 3, 10, and 30 kHz) of pulsed LED light on the growth characteristics of Lactuca sativa L. ‘Sunmang’. The treatments were established with combinations of red, white, and blue (Red: White: Blue = 7:2:1) LEDs light at different frequencies with a 75% duty cycle (PPFD 190 μmol m−2 s−1). The lighting system used a PWM device to generate pulsed irradiation. The results showed that there are not significant differences between treatments regarding the quantum efficiency of photosystem II and photosynthetic rate. Macronutrient levels were higher compared to continuous light. The growth and energy efficiency were the best with the pulsed light treatment at 1 kHz. They suggest that pulsed light may be a strategy for energy saving. In addition, the frequency and duty cycle must be configured for each system. In a previous work, Son et al. [12] found that lettuce had better growth with a 75% duty cycle. For this reason, in their research the same duty ratio was established for all treatments.
According to the exposed literature, in none of the papers be found a handbook to generate the same amount of energy in pulsed and continuous light. In addition, light recipes and the attention of pulsed LED light as an energy-saving technique have not been studied and reported in CPPS. Aiming to create the basis thus a quick guide (mathematical model) for setting up the energy equivalence in both light modes (continuous and pulsed LED light), demonstrate the potential of the pulsed LED light as a technique for energy-saving without negative effect on plants, finally the use of light recipes to be configured on artificial irradiation systems based on LEDs. Our proposal is the first to apply artificial light in the pulsed mode in CPPS as an alternative to energy-saving.

2. Materials and Methods

2.1. Lighting System Characteristics

The design and manufacture of the lighting system were developed by the Artificial Lighting Laboratory (LIA) at Instituto Tecnológico de Pabellón de Arteaga in Aguascalientes, México. The irradiation is emitted by ultra-bright LEDs, includes features for control parameters such as different wavelengths in continuous and pulsed light, frequency, and duty cycles. The illumination system was characterized by obtaining maximum values of PPFD for each light channel (color). The irradiated surface area (m2) was determined by a Flir One PRO Thermal Imaging Camera from a distance of 50 cm to assess the light distribution arriving at the plant canopy Table 1. A quantum sensor to determine the PPFD of photosynthetically active radiation (PAR) was used. In Figure 1b a light sensor was placed to monitor the response of the variation in light intensity (photons) concerning the pulsed signal (electronic voltage). That is, it controls the reaction of the light system due to the electronic input signals that correspond to the pulse frequency and duty cycle. According to these parameters, the error between the electronic input signal and the emitted light (photons) was measured. An automated controller based on FPGA (Field Programmable Gate Array) allows programming different functions such as pulse frequency, duty cycle, intensity emitted, wavelength, and on-off time, being another characteristic of the lighting system.

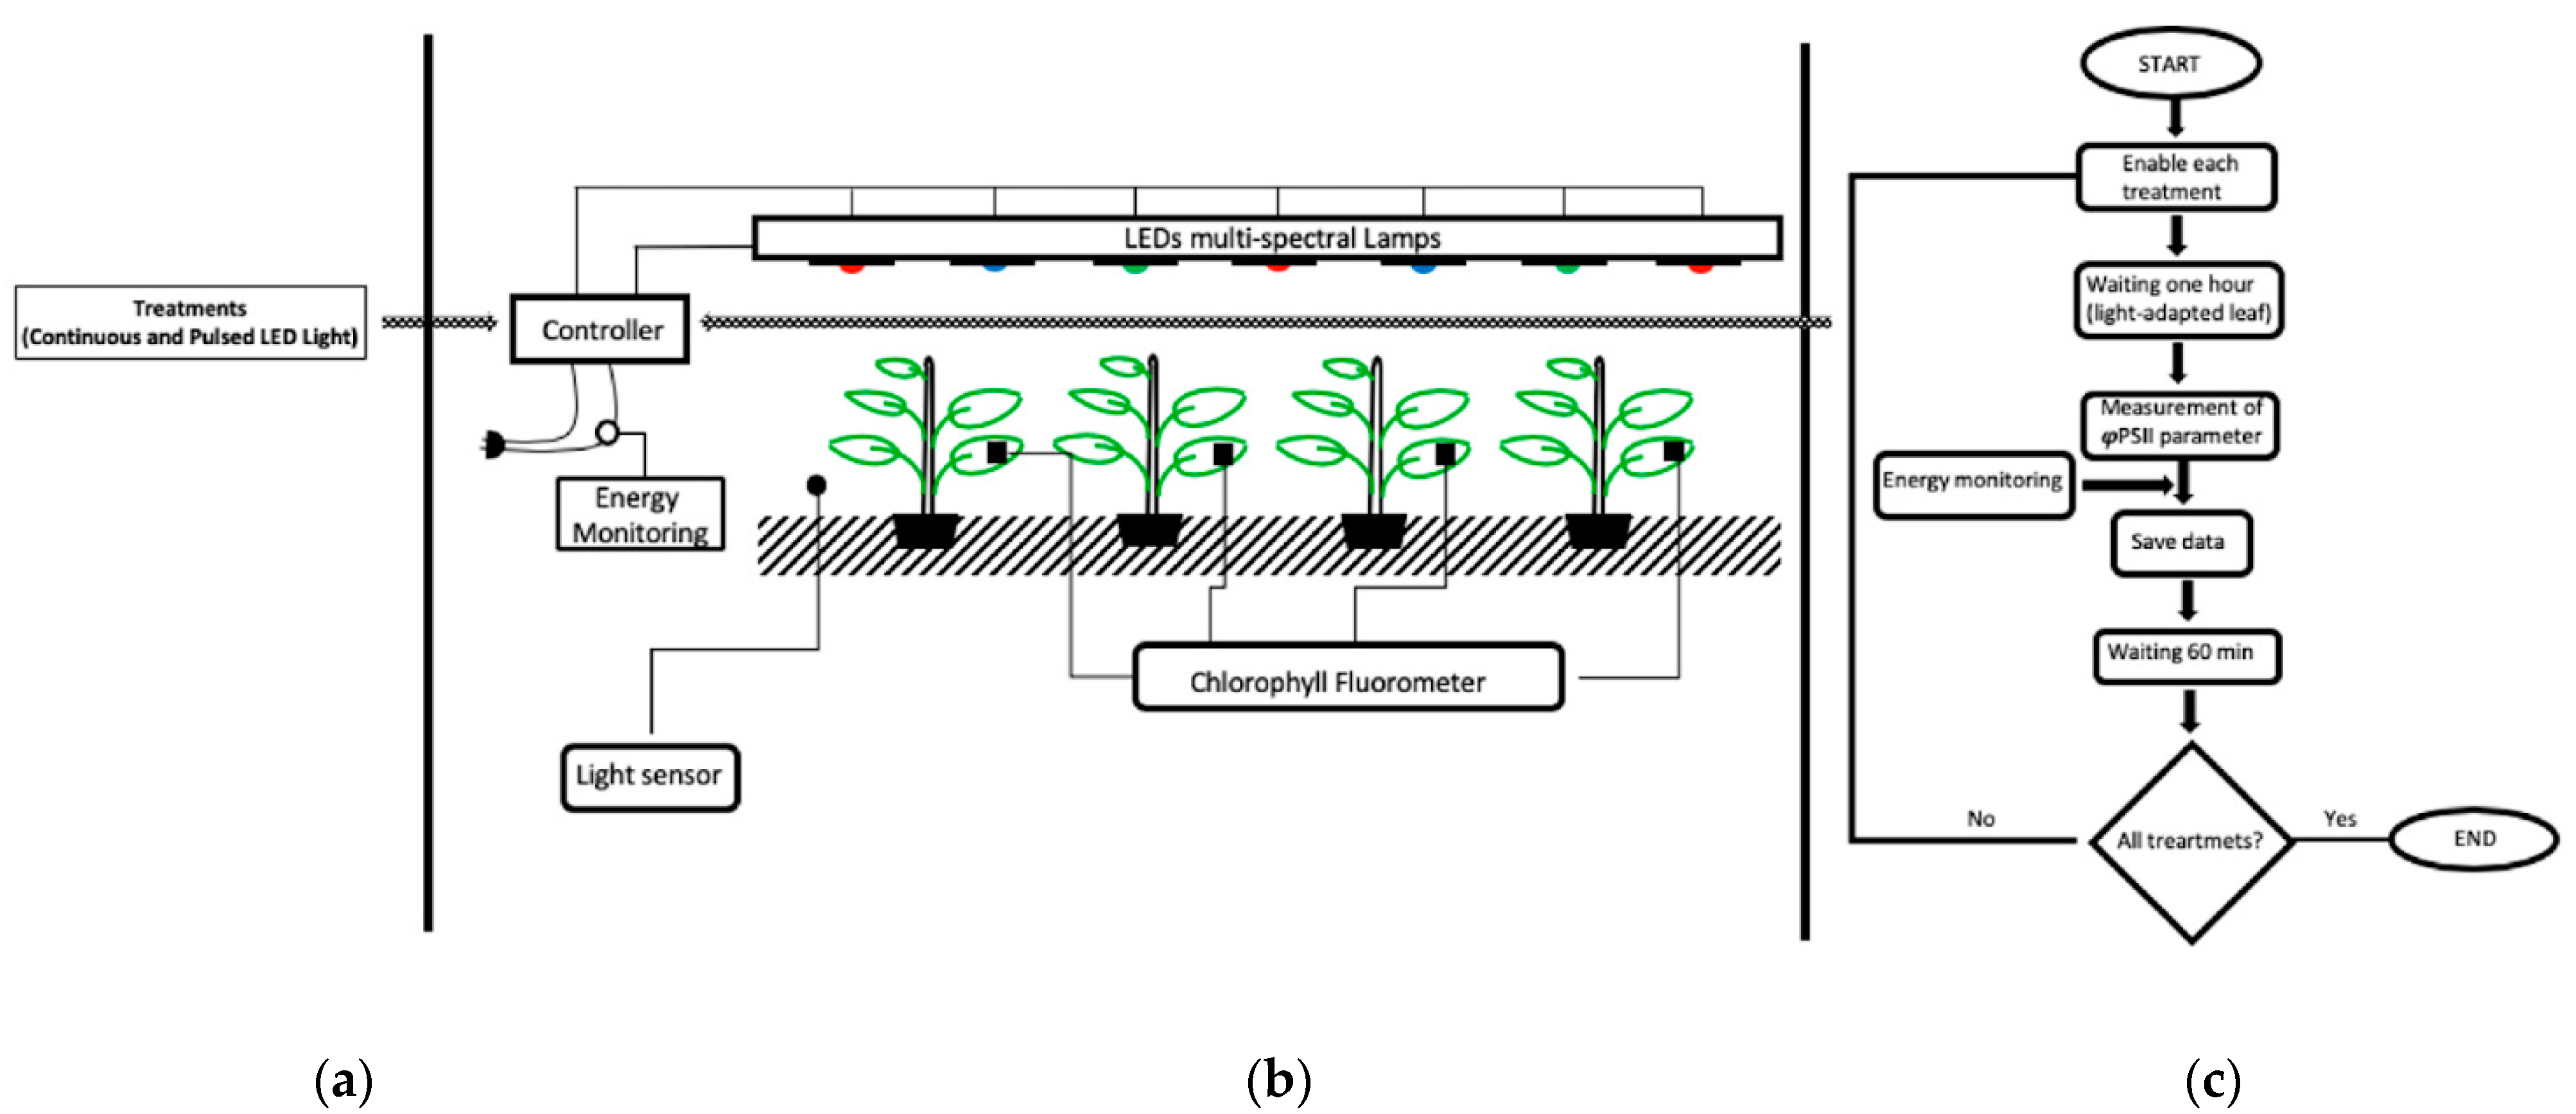
2.2. Continuous and Pulsed LED Light Effects in φPSII

Two-month-old chili pepper plants (Capsicum annuum var. Serrano) previously grown in a greenhouse with an average day temperature of 30 °C and a night temperature of 18 °C were transplanted into four growth rooms equipped with multispectral LED-based lighting systems. Each system was equipped with custom-engineered light treatments with a chamber temperature and relative humidity maintained at 25 ± 1 °C of 60%, respectively. The photosynthetic photon flux density (PPFD) of each LED light treatment was 40, 50, 80, 110, 170, and 230 μmol m−2 s−1 Figure 1a, a pulsed light mode frequency of 100 Hz and duty cycle 50%. General configuration and control of the illumination system is shown in Figure 1b. Triplicate experiments for all conditions were carried out with both continuous and pulsed LED light modes. The photochemical efficiency of photosystem II (φPSII) or Genty parameter [49] was measured online and used to evaluate the effect on the different operation modes after 60 min of light irradiation. This parameter is directly associated with the quantity of light absorbed by chlorophyll in PSII and used for photochemical processes. The φPSII was measured online with the fluorescence monitoring system Junior-PAM (WALZ, Effeltrich, Germany). According to Maxwell and Johnson [50] the required time to reach steady-state is about 15 to 20 min and can change significantly between plant species. Figure 1c shows the sequence of measurements.

LED Light Treatments (Pulsed and Continuous Light)

White and Red-Blue (50–50%, 70–30%, and 30–70%) LED light treatments were applied to the plants in both continuous and pulsed mode and measured with a spectrophotometer Red Tide (Ocean Optics, Largo, FL, USA) as shown in Figure 2.

2.3. Continuous and Pulsed LED Light Effects in Energy Consumption

There is extensive literature on the spectral quality of radiation in the development and growth of crops. Research shows that the combination of different wavelengths (light recipes or light treatments) can enhance the antioxidant capacity, calcium, potassium, magnesium, and phosphorus levels, as well as the number of fruits, dry weight, fresh weight of vegetable crops including lettuce, spinach, kale, basil, and sweet pepper crops, and others [51,52,53]. This study used ten light recipes in the pulsed and continuous modes. These light recipes Table 2 were selected from the literature to configure in the lighting system used in this study. The letters in each recipe correspond to the first letter of each color type, namely Red, Blue, Green, and White. PPFD levels were 180, 110, and 50 µmol m−2 s−1 and the frequency was configured at 100, 500, and 1000 Hz with duty cycles 40%, 50%, 60%, 70%, 80%, 90%, for each treatment, see Figure 1a. Then, the energy consumption was measured to compare the efficiency of the tested operation modes. The experiment was carried out at threefold.

2.4. Mathematical Model: Continuous and Pulsed Light Modes

Artificial LED light in continuous mode is graphically represented in Figure 3 (Left side), the Daily Integral Light (DLIc) is defined as the amount of photosynthetically active photons that are supplied to a crop (area under the curve) during a period (ts). The continuous mode is regularly used in CPPS and depends completely on the number of light hours to plants are exposed (photoperiod). The pulsed mode Figure 3, right side is the energy equivalence of continuous light in pulsed form (DLIp) and is obtained by calculating the sum of the area under the curve of each pulse (ton) that exists in the same period (ts) established for the DLIc. The energy equivalence or the amount of photosynthetically active photons in both light operation modes means they are identical; that is, DLIc must be equal to DLIp. If the level (intensity of light) of photosynthetic photon flux density (PPFD) is modified in the continuous mode, the amplitude of the signal for pulsed mode must be adjusted to reach energy equivalence between both modes. The parameters such as Frequency (Fc), Duty Cycle, photoperiod (ts), and PPFD (light intensity) levels were established at the beginning of the experiment.
Total amount of pulsed daily light integral (DLIp) in mol m−2d−1 is defined by the Equation (1) and represents the amount of light (light hours) that is supplied to the plants or crop during a day.
D L I p = N p 1 1 , 000 , 000 0 t o n ( P P F D p × d x )
where Np represents the number of pulses (the number of pulses is equal to the frequency (Fc) in Hertz times the photoperiod -ts, light hours in a day- in seconds), and both Fc and ts are set as initial parameters.
ton represents the time in seconds as can be observed in Figure 3 (right side), and depends on the duty cycle, and frequency.
PPFDp represents pulsed light photosynthetic photon flux density or intensity in µmol m−2 s−1.
The conversion factor between µmol and mol is given by the constant 1,000,000.
The Photosynthetic Photon Flux Density in pulsed mode (PPFDp) can be calculated by Equation (2):
P P F D p = P P F D c × 100 D u t y C y c l e
where PPFDc is continuous light photosynthetic photon flux density in µmol m−2 s−1 established in the experiment.
Duty cycle is the relationship between time on (ton) and time off (toff) established as one of the initial parameters in the experiment.
Finally, time on (ton) is the light on in the pulsed mode and can be calculated by Equation (3):
t o n = D u t y C y c l e × T 100
where Period (T) depends on the selected pulsed frequency expressed in seconds (s). At the same time, the total amount of continuous daily light integral (DLIc) in mol m−2d−1 is expressed by the Equation (4):
D L I c = 1 1 , 000 , 000 0 t s ( P P F D c × d x )
where ts is the photoperiod per day established in the experiment in seconds.

3. Results

3.1. Continuous and Pulsed LED Light Effects in Photochemical Efficiency of Photosystem II (φPSII)

Figure 4 shows the values obtained for the quantum efficiency of photosystem II 60 min after the plants were subjected to the several light treatments. The positive and/or negative effects on plants were evaluated when exposed to the operation modes of artificial LED light (continuous and pulsed). The data obtained in this section, the quantum efficiency of photosystem II helps determined stress variations in photosynthetic organisms [49] and this parameter turns into a powerful tool for monitoring under different environmental conditions. Moreover, the φPSII is an indicator to estimate the functional levels of photosynthesis and photosynthetic reactions in green plants. Further, regarding the photosynthesis process the plant’s response did not generate negative results in pulsed LED light mode. The φPSII parameter evaluated in the statistical analysis for both light operation modes (ANOVA) indicated that there are no significant differences.

3.2. Energy Consumption in CONTINUOUS and Pulsed LED Light

Continuous mode is used as a reference parameter of total energy consumption for each light treatment. When switching to pulsed mode, one needs to obtain the energy equivalence by applying the mathematical model, that means to calculate the pulsed LED light intensity for every continuous LED light intensity. For each proposed light recipe (see Table 2) we obtained the average values of energy savings in continuous and pulsed LED light. The information was divided into three parts. First, our initial parameters like light treatment, PPFDc, photoperiod (ts), pulse frequency (Fc) and Duty Cycle (%) are set out at the beginning of the experiment. Second, Pulsed Daily light integral (DLIp), Photosynthetic Photon Flux Density (PPFDp) on pulsed light per each Duty Cycle, Continuous Daily Light Integral (DLIc) are calculated according to the Equations (1)–(4), respectively into the mathematical model.
The calculations of ton for each frequency and Duty Cycle applying Equation (3) are shown in Table 3, in the first part, our input parameters are PPFDc, ts (s), Fc (Hz), and Np, PPFDp, T, ton, DLIp/c were calculated according to the above Equations.
A correct comparison of energy consumption in both operation modes (Continuous and Pulsed LED light) is needed to achieve an energy equivalence; that is, the numerical values of DLIc and DLIp must be equal. Finally, the monitoring of energy consumption results is presented by all light recipes in pulsed and continuous mode. The energy efficiency was measured for all intensities (50, 110, and 180 micromoles–μmol), Duty Cycles (40%, 50%, 60%, 70%, 80%, and 90%), and frequencies (100 Hz, 500 Hz, and 1000 Hz). The highest energy conservation was obtained with the frequency and Duty Cycle at 100 Hz and 40%, respectively, in 95R5B, 83R17B, 60R40B, 57W43B, 67R11B22G, 67R33G, 50R50B, 70R30B, and 30R70B treatments at 50 μmol m−2 s−1. Reaching energy-savings of 10.4%, 11.0%, 12.4%, 11.3%, 13.5%, 11.4%, 11.4%, 11.6%, and 10.5%, respectively. For the 110W light recipe, the best frequency and Duty Cycle were 500 Hz at 40% reducing energy consumption up to 10.7%. The frequency and Duty Cycle with best results were 500 Hz and 50% for 95R5B, 83R17B, 60R40B, 57W43B, 67R33G, 100W, 50R50B, and 30R70B treatments at 110 μmol m−2 s−1 achieving savings of 11.7%, 11.8%, 12.7%, 12.1%, 11.3%, 8.5%, 11.9%, and 9.7%, correspondingly. The frequency at 500 Hz and 40% of the duty cycle were the best combination for the 67R11B22G recipe optimizing energy consumption by 3.6%. Finally, in the 67R11B22G treatment, a 12% power saving was obtained with 500 Hz and duty cycles of 40% and 50%. The frequency and duty cycle with best results were 500 Hz and 60% for the treatments 83R17B, 60R40B, 67R11B22G, 67R33G, 50R50B and 70R30B at 180 μmol m−2 s−1. In treatments 83R17B, 60R40B, 67R11B22G, 67R33G, 50R50B, and 70R30B with 500 Hz frequency and 60% duty cycle at 180 μmol m−2 s−1 the highest savings were 9.1%, 7.0%, 8.9%, 6.1%, 4.9%, and 8.5%, respectively. Energy-savings of 6.9% and 3.3% were the best for the 95R5B and 57W43B light recipes respectively at frequency 500 Hz and 50% duty cycle. There is no energy-saving in 100 W and 30R70B treatments irrespective of the different combinations of frequency and duty cycles. In addition, according to the data obtained in Table 4, almost all light recipes at distinct frequencies and duty cycles showed power savings. The information shows that the settings for each recipe resulting in the best for energy efficiency scenario are shaded in Table 4. Lastly, while the intensity (PPFDc) increased, the energy-savings in continuous mode, its pulsed LED light reduced. This effect occurred because the highest radiation limits emitted by our lighting system (PPFDp per each duty cycle) were reached, generating an increase in the temperature of the equipment.

4. Discussion

The data shown in the results section indicated the magnitude of this proposal, as a first step, the positive and/or negative effects on plants were evaluated when exposed to the operation modes of artificial LED light (continuous and pulsed). According to the above, to reach a correct comparison between both light operation modes, it must be assured that the amount of energy received by the plant is just the same.
Regarding the photosynthesis process the plant’s response did not generate negative results in pulsed LED light mode. The φPSII parameter evaluated in the statistical analysis for both light operation modes indicated that there are no significant differences, even so, areas that require explanation on this topic are still unknown. Second step consisted of analyzing the energy consumption in both light modes, showing that there are significant energy savings in each light recipe, and the different PPFD levels (intensities) configured.
The energy consumption reported in Table 4 depends on various aspects. First, light treatments (light recipe) were selected according to the literature where is shown that the combination of colors (wavelengths) in the visible spectrum (400–700 nm) is given by percentages of blue, red, green, and white (which includes all wavelengths). Light recipes have shown to increase the quality of the crop, like vitamins, antioxidants, fruits, leaf sizes, among others. In the visible spectrum, there are wavelengths with higher energy (blue) than others (like red), meaning that higher electrical energy consumption is required to generate the amount of photons required. Second, the PPFD levels are the irradiation intensities that must be emitted by the artificial LED lighting system and is closely linked to the energy consumption concerning the higher intensity, higher electricity consumption. In this research, PPFD levels can be applied to plant growth and/or as a complement to light in CPPS (in some production systems combined natural with artificial light). Finally, the close relationship between the pulse frequency and the duty cycle in energy consumption was found. An optimal combination of these parameters (frequency and duty cycle) was given to achieve the maximum energy savings for each light recipe and levels of PPFD configured in the LED lighting system.
In this research it is also proposed a mathematical modeling approach that can enable the application of artificial lights in the pulsed mode in closed plant production systems (CPPS). The theoretical approach described in this study allows the calculation of energy equivalence if one intends to apply pulsed light in CPPS. The transcendent thing about this research is that it shows different quality (wavelength band) and PPFD levels can be impactful on energy savings. It also demonstrates that the adjustment of duty cycle percentages can be adjusted to create the same energy conditions between the operating modes (pulsed and continuous) of light.
Smaller duty ratios were not utilized because, to achieve the energy equivalence in pulsed mode according to Equation (2), it is necessary to increase the voltage levels in the illumination system. In other words, the amplitude of the signal (PPFDp level) must be enhanced, as shown in Figure 3 (Pulsed LED light graph −right−). Considering the technological aspect, some factors do not permit for equalizing the amount of energy to be partitioned between the two operation modes (pulsed and continuous) of the lamps. For example, if the duty cycle is less than 30%, it is likely, the energy equivalence cannot be carried out due to the high voltages required by the lighting system. This implies that the operability of the system poses the risk of generating extreme temperatures, directly affecting the lifetime of the lighting system.
According to this, the technique of artificial light in pulsed mode can improve efficiency in energy consumption considering the value of the duty cycle and PPFD’s levels. Given that vertical farms and plant factories use artificial lighting systems for extended periods of time ranging from eight to sixteen hour per day, energy saving for these operations could be significant if they used light in the pulsed LED light mode.
The mathematical model can help to support this type of research [12,37,38,39,40,41,42,43,44,45,46,47,48] with pulsed light to establish the energy equivalence between the pulsed and continuous LED light operation modes. That is to ensure that the same amount of energy is applied to plants in both modes. Without that, the effects generated between one mode and the other cannot be compared.
If artificial lights are to be applied in the pulsed mode, the electronic design and manufacturing of LED lamps are crucial. It may not be possible to pulse light in some commercial systems because the lights were not designed to operate in this mode; however, a system that can accommodate light pulsing may see shorter life spans of the light bulbs used.
In CPPS it is important to implement techniques, methods, and technology that reduce production costs. The pulsed light technique applied in this research is an economically feasible option for the agro-industrial sector. However, it must be noted that achieving energy-savings with pulsed LED light applications is largely dependent on the design and construction (electronic components) of the illumination system. If artificial lights are to be applied in the pulsed mode, the electronic design and manufacturing of LED lamps are crucial. It may not be possible to pulsate light in some commercial systems because the lights were not designed to operate in this mode. However, systems that can accommodate light pulsing may see shorter life spans of the light bulbs used.

5. Conclusions

This research proposed the use of energy equivalence to compare the effect of pulsed versus continuous light. Moreover, a methodology (mathematical model) that allows you to set up the same quantity of energy in both light operation modes (pulsed and continuous). According to the results, eight of the ten light recipes showed energy savings (over 12%) with a combination of duty cycles and frequency versus continuous light. This study can be used as a quick guide for people involved in the agro-industrial sector who are interested in improving the energy efficiency of their current production systems. Applying pulsed LED irradiation as demonstrated in this research could be an alternative approach and can potentially be implemented in vertical farms and plant factories to enhance efficiency in use and lead to cost savings without adversely impacting plant or crop production.

Author Contributions

Conceptualization, E.O.-G. and N.E.-G.; methodology, D.M., P.A., and E.O.-G.; validation, all authors; formal analysis, D.A.-L. and V.C.; investigation, all authors; resources, E.O.-G., D.M., P.A., E.O., D.A.-L., and V.C.; data curation, E.O.-G., D.M., D.A.-L., and N.E.-G.; writing—original draft preparation, E.O.-G. and N.E.-G.; writing—review and editing, all authors; visualization, P.A., D.A.-L., and V.C.; supervision, all authors. All authors have read and agreed to the published version of the manuscript.

Funding

We acknowledge the support of the Consejo Nacional de Ciencia y Tecnología (CONACYT) in Mexico for supporting this work through funds for projects INFRA-2016-01, Project No. 270665. CB-2016-01, Project No. 287828.

Institutional Review Board Statement

“Not applicable” for studies not involving humans or animals.

Informed Consent Statement

“Not applicable” for studies not involving humans.

Data Availability Statement

The study did not report any data.

Conflicts of Interest

The authors declare no conflict of interest.

References

  1. Kang, S.M.; Radhakrishnan, R.; Lee, K.-E.; You, Y.-H.; Ko, J.-H.; Kim, J.-H.; Lee, I.-J. Mechanism of plant growth promotion elicited by Bacillus sp. LKE15 in oriental melon. Acta Agric. Scand. B 2015, 65, 637–647. [Google Scholar]
  2. Li, J.S.; Xia, X.H.; Chen, G.Q.; Alsaedi, A.; Hayat, T. Optimal embodied energy abatement strategy for Beijing economy: Based on a three-scale input-output analysis. J. Renew. Sustain. Energy Rev. 2016, 53, 1602–1610. [Google Scholar] [CrossRef]
  3. Benke, K.; Tomkins, B. Future food-production systems: Vertical farming and controlled-environment agriculture. SSPP 2017, 13, 13–26. [Google Scholar] [CrossRef] [Green Version]
  4. Eaves, J.; Eaves, S. Comparing the profitability of a greenhouse to a vertical farm in Quebec: Profitability of a greenhouse and a vertical farm. Can. J. Agric. Econ. 2018, 66, 43–54. [Google Scholar] [CrossRef]
  5. Kalantari, F.; Tahir, O.M.; Lahijani, A.M.; Kalantari, S. A review of vertical farming technology: A guide for implementation of building integrated agriculture in cities. Adv. Eng. Forum 2017, 24, 76–91. [Google Scholar] [CrossRef]
  6. Rabara, R.C.; Behrman, G.; Timbol, T.; Rushton, P.J. Effect of Spectral Quality of Monochromatic LED Lights on the Growth of Artichoke Seedlings. Front. Plant Sci. 2017, 8, 190. [Google Scholar] [CrossRef] [Green Version]
  7. Massa, G.D.; Kim, H.-H.; Wheeler, R.M.; Mitchell, C.A. Plant productivity in response to LED lighting. HortScience 2008, 43, 1951–1956. [Google Scholar] [CrossRef]
  8. Ata, K.; Urano, M.; Takahashi, A. Thermal analysis of pulsed LED lighting in plant factory. IMFEDK 2017, 56–57. [Google Scholar] [CrossRef]
  9. Kozai, T. Smart Plant Factory: The Next Generation Indoor Vertical Farms, 1st ed.; Springer: Singapore, 2018. [Google Scholar]
  10. Kozai, T. Led Lighting for Urban Agriculture; Springer: Singapore, 2016. [Google Scholar]
  11. Shimizu, H.; Saito, Y.; Nakashima, H.; Miyasaka, J.; Ohdoi, K. Light Environment Optimization for Lettuce Growth in Plant Factory. IFAC Proc. 2011, 44, 605–609. [Google Scholar] [CrossRef] [Green Version]
  12. Son, K.-H.; Jeon, Y.-M.; Oh, M. Application of supplementary white and pulsed light-emitting diodes to lettuce grown in a plant factory with artificial lighting. Hortic. Environ. Biotechnol. 2016, 57, 560–572. [Google Scholar] [CrossRef]
  13. D’Souza, C.; Yuk, H.-G.; Khoo, G.H.; Zhou, W. Application of light-emitting diodes in food production, postharvest preservation, and microbiological food safety: LEDs in food production and preservation. Rev. Food Sci. Food Saf. 2015, 14, 719–740. [Google Scholar] [CrossRef]
  14. Dou, H.; Niu, G.; Gu, M.; Masabni, J. Effects of light quality on growth and phytonutrient accumulation of herbs under controlled environments. Acta Hortic. 2017, 3, 36. [Google Scholar] [CrossRef] [Green Version]
  15. Han, T.; Vaganov, V.; Cao, S.; Li, Q.; Ling, L.; Cheng, X.; Tu, M. Improving “Color Rendering” of LED lighting for the growth of lettuce. Sci. Rep. 2017, 7, 45944. [Google Scholar] [CrossRef]
  16. Muneer, S.; Kim, E.; Park, J.; Lee, J. Influence of green, red and blue light emitting diodes on multiprotein complex proteins and photosynthetic activity under different light intensities in lettuce leaves (Lactuca sativa L.). Int. J. Mol. Sci. 2014, 15, 4657–4670. [Google Scholar] [CrossRef] [PubMed] [Green Version]
  17. Ruangrak, E.; Khummueng, W. Effects of artificial light sources on accumulation of phytochemical contents in hydroponic lettuce. J. Hortic. Sci. Biotechnol. 2019, 94, 378–388. [Google Scholar] [CrossRef]
  18. Barta, D.J.; Tibbitts, T.W.; Bula, R.J.; Morrow, R.C. Evaluation of light emitting diode characteristics for a space-based plant irradiation source. Adv. Space Res. 1992, 12, 141–149. [Google Scholar] [CrossRef]
  19. Bula, R.J.; Morrow, R.C.; Tibbitts, T.W.; Barta, D.J.; Ignatius, R.W.; Martin, T.S. Light-emitting diodes as a radiation source for plants. HortScience 1991, 26, 203–205. [Google Scholar] [CrossRef] [PubMed] [Green Version]
  20. Dougher, T.A.O.; Bugbee, B. Evidence for yellow light suppression of lettuce growth. Photochem. Photobiol. 2007, 73, 208–212. [Google Scholar] [CrossRef]
  21. Dougher, T.A.O.; Bugbee, B. Differences in the response of wheat, soybean and lettuce to reduced blue radiation. Photochem. Photobiol. 2001, 73, 199–207. [Google Scholar] [CrossRef]
  22. Hoenecke, M.E.; Bula, R.J.; Tibbitts, T.W. Importance of “blue” photon levels for lettuce seedlings grown under red-light-emitting diodes. HortScience 1992, 27, 427–430. [Google Scholar] [CrossRef] [Green Version]
  23. Okamoto, K.; Yanagi, T.; Takita, S. Development of plant growth apparatus using blue and red LED as artificial light source. Acta Hortic. 1996, 440, 111–116. [Google Scholar] [CrossRef] [PubMed]
  24. Olvera-Gonzalez, E.; Alaniz-Lumbreras, D.; Ivanov-Tsonchev, R.; Villa-Hernández, J.; De la Rosa-Vargas, I.; López-Cruz, I.; Lara-Herrera, A. Chlorophyll fluorescence emission of tomato plants as a response to pulsed light-based LEDs. Plant Growth Regul. 2013, 69, 117–123. [Google Scholar] [CrossRef] [Green Version]
  25. Yorio, N.C.; Goins, G.D.; Kagie, H.R.; Wheeler, R.M.; Sager, J.C. Improving Spinach, Radish, and Lettuce Growth under Red Light-emitting Diodes (LEDs) with Blue Light Supplementation. HortScience 2001, 36, 380–383. [Google Scholar] [CrossRef] [Green Version]
  26. Brumfield, R. Dealing with rising energy cost. GNP 2007, 33, 24–31. [Google Scholar]
  27. National Aeronautics and Space Administration. Growing Plants in Space. 2019. Available online: https://www.nasa.gov/content/growing-plants-in-space (accessed on 3 March 2021).
  28. Anpo, M.; Fukuda, H.; Wada, T. Plant Factory Using Artificial Light Adapting to Environmental Disruption and Clues to Agricultural Innovation, 1st ed.; Elsevier: Amsterdam, The Netherlands, 2018. [Google Scholar]
  29. Despommier, D.; Carter, M. The Vertical Farm: Feeding the World in the 21st Century; Macmillan: New York, NY, USA, 2010. [Google Scholar]
  30. Schubert, E.F. Solid-State Light Sources Getting Smart. Science 2005, 308, 1274–1278. [Google Scholar] [CrossRef]
  31. Sanford, S. Energy-Efficient Agricultural Lighting; University of Wisconsin: Madison, WI, USA, 2004; Volume 14, pp. 1–12. [Google Scholar]
  32. Bian, Z.-H.; Cheng, R.-F.; Yang, Q.-C.; Wang, J.; Lu, C. Continuous light from red, blue, and green light-emitting diodes reduces nitrate content and enhances phytochemical concentrations and antioxidant capacity in lettuce. J. Am. Soc. Hortic. Sci. 2016, 141, 186–195. [Google Scholar] [CrossRef] [Green Version]
  33. Gupta, S.D. Light Emitting Diodes for Agriculture; Springer: Singapore, 2017. [Google Scholar]
  34. Ballaré, C.L.; Scopel, A.L.; Sánchez, R.A. On the opportunity cost of the photosynthate invested in stem elongation reactions mediated by phytochrome. Oecologia 1991, 86, 561–567. [Google Scholar] [CrossRef]
  35. Domurath, N.; Schroeder, F.-G.; Glatzel, S. Light response curves of selected plants under different light conditions. Acta Hortic. 2012, 291–298. [Google Scholar] [CrossRef] [Green Version]
  36. Goto, E. Effects of Light Quality on Growth of Crop Plants under Artificial Lighting. Environ. Control Biol. 2003, 41, 121–132. [Google Scholar] [CrossRef] [Green Version]
  37. Stenitz, B.; Poff, K.L. A single positive phototropic response induced with pulsed light in hypocotyls of Arabidopsis thaliana seedlings. Planta 1986, 168, 305–315. [Google Scholar] [CrossRef]
  38. Tennessen, D.J.; Bula, R.J.; Sharkey, T.D. Efficiency of photosynthesis in continuous and pulsed light emitting diode irradiation. Photosynth. Res. 1995, 44, 261–269. [Google Scholar] [CrossRef]
  39. Jao, R.-C.; Fang, W. Effects of frequency and duty ratio on the growth of potato plantlets in vitro using light-emitting diodes. HortScience 2004, 39, 375–379. [Google Scholar] [CrossRef] [Green Version]
  40. Jao, R.-C.; Fang, W. Growth of potato plantlets in vitro is different when provided concurrent versus alternating blue and red-light photoperiods. HortScience 2004, 39, 380–382. [Google Scholar] [CrossRef] [Green Version]
  41. Jao, R.-C.; Fang, W. An adjustable light source for photo–phyto related research and young plant production. Appl. Eng. Agric. 2003, 19. [Google Scholar] [CrossRef]
  42. Yoneda, M.Y. Method of Cultivating Plant and Illuminator for Cultivating Plant. European Patent Office Patent No. EP1374665A1, 2 January 2004. [Google Scholar]
  43. Olvera-Gonzalez, E.; Alaniz-Lumbreras, D.; Ivanov-Tsonchev, R.; Villa-Hernández, J.; Olvera-Olvera, C.; González-Ramírez, E.; Castaño, V. Intelligent lighting system for plant growth and development. Comput. Electron. Agric. 2012, 92, 48–53. [Google Scholar] [CrossRef]
  44. Senol, R.; Kilic, S.; Tasdelen, K. Pulse timing control for LED plant growth unit and effects on carnation. Comput. Electron. Agric. 2016, 123, 125–134. [Google Scholar] [CrossRef]
  45. Kanechi, M.; Maekawa, A.; Nishida, Y.; Miyashita, E. Effects of pulsed lighting-based light-emitting diodes on the growth and photosynthesis of lettuce leaves. Acta Hortic. 2016, 207–214. [Google Scholar] [CrossRef]
  46. Pardo, G.P.; Velázquez, S.T.; Cruz, A.; Aguilar, C.H.; Pacheco, F.A.D.; Martínez, F.R. Pulsed led light in germination and growth of lettuce seeds. BOTHALIA 2016, 46, 15. [Google Scholar]
  47. Vaštakaitė, V. Pulsed Light-Emitting Diodes for a Higher Phytochemical Level in Microgreens. J. Agric. Food Chem. 2017, 65, 6529–6534. [Google Scholar] [CrossRef]
  48. Son, K.; Lee, S.; Oh, M. Comparison of Lettuce Growth under Continuous and Pulsed Irradiation Using Light-Emitting Diodes. Korean J. Hortic. Sci. Technol. 2018, 36, 542–551. [Google Scholar]
  49. Genty, B.; Briantais, J.-M.; Baker, N.R. The relationship between the quantum yield of photosynthetic electron transport and quenching of chlorophyll fluorescence. Biochim. Biophys. Acta Gen. Subj. 1989, 990, 87–92. [Google Scholar] [CrossRef]
  50. Maxwell, K.; Johnson, G.N. Chlorophyll fluorescence—a practical guide. J. Exp. Bot. 2000, 51, 659–668. [Google Scholar] [CrossRef]
  51. Meng, Q.; Kelly, N.; Runkle, E.S. Substituting green or far-red radiation for blue radiation induces shade avoidance and promotes growth in lettuce and kale. Environ. Exp. Bot. 2019, 162, 383–391. [Google Scholar] [CrossRef]
  52. Mickens, M.A. A strategic approach for investigating light recipes for ‘Outredgeous’ red romaine lettuce using white and monochromatic LEDs. Life Sci. Space Res. 2018, 19, 53–62. [Google Scholar] [CrossRef]
  53. Naznin, M.; Lefsrud, M.; Gravel, V.; Azad, M. Blue Light added with Red LEDs Enhance Growth Characteristics, Pigments Content, and Antioxidant Capacity in Lettuce, Spinach, Kale, Basil, and Sweet Pepper in a Controlled Environment. Plants 2019, 8, 93. [Google Scholar] [CrossRef] [PubMed] [Green Version]
Figure 1. Experimental setup. (a) LED light treatments. (b) General scheme of the experiment. (c) Sequence of the measurements.
Energies 14 01603 g001
Figure 2. LED light treatments. (a) White. (b) Red−blue (50–50%). (c) Red−blue (70–30%). (d) Red-blue (30–70%).
Energies 14 01603 g002aEnergies 14 01603 g002b
Figure 3. Graphic representation of the energy equivalence supplied to the plant under the operation modes: continuous (left) and pulsed LED light (right).
Energies 14 01603 g003
Figure 4. Results of the φPSII in Pulsed mode versus continuous mode 60 min after the plant was treated. (a) White treatment. (b) Red−Blue (50–50%) treatment. (c) Red−Blue (70–30%) treatment. (d) Red−Blue (30–70%) treatment. All light treatments at 40, 50, 80, 110, 170 and 230 μmol m−2 s−1 (PPFDp/c).
Energies 14 01603 g004
Table 1. Maximum PPFD by quality and irradiated surface.
Quality (Color)Maximum PPFD (μmol)Irradiated Surface (m2)
White1500.19 (37 × 50 cm)
Blue900.19 (37 × 50 cm)
Green550.19 (37 × 50 cm)
Red1500.19 (37 × 50 cm)
Total4450.19 (37 × 50 cm)
Table 2. Light treatments (recipes).
RecipesRedGreenBlueWhite
95R5B95%0%5%0%
83R17B83%0%17%0%
60R40B60%0%40%0%
57W43B0%0%43%57%
67R11B22G67%22%11%0%
67R33G67%33%0%0%
100W0%0%0%100%
50R50B50%0%50%0%
70R30B70%0%30%0%
30R70B30%0%70%0%
Table 3. Values of ton.
Fc (Hz)ton (s)
Duty Cycle (%)
405060708090
1 × 1020.0040.0050.0060.0070.0080.009
5 × 1020.00080.0010.00120.00140.00160.0018
1 × 1030.00040.00050.00060.00070.00080.0009
Table 4. Energy consumption of two lamps in the pulsed and continuous modes. The best energy savings values are shaded.
Initial Parameters* Calculated ParametersMeasured Parameters
Light Treatments (Recipes)PPFDc (µmol m−2 s−1)PhotoperiodFc (Hz)* T* Np* PPFDp (µmol m−2 s−1)Energy Equivalence (mol m−2 d−1)Energy Consumption ± 0.1 (W/h)
Duty Cycle (%) Duty Cycle (%)
405060708090* DLIp* DLIcContinuous405060708090
95R5B5018/61000.016.48 × 106125100837163563.243.2423.821.321.622.222.723.023.7
5000.0023.24 × 10722.123.123.123.423.723.8
10000.0016.48 × 10723.023.123.423.523.523.7
83R17B5018/61000.016.48 × 1061251008371635624.021.421.722.122.723.123.8
5000.0023.24 × 10722.823.123.223.523.824.0
10000.0016.48 × 10723.023.323.323.723.924.0
60R40B5018/61000.016.48 × 1061251008371635624.821.722.322.723.123.524.3
5000.0023.24 × 10722.323.323.823.924.124.5
10000.0016.48 × 10723.723.724.124.224.424.5
57W43B5018/61000.016.48 × 106 1251008371635626.023.123.724.224.625.025.6
5000.0023.24× 10723.223.223.725.425.526.0
10000.0016.48 × 107 25.426.525.625.825.826.0
67R11B22G5018/61000.016.48 × 1061251008371635625.421.922.422.923.423.924.7
5000.0023.24 × 10723.423.724.024.324.524.7
10000.0016.48 × 107 23.723.924.124.324.524.8
67R33G5018/61000.016.48 × 1061251008371635624.021.321.622.122.422.823.5
5000.0023.24 × 107 22.622.823.023.123.423.7
10000.0016.48 × 10723.123.223.323.323.624.0
100W5018/61000.016.48 × 106 1251008371635625.523.423.824.224.424.525.1
5000.0023.24 × 10722.823.023.323.625.225.5
10000.0016.48 × 10725.725.625.725.425.425.5
50R50B5018/61000.016.48 × 106 1251008371635624.822.022.322.623.123.624.4
5000.0023.24 × 107 22.122.823.724.024.124.4
10000.0016.48 × 107 23.523.823.924.324.524.6
70R30B5018/61000.016.48 × 1061251008371635624.421.622.022.422.823.223.9
5000.0023.24 × 107 23.223.323.423.723.824.1
10000.0016.48 × 107 23.523.623.623.824.024.2
30R70B5018/61000.016.48 × 1061251008371635625.022.422.723.223.623.924.6
5000.0023.24 × 107 22.422.723.324.324.724.8
10000.0016.48 × 107 24.524.424.524.624.924.8
95R5B11018/61000.016.48 × 1062752201831571381227.137.1330.127.527.428.128.428.929.5
5000.0023.24 × 10726.626.626.928.029.429.8
10000.0016.48 × 107 30.330.029.929.929.930.0
83R17B11018/61000.016.48 × 10627522018315713812230.227.527.428.128.629.129.7
5000.0023.24 × 107 26.726.627.927.829.429.8
10000.0016.48 × 107 30.430.030.029.930.330.2
60R40B11018/61000.016.48× 106 27522018315713812231.028.228.328.829.129.630.3
5000.0023.24 × 107 27.227.127.127.730.030.6
10000.0016.48 × 107 31.130.830.630.730.730.6
57W43B11018/61000.016.48 × 10627522018315713812234.432.232.032.132.332.833.4
5000.0023.24 × 107 30.630.230.330.933.533.9
10000.0016.48 × 107 35.034.334.134.034.134.1
67R11B22G11018/61000.016.48 × 10627522018315713812231.227.527.828.328.929.630.3
5000.0023.24 × 10727.027.127.628.629.930.4
10000.0016.48 × 107 30.330.330.330.430.730.8
67R33G11018/61000.016.48 × 10627522018315713812229.827.627.628.028.227.529.2
5000.0023.24 × 10726.826.426.626.929.029.3
10000.0016.48 × 10730.429.929.929.729.929.7
100W11018/61000.016.48 × 10627522018315713812235.134.734.133.933.533.834.3
5000.0023.24 × 10733.132.132.234.534.834.8
10000.0016.48 × 107 37.736.435.935.435.034.9
50R50B11018/61000.016.48 × 10627522018315713812231.228.828.628.829.129.930.7
5000.0023.24 × 107 27.627.527.628.030.330.8
10000.0016.48 × 107 31.631.330.931.030.831.1
70R30B11018/61000.016.48 × 10627522018315713812230.227.427.728.328.528.929.5
5000.0023.24 × 107 26.626.626.827.129.329.7
10000.0016.48 × 107 30.330.130.030.130.130.0
30R70B11018/61000.016.48 × 106 27522018315713812232.231.030.630.630.530.831.5
5000.0023.24 × 107 29.829.129.229.531.431.8
10000.0016.48 × 107 33.833.132.632.232.232.3
95R5B18018/61000.016.48 × 106450360300257.122520011.6611.6636.936.836.136.035.635.736.2
5000.0023.24 × 107 35.434.435.837.136.936.9
10000.0016.48 × 10740.138.737.837.637.036.8
83R17B18018/61000.016.48 × 10645036030025722520037.136.135.835.735.435.636.1
5000.0023.24 × 107 34.733.833.736.136.736.8
10000.0016.48 × 107 39.338.437.937.437.036.9
60R40B18018/61000.016.48 × 10645036030025722520037.837.637.137.036.636.837.2
5000.0023.24 × 107 36.135.235.238.038.138.1
10000.0016.48 × 10741.139.538.838.638.338.0
57W43B18018/61000.016.48 × 10645036030025722520043.545.544.143.343.243.443.5
5000.0023.24 × 10743.742.145.244.844.443.8
10000.0016.48 × 107 48.646.945.745.144.344.2
67R11B22G18018/61000.016.48 × 10645036030025722520037.336.035.735.935.936.036.7
5000.0023.24 × 107 34.934.034.036.537.137.4
10000.0016.48 × 107 39.538.437.837.637.437.3
67R33G18018/61000.016.48 × 10645036030025722520036.937.736.836.435.835.936.5
5000.0023.24 × 107 36.435.234.737.337.237.2
10000.0016.48 × 107 41.439.538.437.837.537.1
100W18018/61000.016.48 × 10645036030025722520046.753.250.248.147.047.147.0
5000.0023.24 × 10752.448.650.649.248.147.3
10000.0016.48 × 107 56.651.849.749.348.347.5
50R50B18018/61000.016.48 × 106 45036030025722520038.439.638.438.237.837.838.0
5000.0023.24 × 107 38.336.836.539.239.038.9
10000.0016.48 × 107 43.641.440.239.739.538.9
70R30B18018/61000.016.48 × 10645036030025722520037.136.335.835.735.535.836.4
5000.0023.24 × 107 34.734.033.936.536.937.1
10000.0016.48 × 107 39.438.337.837.537.137.0
30R70B18018/61000.016.48 × 10645036030025722520040.646.543.641.841.240.940.7
5000.0023.24 × 10745.441.943.342.842.141.4
10000.0016.48 × 107 50.347.044.643.142.341.7
* These parameters were calculated by mathematical model.
Publisher’s Note: MDPI stays neutral with regard to jurisdictional claims in published maps and institutional affiliations.

