Article

A Financial Evaluation of a Multiple Inclination, Rooftop-Mounted, Photovoltaic System Where Structured Tariffs Apply: A Case Study of a South African Shopping Centre

by
Dirk Johan van Vuuren
1,
Annlizé L. Marnewick
2,* and
Jan Harm C. Pretorius
2
1
Engineering Augmented Degree Programme, University of Pretoria, Pretoria 0002, South Africa
2
Postgraduate School of Engineering Management, University of Johannesburg, Johannesburg 2006, South Africa
*
Author to whom correspondence should be addressed.
Energies 2021, 14(6), 1666; https://doi.org/10.3390/en14061666
Submission received: 15 January 2021 / Revised: 4 March 2021 / Accepted: 4 March 2021 / Published: 17 March 2021
(This article belongs to the Section G: Energy and Buildings)

Abstract

:
Fundamental mathematical principles were applied to calculate the return on investment (ROI) of a multiple inclination, rooftop-mounted, photovoltaic (PV) system that is connected to a structured tariff network. Recent history has seen a disproportionate increase in electricity tariffs within South Africa, enabling an increase in the deployment rates of PV technologies. Given the inherent uncertainty associated with simulating the electricity yield of a PV system, it can become difficult to estimate the ROI in advance. This study contributes to existing knowledge by presenting a process for calculating the ROI of a case study rooftop-mounted PV system using mathematical first principles where structured tariffs apply. The PV modules were mounted to a curved roof structure, ranging from 9° towards a southerly direction to 10° towards a northerly direction. The research results indicate that since the PV system is located within the southern hemisphere, the ROI will increase when PV modules are orientated towards the northerly direction to attain a maximum of R0.0059/Wp/Day at 10°, and a minimum of R0.0025/Wp/Day at 9° towards the southerly direction in the winter season. Summer maximum ROI yielded an average of between R0.0050/Wp/Day and R0.0052/Wp/Day, irrespective of the angle of inclination of the PV modules. It was concluded that PV systems must be designed to favour winter electricity production for increased ROI where structured tariffs apply within a South African context.

1. Introduction

Solar photovoltaic (PV) electricity production utilises electromagnetic radiation from the sun to convert energy into electricity [1]. The electricity from the PV system is then unified into the microgrid of the consumer for use. The use of a PV system allows consumers to minimise their operational costs where dependability on the existing utility is reduced (lowering the electricity consumption from the utility) or when independent backup generators are in operation [2,3].
By utilising a grid-tie PV system, electricity is generated and consumed by the consumer—inferring that no electricity is stored or fed back into the electrical network (since the latter is not permitted in South Africa). Implementation of such a system is reliant on an additional source, such as the feed from the existing power utility, so that grid synchronisation may occur and disruptions can be augmented [4,5].
PV deployment rates are expected to increase in the future. In line with the 2019 iteration of the Integrated Resource Plan (IRP), an increase in Small-Scale Embedded Generation (SSEG) systems is expected when they are connected to the local network. This is further driven by the exemption of SSEG systems from obtaining a generation licence from the National Energy Regulator of South Africa (NERSA), given that those systems do not supply more than 1 MW into the local network [3]. Furthermore, the rollout of national SSEG rules and regulations has promoted the rate at which these systems are designed and commissioned [6].
A portion of the expected PV systems will be funded and utilized by private investors on their property. In essence, the investor will acquire a system that utilizes existing roof structures, or a newly-built building, to accommodate the PV modules. One example where the use of rooftop-mounted PV systems has increased in recent history involves the retail industry—an industry that mostly consists of private investors. This is supported by research conducted by Pandarum, Lekoloane and Milazi [7], who indicates that the retail industry (distribution and shopping centres) dominates the market concerning the deployment of PV technologies, with an installed capacity of 57.3%. The use of a grid-tie PV system in shopping centres has several inherent benefits, mainly that the ideal production curve of a PV system follows a similar trajectory to a shopping centre’s electricity consumption trajectory [3,5]. This was illustrated by van Vuuren et al. [3] who observed that the load demand from a shopping centre and the electricity production from the PV system (on the same premises) follows a similar trajectory, albeit with an approximate 1-h phase shift. In the summer months of October to January, load demand increases due to increased air-conditioning activity; similarly, PV production is higher due to increased radiation levels. Conversely, winter months see a reduction in load demand due to decreased ambient temperatures. However, electricity production from the PV system also decreases due to reduced radiation levels from the sun.
In South Africa, shopping centres are connected to the network through a distribution authority or directly to the electricity utility [5]. Either way, the electricity tariffs are structured so that the costs vary according to the time-of-use (ToU), seasonal change and the type of connection onto the main incomer feed (voltage, transmission zone–distance from the distribution centre, and the prescribed load). Due to South Africa’s tariff structure, which is structured ”to ensure a fair and economic balance between fixed and variable charges to provide benefit to the business and the customer” [8], it is very difficult to estimate the return on investment (ROI) of a grid-tie PV system. The main reason is that the simulation software (PVSyst, PVSol Premium, PVWatts) used in tender processes or feasibility studies do not always provide information such as electricity yield at a specified time of day, or is time-consuming to conduct [9]. Most software provides aggregate results of a day or month and, as such, research that investigates the true ROI of a PV system connected to a network where structured tariffs apply is limited [10,11].
The objective of this research was to derive a mathematical process to estimate and calculate the ROI of a PV system connected to an electrical network of a shopping centre where a structured tariff is applied. Furthermore, the research aimed to illustrate the relationship between the daily ROI against the effect of variant angle of inclination and seasonal change.
This research is novel in that there is limited research on a rooftop-mounted, multiple inclination, PV system connected to a structured tariff network. When applied correctly, the methodology will assist investors in mitigating their risk and increasing their ROI, given that their system complies with similar tariff conditions. In conducting the research, the results from a case study shopping centre were used. However, the application of this research is not limited to a shopping centre, but any PV system that operates under similar conditions. The case study consists of a curvature roof where the angle of inclination varies such that −9° ≤ β ≤ 10°, while the angle of the PV modules concerning the azimuth remains constant such that γ = 0°. The system is rated 900 kVA and 924.428 kWp.
The literature review below reflects on the research and information concerning the ROI of a PV system. The experimental methodology deals with the case study characteristics and the method used in calculating the ROI. The research results are presented and discussed accordingly. Finally, the conclusion reflects and summarises the results and provides future recommendations.

2. Literature Review

The literature review consists of the following subsections: existing literature relating to the implementation of solar PV where structured tariffs are applied; the history of tariffs and solar pricing applicable to South Africa; the existing electricity tariffs in South Africa; a presentation of the equations used to determine the ROI of the PV system; and the process followed in defining the integral to calculate the ROI from first principles.

2.1. Existing Literature Relating to PV Economic Performance

In 2012, Masini and Menichetti [12] identified four factors that may influence the decision-making process of investors when dealing with renewable energy. They concluded that deployment rates are adversely affected by (1) the technical effectiveness and reliability of the investment; (2) the lack of policies; (3) the financial benefits of the system and how it may be influenced by future externalities; and (4) the perceptions of the technology.
When considering the financial benefits of such a system, investors base their decisions solely on its ROI over a given period. Since 2015, the deployment rates of PV have seen a considerable increase, driven by a reduction in procurement costs and an increase in existing electricity tariffs—all of which are drivers behind increased ROI [13]. With regard to the former, the application of Swanson’s law was valid which states that “the price of solar photovoltaic modules tend to lower by 20% for every doubling of cumulative shipped volume” [14].
However, since 2017/2018 the price of PV technologies has seen a gradual stabilisation at approximately $0.3/W [15] and $0.06–0.08/kWh for developing countries where bidding processes apply [16]. As a result, the main driver in South Africa behind the deployment of PV is the increase in existing tariffs—implying that grid parity will be obtained by the increase in electricity tariffs from the existing utility.
In South Africa, commercial consumers of electricity comply with a structured tariff process where ToU and seasonal change affect the price of electricity. In line with this, Walwyn and Brent [13] researched the drivers behind renewable energy in South Africa. They concluded that the levelised cost of electricity (LCOE) tends to be site-specific and that direct comparisons are complex and can be misleading. As such, research that investigates how the costs of PV, and the integration thereof into existing infrastructure, behaves is limited. The conclusion was made that solar insulation and electricity prices can affect the financial viability of a solar PV system [17].
Most shopping centres prefer to utilise a rooftop system where the PV modules are affixed to the existing roof. As a result, various research [18,19,20] has identified the inherent benefits of implementing a rooftop PV system where ToU tariffs are applied.
Sepúlveda-Mora and Hegedus [21] researched the commercial utilisation of PV technologies in combination with lithium-ion battery storage systems. Their results indicate that when a ToU rate is imposed, the economics of the system improve by 14%, compared to the standard tariff structure. However, they concluded that, although there are benefits, implementation of such a system is not viable on a commercial level. Similarly, Zhou et al. [22] simulated the effect of reducing the electrical load when tariffs are increased by using a battery energy storage system (BESS). They concluded that electricity costs can be reduced by up to 42% when a BESS is implemented correctly. In addition, various other research [23,24] illustrates that by implementing an efficient BESS, electricity costs can be reduced when structured tariffs are applied.
The aforementioned literature deals with how a BESS can reduce operational costs when structured tariffs are applied. However, research on a grid-tie system within a South African context is limited. Chudy et al. [25] investigated the effect of increased PV electricity generation on tariffs. In conducting their simulations, they investigated the effect of seasonal change on tariffs and observed that winter and summer seasons behave differently. In general, they found that electricity demand in the summer season is driven by cooling systems such as air-conditioning units. Conversely, the winter season experiences a higher electricity demand, driven by the need for heating. As a result, the winter season sees an increase of approximately 5–15% in electricity demand compared to the summer season—this is especially evident from 08:00 to 12:00, and then from 17:00 to 21:00. Similar behaviour was illustrated by van Vuuren, Marnewick and Pretorius [3], who observed that the load demand of a shopping centre varies according to seasonal change. Due to the variation of load demand, the South African utility varies tariffs accordingly (as will be discussed in the subsequent section). In addition, Chudy et al. [25] concluded from their model that high deployment rates of solar PV (excess of 5 GW) can increase the overall system LCOE (including the conventional generation techniques). The only considerable reduction is that of CO2 emissions, where a 10 GW (a grid penetration of approximately 27%) PV grid penetration will reduce CO2 emissions by 11.2% [25].
Hohne, Kusakan and Numbi [26] investigated the effect of a dual-axis PV tracking structure connected to a BESS system with a grid connection applicable to a healthcare institution in South Africa. The major advantages of such a system are fourfold: firstly, the use of the BESS enables the consumer to reduce electricity reliance on the existing infrastructure when tariffs are increased [22,23,24]; secondly, tracking systems enable a higher average electricity yield of approximately 45% in South Africa [27]; thirdly, the tracking system allows for higher electricity yield when electricity tariffs are increased [27]; and fourthly, in the case of load shedding (a controlled blackout mechanism), reliance on the generator system is reduced. Their results indicate that energy cost savings of 10.5% can be obtained when such a system is implemented (without the presence of an optimal control algorithm) and 38% when an optimal control algorithm is implemented.
Various other research has been conducted relating to the financial performance of PV systems. Table 1 is a summary of other studies.
From Table 1, the results indicate that structured tariffs, where ToU and seasonal change affect the tariffs, can influence the financial characteristics of a PV system. The research conducted by Xin-gang and Yi-min [28] resulted in a cost-benefit model being developed. However, their research is limited to China (where different operation conditions occur). A similar model was derived by Ling-zhi et al. [30] who analysed the economic performance of a CSP system in China. Similar to the above, their research were country-specific and focused on CSP. Concerning the research conducted by Talavere et al. [29], Korsavi et al. [31], and Bianchini et al. [32], all of them used a case study to determine the financial performance of a PV system, but is limited to a specific country and is not considered to be commercial-sized (less than 50 kW).
Limited research exists that investigate a commercially-sized (greater than 50 kW), multiple inclination, PV system case study where a structured tariff applies. The focus of this research concerns South Africa. Therefore, the following section provides literature relating to how tariffs vary according to operating conditions, with a specific focus on South Africa.

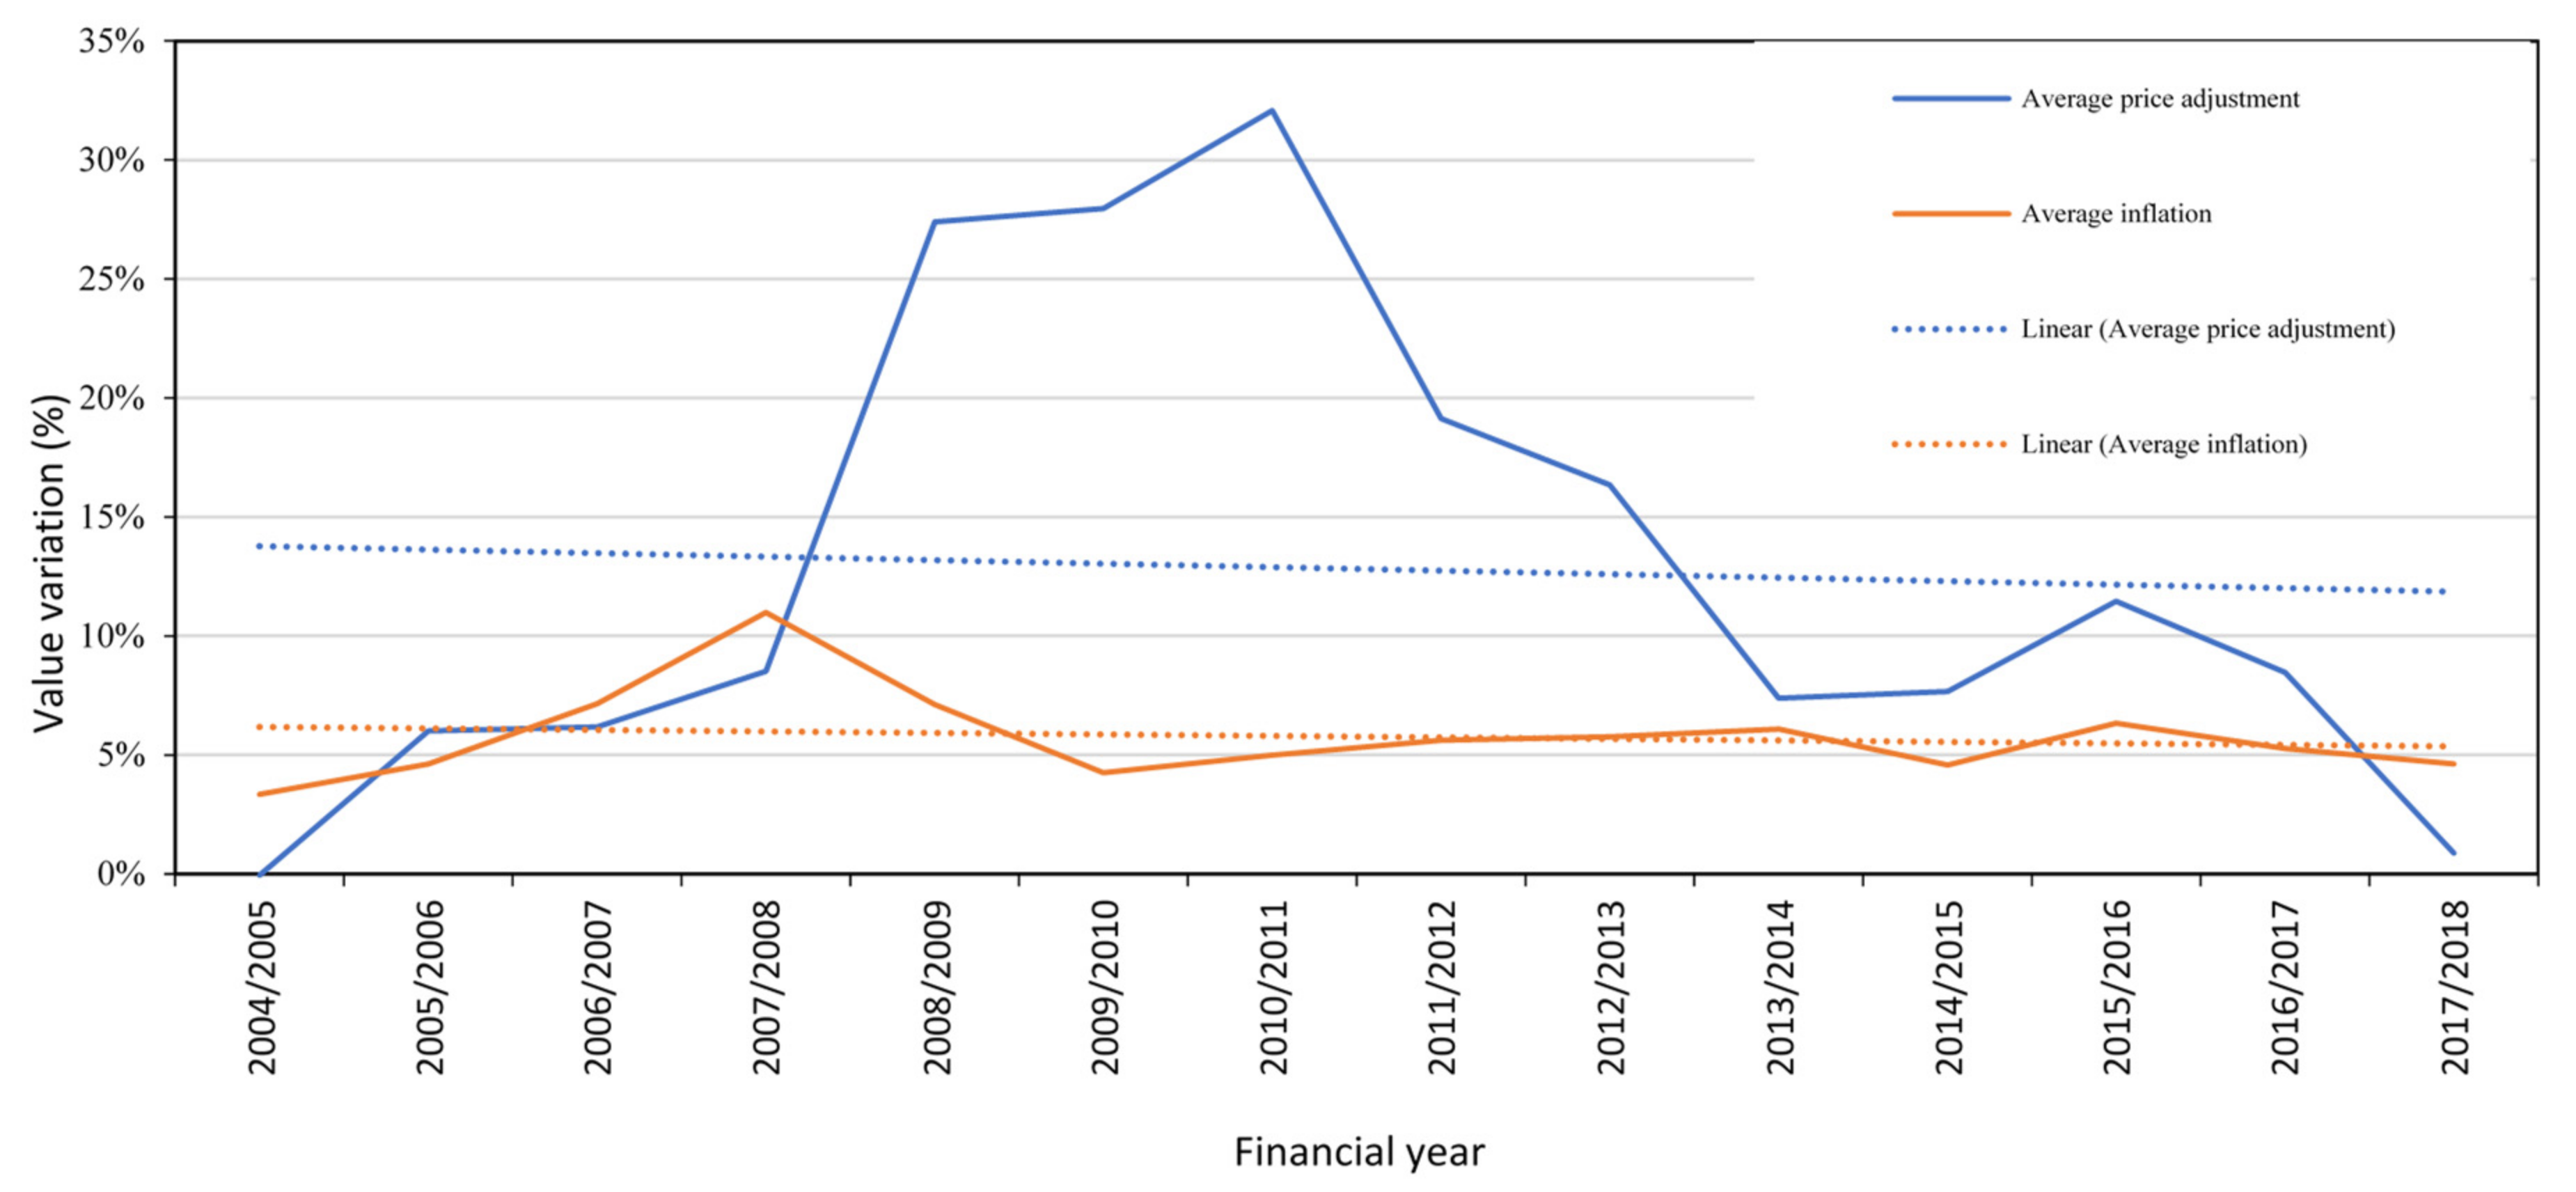
2.2. History of Tariffs and Solar Pricing in South Africa

In the late 1970s, the South African government overinvested in its electricity generation network. This was motivated by the oil demand of the 1970s which saw the rise of oil prices and a resulting increase in demand for electricity. Electricity demand grew by 12% and 13% in 1973 and 1974, respectively [33]. Based on this, the government approved the addition of more power stations to the existing grid. However, the increased demand for electricity did not persist, which subsequently resulted in excess electricity generation [33]. In an attempt to sell the excess electricity, the South African government implemented a steady reduction in electricity tariffs in the 1980s and continued to do so for the following two decades. By 2005, the real average price of electricity was reduced by more than 40%, and the country’s average electricity tariffs were among the lowest in the world [33,34].
Due to increased economic activity after international sanctions were lifted in the 1990s, load demand increased until a threshold was surpassed. In 2008, load shedding was enforced by NERSA after the electricity utility failed to meet the requirements of the national electricity grid [35,36,37]. The construction of two coal-based power plants, the addition of relatively small electricity generation systems, and poor management led to a cumulative electricity tariff increase of 114% (excluding negotiated pricing agreements) between 2008 and 2013 to support the upgrading process of the existing infrastructure [34]. Since then, tariffs have seen a steady increase. This, in combination with comparatively low inflation rates, suggests that tariffs have seen a disproportionate increase. The aforementioned effect is illustrated in Figure 1, which shows the historical average tariff increase and the historical inflation rate of South Africa [38,39].
From Figure 1 it can be seen that for the financial year of 2004/2005, the average price adjustment was −0.05% for electricity tariffs. Thereafter, the average increase in tariffs decreased from 14% to 11.5% (based on the trendline) annually from 2004/2005 to 2017/2018. In the financial year of 2007/2008, tariffs increased by 8.52% and continued to increase to reach a maximum of 32.08% in 2010/2011—all of which was to fund the construction of additional power stations. The rate at which tariffs were increased reduced to an average of approximately 10% between 2013 and 2018. Regarding the average inflation rate of South Africa, inflation declined from 5.27% in 2004 to approximately 5.05% in 2018 (based on the trendline). This leads to the conclusion that tariffs have increased disproportionately [38,39].
Conversely, solar PV technologies have seen an annual reduction in procurement costs in recent history. Since 2002, the average price of solar PV technologies has seen an annual reduction, ranging from 5.0 $/W to approximately 0.9 $/W in 2013. Thereafter, it began to stabilise. However, the annual increase in electricity tariffs resulted in the price of solar PV reaching grid parity for investment purposes in 2014/2015 [13].
Grid parity is, however, dependent on the tariffs applicable to the relevant solar system. For example, a system connected to a municipal network will have a higher grid parity compared to one connected directly to the feed from the network of the South African utility. This must be considered, as the ROI varies depending on the type of connection [40].
When investing in solar PV, the primary driver is the ROI. To ascertain the economic feasibility of the investment, financial criteria are applied, as per Section 2.3 [41].

2.3. Financial Criteria for PV Systems

Various mechanisms are specifically designed to promote the deployment of solar PV technologies, including feed-in tariffs, risk insurance and load-softening programmes, loan guarantees, tax incentives and policy drivers [42,43,44]. Research conducted by Lasco Crago and Chernyakhovskiy [17] indicates that rebates are a significant contributor to the addition of solar PV—with a rebate of $1/watt resulting in an average deployment increase of 47%. However, the results presented in this article are based on the assumption that the investor will be exposed to the risk, without the addition of the aforementioned mechanisms.
The theoretical viability of a PV system entails three criteria: commercial, economic and social aspects [3]. This research focused on the economic feasibility of the system.
According to Dağtekin, et al. [41] and Chudy et al. [25], there are five commonly applied criteria in a feasibility study to determine the economic feasibility of a PV system:
  • Net present value (NPV);
  • Internal rate of return (IRR);
  • Levelised cost of energy (LCOE);
  • Benefit/cost (B/C) ratio; and
  • Payback period.
However, before the aforementioned economic evaluation metrics can be applied, the predicted costs and revenues must be calculated. The following discusses the predicted costs and revenues, followed by depicting the commonly used equations in the evaluation metrics.
For summarisation purposes, Table 2 is used to display the nomenclature utilised in the equations.

2.3.1. Costs over the Life Cycle of the PV System

Table 3 is a summary of the common assumptions relating to the predicted expenditure of the PV system. It includes the cost and weight of each component relating to the initial investment cost, the assumptions made in future operating costs and the financing parameters if the system is to be financed. It must be noted that future assumptions are country-specific and that these values may vary accordingly.
The total expenditure of the PV system can be classified as a function of the present value of the capital expenditure ( P C k ) , the present value of O & M expenses ( P C O & M ) and the predicted fuel expenses ( P C F u e l = 0   for   a   PV   system ) . The equation for determining the total expenditure over a defined period can be presented as follows [28,48]:
T L C P V =   P C k +   P C O & M +   P C F u e l  
where T L C P V = Total expenditure.
The capital expenditure for a PV system can be depicted as a function of the present value of the construction costs, the payment of interest on loans, tax-related expenses, and insurance costs. Therefore, P C k can be written as follows [28]:
P C K =   P C s +   P C i r +   P C V A T +   P C i n s  
Once the capital expenditure for the PV system has been defined, Equation (2) can be integrated into Equation (1) to form Equation (3) [28]:
T L C P V   =   P C s +   P C i r +   P C V A T +   P C i n s +   P C O & M  
The sum of the annual cash outflows throughout the life cycle of the PV system consists of additional costs, and can be depicted as follows [28]:
C O   =   T i n c +   V A T i   ×   t a d d +   C i n s +   C O & M ,   i = 1 ,   2 ,   , T
The payment of interest must be considered in determining the total expenditure of a PV system [28]:
C i r =   l × k × O k × 1 i 1 R P ,   i = 1 ,   2 ,   , R P
Tax is a capital expenditure derived from the annual income from the PV system by generating electricity. It is depicted as a function of income tax ( T i n c ), value-added tax ( V A T i ) and surtax ( P T a d d ) . The equations for each can be depicted as follows, respectively [28,30]:
T i n c = P e i 0 × E i × 1 π   +   P e i 1 × E i × π   +   β V A T × V A T i     O k D p     C i r   C i n s   C O & M × r i n c ,   i = 1 ,   2 ,   , T
V A T i = T o u t T i n = 0 ,   i = 1 , 2 s a l e s   a m o u n t   α × C O & M × t V A T ,   i = 3 ,   4 ,   , T
P T a d d = i = 3 T V A T i × t a d d   1 + f 1 + r i 1
Finally, the O & M costs must be considered when dealing with a rooftop PV system. The present value of the O & M costs can be depicted in the following equation [28,31]:
P C O & M =   C O & M × i = 1 T   1 + f 1 + r i 1
Once the total costs of the PV system have been considered, the revenue must be considered.

2.3.2. Revenues from the PV System

The income from a grid-tie PV system is calculated based on the electricity savings incurred throughout its lifecycle by assuming the electricity would be acquired from the current utility. A general equation for calculating the income from a PV system was generated by Ling-zhi et al. [48] and Xin-gang et al. [28]:
N R p v =   E i × π × P e i 1 +   E i × 1 π × P e i 0   +   P e i 2
where
  • N R p v = Power generating revenues in an annual period
  • E i = Annual generation
  • P e i 0 = Feed-in tariff
  • P e i 1 = Self-use electricity price
  • P e i 2 = Subsidy price
  • π = ratio of self-use electricity
When referring to Equation (10) and South Africa, it must be noted that P e i 1 is a varying value that depends on seasonal change and ToU. Furthermore, feed-in and subsidies are not currently available, therefore P e i 2 = P e i 1 = 0 . As a result, the power generating revenues N R p v is dependent on existing tariffs and the annual generation from the PV system.
The annual generation ( E i ) from a PV system can be depicted as a function of the annual radiation at the particular region ( H i ) , the standard solar radiation intensity ( H ) , the installed capacity of the system ( M ) , the radiation coefficient of inclined PV modules ( C ) , the overall influence coefficient of power generation ( θ ) and the degradation rate of the system ( ε i ) . As a result, E i can be depicted as follows [28,48]:
E i =   H i H × M × C × θ × 1 ε i i
Once the annual generation is known, the revenues ( N R p v ) can be calculated using the known tariffs. Since inflation is present, the annual cash inflow can be depicted as follows [48]:
C I =   N R p v +   β V A T × V A T i ,   i = 1 ,   2 ,   , T
Similarly, the present value of the revenues from the PV system over its lifecycle can be depicted using the following equation [48]:
T L R p v =   ( N R p v +   β V A T × V A T i ) × i = 1 T 1 + f 1 + r i 1
Once the revenue and expenditure have been identified, the appropriate evaluation criteria can be applied.

2.3.3. Net Present Value (NPV)

The NPV method is the most widely used analysis method to determine the economic feasibility of a PV system. Furthermore, it enjoys the highest priority in considering alternatives. In essence, it is the difference between the present value of the net cash inflow (provided during the economic life of the project) and the present value of the cash outflow over a predefined period [49]. To meet the acceptance criteria, the NPV must be greater than or equal to zero such that (NPV ≥ 0). In determining the NPV, the first step is to determine the NPV of the total investment cost of the proposed PV system, such that [41]:
N P V i n v e s t m e n t =   C 0 + T L R p v =   C 0 + C O n 1 + r n
where:
  • N P V i n v e s t m e n t = Net present value of the total investment cost
  • C 0 = Initial cash flow
  • C O n = Cash inflow that will take place after n period
  • r = Interest rate
  • n = Number of periods (year)
  • T L R p v = Present value of revenues throughout the lifecycle of the system
Once the NPV of the investment cost has been estimated, the net ROI can be calculated as follows [41]:
N P V n e t t   i n c o m e =   N P V I n c o m e N P V I n v e s t m e n t
where:
  • N P V n e t t   i n c o m e = The NPV of the net income after a given period
  • N P V I n c o m e = The NPV of the gross income after a given period
  • N P V I n v e s t m e n t = The NPV of the total investment cost after a given period
To meet the evaluation criteria and ensure a profit, the net income must be greater than zero, such that N P V n e t t   i n c o m e > 0.

2.3.4. Internal Rate of Return (IRR)

The return on investment (ROI) is defined as the rate earned on the unrecovered balance of an investment so that the final payment or receipt brings the balance to exactly 0 with interest considered [49]. Numerically, i can range from −100% to infinity such that [41]:
100 % i
When i = −100%, then it is indicative that the entire investment/amount is lost. Ideally, i must be greater than 0 to display a profit.
Similarly, the IRR is defined as the discount rated needed for the NPV to be zero, and can be calculated using the following equation [30,50]:
I R R = i = 1 T o + T C I C O i 1 + I R R i 1
However, since the IRR cannot be derived easily, Zhao et al. [51] derived a linear interpolation method to estimate the IRR such that:
I R R = d 1 +   N P V   d 1 N P V d 1   +   N P V d 2 × ( d 2 d 1 )
where:
  • N P V d 1   > 0
  • N P V d 2 < 0
  • d 2 > d 1

2.3.5. Levelised Cost of Energy (LCOE)

The LCOE is a measurement used to assess and compare alternative methods of electricity generation. In essence, it can be seen as the “average total cost of building and operating the asset, per unit of total electricity generated over an assumed lifetime” [52]. Alternatively, it is the average minimum selling price of the electricity generated by the system to break even or make a profit. It encompasses components of the NPV and ROI method, such that [25,28]:
L C O E =   P C s +   P C i r +   P C V A T +   P C i n s +   P C O & M t = 1 T E × 1 + f 1 + r i 1

2.3.6. Benefit/Cost (B/C) Ratio

A B/C analysis is performed to determine whether the benefits will outweigh the costs of the project. In financial terms, the B/C ratio is defined as the present value of the investment benefits as a function of the present value of the investment costs [41]. The B/C ratio can be defined as follows:
  • If B/C ≥ 1.0 then the project is acceptable based on economic value; and
  • If B/C < 1.0 then the project is not economically viable.
It must be noted that the benefits can, in some cases, include intangible factors. As a result, it allows for a wider scope of evaluation.

2.3.7. Payback Period

The payback period is defined as the period in which the investment recuperates its original investment costs. In essence, it is the duration the PV system will require to pay itself off. The payback period can be calculated as follows [41]:
P a y b a c k   p e r i o d =   T L R p v C I ,
In conclusion, it can be seen by referring to Equations (10) and (15), that the system must be designed so that its net electrical yield is optimised. In calculating the ROI, it is assumed that electricity from the PV system must be acquired from the existing supplier. The income from the system is then calculated by using the expected electricity savings from the PV system (i.e., if the system were not installed, the electricity from the system would have had to be acquired from the utility). Therefore, an analysis is required of the existing electricity tariffs in South Africa, as defined by the utility. As stated earlier, South Africa utilises a structured tariff system that varies based on different load conditions.

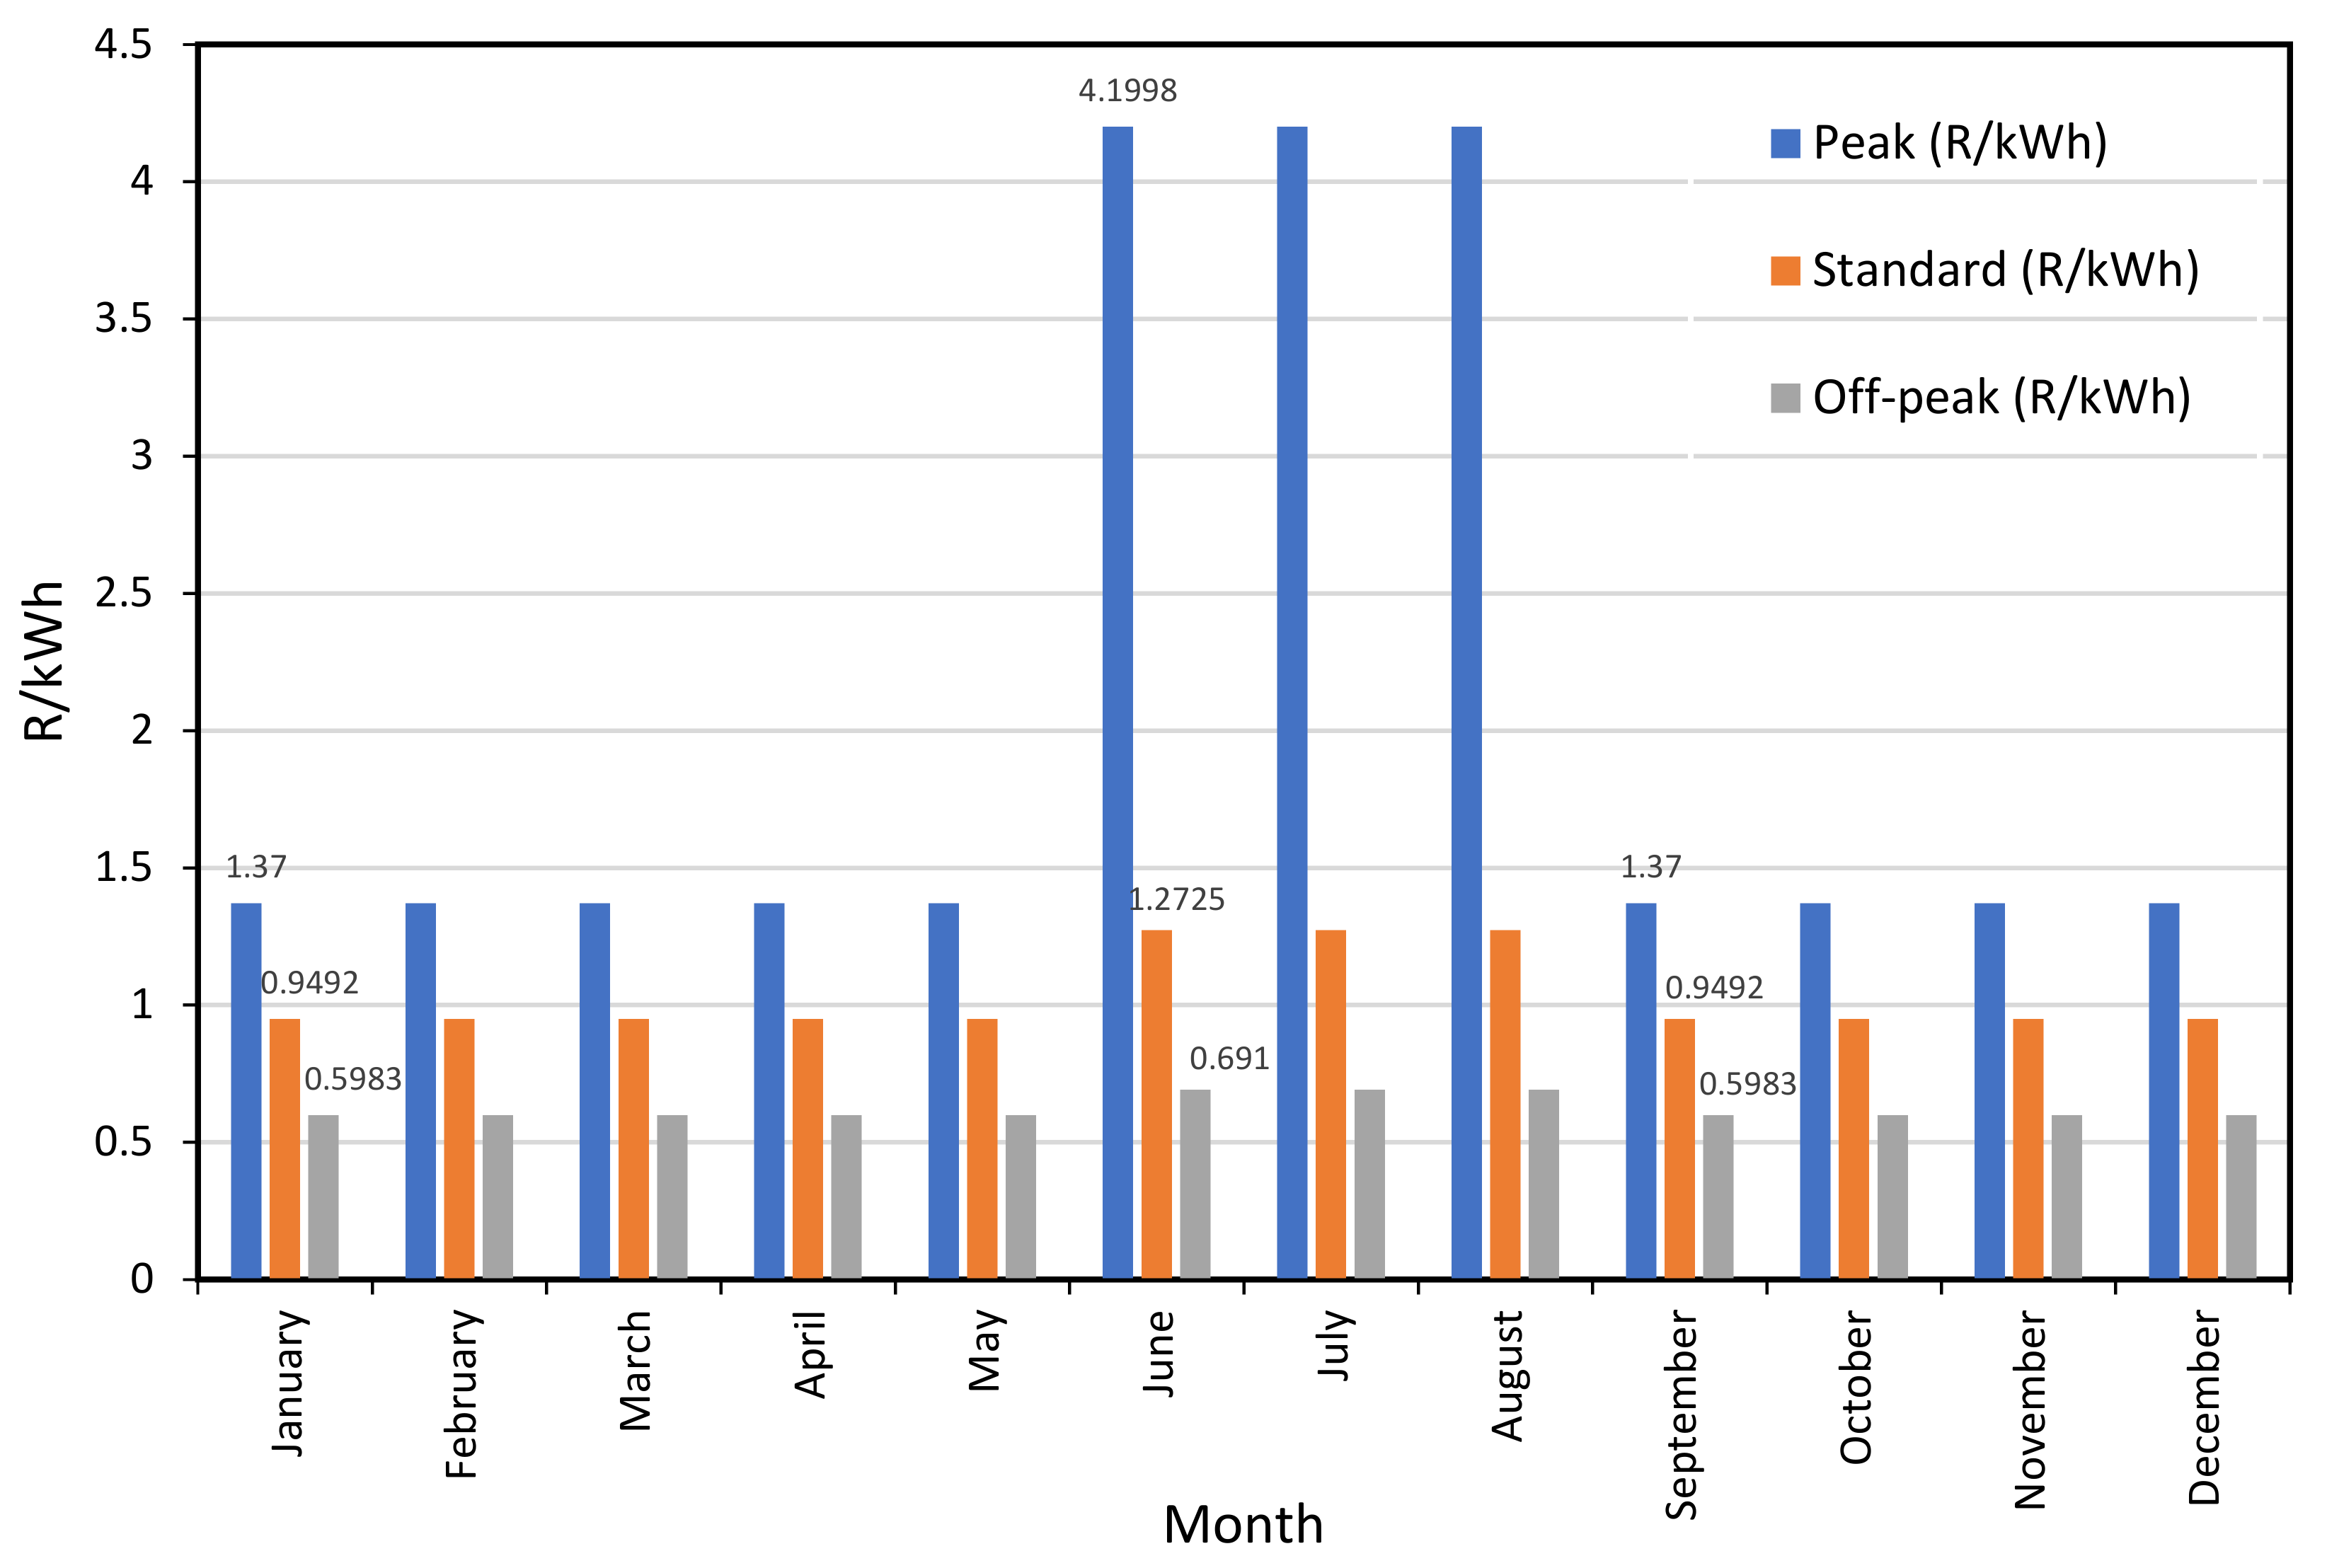
2.4. Existing Electricity Tariffs in South Africa

The ToU tariff is a time-dependent cost structure that charges the consumer in the form of a unit of energy (kWh). This tariff structure was implemented by the South African utility to encourage electricity consumers to manage their electricity consumption based on the electricity demand of the consumer [53]. According to Zini [54], knowledge of electricity tariffs is “fundamental for proper business planning and power purchase agreement contracts”. Since the solar system is designed so that the dependency of the existing supply is reduced, it can be assumed that the financial savings be calculated based on the existing electricity tariffs of the utility. South Africa utilises a structured tariff plan that varies according to [55]:
  • The notified maximum demand (NMD) load—maximum possible demand of the consumer;
  • The time of the day;
  • The season of the year;
  • The incomer voltage (LV, MV or HV);
  • The ability of the user to shift its load;
  • The ability of the user to generate electricity; and
  • The distance from the distribution point to the load connection point.
The South African utility has seven tariff structures that consider the above variabilities [55]. Most shopping centres have the megaflex structure where the ToU electricity tariff for urbanp customers, with an NMD greater than 1 MVA, and the ability to shift their load applies [55]. The megaflex structure is designed so that tariffs vary according to seasonal change and ToU.
Table 4 is used to determine the correct tariff applicable for a given period in terms of the time of day and the seasonal usage [55]. Each day of the week and ToU fall under an electricity classification, namely peak, standard or off-peak. Since the demand also varies according to seasonal change, supply is classified accordingly: high demand season falls under the winter months of June, July and August; and low demand falls under the summer, autumn and spring months [55].
By considering the operating conditions of the case study, the following tariffs (including VAT) in Figure 2 are applicable for the financial year of 2020/21 based on the megaflex structure [55]. The figure was created by the authors using data obtained from the utility [55]. With regard to the high demand season, it can be seen that the tariffs remain constant for June, July and August. Similarly, the tariffs remain the same from September to May.
For reference purposes, the following exchange rates applied at the time of publication:
  • 1$ = R14.77
  • 1€ = R18.03
Concerning Figure 2, the electricity tariffs are R1.3700/kWh for peak classification, R0.9492/kWh for standard classification and R0.5983/kWh for off-peak classification during the low demand season. Regarding the high demand season, electricity tariffs are R4.1998/kWh, R1.2725/kWh and R0.6910/kWh for the peak, standard, and off-peak classification, respectively [55].
A major constraint with using Equations (11) and (13) in calculating the cash inflow is that varying tariffs are not considered. Therefore, first principles will be used.

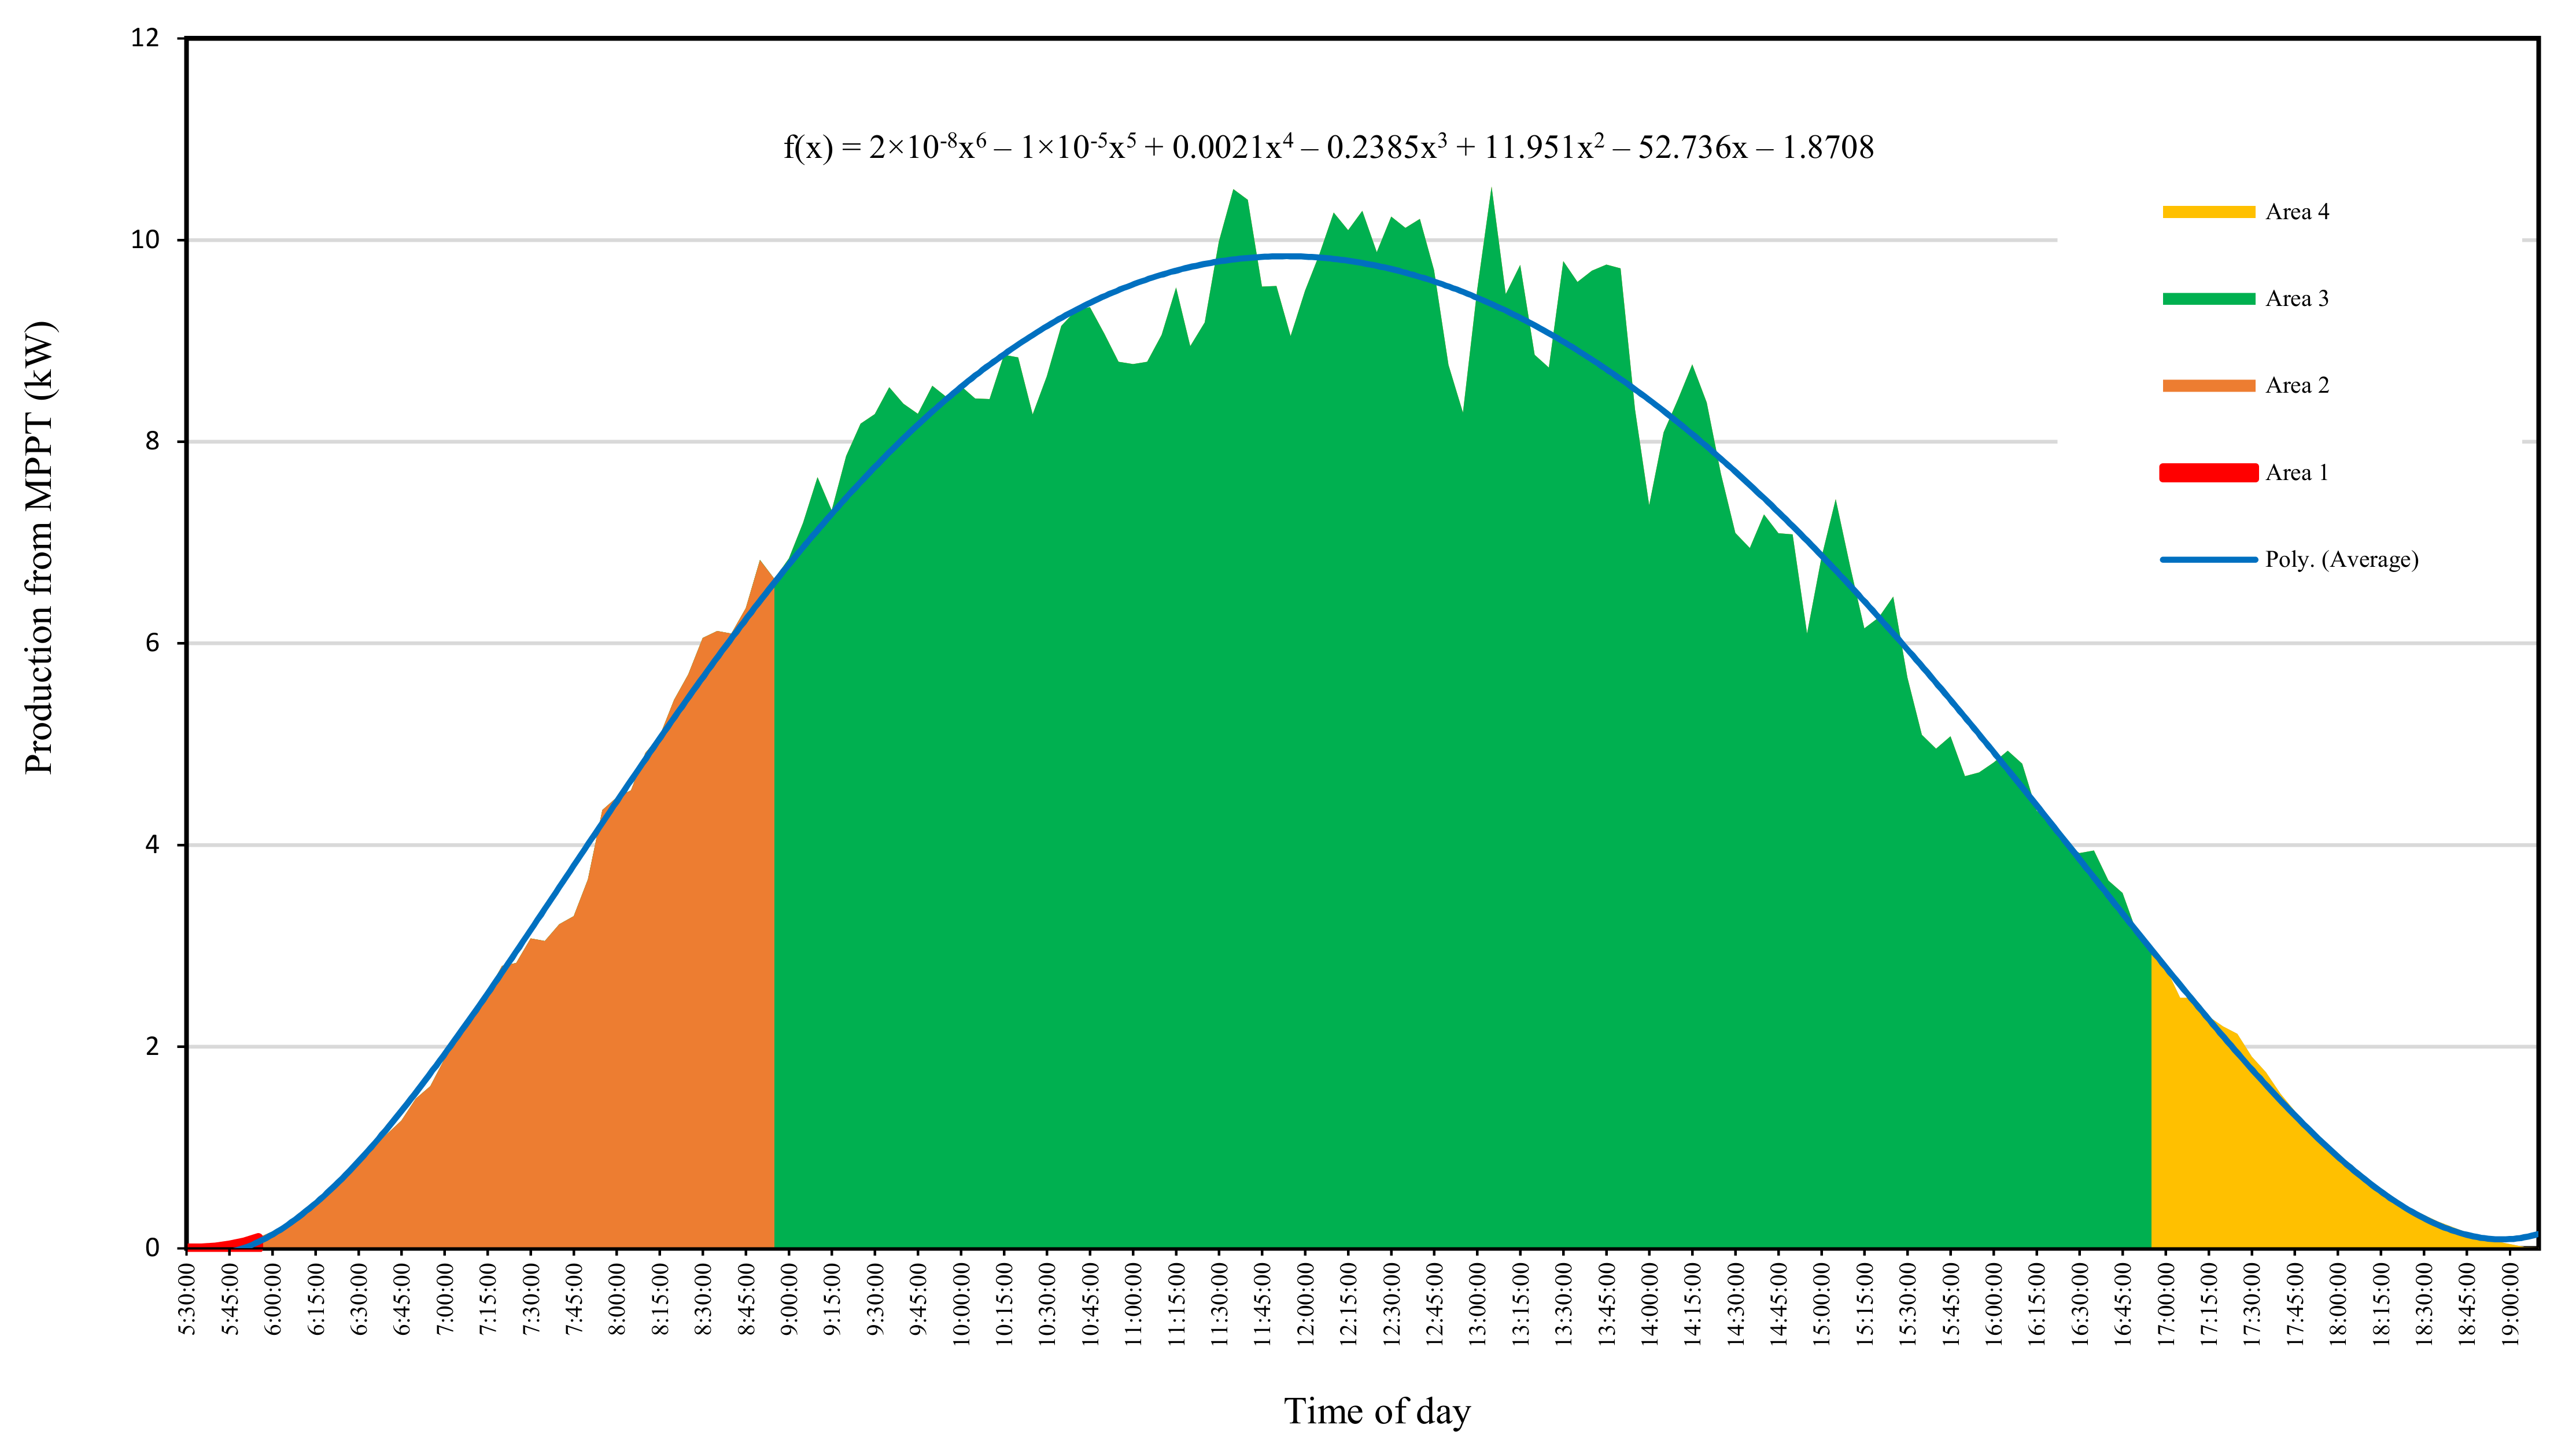
2.5. Defining the Integral to Generate the Mathematical Process

The equations provided in Section 2.3 are generally applied during the feasibility study, based on certain assumptions, before construction commences. However, the results from this research were obtained from a case study after 24 months, enabling the calculation of the ROI. The integral is therefore defined to calculate the ROI in order to include variant tariffs because of ToU structures. The following is an example of how the integral was defined for the average ROI for a single day in a particular month. This methodology was then repeated for every month of the year.
When considering the average daily electricity yield for a PV system for a specific month as in Figure 3, the average daily power production can be depicted by the polynomial trendline, denoted as f x . Therefore, the average daily power production from a PV system for a specific month can be defined in the following integral, depicted by the total area under the trendline, such that [56]:
A =   00 : 00 23 : 59 f x . d x
where:
  • f x > 0
If it is assumed that a PV system is in operation and the existing tariff structure for the applicable PV system varies according to the ToU, then the average daily power production in the month can be illustrated as in Figure 3. For illustrative purposes, Figure 3 is used to calculate the average daily ROI for a month during the high demand season. When referring to Table 4, it can be seen that there are six different time classifications in a day during the high demand season. However, since PV production only occurs during daylight, two of the six classifications are ignored.
In Figure 3, each tariff rate is represented by a different colour and corresponds with a weekday during the high demand season. From Table 4, the first tariff classification for a weekday occurs between 00:00 and 06:00—denoted as area 1 in red. However, because energy production from a PV system commences at approximately 05:30 (depending on the season), area 1 is comparatively small. The second tariff classification (peak) is denoted as area 2 in orange and occurs between 06:00 and 09:00. The next tariff classification, denoted as area 3 in green, falls under the standard classification from 09:00 to 17:00. The final tariff classification is denoted as area 4 in yellow. This falls under the peak period classification and occurs from 17:00 to 19:00 or when production from the PV system concludes due to sunset. As stated earlier, the remaining two classifications are not considered.
Since the tariffs vary according to the time of day, as in Table 4, Equation (21) can be expanded (including the two classifications that will be ignored) as follows [55,56]:
A =   A 1 +   A 2 +   A 3 +   A 4 +   A 5 + A 6 =   00 : 00 05 : 59 f x . d x +   06 : 00 08 : 59 f x . d x +   09 : 00 16 : 59 f x . d x +   17 : 00 18 : 59 f x . d x +   19 : 00 21 : 59 f x . d x +   22 : 00 23 : 59 f x . d x
Since there is no sunshine between 19:00 and 04:00, two of the six classifications fall away, where f x ≯ 0 for those 9 h. Therefore, Equation (22) is simplified [55,56]:
A =   A 1 +   A 2 +   A 3 +   A 4 =   04 : 00 05 : 59 f x . d x +   06 : 00 08 : 59 f x . d x +   09 : 00 16 : 59 f x . d x +   17 : 00 18 : 59 f x . d x
To calculate the ROI from the PV system, the applicable tariffs from Figure 2 are applied, such that [55,56]:
R O I W e e k d a y =   0.6910 . 04 : 00 05 : 59 f x . d x +   4.1998 . 06 : 00 08 : 59 f x . d x +   1.2725 . 09 : 00 16 : 59 f x . d x +   4.1998 . 17 : 00 18 : 59 f x . d x
where:
  • f x > 0
  • R O I W e e k d a y = Weekday return on investment (monetary value–rand)
Equation (24) defines the integral for the ROI for a weekday. However, the tariffs vary on weekends as well. Therefore, Equation (24) was evolved such that it incorporates the weekends [55,56]:
R O I D a i l y H D =   N W e e k d a y N T o t a l   [ 0.6910 . 04 : 00 05 : 59 f x . d x +   4.1998 . 06 : 00 08 : 59 f x . d x +   1.2725 . 09 : 00 16 : 59 f x . d x +   4.1998 . 17 : 00 18 : 59 f x . d x ] + N S a t u r d a y N T o t a l [ 0.6910 . 04 : 00 06 : 59 f x . d x +   1.2725 . 07 : 00 11 : 59 f x . d x +   0.6464 . 12 : 00 17 : 59 f x . d x +   1.2725 . 18 : 00 18 : 59 f x . d x ] +   N S u n d a y N T o t a l   0.6910 . 04 : 00 18 : 59 f x . d x
where:
  • R O I d a i l y H D = Average daily ROI for a month falling in high demand season (monetary value–rand);
  • N W e e k d a y = Number of weekdays in a particular month;
  • N S a t u r d a y = Number of Saturdays in the month;
  • N S u n d a y = Number of Sundays in the month; and
  • N T o t a l = Total number of days in the month.
Similarly, the average daily ROI during the low demand season can be calculated using Equation (26) [55,56]:
R O I D a i l y L D =   N W e e k d a y N T o t a l   [ 0.5983 . 04 : 00 05 : 59 f x . d x +   0.9492 . 06 : 00 06 : 59 f x . d x +   1.3700 . 07 : 00 09 : 59 f x . d x +   0.9492 . 10 : 00 17 : 59 f x . d x +   1.3700 . 18 : 00 18 : 59 f x . d x ] + N S a t u r d a y N T o t a l [ 0.5983 . 04 : 00 06 : 59 f x . d x +   0.9492 . 07 : 00 11 : 59 f x . d x +   0.5983 . 12 : 00 17 : 59 f x . d x +   0.9492 . 18 : 00 18 : 59 f x . d x ] +   N S u n d a y N T o t a l   0.5983 . 04 : 00 18 : 59 f x . d x
where:
  • R O I d a i l y L D = Average daily ROI for a month falling in low demand season (monetary value–rand).
By using Equations (25) and (26), the average daily ROI for a specific month can be calculated accordingly.

3. Experimental Method

Section 3 covers the experimental methodology. The design characteristics of the case study PV system are discussed in Section 3.1 and the equations applied in interpreting the results are depicted in Section 3.2. Section 3.3 is a summary of the process followed in determining the ROI using the appropriate equations.

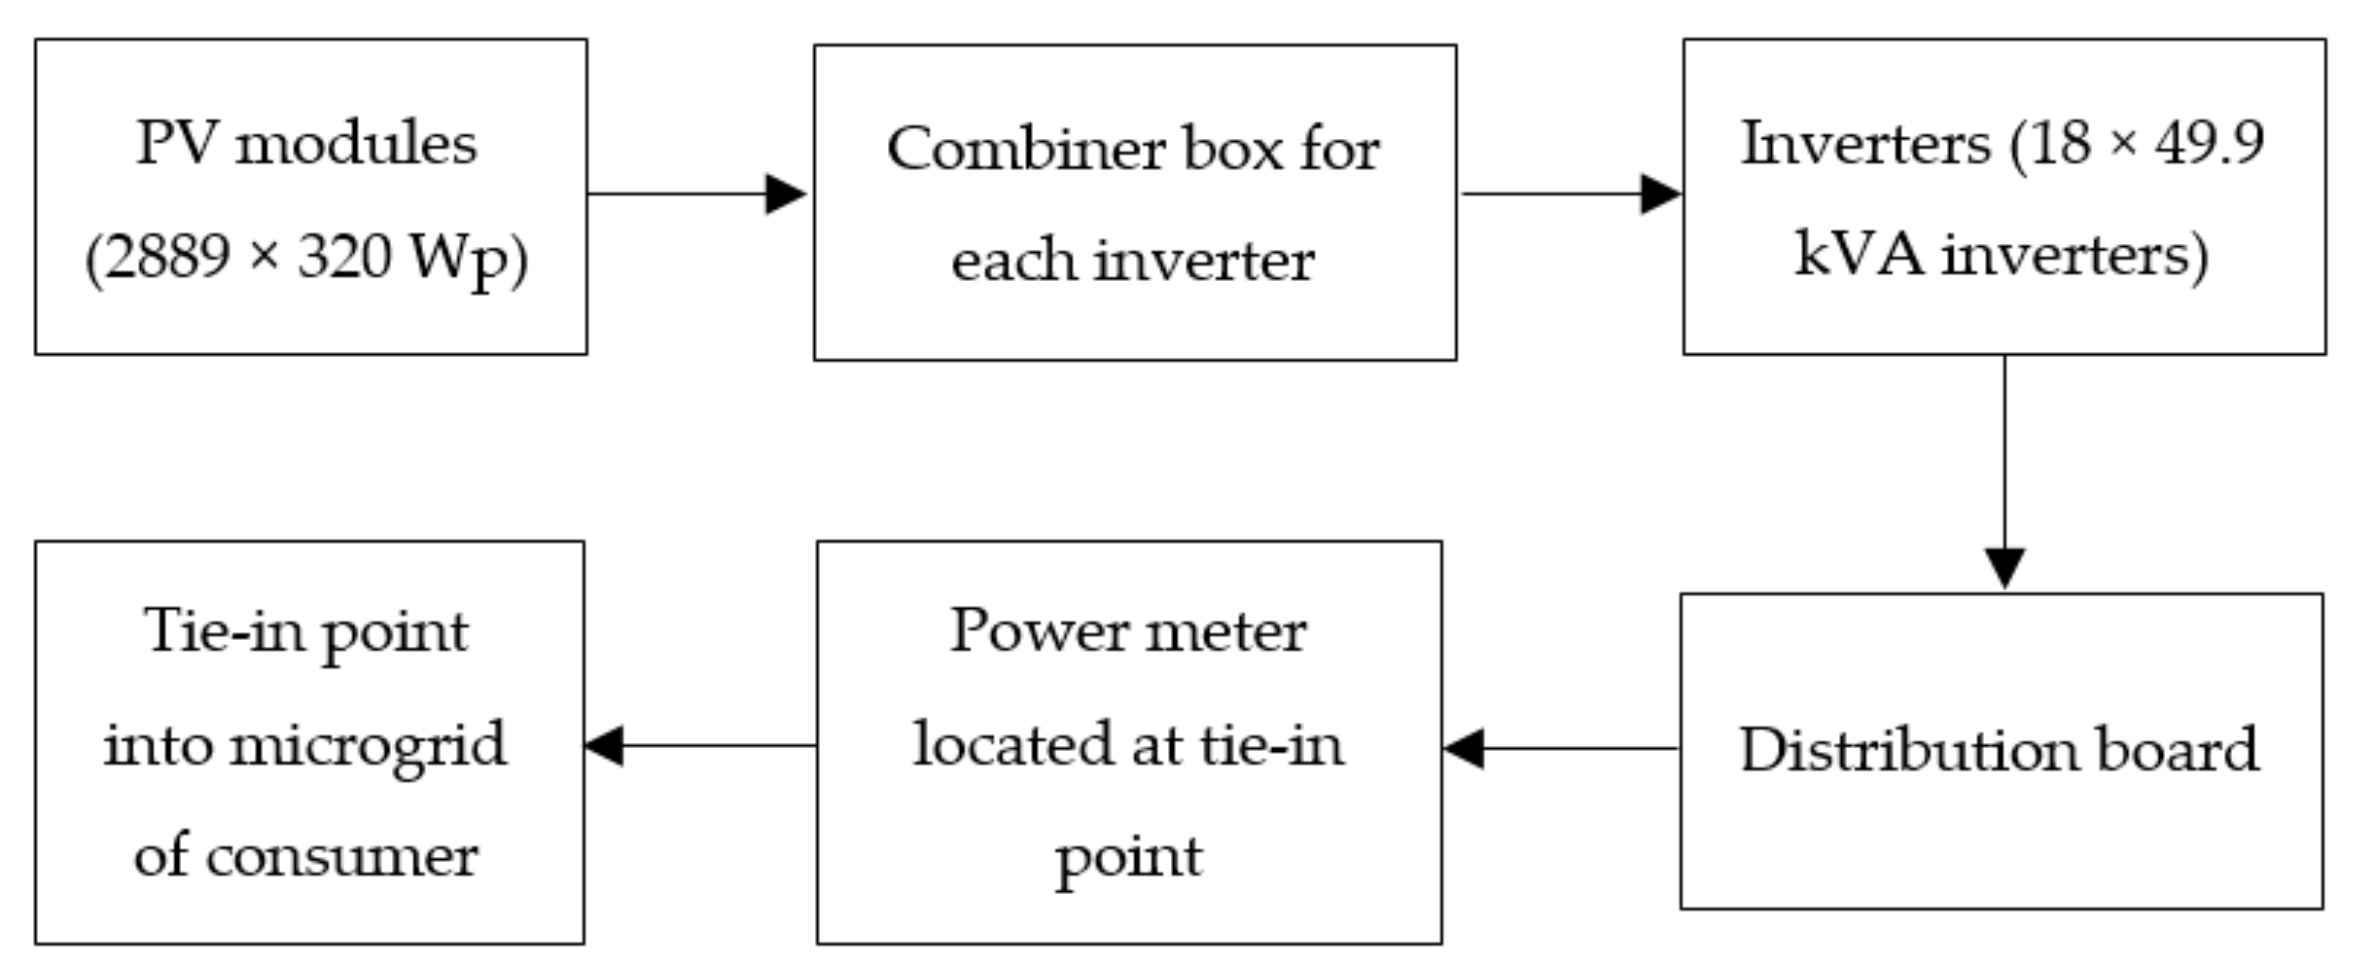
3.1. Design Characteristics of the Case Study

Investors utilise the data obtained from their independent consulting engineer during the feasibility study, or the engineering, procurement and construction (EPC) companies when the tenderer submits their proposal during the tender process to determine the financial viability and ROI of a PV system [50]. In South Africa, the estimated electricity yield is obtained by simulating the PV system, and the operating conditions thereof, using software such as HelioScope and PVSyst [57,58,59]. As part of the terms and conditions of the contractual agreement, yield warranties are agreed upon. If the PV system cannot produce the agreed electricity yield over the predetermined period, then legal disputes may arise [60]. Therefore, the degree of accuracy from the yield simulations must be increased. The basis of disputes will depend on the data obtained from the power meter. In line with this, the basic layout of the components used in the case study can be illustrated in the following flow diagram where the position of the power meter is shown:
Relating to Figure 4, the following is a summary of the components used in the case study:
  • 2889 × 320 Wp PV modules were used in the case study and the system consisted of various strings and arrays to equate to a rated value of 924.48 kWp. The system consisted of a curvature roof to which the PV modules were affixed in various 17- or 18-module strings. In order to prevent current mismatch, the PV modules were connected such that each string’s modules were at the same angle of inclination.
  • A combiner box was used to combine the various strings to form a PV array. Similar to the above, the various strings in each array were connected such that the angle of inclination corresponded. This means that each maximum power point tracker (MPPT) consisted of modules affixed at the same angle of inclination.
    In addition, the combiner box also encompassed the relevant fuses for each string and the lightning protectors.
  • 18 × 49.9 KVA grid-tie inverters were utilised in the system such that the maximum potential fed into the microgrid was 898.2 kVA.
  • The distribution board was used to combine the feed from the various inverters. Various circuit breakers and surge arrestors were included in the distribution board. The monitoring components (on which the data from the research was based) were also located inside the distribution board.
  • The combined electricity was fed into the microgrid of the consumer at the tie-in point, encompassing the main breaker and the power meter.
For simplification purposes, a summary of the various components and the operating conditions of the case study can be found in Table 5. It must be noted that the exact location of the case study is not disclosed to maintain anonymity. However, its location is within 40 km of OR Tambo International Airport in Johannesburg.
The PV modules were mounted on a curvature roof where the angle of inclination varied such that −9° β β ≤ 10° (negative inferring south and positive inferring north). The angle relative to the azimuth was kept constant such that γ = 0°. The relative angle of the PV modules was measured using an inclinometer that was placed on the frame of the modules. The inclinometer was certified to an accuracy of ±0.2° and the average of six readings was used. Figure 5 is a basic illustration of how the PV modules were affixed with respect to the horizontal.
As stated earlier, the electricity yield from a PV system before construction commences must be simulated. The results from simulations for the case study can be found in van Vuuren et al. [5].
After a system has been in operation for a predetermined period, the investor will analyse the data and determine the ROI. A similar approach was applied in this research whereby the result from the case study was used. The following is a summary of the process applied in interpreting the results mathematically.

3.2. Equations Used for Interpretation

The results obtained by applying Equations (25) and (26) yield the average daily ROI for the high and low demand seasons, respectively. The results from the case study were acquired over 24 months. Equation (27) is used to depict the results according to a specific month, such that:
A v e r a g e   d a i l y   R O I   f o r   M o n t h   x =   R O I / d a y M o n t h   x   +   R O I / d a y M o n t h   x + 12 2
where:
  • R O I / d a y M o n t h   x = Average daily ROI for month x in 1st year
  • R O I / d a y M o n t h   x + 12 = Average daily ROI for month x in 2nd year
After the average daily ROI had been calculated using Equation (27), the specific average daily ROI was calculated using Equation (28). The specific average daily ROI is depicted as a function of the direct current (DC) rated power—since it is the limiting factor with regard to production potential (i.e., no clipping occurs), such that:
S p e c i f i c   R O I =   A v e r a g e   d a i l y   R O I   f o r   M o n t h   x P D C   r a t e d
where:
  • S p e c i f i c   R O I = Average daily specific ROI (R/kWp/day)
  • A v e r a g e   d a i l y   R O I = Average daily ROI (the monetary currency of SA–rand)
  • P D C   r a t e d = Rated DC power of respective MPPT (W)

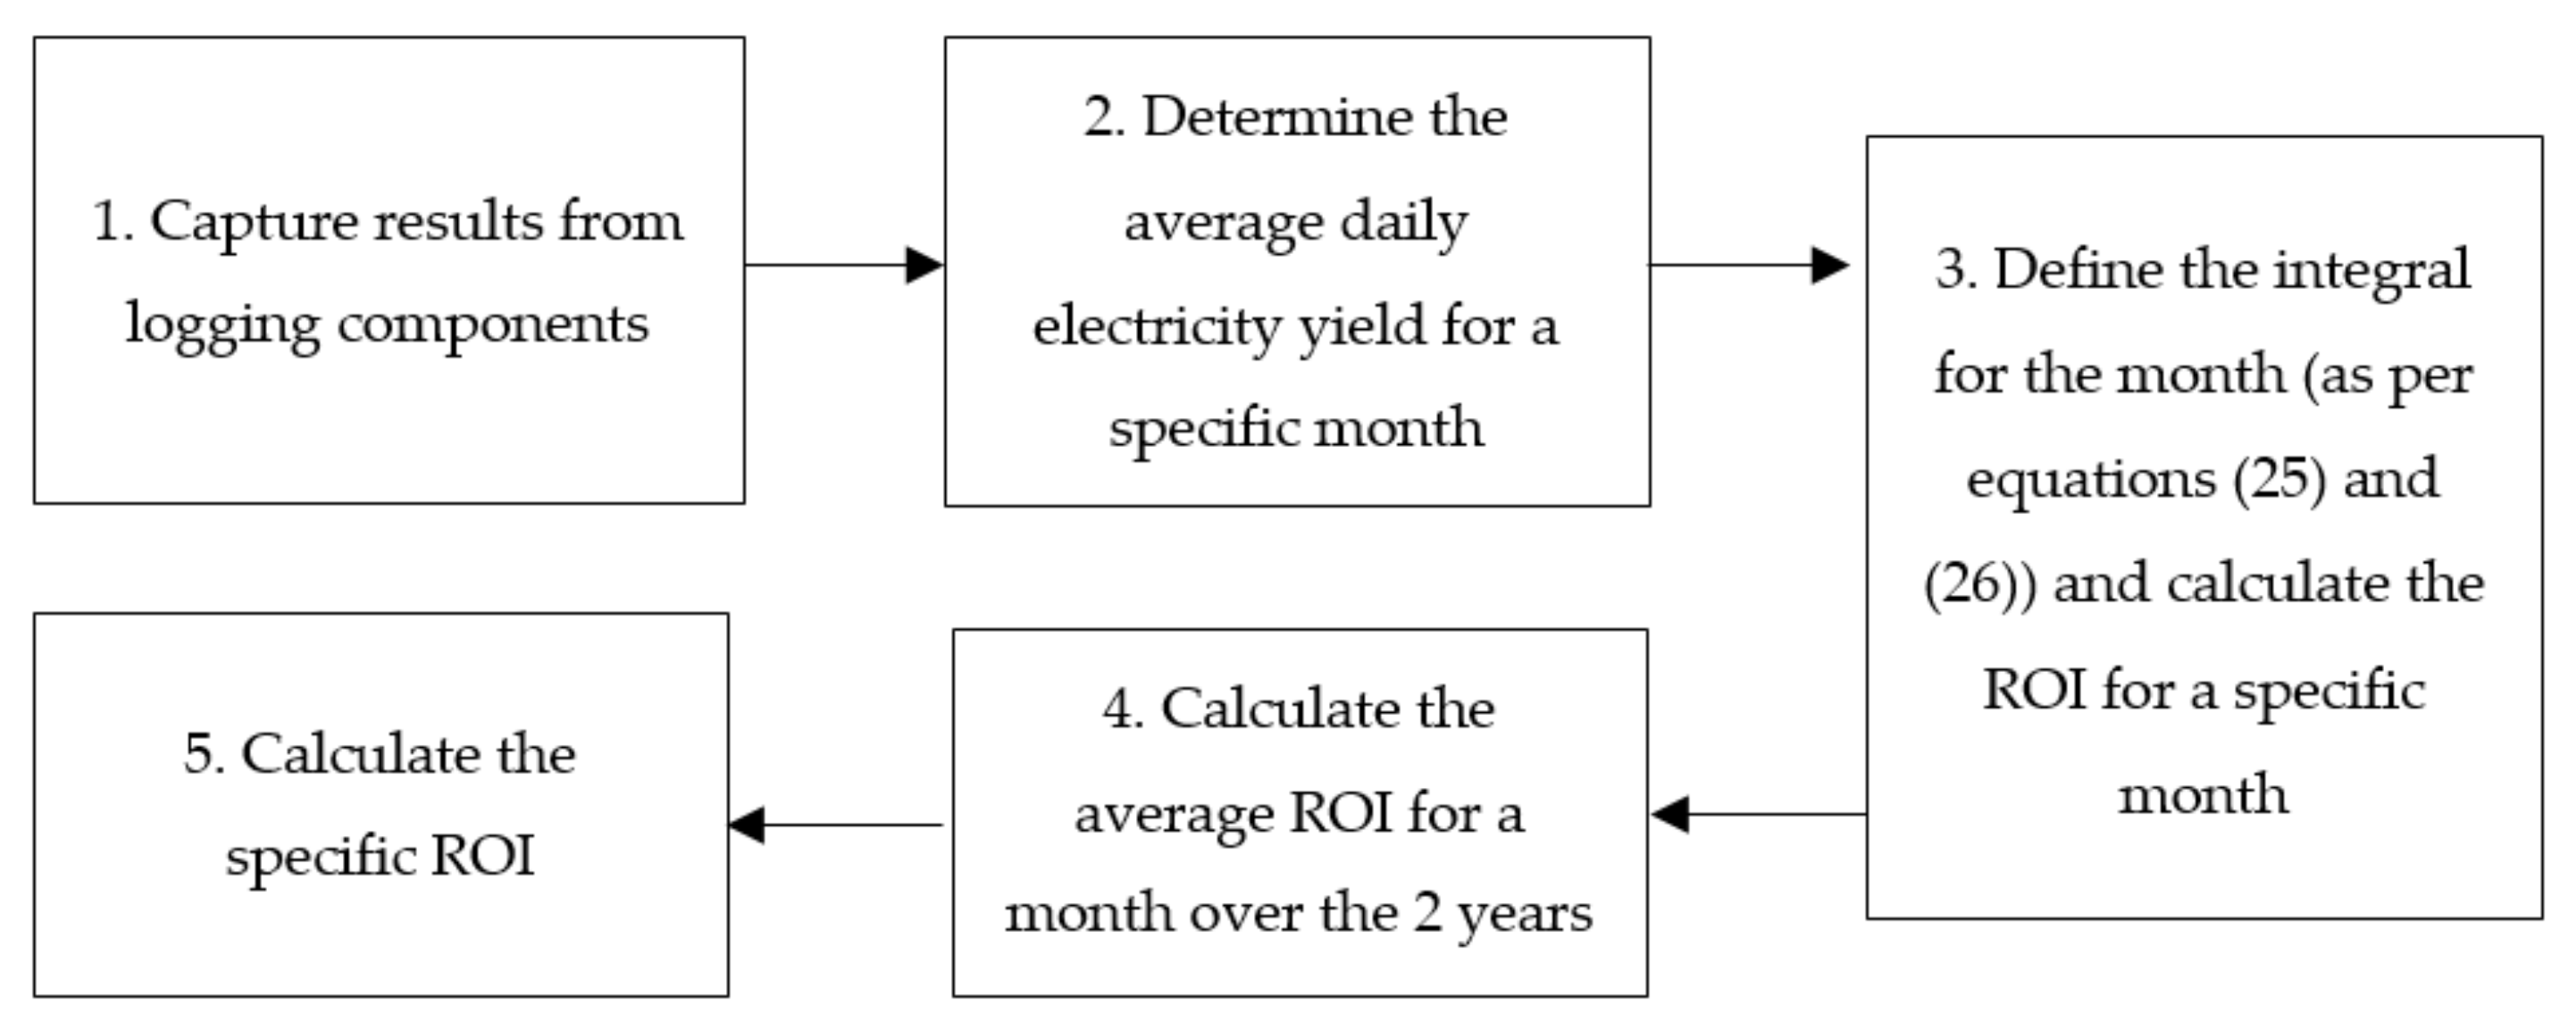
3.3. Methodology Implemented for Interpretation

Calculating the ROI of the case study where structured tariffs apply requires a specified process. Figure 6 is an illustration of the process followed in analysing the data:
In essence, there are 6 steps followed to calculate the ROI of the case study PV system over the 2 years. The aforementioned steps are discussed as follows:
  • The results were captured using the logging components connected to the various inverters. The logging software provides various information, including the electricity yield as a function of time for a specific MPPT.
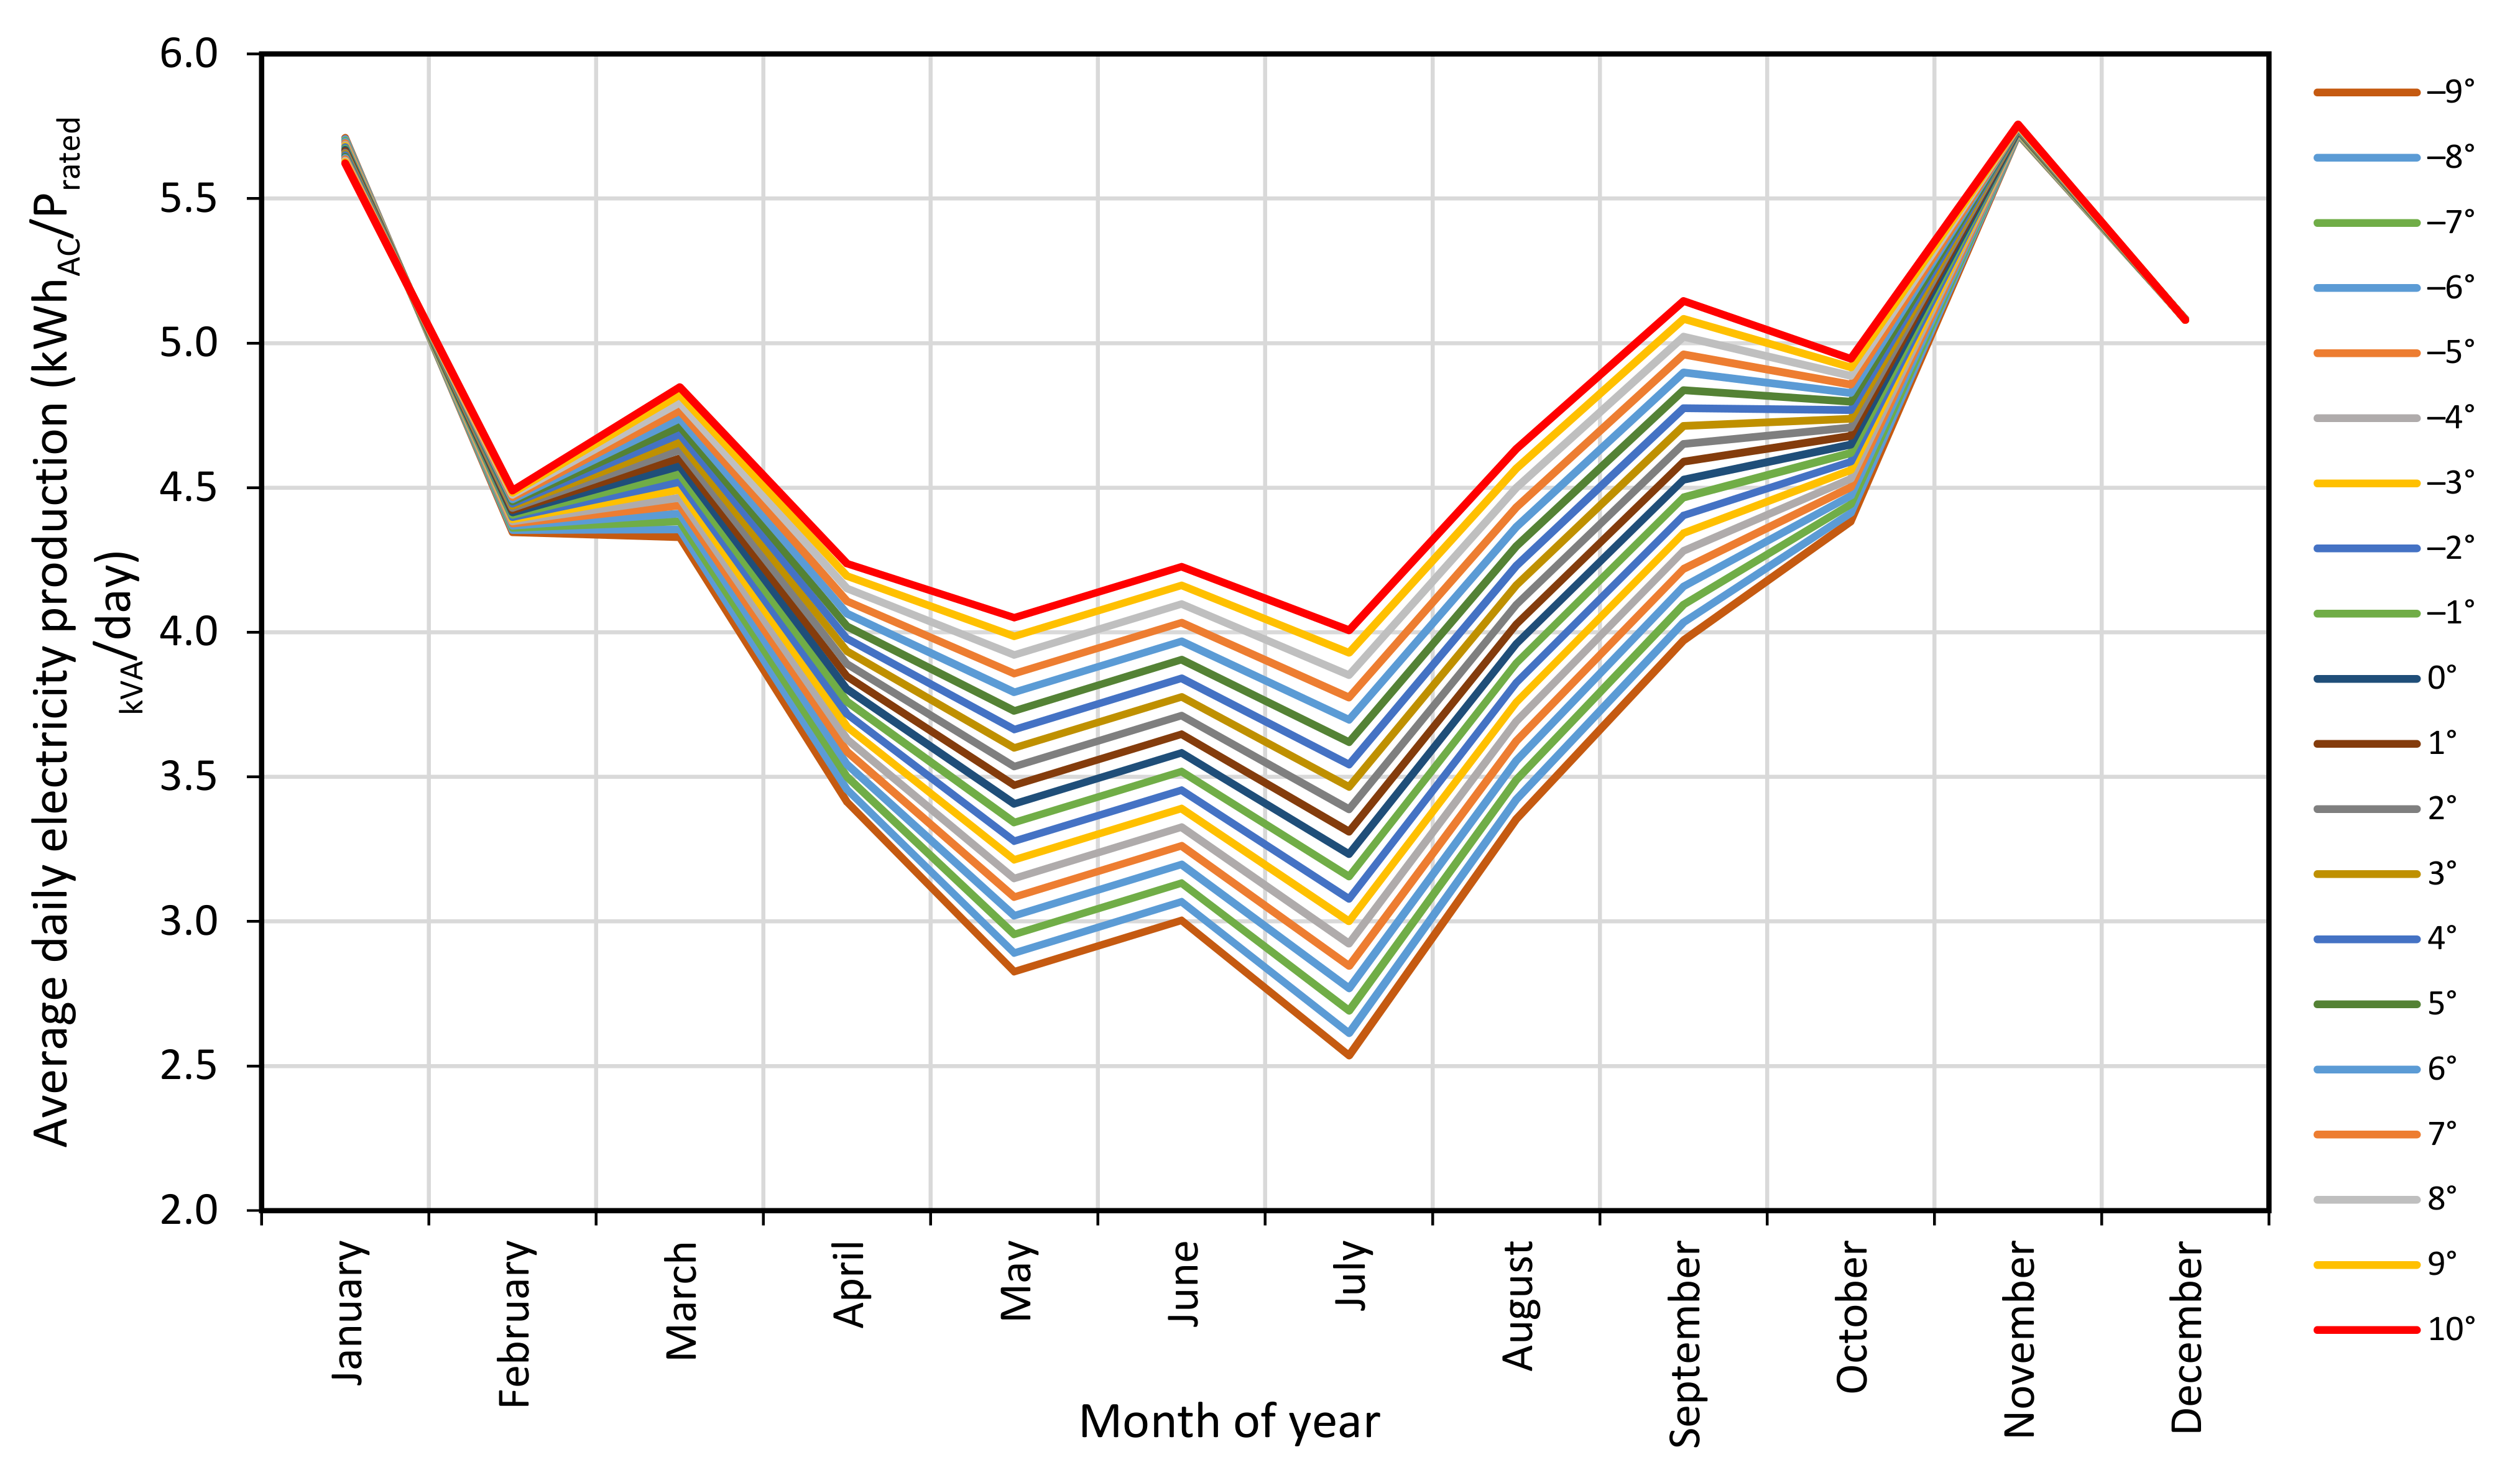
  • The average daily electricity yield for each MPPT (consisting of a unique angle of inclination) in a particular month was calculated. Once the average daily electricity yield had been calculated, a similar load profile to Figure 3 is generated. By calculating the average daily electricity yield, variabilities (commonly found due to clouding) are removed.
  • Calculate the ROI of the PV system as a function of the angle of inclination. The ROI can be calculated using the appropriate integral or through programming that utilises information such as electricity generation at a specific time.
  • Once the average daily ROI for a specific month had been calculated, Equation (27) is used to calculate the average ROI for a specific month over the 2 years.
  • The results from step 4 are then used to calculate the specific ROI using Equation (28).
In Section 4 the results from the case study PV system are discussed.

4. Results and Discussion

No details relating to the investment cost of the case study PV system and the expected payback period are disclosed so that anonymity is maintained. Therefore, only the average daily ROI of each month is presented. It must be noted that the ROI depends on the tariff structure and that a different tariff structure will affect the results accordingly—in general, the structure remains the same, but the tariffs vary according to a different multiplication factor. In this case study, it was assumed that the megaflex (with local authority) tariff structure was applied—the reason for this is that most South African shopping centres fall within this category. However, this research is not limited to a shopping centre, but any PV system that operates under similar conditions.
As mentioned earlier, the main driver behind the deployment of solar PV technology is its financial viability. The average daily electricity production from the case study PV system is depicted in Figure 7 so that the ROI can be indicated effectively. The main reason for this is that the ROI depends on the electricity yield from the PV system.
Various studies [62,63,64] state that if clear sky conditions are assumed, the optimum angle of tilt must be equal to the latitude. This was verified by simulations where it was concluded that the optimum angle of inclination of the PV modules must be approximately 26° towards the northerly direction at the location of the case study [5]. Due to practical limitations, it is not viable to affix a commercial-sized PV system on a roof where the inclination angle is more than 10°.
Since the case study is located in the southern hemisphere, the summer season occurs from November to February. As seen in Figure 7, electrical yield peaked at 5.75 kWh/Prated kVA/day in November and progressively decreased to a minimum of 2.61 kWh/Prated kVA/day in July during winter. The effect of seasonal change is most evident when the yield in July is compared to the yield in the summer month of December. In general, the angle of inclination had little effect on the electricity yield in the summer season, whereas winter saw an electricity yield variation ranging between 2.61 kWh/Prated kVA/day at −9° and 4.00 kWh/Prated kVA/day at 10° in July. The reason for this is that the relative angle between the sun and PV modules orientated towards the north is less in the winter when compared to modules orientated towards the southerly direction. This is in line with the theory [5,27] that PV modules orientated towards the northerly direction will yield higher electrical production in the winter months compared to south-orientated PV modules.
According to analyses conducted on the irradiance sensor, it was found that the maximum peak radiation occurs in December. However, from Figure 7 it can be seen that electricity yield was at a maximum during November. The reason why electricity production reduced in December and January can be attributed to precipitation. The addition of precipitation results in cloud covering. Furthermore, it must be noted that the system did not operate continuously in December, with intermittences being recorded on certain days in the early morning and late afternoon—all of which resulted in a reduction of electricity yield.
Figure 8 illustrates the average daily ROI of the case study PV system as a function of the angle of inclination of the PV modules. For summarisation purposes, the results are depicted using a polynomial trendline based on linear regression. As stated earlier, the case study consisted of a curvature roof such that −9° ≤ 𝛽 ≤ 10°. However, by using a linear trendline, the results are extended to include an angle of inclination range such that −10° ≤ 𝛽 ≤ 10°.
By comparing the electrical yield data from Figure 7, it can be seen that variations in the electrical yield exhibit similar behaviour with regard to the ROI in Figure 8. This is especially evident when comparing the financial yield of May (in autumn) to that of January (in summer)—in these two months, the same tariff structure is valid. Concerning south-orientated PV modules at −10°, it is seen that the ROI in May was R0.0024/Wp/day, compared to the ROI of R0.0051/Wp/day in January. Conversely, when north-orientated PV modules at 10° are considered, it can be noted that the ROI in May was R0.0036/Wp/day compared to the ROI of R0.0051/Wp/day in January. The aforementioned was expected since the ROI depend on the electrical yield from the PV system.
It can be observed that the ROI for the summer (January and December) remained constant, irrespective of the angle of inclination—ranging between approximately R0.0049/Wp/day and R0.0051/Wp/day. When referring to the ROI for winter, it can be noted that the ROI progressively decreased for PV modules orientated in a southerly direction to a minimum of R0.0024/Wp/day in May. The ROI then increased as the PV modules were orientated towards the northerly direction.
The results from the research indicate that winter will result in a reduction in irradiation levels. However, due to the structured tariff configuration in South Africa, the ROI increased in June, July and August under the high demand season. This was especially evident for PV modules orientated in the northerly direction: PV modules orientated at a 10° angle of inclination will yield an ROI of approximately R0.0059/Wp/day in August; approximately 15.68% higher than the summer months of November to January. At an angle of inclination of approximately 3° and higher towards the northerly direction, the ROI in August surpassed the maximum ROI found in the summer seasons.
As the electricity yield from a PV system is site-specific, there is little research where similar tariff and location characteristics apply. However, Hayson, Hinzer and Wright [64] investigated the effect of electricity tariffs on the optimal orientation of PV modules within such a system. Their findings were that the ROI can increase linearly as the azimuth of the PV modules is varied towards the optimum.
To illustrate the integration of monthly yields, an alternative depiction of the results presented in Figure 8 is illustrated in Figure 9. The aim of Figure 9 is to illustrate how the ROI varies as a function of seasonal change.
From Figure 9, it can be seen that ROI remained stable at approximately R0.0051/Wp/day during January, irrespective of the angle of inclination of the PV modules. As time progressed towards the winter season (May), the ROI decreased to a minimum of R0.0024/Wp/day at −10° and a maximum of R0.0036/Wp/day at 10° in May. It is also worth noting that the span of the ROI for each month increased as a function of the angle of inclination when seasonal change towards the winter occurs.
From June to August, high demand classification applies. The result is that the ROI increased, where a minimum of R0.0032/Wp/day was calculated in July at −10° and a maximum of R0.0059/Wp/day was calculated in August at 10°. Contrary to the summer months, the span attains a maximum in July, ranging from R0.0032/Wp/day at −10° to R0.0052/Wp/day at 10°.
From the results, it can be concluded that if a system is designed to favour winter electricity yield (remembering that electricity yield variation is negligible in summer as the angle of inclination is varied), the ROI will increase. This behaviour was first identified by Mayr, Schmid and Trolip [65] who conducted simulations to determine the impact of residential PV power on sales revenues for the city of Cape Town. They concluded that when a PV system is designed correctly, the city will start to experience a significant reduction in revenues by 2025—the result being that the gap between revenue and expenditure increases. Consequently, this could lead to unfavourable policies in an attempt by municipalities to regain revenues. To mitigate this, they advised that tariffs be adjusted from structured to time-neutral based.
Finally, September saw a reduction to R0.0038/Wp/day at −10° since the tariff structure shifted towards the low demand season. The ROI then progressively increased as irradiation levels increased due to seasonal change towards the summer when the aforementioned process repeated itself.
Due to limitations imposed by the South African government, where solar systems are restricted to 1 MVA without obtaining a generation licence [66], PV systems must be designed so that they are optimised—mainly because it becomes difficult to rectify the system accordingly. In recent history, the structure of tariffs in South Africa has not changed significantly. The highest degree of change relates to a constant increase in tariffs in all demand classifications (i.e., the times of classifications have not been altered, or tariffs have not been increased to favour a particular demand period). Therefore, based on the results from the research, PV systems must be designed so that the electricity yield in the winter season is prioritised over the net electricity yield in the summer season.
Earlier research [5] indicates that when the array-to-inverter ratio (ATIR) is increased, power production potential will be lost beyond an ATIR of 1.2 in the summer due to a process known as clipping. When the PV system is purposely designed so that an ATIR of 1.5 is found, then approximately 5% of the power generation potential of the PV modules will be lost. However, the 5% potential will be lost during the summer season when electricity tariffs are reduced. In the winter season, consumers can expect a linear increase in electricity yield from the PV system [5].
Since irradiation levels in the winter are approximately 60% to 70% of those in the summer (for modules orientated at a 0° angle of inclination), where the ROI increases in that period due to the increased electricity tariffs, increasing the ATIR will have a beneficial effect. The advantage of increased ATIR is twofold: firstly, in the summer season, the electricity yield will increase linearly early in the morning (approximately 05:20 to 09:30) and late in the afternoon (approximately 15:00 to 19:00) when there is no clipping, inferring that the ROI will increase disproportionally since tariffs are increased during those times (as seen in Figure 2, high demand period coincides with the aforementioned times); and secondly, increased ATIR will see a linear increase in electrical yield in the winter period since no clipping occurs—noting that tariffs are increased by approximately 200% in the winter compared to summer. Therefore, any losses incurred through clipping will be negated through the ROI gains in the winter season. Furthermore, clipping will become less prevalent in the future due to the inevitable degradation of the PV modules [67]. The warranty conditions of the PV module supplier suggests that they will degrade no more than 20% of their rated ability after 25 years [68].
In terms of promoting the use of solar PV in South Africa, it is advised that tariffs be structured so that the benefits are obtained from the resultant electricity yield from the PV system. Since most PV systems are constructed where the PV modules are affixed near horizontal (such that −3° ≤ β ≤ 3°), the electrical yield will be highest in the summer season at approximately 12:20. Commonly, investors do not prefer to increase the ATIR as some energy is lost while the extra PV modules will consume extra space. Therefore, summer sees the greatest electrical yield with no clipping occurring. However, due to the current structure of South African tariffs, the ATIR should be increased.
Relating to the methodology, the following have been identified as limitations:
  • The information is reliant on data obtained from a case study connected to a certain tariff structure. If a similar analysis is required on a different case study, then the equations must be adapted in line with the concerning tariff structure.
  • Since the method is reliant on a trendline, small power production variations (relating to clouding) may not be captured accurately.
  • In comparing this methodology to traditional methodologies, increased computing time can be expected when mathematical first principles are used.

5. Conclusions

This article presented the research results of a South African shopping centre case study in which a financial evaluation of a multiple inclination, rooftop-mounted PV system was conducted. With regard to the tariffs, it was assumed that they were structured according to ToU where the specific time of the day and the seasonal change affects them accordingly.
In the introduction of the paper, the need was determined to identify a mathematical process to be used to calculate the ROI of a PV system where a structured tariff applies. Since the preconstruction simulation results are generally one dimensional, factors such as specific time-of-day electricity yield are not provided. Therefore, the assumption is made that tariffs remain the same, meaning that the average tariff is multiplied by the result from the simulation—resulting in inaccurate results.
The literature review provided background to the existing electricity tariffs, and how they apply to the consumer—allowing the derivation of the seasonal dependent integral to calculate the ROI on first principles. In line with this, the case study design characteristics were explained, followed by the method in applying the equations. The uniqueness of the case study is characterised by the use of a curvature roof, resulting in PV modules that were affixed at multiple inclinations.
The results and discussion section presented the results from the case study. Since the case study is located within the southern hemisphere, a maximum electricity yield of 5.75 kWh/Prated kVA/day was experienced during November, irrespective of the module inclination. The effect of angle variation was most noticeable in the winter season when electricity yield decreased to a minimum of 2.61 kWh/Prated kVA/day at −9° (negative inferring south) and 4.00 kWh/Prated kVA/day at 10° towards the north.
Since structured tariffs are applied, maximum ROI was found in the winter month of August to a maximum of R0.0059/Wp/day at 10°, while a minimum of R0.0023/Wp/day in May at −10° occurred in May—the reason being that tariffs are reduced in that month. It was therefore concluded that, due to increased tariffs in winter, ROI increases to eventually surpass the ROI in the summer when PV modules are orientated towards the northerly direction. The opposite is true when the PV modules are orientated towards the southerly direction.
It was also concluded that increasing the ATIR will be beneficial since clipping losses are only encountered in the summer and not in the winter when tariffs are increased. It can therefore be concluded that PV systems must be designed to favour winter production as opposed to summer production to increase the ROI of the system.
This research is novel in that research on a rooftop-mounted, multiple inclination PV system connected to a structured tariff network is limited. When applied correctly, the research will assist investors in mitigating their risk and increasing their ROI.
Future recommendations include (1) investigating the effect of increased ATIR based on the results from a case study, and (2) performing a similar experiment where the case study is connected directly to the utility. Relating to the latter, preliminary research indicates that future PV systems will increase in size and will be constructed where the prescribed load demand is higher and the connection point is direct to the existing utility source (without the presence of distribution authority)—the result being that tariffs will be reduced.

Author Contributions

Conceptualisation, D.J.v.V.; methodology, all authors; software, D.J.v.V.; validation, all authors; formal analysis, D.J.v.V.; data curation, D.J.v.V.; writing—original draft preparation, D.J.v.V.; writing—review and editing, A.L.M. and J.H.C.P.; visualisation, D.J.v.V.; supervision, A.L.M. and J.H.C.P. All authors have read and agreed to the published version of the manuscript.

Funding

This research received no external funding.

Institutional Review Board Statement

Not applicable.

Informed Consent Statement

Informed consent was obtained from case study organisation to utilise data in analysis.

Data Availability Statement

Restrictions apply to the availability of the data. Data was obtained from a third-party case study site.

Conflicts of Interest

The authors declare no conflict of interest.

Nomenclature

β: angle of tilt; Ψ, azimuth angle.

Abbreviations

ATIR: array-to-inverter ratio; BESS, battery energy storage system; CSP, concentrated solar power; EPC, engineering, procurement and construction; IRP, Integrated Resource Plan; LCOE, levelised cost of electricity; MPPT, maximum power point tracker; NERSA, National Energy Regulator of South Africa; NMD, notified maximum demand; NPV, net present value; PV, photovoltaic; ROI, return on investment; ToU, time-of-use; VAT, value-added tax; Wp, Watt peak.

References

  1. Bhattacharyya, S.C.; Timilsina, G.R. A review of energy system models. Int. J. Energy Sect. Manag. 2010, 4, 494–518. [Google Scholar] [CrossRef]
  2. Rehman, S.U.; El-Amin, I. Study of a Solar Pv/Wind/Diesel Hybrid Power System for a Remotely Located Population near Arar, Saudi Arabia. Energy Explor. Exploit. 2015, 33, 591–620. [Google Scholar] [CrossRef]
  3. Van Vuuren, D.J.; Marnewick, A.; Pretorius, J.H.C. A Theoretical Pre-Assessment of Solar Photovoltaic Electrical Production for Commercial Retail Centers. In Proceedings of the 18th IEEE EEEIC International Conference on Environment and Electrical Engineering, Palermo, Italy, 12–15 June 2018. [Google Scholar] [CrossRef]
  4. Mahmud, N.; Zahedi, A.; Rahman, S. An event-triggered distributed coordinated voltage control strategy for large grid-tied PV system with battery energy storage. In Proceedings of the 2017 Australasian Universities Power Engineering Conference, AUPEC, Melbourne, Australia, 19–22 November 2017; pp. 1–6. [Google Scholar] [CrossRef]
  5. Van Vuuren, D.J.; Marnewick, A.; Pretorius, J.H.C. A proposed simulation-based theoretical preconstruction process: The case of solar photovoltaic technology in South African shopping centres. Renew. Sustain. Energy Rev. 2019, 113, 113. [Google Scholar] [CrossRef]
  6. Mhundwa, R.; Simon, M.; Yongoua, J.N. The electrical energy impact of small-scale onsite generation: A case study of a 75 kWp grid-tied PV system. J. Energy South. Afr. 2020, 31, 1–15. [Google Scholar] [CrossRef]
  7. Pandarum, A.; Lekoloane, G.; Milazi, D. Trends and Statistics of Solar PV Distributed Generation in South Africa. SA Energy Storage 2018, 2018, 1–7. [Google Scholar]
  8. Eskom (Pty) Ltd. Strategic Pricing Direction for Standard Tariffs. 2007. Available online: http://www.eskom.co.za/CustomerCare/TariffsAndCharges/Documents/Stratpricidir2.pdf (accessed on 20 August 2018).
  9. Serameng, T.J.; Van Dyk, E.E.; Roro, K.T. Validation of PVSyst for different photovoltaic module technologies and system design configurations of PV systems operating in central part of South Africa. In Proceedings of the 4th Southern African Solar Energy Conference (SASEC), Stellenbosch, South Africa, 31 October–2 November 2016; pp. 1–6. [Google Scholar]
  10. Dondariya, C.; Porwal, D.; Awasthi, A.; Shukla, A.K.; Sudhakar, K.; Manohar, S.R.M.; Bhimte, A. Performance simulation of grid-connected rooftop solar PV system for small households: A case study of Ujjain, India. Energy Rep. 2018, 4, 546–553. [Google Scholar] [CrossRef]
  11. Wittmer, B.; Mermoud, A.; Schott, T. Analysis of PV grid installations performance, comparing measured data to simulation results to identify problems in operation and monitoring. In Proceedings of the 30th European Photovoltaic Solar Energy Conference and Exhibition, Hamburg, Germany, 14–18 September 2015; pp. 2265–2270. [Google Scholar]
  12. Masini, A.; Menichetti, E. The impact of behavioural factors in the renewable energy investment decision making process: Conceptual framework and empirical findings. Energy Policy 2012, 40, 28–38. [Google Scholar] [CrossRef]
  13. Walwyn, D.R.; Brent, A.C. Renewable energy gathers steam in South Africa. Renew. Sustain. Energy Rev. 2015, 41, 390–401. [Google Scholar] [CrossRef] [Green Version]
  14. Swanson, R.M. A vision for crystalline silicon photovoltaics. Prog. Photovolt. Res. Appl. 2006, 14, 443–453. [Google Scholar] [CrossRef]
  15. Arafa, M.I.A.; Said, E.-S.S.A. A different visions for uninterruptible load using hybrid solar-grid energy. Int. J. Power Electron. Drive Syst. (IJPEDS) 2019, 10, 381–387. [Google Scholar] [CrossRef]
  16. Dobrotkova, Z.; Surana, K.; Audinet, P. The price of solar energy: Comparing competitive auctions for utility-scale solar PV in developing countries. Energy Policy 2018, 118, 133–148. [Google Scholar] [CrossRef]
  17. Crago, C.L.; Chernyakhovskiy, I. Are policy incentives for solar power effective? Evidence from residential installations in the Northeast. J. Environ. Econ. Manag. 2017, 81, 132–151. [Google Scholar] [CrossRef]
  18. do Nascimento, Á.D.J.; Rüther, R. Evaluating distributed photovoltaic (PV) generation to foster the adoption of energy storage systems (ESS) in time-of-use frameworks. Sol. Energy 2020, 208, 917–929. [Google Scholar] [CrossRef]
  19. Alghamdi, A.S. Potential for Rooftop-Mounted PV Power Generation to Meet Domestic Electrical Demand in Saudi Arabia: Case Study of a Villa in Jeddah. Energies 2019, 12, 4411. [Google Scholar] [CrossRef] [Green Version]
  20. Bobo, A.; Pretorius, J.H.C.; Enslin, J.H.R. Effect on energy supply contribution by incorporating rooftop photovoltaic systems within the City of Johannesburg. In Proceedings of the IEEE AFRICON: Science, Technology and Innovation for Africa, AFRICON 2017, Cape Town, South Africa, 18–20 September 2017; pp. 1032–1037. [Google Scholar] [CrossRef]
  21. Sepúlveda-Mora, S.B.; Hegedus, S. Making the case for time-of-use electric rates to boost the value of battery storage in commercial buildings with grid connected PV systems. Energy 2021, 218, 119447. [Google Scholar] [CrossRef]
  22. Zhou, L.; Zhang, Y.; Lin, X.; Li, C.; Cai, Z.; Yang, P. Optimal Sizing of PV and BESS for a Smart Household Considering Different Price Mechanisms. IEEE Access 2018, 6, 41050–41059. [Google Scholar] [CrossRef]
  23. Darghouth, N.R.; Barbose, G.; Zuboy, J.; Gagnon, P.J.; Mills, A.D.; Bird, L. Demand charge savings from solar PV and energy storage. Energy Policy 2020, 146, 111766. [Google Scholar] [CrossRef]
  24. Zhang, S.; Tang, Y. Optimal schedule of grid-connected residential PV generation systems with battery storages under time-of-use and step tariffs. J. Energy Storage 2019, 23, 175–182. [Google Scholar] [CrossRef]
  25. Chudy, M.; Mwaura, J.; Walwyn, D.; Lalk, J. The effect of increased photovoltaic energy generation on electricity price and capacity in South Africa. In Proceedings of the IEEE AFRICON Conference, Addis Ababa, Ethiopia, 14–17 September 2015. [Google Scholar] [CrossRef]
  26. Hohne, P.; Kusakana, K.; Numbi, B. Model validation and economic dispatch of a dual axis pv tracking system connected to energy storage with grid connection: A case of a healthcare institution in South Africa. J. Energy Storage 2020, 32, 101986. [Google Scholar] [CrossRef]
  27. Le Roux, W.G. Optimum tilt and azimuth angles for fixed solar collectors in South Africa using measured data. Renew. Energy 2016, 96, 603–612. [Google Scholar] [CrossRef] [Green Version]
  28. Xin-Gang, Z.; Yi-Min, X. The economic performance of industrial and commercial rooftop photovoltaic in China. Energy 2019, 187, 115961. [Google Scholar] [CrossRef]
  29. Talavera, D.; Muñoz-Rodriguez, F.; Jimenez-Castillo, G.; Rus-Casas, C. A new approach to sizing the photovoltaic generator in self-consumption systems based on cost–competitiveness, maximizing direct self-consumption. Renew. Energy 2019, 130, 1021–1035. [Google Scholar] [CrossRef]
  30. Ling-Zhi, R.; Xin-Gang, Z.; Yu-Zhuo, Z.; Yan-Bin, L. The economic performance of concentrated solar power industry in China. J. Clean. Prod. 2018, 205, 799–813. [Google Scholar] [CrossRef]
  31. Korsavi, S.S.; Zomorodian, Z.S.; Tahsildoost, M. Energy and economic performance of rooftop PV panels in the hot and dry climate of Iran. J. Clean. Prod. 2018, 174, 1204–1214. [Google Scholar] [CrossRef]
  32. Bianchini, A.; Gambuti, M.; Pellegrini, M.; Saccani, C. Performance analysis and economic assessment of different photovoltaic technologies based on experimental measurements. Renew. Energy 2016, 85, 1–11. [Google Scholar] [CrossRef]
  33. WWF. Renewable Energy: Facts and Futures. The Energy Future We Want. 2017. Available online: http://dtnac4dfluyw8.cloudfront.net/downloads/WWF_Energy_Facts_and_Futures_Final_Version.pdf (accessed on 15 February 2018).
  34. Deloitte Ltd. An Overview of Electricity Consumption and Pricing in South Africa: An Analysis of the Historical Trends and Policies, Key Issues and Outlook in 2017; Deloitte Ltd.: Johannesburg, South Africa, 2017; pp. 1–86. [Google Scholar]
  35. du Plooy, N.; Brent, A.C.; de Kock, I.; Musango, J. Fostering Sustainable Energy Transitions in South Africa: A System Dynamics Approach to Achieving a Sustainable Electricity Sector; University of Stellenbosch: Stellenbosch, South Africa, 2017. [Google Scholar]
  36. Pretorius, I.P.; Piketh, S.; Burger, R.; Neomagus, H. A perspective on South African coal fired power station emissions. J. Energy S. Afr. 2015, 26, 27–40. [Google Scholar] [CrossRef]
  37. Sklar-Chik, M.D.; Brent, A.C. System Cost of Energy Generation Scenarios for South Africa: Understanding the Real Cost of Integrating Energy Generation Technologies; University of Stellenbosch: Stellenbosch, South Africa, 2017. [Google Scholar]
  38. Eskom Ltd. Tariff History. 2019. Available online: http://www.eskom.co.za/CustomerCare/TariffsAndCharges/Pages/Tariff_History.aspx (accessed on 12 September 2019).
  39. Plecher, H. South Africa: Inflation Rate from 1984 to 2024 (Compared to the Previous Year), Statista. 2019. Available online: https://www.statista.com/statistics/370515/inflation-rate-in-south-africa/ (accessed on 12 September 2019).
  40. Montmasson-Clair, G.; Kritzinger, K.; Scholtz, L.; Gulati, M. New Roles for South African Municipalities in Renewable Energy—A Review of Business Models; South African-German Energy Partnership: Pretoria, South Africa, 2017; pp. 1–56. [Google Scholar]
  41. Dağtekin, M.; Kaya, D.; Öztürk, H.H.; Kiliç, F.Ç. A Study of Techno-Economic Feasibility Analysis of Solar Photovoltaic (PV) Power Generation in the Province of Adana in Turkey. Energy Explor. Exploit. 2014, 32, 719–735. [Google Scholar] [CrossRef] [Green Version]
  42. Lipp, J. Policy considerations for a sprouting UK green electricity market. Renew. Energy 2001, 24, 31–44. [Google Scholar] [CrossRef]
  43. Qiankun, W. A Comprehensive Solution for Development of Large Scale Grid-Connected PV Generation in China. Energy Environ. 2015, 26, 83–94. [Google Scholar] [CrossRef]
  44. Balta-Ozkan, N.; Yildirim, J.; Connor, P.M. Regional distribution of photovoltaic deployment in the UK and its determinants: A spatial econometric approach. Energy Econ. 2015, 51, 417–429. [Google Scholar] [CrossRef] [Green Version]
  45. Sener, C.; Fthenakis, V. Energy policy and financing options to achieve solar energy grid penetration targets: Accounting for external costs. Renew. Sustain. Energy Rev. 2014, 32, 854–868. [Google Scholar] [CrossRef]
  46. Jung, J.; Tyner, W.E. Economic and policy analysis for solar PV systems in Indiana. Energy Policy 2014, 74, 123–133. [Google Scholar] [CrossRef] [Green Version]
  47. Solareff (Pty) Ltd. Embedded Solar PV Generation in South Africa. 2016. Available online: http://www.solareff.co.za/assets/Uploads/Solareff-Info-Brochure-Regulatory-Position-July-2016.pdf (accessed on 20 March 2019).
  48. Ling-Zhi, R.; Xin-Gang, Z.; Xin-Xuan, Y.; Yu-Zhuo, Z.; Ren, L.-Z.; Zhao, X.-G.; Yu, X.-X.; Zhang, Y.-Z. Cost-benefit evolution for concentrated solar power in China. J. Clean. Prod. 2018, 190, 471–482. [Google Scholar] [CrossRef]
  49. Blank, L.; Tarquin, A. Engineering Economy, 7th ed.; McGraw-Hill: New York, NY, USA, 2012. [Google Scholar]
  50. Wahlström, Å.; Joosen, S.; Geurts, F.; Kleefkens, O.; Zavrl, M.S.; Hansen, K.; Norvaisa, E.; Makowska, N.; Despretz, H.; Ruud, S. Handbook for Performing Feasibility Studies of Alternative Energy Systems; SENTRO: Utrecht, The Netherlands, 2008. [Google Scholar]
  51. Zhao, X.-G.; Jiang, G.-W.; Li, A.; Wang, L. Economic analysis of waste-to-energy industry in China. Waste Manag. 2016, 48, 604–618. [Google Scholar] [CrossRef] [PubMed]
  52. CFI. Levelized Cost of Electricity (LCOE)—Overview, How To Calculate. 2015. Available online: https://corporatefinanceinstitute.com/resources/knowledge/finance/levelized-cost-of-energy-lcoe/ (accessed on 10 February 2021).
  53. Monyeia, C.G.; Adewumia, A.O. Demand Side Management potentials for mitigating energy poverty in South Africa. Energy Policy 2017, 111, 298–311. [Google Scholar] [CrossRef] [Green Version]
  54. Zini, G. Energy Storage System Design and Functioning. In Green Electrical Energy Storage: Science and Finance for Total Fossil Fuel Substitution; McGraw Hill Education: New York, NY, USA; Chicago, IL, USA; San Francisco, CA, USA; Athens, Greece; London, UK; Madrid, Spain; Mexico City, Mexico; Milan, Italy; New Delhi, India; Singapore; Sydney, Australia; Cumberland, TN, USA; Toronto, ON, Canada, 2016; pp. 20–21. [Google Scholar]
  55. Eskom Ltd. Tariffs & Charges Booklet 2020/21. 2020. Available online: http://www.eskom.co.za/CustomerCare/TariffsAndCharges/Pages/Tariffs_And_Charges.aspx (accessed on 10 October 2020).
  56. Stewart, J. Calculus: Early Transcendentals, 6th ed.; Brooks/Cole Cengage Learning: Boston, MA, USA, 2008. [Google Scholar]
  57. Al Siyabi, I.; Al Mayasi, A.; Al Shukaili, A.; Khanna, S. Effect of Soiling on Solar Photovoltaic Performance under Desert Climatic Conditions. Energies 2021, 14, 659. [Google Scholar] [CrossRef]
  58. Corba, Z.; Popadic, B.; Milicevic, D.; Dumnic, B.; Katic, V.A. A Long-Term Condition Monitoring and Performance Assessment of Grid Connected PV Power Plant with High Power Sizing Factor under Partial Shading Conditions. Energies 2020, 13, 4810. [Google Scholar] [CrossRef]
  59. Gevorkian, P. Solar power system cost analysis. In Large-Scale Solar Power System Design: An Engineering Guide for Grid-Connected Solar Power Generation; McGraw Hill Professional: New York, NY, USA; Chicago, IL, USA; San Francisco, CA, USA; Athens, Greece; London, UK; Madrid, Spain; Mexico City, Mexico; Milan, Italy; New Delhi, India; Singapore; Sydney, Australia; Cumberland, TN, USA; Toronto, ON, Canada, 2011. [Google Scholar]
  60. Bayer, B.; Schäuble, D.; Ferrari, M. International experiences with tender procedures for renewable energy—A comparison of current developments in Brazil, France, Italy and South Africa. Renew. Sustain. Energy Rev. 2018, 95, 305–327. [Google Scholar] [CrossRef] [Green Version]
  61. Van Vuuren, D.J.; Marnewick, A.; Pretorius, J.H.C. Validation of a Simulation-Based Pre-Assessment Process for Solar Photovoltaic Technology Implemented on Rooftops of South African Shopping Centres. Sustainability 2021, 13, 2589. [Google Scholar] [CrossRef]
  62. Dos Santos, Í.P.; Rüther, R. Limitations in solar module azimuth and tilt angles in building integrated photovoltaics at low latitude tropical sites in Brazil. Renew. Energy 2014, 63, 116–124. [Google Scholar] [CrossRef]
  63. Asowata, O.; Swart, J.; Pienaar, C. Optimum tilt and orientation angles for photovoltaic panels in the Vaal triangle. In Proceedings of the Asia-Pacific Power Energy Engineering Conference APPEEC, Shanghai, China, 27–29 March 2012. [Google Scholar] [CrossRef]
  64. Haysom, J.E.; Hinzer, K.; Wright, D. Impact of electricity tariffs on optimal orientation of photovoltaic modules. Prog. Photovolt. Res. Appl. 2015, 24, 253–260. [Google Scholar] [CrossRef]
  65. Mayr, D.; Schmid, E.; Trollip, H.; Zeyringer, M.; Schmidt, J. The impact of residential photovoltaic power on electricity sales revenues in Cape Town, South Africa. Util. Policy 2015, 36, 10–23. [Google Scholar] [CrossRef]
  66. RSA Department of Energy. Annexure Schedule 2: Exemption from Obligation to Apply for and Hold a Licence. Gov. Gaz. 2016, 1482, 58–63. [Google Scholar]
  67. Dhoke, A.; Sharma, R.; Saha, T.K. PV module degradation analysis and impact on settings of overcurrent protection devices. Sol. Energy 2018, 160, 360–367. [Google Scholar] [CrossRef]
  68. Canadian Solar. Canadian Solar MaxPower CS6U-315|320|325|330P Datasheet, 5.52; Canadian Solar: Quelph, ON, Canada, 2016. [Google Scholar]
Figure 1. Historical electricity tariffs and the inflation rate of South Africa from 2004 to 2018 [38,39].
Energies 14 01666 g001
Figure 2. Electricity tariff based on seasonal change and ToU.
Energies 14 01666 g002
Figure 3. Average daily power production from a maximum power point tracker (MPPT).
Energies 14 01666 g003
Figure 4. Basic illustration of the case study photovoltaic (PV) system layout.
Energies 14 01666 g004
Figure 5. Illustration of the curvature of the PV modules affixed to the roof.
Energies 14 01666 g005
Figure 6. Basic illustration of the process followed in determining the return on investment (ROI).
Energies 14 01666 g006
Figure 7. Average daily electricity production from the case study.
Energies 14 01666 g007
Figure 8. ROI of the case study PV system.
Energies 14 01666 g008
Figure 9. Depiction of results through scatter plot.
Energies 14 01666 g009
Table 1. Summary of other studies with similar characteristics
Type of AnalysisLocation of StudySystem SizeDescription of AnalysisReference
Generation of an economic performance modelChinaN/AA cost-benefit model was derived to study the economic performance of a PV system under current policies[28]
Analyses of case studies Spain1.2 to 2.6 kWp at a fixed angleA model was derived that allows the user to maximise the energy consumed from the PV systems to optimise the cost-competitiveness of PV systems.[29]
Generation of a cost-benefit mathematical modelChinaN/AAn analysis was conducted on concentrated solar power (CSP) systems to improve policies and investment decisions[30]
Analyses of case studiesIranApproximately 5 kW at a fixed angleAn evaluation of various PV systems was conducted to determine the economic performance of the PV systems, including the LCOE, NPV, ROI, Payback period[31]
Analyses of case studiesForli, ItalyAll less than 3 kWp at a fixed angleAnalyses were conducted on various PV systems to determine the pay-back period.[32]
Table 2. List of nomenclatures used in equations.
Nomenclature
α Ratio of O & M costs to payable input tax P e i 0 Feed-in tariff
β V A T The proportion of VAT refunds P e i 1 Self-use electricity price
π The ratio of self-use electricity P e i 2 Subsidy price
θ PV system comprehensive influence coefficient (generally 75% [28]) P C I The present value of cash inflow
ε i Degradation rate of the PV system P C F u e l The present value of fuel costs
C Radiation coefficient of PV modules (generally 1.1 [28]) P C i n s The present value of annual insurance costs
d Discount rate P C i r The present value of interest on loans
C i n s Insurance costs P C k The present value of capital expenditure
C O & M O & M costs P C O & M The present value of O & M costs
C i r Interest P C s The present value of construction costs
C 0 Initial cash flow P C V A T The present value of VAT tax expenditure
C I Annual cash inflow N P V i n v e s t m e n t The net present value of investment cost
C O Annual cash outflow N R p v The power generated from the system in a period
D p Depreciation period R P Repayment period
E i Annual generation r Income tax rate
f Inflation rate per period T Lifecycle of system
H Standard solar radiation intensity t a d d Additional tax rate (surtax)
H i Annual radiation accepted by the region t V A T VAT tax rate
i In the i year T i n c Income tax
k Loans ratio in total investment T o u t Sales tax
l Loan interest rate T L C P V Total expenditure
n Number of periods (year) T L R p v Total revenues
M Installed capacity of the system V A T i Value-added tax
O k Overnight construction costs
Table 3. Summary of assumptions made in conducting a financial evaluation [45,46,47].
DescriptionCost Weight/ValueUnit
Parameter: Initial Investment Costs
PV panel capacity 50–55% of aggregate cost of systemR
Inverter8–10% of aggregate cost of systemR
Logging software0–1% of aggregate cost of systemR
Fixation components of PV panels 10–15% of aggregate cost of systemR
Cabling and general6–10% of aggregate cost of systemR
Environmental impact assessment0–1% of aggregate cost of system, if required R
Site cleaning0–5% of aggregate cost of system, if requiredR
Transportation0–5% of aggregate cost of systemR
Installation cost5–10% of aggregate cost of systemR
Parameter: Future Operating Costs
Operation and maintenance (O & M) cost0–3% of the PV system costR
O & M cost growth rate (nominal)0.49%%
O & M cost growth rate (real)6–10%%
Failure rate of PV panels and inverters0–5% of rated PV system size%
Labour cost to repair0–1% of O & M cost/annumR/year
Growth rate of labour cost (nominal)1%%
Degradation rate of PV modules20% of rated PV panel capacity over 25 years %/year
Inflation rate4–5%/annum%/year
Parameter: Financing Parameters
Current retail electricity priceVaries as per tariff structureR/kWh
Current tariff increase rate7–8%/year
Loan amount80% (based on the author’s assumption)
Load interest rate10.25%
Financing period10–15years
Salvage value rate15%15%
Table 4. Tariff classification based on season and time-of-use (ToU) [55].
Demand Classification (Season)Electricity ClassificationWeekdaySaturdaySunday
High demand (June–August)Peak hours06:00–09:00; 17:00–19:00N/AN/A
Low demand (August–May)07:00–10:00; 18:00–20:00N/AN/A
High demandStandard hours09:00–17:00; 19:00–22:0007:00–12:00; 18:00–20:00N/A
Low demand06:00–07:00; 10:00–18:00; 20:00–22:0007:00–12:00; 18:00–20:00N/A
High demandOff-peak hours22:00–06:0020:00–07:00; 12:00–18:0000:00–24:00
Low demand22:00–06:0020:00–07:00; 12:00–18:0000:00–24:00
Table 5. Summary of operating conditions of the case study [61].
Parameter: System Design Characteristics
Component DescriptionName and Model/QuantityUnit
InverterKaco new energy Powador 60.0 TL3
Number of inverters18
Rated inverter power49.9kVA
PV moduleCanadian Solar Inc. CS6X-320P
Number of PV modules2 889W
Rated PV module power (1 module)320W
Latitude (within a 40 km radius of the case study)26°8′12.02″ S
Longitude (within a 40 km radius of the case study)28°14′28.13″ E
Plane tilt–9 ≤ β ≤ 10°
Azimuth0°
PV module fixation methodRooftop, approximately 200 mm from the surface of the roof
DC cable length50–200 (6 mm2 DC cable)m
Approximate DC voltage loss at max load0.36—0.84%
AC cable length75 (4 × 95 mm2 × 4 core SWA ECC armoured cables)m
Approximate AC voltage loss at max load1.3275%
System logging componentSolar-log 2000
Parameter: System Operating Conditions
Installation date of system components1 August 2016—30 November 2016
System commission date1 December 2016
Start date of analysisDecember 2016 (Month 1)
Stop date of analysisNovember 2018 (Month 24)
Publisher’s Note: MDPI stays neutral with regard to jurisdictional claims in published maps and institutional affiliations.

