3.1. Sociodemographic Statistics
The main housing and socioeconomic characteristics of the survey sample are presented in
Table 2.
As mentioned, a total number of 303 households participated in the survey, most of which, i.e., 59.3%, include three or more persons, 24.5% include two persons and 12.6% consist of single-person households. The share of the elderly people (i.e., over 65 years old) is 21.2%. In addition, 66% of the population is aged between 31 and 65 years old (i.e., 25.9% between 31 and 45 years old and 40.1% between 46 and 65 years old) and the rest are between 18 and 30 years. About 15% have not reached high school, 26% have stopped their education at the end of senior high school, 14.5% have finished a 2-year vocational degree, 37% have a three-, four- or five-year degree and about 10% have an MSc or a PhD degree. Concerning employment status, 64.4% are employed (31.9% are full-time and 32.5% are part-time employees) and 32.5% are retired. Finally, more than half of the participants are managing to make ends meet on their income (85% of the respondents in this category declare income between 750 and 1750 Euros per month), 15.5% live comfortably (88% of the respondents in this category declare income above 1750 Euros per month) but 9.4% are struggling to cope with current income (85% of the respondents in this category declare income less than 1050 Euros per month).
About 60% of the dwellings were constructed before 1980, the year that the first Greek Thermal Regulation was implemented. One-third of them were built after 1980 and before 2000 and the rest after 2000. About one-third of the residences are less than 80 m2, one-third between 80 and 100 m2, 22% between 100 and 120 m2 and the rest are over 120 m2. Nearly 6% have two rooms, 13% have three rooms, 60.9% have four to five rooms and the rest have more than five rooms, except for bathrooms and storage rooms.
Among the households that took part in the survey, the dominant fuels are heating oil and biomass, namely firewood and pellets (these two fuels account for about 95% of the local households). In detail, 43% of the households use oil-fired central heating systems, 34% use firewood and pellets central heating systems, 18% use wood or pellet-fired stoves, and the rest of the households use other systems (e.g., air-conditioning units, heat accumulators and fireplaces). The average annual energy cost for heating is slightly over 2000 Euros and that of electricity around 900 Euros. The heating cost varies according to the fuel used. More specifically, the annual heating cost is around 2500 Euros for the oil-fired heating systems, 1800 Euros for the firewood and pellets central heating systems and 1400 Euros for the wood or pellet-fired stoves.
In total, less than 10% of the households have undertaken energy efficiency improvements to their houses and about 25% of the households claim that they are planning to take energy efficiency actions in the near future. Excluding those who have already improved the energy efficiency of their homes, more than 85% of those who are not planning to invest in energy efficiency mentioned that they face financial barriers.
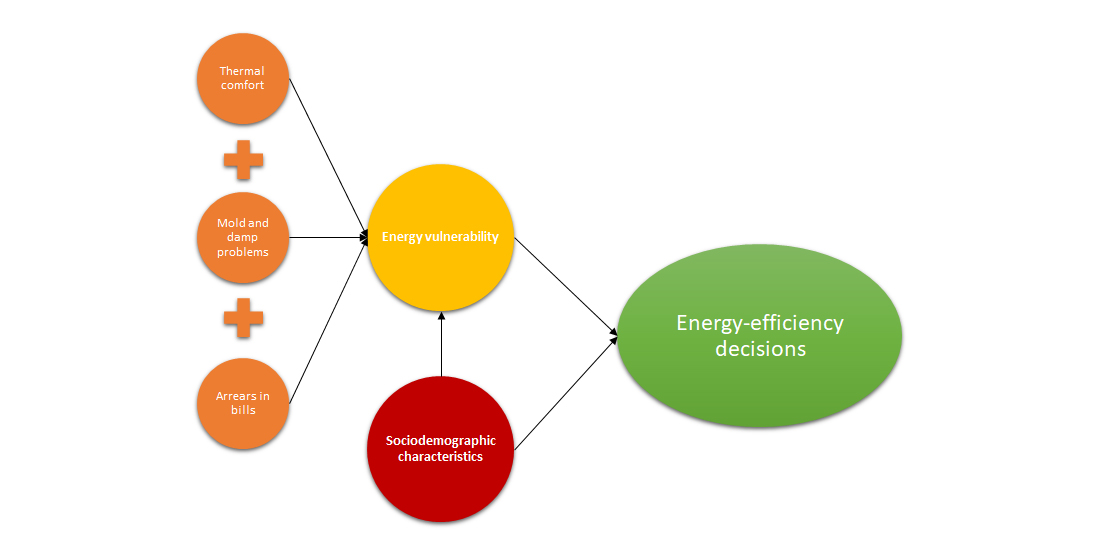
Concerning the energy poverty situation, approximately 30% of the households claimed that they cannot keep their house adequately warm in winter, 34% of them reported mold and damp problems and 10% reported arrears in energy bills. However, it should be taken into account that fuels for heating purposes are always paid in cash. Based on the composite energy poverty index [
43], approximately 50% of the households are at zero risk of energy poverty, 18.6% are at low risk (EP composite index = 25%), 15.5% are at medium risk (EP composite index = 50%), 13.9% are at high risk (EP = 75%) and the rest, i.e., around 3%, are in excess energy poverty risk.
Pearson’s chi-square tests of independence were performed to determine whether there is a statistically significant relationship between the four subjective energy poverty indicators and the income of the households. The value of the chi-square test is calculated, as follows:
where
χ2 is Pearson’s cumulative test statistic, which asymptotically approaches a
χ2 distribution;
Oi is the number of observations of type
i (i.e., the observed frequency) and
Ei is the expected (theoretical) count of type
i (i.e., the expected frequency)
The chi-square test intends to determine how likely it is that an observed distribution is due to chance and the null hypothesis of the test is that no relationship exists on the categorical variables, i.e., they are independent. The null hypothesis is rejected when the χ2 value is large, i.e., it exceeds the χ2 distribution at a 5% significance level considering the degrees of the test, which are equal to the number of rows minus one times the number of columns minus one.
The null hypothesis of the chi-square test was rejected, indicating a statistically significant relationship, in the case of inability to keep the home warm during winter days (χ2 = 15.54, d.f. = 2, p = 0.000), when the household has had arrears in its utility bills (χ2 = 6.992, d.f. = 2, p = 0.030) and the case of the composite index (χ2 = 21.454, d.f. = 8, p = 0.006). In all these cases, the occurrence of energy vulnerability is higher in lower-income households. The null hypothesis cannot be rejected in the case of leakages or damp walls (χ2 = 4.188, d.f. = 2, p = 0.123).
3.2. CL Model Estimates
To explore the effect of energy poverty and SDCs in energy efficiency investments, five different models were run. The first model (“Basic”) includes only variables related to the attributes of the experiment. The second model (“SDC”) includes the attributes of the experiment, and SDCs, namely total number of household members, age class and income class. The third model (“CIEP”) involves, besides the attributes of the experiment, the composite energy poverty index of Bouzarovski and Tirado Herrero [
43], which is modeled as a generic attribute. The fourth model (“SIEP”) examines the effect of the subjective energy poverty indicators (thermal discomfort, arrears in its utility bills and damp/mold problems) as generic attributes. The fifth and last model (“AS-SIEP”) is enriched with alternative-specific subjective energy poverty indicators and aims to dissect the possible relationships between the three subjective indicators and each of the alternatives. The results of the models are presented in
Table 3.
In all five models, the experiment attributes are statistically significant and the signs are as expected. The ASC of “heating” alternatives is statistically significant at p = 10% in the “basic” model and insignificant in the “SDC” model. In addition, the ASC of “appliances” alternatives is statistically insignificant in all model specifications. The “SDC” model presents the best fit and, further, all variables but the ASC of “heating” and “appliances” alternatives are statistically significant at p = 1% and have the expected sign. Focusing on the SDC parameters, the signs of the coefficients indicate that households with more members, younger householders and higher income are more likely to invest in energy efficiency. The composite energy poverty indicator (“CIEP” model) is statistically significant at p = 5%. The negative sign implies that willingness to invest in energy efficiency decreases with energy poverty. According to the results of the “SIEP” model, this is attributed to the inability of households to keep their houses adequately warm. It is reminded that the weight of thermal discomfort is twice as high as that of arrears in utility bills and problems with condensation, mold or damp. Further, the thermal discomfort coefficient is statistically significant at p = 1%, whereas the coefficients of the other two subjective indicators are significant at p = 10%. As shown in the results of the “AS-SIEP” model, households who are unable to heat their homes adequately in winter are not willing to invest in any of the proposed alternative interventions. Those who are faced with condensation, mold or damp problems are willing to invest only in energy retrofits while those in arrears are willing to invest in upgrading their heating system and household appliances. This seemingly inconsistent behavior is explained by the association of the subjective energy poverty indicators with the household income. The percentage of low-income households among those that are faced with thermal discomfort is around 40%. The respective percentage for those faced with mold and damp and arrears in energy bills is less than 25% (it is also noted that energy-bill arrears concern only 10% of the households). Household income seems to have a more significant effect on energy efficiency investments than the energy poverty indicators. To test this argument, an additional model was tested, adding energy poverty indicators in the “SDC” model (the results are omitted for conciseness reasons). Indeed, in all models, the energy poverty coefficients were statistically insignificant while household income was statistically significant at p = 1%.
To facilitate the comparison across different attributes, the average marginal willingness to pay (MWTP) was calculated in
Table 4 for all five models. It is mentioned that MWTP values for the subjective indicators in the “SIEP” model are calculated by the generic coefficients of the indicators divided by the respective cost coefficient of each alternative, whereas in the “AS-SIEP” model they are estimated by dividing the alternative-specific coefficients by the respective cost coefficient of each alternative.
Regarding annual savings, households on average are willing to pay around 3.4, 3.5 and 4.3 Euros for saving 1 Euro by investing in insulation, upgrading of heating systems and upgrading of household appliances, respectively. The difference in the mean WTP values, however, is not statistically significant. SDC attributes also have an impact on households’ WTP values for alternative energy efficiency improvements. Specifically, WTP for energy retrofit, upgrading of heating system and upgrading of household appliances increases by about 459, 11 and 55 Euros per household member, respectively. Furthermore, an increase in age class results in a decrease of about 1285 Euros in WTP for energy retrofit. WTP for upgraded heating systems and more energy-efficient appliances also decreases by 311 and 155 Euros, accordingly. Finally, higher-income households are willing to pay more for energy efficiency improvements. According to the estimates, WTP for energy retrofit, upgraded heating systems and more energy-efficient appliances increases by 2320, 562 and 280 Euros, respectively, with an increase in income class. The differences in the WTP values for the three energy interventions are statistically significant in all SDC parameters (the null hypothesis of equal means is rejected at p < 1% in all cases).
Based on the generic coefficients (i.e., the ”SIEP” model), households who face condensation, mold and damp problems are willing to pay 708.3 Euros more for energy retrofit and 178.4 Euros for upgraded heating systems compared to those who do not face similar issues (WTP for energy efficient appliances was statistically insignificant and, therefore, it is not reported). Similarly, those who are struggling to pay their energy bills are willing to pay around 1140 Euros more for energy retrofit and 140 Euros more for energy efficient appliances (WTP for upgraded heating systems is not statistically significant). Households who are unable to keep their homes warm are not willing to pay for energy interventions. The same finding is observed in the "CIEP” model regarding the composite energy poverty indicator. Finally, according to the alternative-specific energy poverty coefficients (i.e., the ”AS-SIEP” model), those who report condensation, mold and damp problems are willing to pay only for energy retrofits (about 1650 Euros, ceteris paribus) and those who delay their bill payments are willing to upgrade their heating systems and household appliances (WTP is 539 and 422 Euros, respectively). The differences in WTP values are statistically significant in all these cases (the null hypothesis of equal means is rejected at p < 1%).
In an effort to further investigate the impact of income and subjective energy poverty indicators on households’ willingness to invest in energy efficiency, four additional models with split samples were run. In each model, ASCs, cost and annual savings attributes were estimated separately for each income and energy poverty class and, to interpret the findings of each model, the average MWTP per one Euro of additional annual savings was calculated per group for all alternative interventions. For conciseness reasons, the detailed model results are omitted and instead only the MWTP estimates are reported in
Table 5. Further,
Table 6 illustrates the estimated choice probabilities for each alternative, per model and group.
As far as the ”income” model is concerned, the MWTP values suggest that households are willing to pay more for energy efficiency improvements as their income increases. For example, households who are struggling to make ends meet (i.e., those classified in Group I) are willing (or able) to invest 1.9 Euros per Euro of annual savings, which is almost half of the households who are coping on current income and about one-third of the households who are living comfortably. The differences in the MWTP values for the same alternatives across income groups as well as the MWTP values of different alternatives in the same income group are statistically significant (the null hypothesis of equal means is rejected at p < 1% in all cases). The influence of income is also reflected in households’ choices. The “opt-out” alternative is selected by 34% of Group I participants, 19% of Group II participants and only 8.5% of Group III participants.
Households facing condensation, mold and damp problems are willing to pay 5 Euros more per one Euro of annual savings for upgrading their heating system. Energy retrofit has the lowest MWTP (almost 3 Euros per one Euro of annual savings), whereas upgrading of household appliances lies in the middle (around 4 Euros per one Euro of annual savings). On the other hand, those who are not facing these issues are willing to pay around 4.5 Euros for a more energy-efficient appliance, 3.8 Euros for energy retrofits and 2.9 Euros for more efficient heating systems per one Euro of annual savings. Again, the differences in the mean MWTP values for the three alternatives are statistically significant at p = 5% between and across the two groups. Investing in energy retrofit is the most preferred choice, especially for those who suffer from condensation, mold and damp problems. Another interesting point is that the “opt-out” alternative is more preferable than the “appliances” alternative, coinciding with the negative sign in the ASC of the “appliances” alternative in almost all the models tested (it is reminded, however, that the coefficient was not statistically significant at p = 10%).
Households who report that they are unable to stay comfortably warm are willing to pay 4.3 Euros for more energy-efficient appliances, 2.8 Euros for more efficient heating systems and 2.2 Euros for energy retrofits per one Euro of annual savings. MWTP for more energy-efficient appliances is practically the same for those who do not experience thermal discomfort in their homes. MWTP for more efficient heating systems and energy retrofits increases to 3.7 Euros and 3.8 Euros, respectively, per one Euro of annual savings. The null hypothesis about the equality of means is rejected at p = 1% for the MWTP values of the alternative interventions between and across the two groups. Energy retrofit is once more the most preferred alternative and the “opt-out” option is more preferable to the “appliances” option. It is also worth noting that the probability of choosing the “opt-out” alternative increases by 10% in the “discomfort” group (i.e., Group II). As explained earlier, this finding is related to the lower-income class of those who are faced with thermal discomfort and is supported also by the findings of the “income” model.
MWTP values for those who report arrears in energy payments are not provided because they are statistically insignificant. Regarding Group I (i.e., those who do not report arrears in energy bills), the estimated MWTP values for energy retrofits, upgrading of heating systems and upgrading of household appliances are 3.6, 3.4 and 4.6 Euros respectively, for every Euro saved per year. The preference probabilities show a similar pattern with that of the other two subjective indicators models, i.e., the “insulation” alternative is the most preferred choice and the “opt-out” alternative is more preferable than the “appliances” choice. It is interesting, however, that those who report arrears in bills tend to have higher preferences for the “heating” and “appliances” alternatives compared to those who are unable to stay comfortably warm or face damp problems.


