Abstract
The U.S. Deepwater Gulf of Mexico (DGOM) area that has some of the most prolific oil reservoirs is still awaiting the development of a viable enhanced oil recovery (EOR) process. Without it, DGOM will remain severely untapped. Exorbitant well costs, in excess of $200 million, preclude having extensive injection patterns, commonly used in EOR design frameworks. Aside from injection patterns, even operationally waterflooding has met with significant challenges because of injectivity issues in these over pressurized turbidities. The gas-assisted gravity drainage (GAGD) EOR process, that holds promise for deepwater environments because of lesser injectivity issues, among others, has been adapted in this work to overcome these limitations. A novel design in the form of a single well—gas assisted gravity drainage (SW-GAGD) process, has been demonstrated to emulate the benefits of a GAGD process in a cost-effective manner. Unlike conventional GAGD processes, which need multiple injectors and separate horizontal production wells, the SW-GAGD process just uses a single well for injection and well production. The performance of the process has been established using partially scaled visual glass models based on dimensional analyses for scale up of the process. The recovery factor has been shown to be in the range of 65–80% in the immiscible mode alone, and the process is orders of magnitude faster than natural gravity drainage. A toe-to-heel configuration of the SW-GAGD process has also been tested and for the configuration to be immune from reservoir layering, the toe of the well should ideally end at the top of the payzone. Better sweep of the payzone and consequent high recovery factor of 80% OOIP was observed, if the heel part of the bottom lateral is located in a lower permeability zone.
1. Introduction
The U.S. Deepwater Gulf of Mexico (DGOM) in the federal offshore continental shelf (OCS) contains some of the most prolific reservoirs and has seen rapid growth in oil and gas exploration and production activities. However, unlike onshore reservoirs, offshore is an extremely high cost environment, particularly in terms of drilling and completion, where a single well could cost in excess of $200 million [1] Even though the recovery factors upon primary depletion are dismal for these reservoirs, we still do not have a robust secondary or tertiary recovery process in place to sustain the production in the longer term. [2]. Waterflooding has met with significant challenges, including injectivity issues and induced fracking in these tight overpressurized turbidite reservoirs in DGOM. Pattern floods that are commonly employed in onshore fields become cost prohibitive, especially in the face of challenges such as low additional recovery factor of present enhanced oil recovery (EOR) processes, exorbitant well costs, smaller reservoirs and exacting depositional environments.
Gas injection that has been successful in tight oil basins elsewhere because of lesser injectivity issues, is thus a potential choice. Horizontal gas floods like water-alternating-gas (WAG), where water is needed for conformance control, has been shown to only incrementally boost recoveries. An extensive field review of 59 field projects indicated only 5–10% OOIP additional WAG recovery [3]. Gravity stable gas floods have been successful in dipping and pinnacle reef type reservoirs because of better sweep efficiencies [4,5]. The success led to advancing of strategies using gravity drainage aided by injection of gases, even in non-dipping systems. An injection scheme out of Waterloo University [6] uses an inert gas at the top of reservoir to affect recoveries though drainage and oil film flow in water-wet reservoirs with positive spreading coefficient. Oil production relies primarily on gravity drainage and not on application of a high pressure differential on the gas. The rate determining step is the gravity drainage of oil films. The scheme, however, does not specify any particular well configuration and is targeted at depleted reservoirs. Another such strategy is gas-assisted gravity drainage (GAGD) [7] utilizing multiple vertical injectors at the top of the payzone to displace and drain the oil to a horizontal lateral at the bottom of the payzone. It utilizes a pressurized gas, not only to drain but also to displace the oil column. This scheme is applicable to a wide swath of reservoirs, irrespective of their wettability and oil-spreading behavior, and is thus becoming increasingly popular as a gas-injection EOR process. A field scale simulation of GAGD process [8] in a heterogeneous sandstone reservoir was adopted for 10 years of future prediction period. It showed a 10-fold increase in the speed of recovery compared to primary depletion. The recovery factor was 30% and 42% of the remaining oil in immiscible and miscible modes respectively. The recovery factor was notably higher for GAGD at 23.7% compared to continuous gas injection (CGI) at 12.4% and water alternating gas (WAG) at 11.4%. A field pilot study [9] carried out in 2017 on a version of the GAGD process in an offshore basement reservoir was considered a technical and commercial success with significant economic benefits. Even the operational aspects of the GAGD process were deemed neither complicated, nor costly. Thus, GAGD process looks to be a promising candidate EOR process for DGOM environment. However, multi-well GAGD process that uses several wells, may need to be adapted to make it amenable to this high well-cost offshore environment.
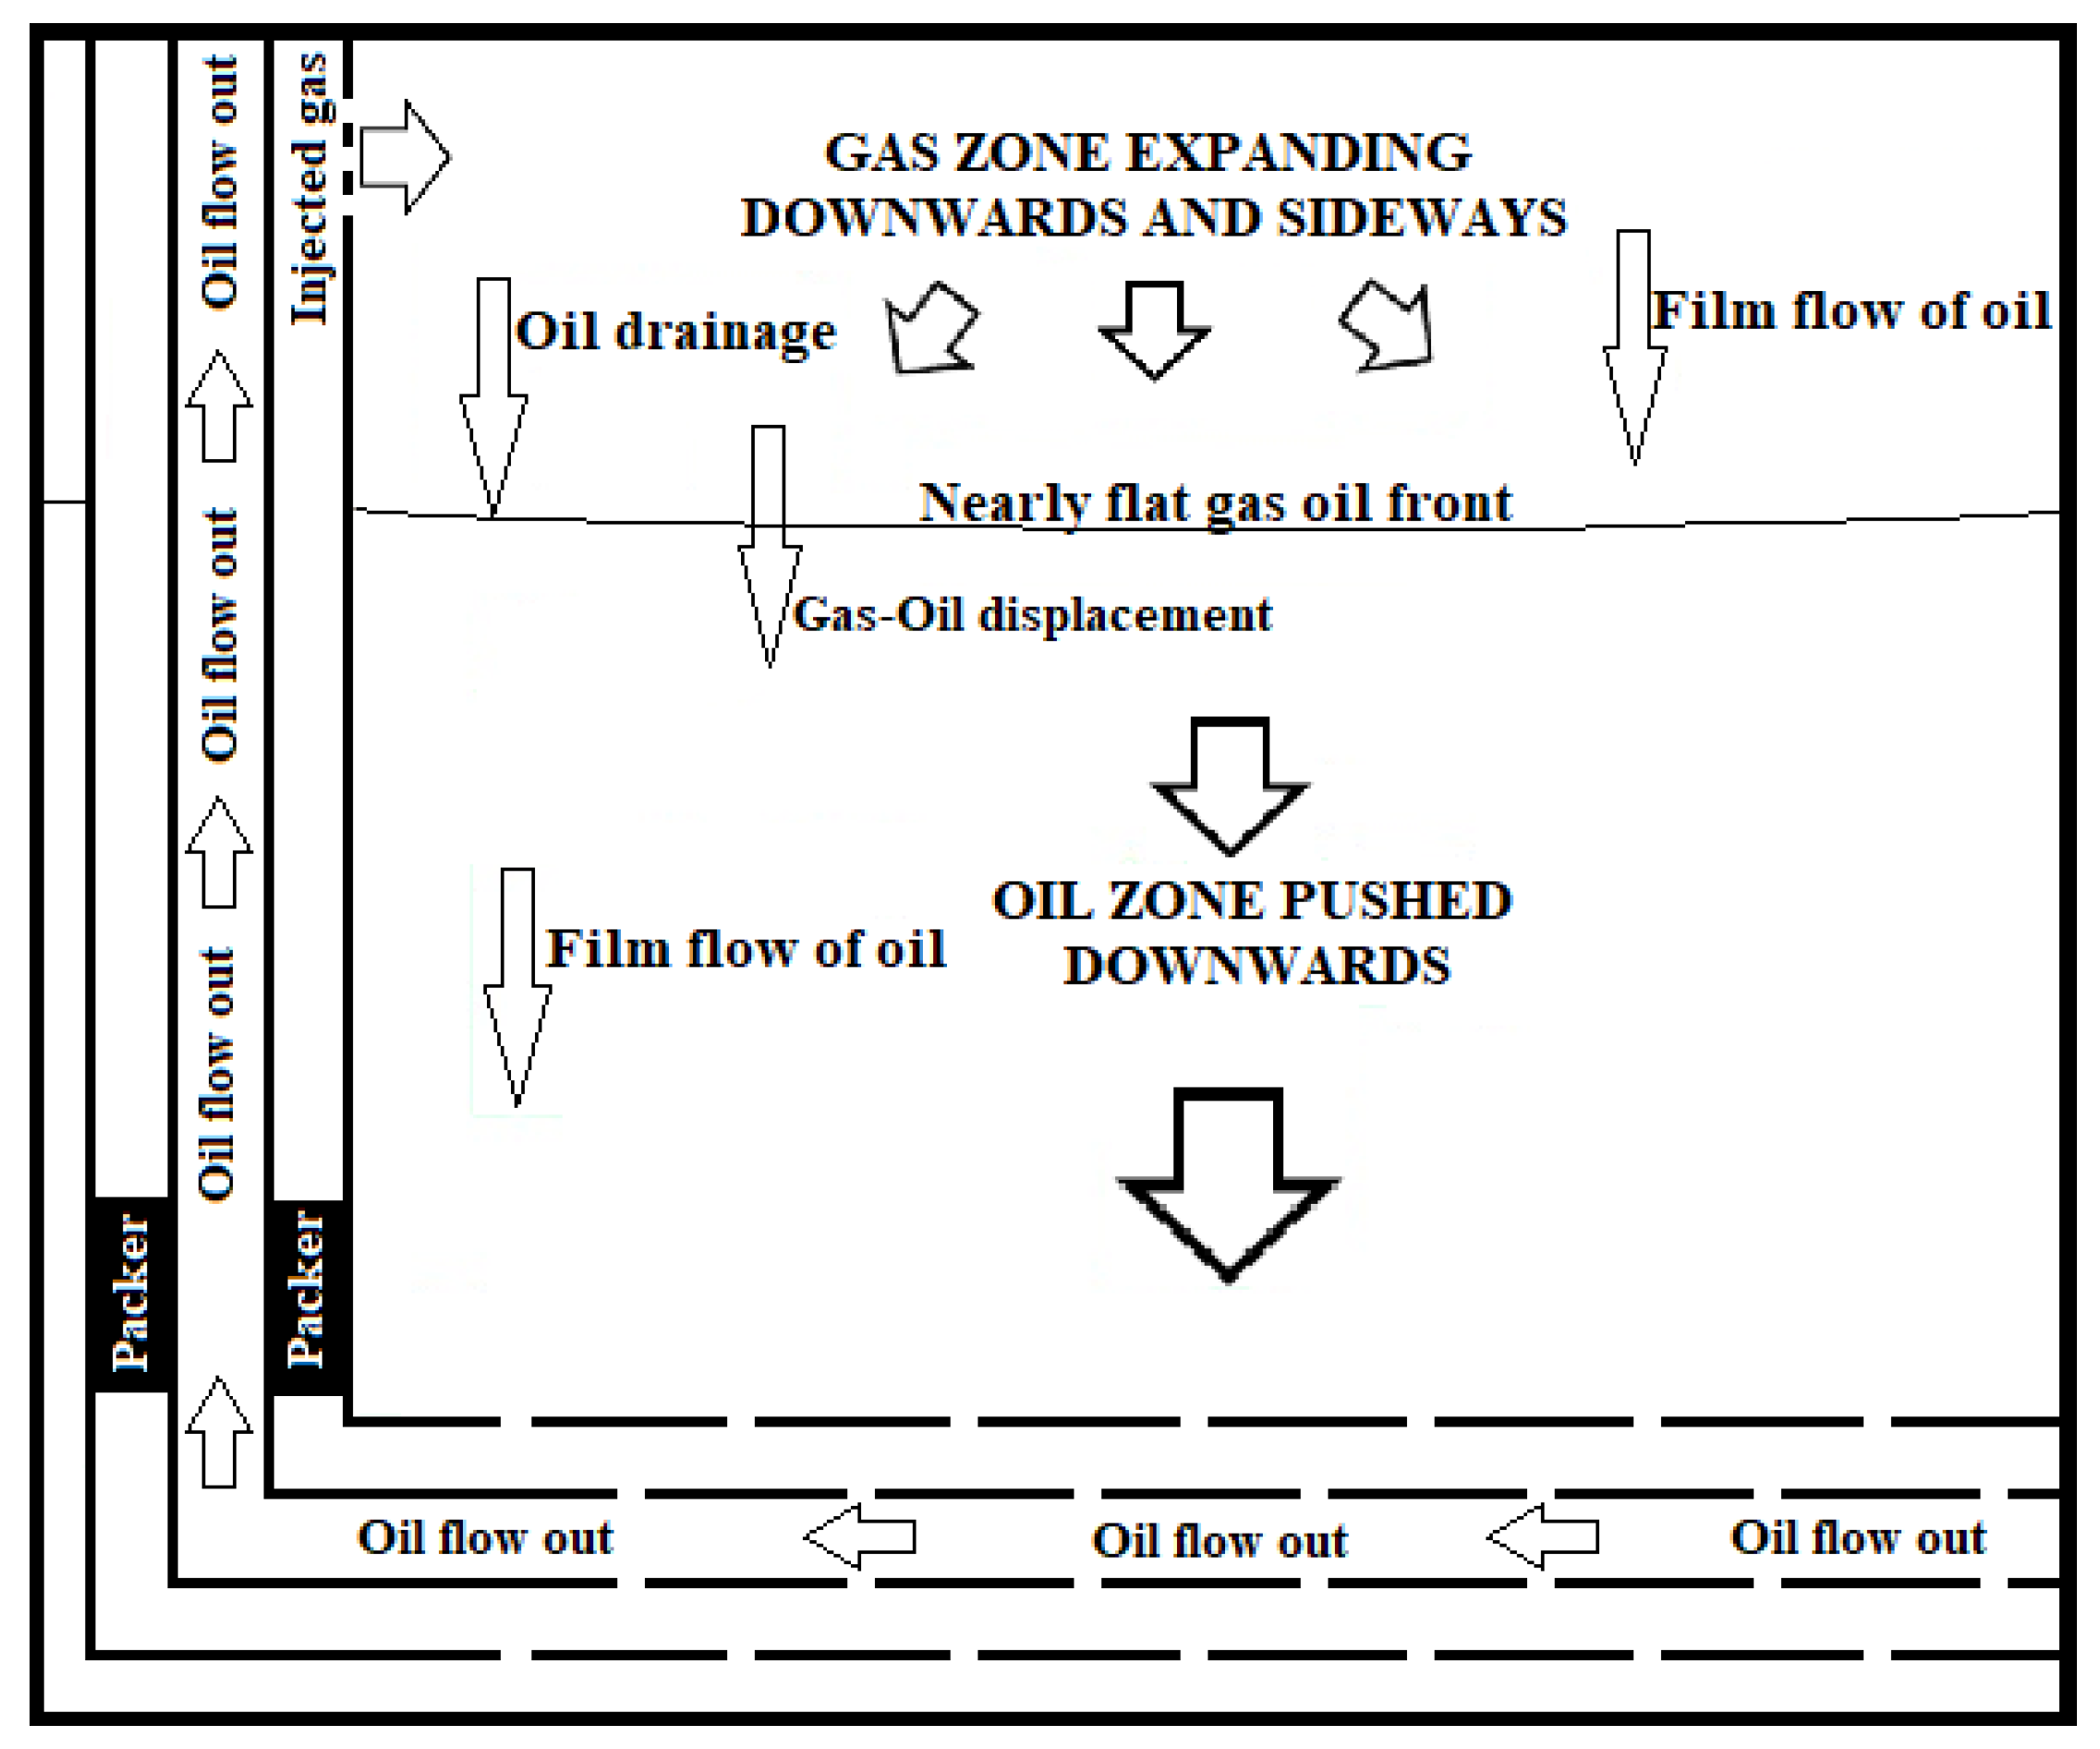
To emulate the success of GAGD in deepwater offshore environment, the concept of single-well GAGD (in short SW-GAGD) has been envisaged. In the novel SW-GAGD process, a single well acts both as an injector and as a producer operating in GAGD mode. This is distinct from conventional GAGD process where multiple injectors and separate horizontal production wells are used. Figure 1 shows the conceptual schematic of one of the possible SW-GAGD well configurations. As can be seen from Figure 1, the gas is being injected into the payzone at the top through the casing perforations and oil is produced through the bottom horizontal lateral. Injected gas gradually fills up the top of the reservoir, displacing the oil phase downward in a gravity stable top-down fashion towards the bottom lateral. As illustrated, gravity drainage, film flow and the gas-oil displacement mechanisms, all acting in the same downward direction, combine their synergistic effects to yield significantly higher oil recoveries and lower residual oil saturations than conventional gas injection EOR processes such as WAG and CGI.
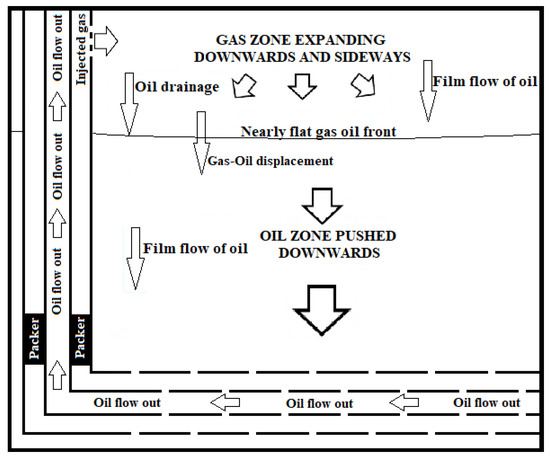
Figure 1.
Conceptual schematic of a SW-GAGD well configuration.
In the current work, the experimental design proceeds with first designing and constructing the partially scaled physical visual models to test the proof of concept of the single-well gas-assisted gravity drainage (SW-GAGD) process. Proof of concept was important to rule out short-circuiting of the advancing front, leading to premature breakthrough of the injected gas and to establish the frontal profile. Dimensional analysis-based approach was used and pertinent dimensionless groups were selected so as to be able to translate the laboratory results to field scale. A giant representative reservoir from DGOM was chosen and the range of dimensionless numbers for the field were determined.
Physical models were then constructed to match the dimensionless numbers. After constructing a hermetically sealed model, experiments were run to test out the proof of concept. This was followed by examination of salient operational parameters such as rate of injection on the process performance and compare that with free gravity drainage (base case). It was also important to understand how the single well version, where the injection is on one side of the bottom lateral, performed in comparison to GAGD configuration, wherein the injection point is towards the center of the lateral. Another model was built to test and compare both the configurations and to determine discrepancies if any. Since the proposed SW-GAGD configuration is at the preliminary stages of field implementation, it is likely to meet with completion challenges in the initial period. Hence another version of the SW-GAGD process that could lean on an existing completion framework, namely, Toe-to-Heel, which is widely used for a different application, was examined. Toe-to-Heel well configuration could be drilled with different orientation of the lateral and depending on the reservoir stratigraphy and layering, there could be profound impact on the recovery performance of the well. In order to gauge and visualize the impact of such configurations on SW-GAGD Toe-to-Heel version, another set of physical models were constructed and experiments were conducted to determine the recovery performance. This is an outline of the high-level workflow of the current project and the details are provided below.
2. Materials and Methods
Visualization of the single-well gas-assisted gravity drainage (SW-GAGD) process, its operability, performance and scalability were the salient attributes in designing the methodology. Dimensional analysis-based approach was used to design and construct scaled physical models to match DGOM reservoirs. Application of dimensional analysis yielded a range of values for dimensional numbers at the field scale. These ranges of dimensional numbers were then replicated in the constructed physical models by choosing appropriate model configuration and adjusting the operational parameters. The scaled physical models were then used for the proof of concept experimentation of SW-GAGD process and to characterize its performance. The above steps are elaborated in the following paragraphs.
2.1. Dimensional Groups for Scalability of Physical Model Results
The objective here was to be able to translate the results obtained with SW-GAGD physical model experiments from laboratory to the field scale. Principle of dimensional analysis based on the Buckingham Pi theorem was used for this purpose. Dimensionless analysis is a great scaling tool as it helps us in deriving useful functional relationships that can be applied across various length scales since the relationships are based on dimensionless groups. Determination of pertinent dimensionless groups [10] is critical for the success of scale up from laboratory to field scale. SW-GAGD is essentially a forced gravity process and hence like any gravity drainage displacement process in a porous media, the forces that affect the flow are gravity, capillary and viscous forces. Dimensionless numbers that are widely accepted in the literature to represent the interplay of these forces are bond number (NB), capillary number (NC) and gravity number (NG). Bond number, being a ratio of gravity to capillary forces, gives an indication of the relative importance of gravity force over that of capillary force. Similarly, capillary number gives the relative importance of viscous force over capillary force. These dimensionless numbers can be used to quantify the dynamic behavior, which has a predominant effect on recovery efficiency, of a gravity drainage process. They thus help to compare not only dynamic behavior but also the recovery factors of gravity drainage processes across different scales.
2.2. Choice of Representative DGOM Reservoir Properties
DGOM reservoirs represent varied and complex geology, rock and fluid properties and drive mechanisms. Hence no single reservoir will be representative of the gamut of reservoirs encountered in DGOM. For our task, one of the prolific reservoirs in the DGOM, viz., the N/O reservoir in the Mars field was chosen [2]. N/O (Yellow) reservoir is a Miocene to Pliocene age sand with a thickness of 99 ft. and acreage of 4917 acres. Initial reservoir pressure at datum was 11,305 psia with and original oil in place (OOIP) of 535 MMSTB. The reservoir is highly over-pressurized and highly compacting with a limited aquifer influx. The reservoir also has good vertical and horizontal permeability and good connectivity. Reservoir pressure went down to 6800 psi when water injection was started to keep the reservoir producing above bubble point pressure (6306 psia) and also to avoid compaction of the reservoir. Waterflood recovery is estimated at 56% for the reservoir. For our hypothetical SW-GAGD application the intervention pressure has been chosen to be slightly above the saturation pressure at 6500 psia. Though the base properties are that of Mars field, in order to represent the entire span of DGOM, rock and fluid properties have been spread out to cover the full range of properties encountered in DGOM.
2.3. Calculation of Dimensionless Numbers
The following definitions have been used while calculating the dimensionless numbers:
Since some of the rock and fluid property data were not available for the Mars field, analogs were used from other deepwater Gulf of Mexico reservoirs. Injectant gas used was nitrogen gas and the displacement process is characterized as immiscible to near miscible. Choice of immiscible to near miscible displacement is necessitated by the fact that at miscibility conditions, IFT between gas and oil phases will become zero and that will make these dimensionless numbers infinite. Since, this exercise is for comparing the dynamic performance of the process across different scales, this assumption will not limit the scope of the comparison. The use of nitrogen in place of CO2 is considered from an economic perspective, as Nitrogen can be generated on site whereas CO2 will have to be transported across hundreds of miles from ashore to offshore locations.
As can be seen from Equations (1)–(3), the parameters and properties needed for the calculation of the dimensionless numbers are: [2], L, [11], [12] and [13]. For calculation of Darcy velocity , the base injectivity value was chosen to be one half of the peak gas production rate from a similar depth well in the deepwater Gulf of Mexico. This was done as there were no reported values for gas injectivity in deepwater Gulf of Mexico as there isn’t a single gas injection projects in there till date. The range of values for the dimensionless numbers are presented in Table 1. Having obtained the range of dimensionless numbers for DGOM fields the next task was to construct the SW-GAGD model with appropriate configuration, including choice of appropriate fluids to obtain the dimensionless numbers within the range exhibited by DGOM reservoirs. Dimensionless numbers have been calculated for a typical SW-GAGD model with the following specifications:

Table 1.
The Dimensionless Numbers for the Field and that of the Laboratory Model.
Dimensions: 22″ × 10″ × 0.37″
Sand Size: 60 Mesh (0.251 mm)
Fluids: decane and N2
Gas Injection Rate: 10 cc/min
The calculated values obtained for bond number (NB), capillary number (NC) and gravity number (NG) for the model were 1.92 × 10⁻⁵, 3.11 × 10⁻⁵ and 6.17 × 10⁻¹. As can be seen, these values are within the range of values for the DGOM reservoirs, suggesting translatable of model results to DGOM reservoirs. So as to represent the entire span of DGOM, rock and fluid properties have been spread out to cover the full range of properties encountered in DGOM.
2.4. Construction of Physical Models
Visual glass models are a great way to follow the progress of gas floods. As a material, glass offers very good transparency and also the right wettability to suit our purpose, but the problem with glass is that it can’t withstand much pressure and tends to crack easily on application of a little pressure. Moreover, glass to glass bonding requires the right kind of glue and also proper curing procedure, which may also require pressure application at the bond. Construction of physical glass models was one of the most critical parts of the experimental protocol. Proper care was taken during construction as well as operation phase to have the hermetically sealed models needed for the study. Mahmoud et al. [14] constructed similar glass models but reported leakage in their models on sustained exposure to decane. Hence, proper sealing of the glass models was of paramount concern during construction. Construction of glass models was as much an art as it was science. A lot of trial and error went on to ensure proper bonding, sealing of the glass model so as to ensure that it was able to withstand the organic chemicals used during the conduct of experiments. A detailed protocol for the construction of the glass models is given in Appendix A.
2.5. Conduct of Experiments
The experiments were conducted with the following substeps, details of which are given below.
2.5.1. Initial Saturation of the Model and Determination of Its Pore Volume and Permeability
First of all, the model was placed upright on the stand and the horizontal well was connected to a burette containing deionized water. The top well was kept open to the atmosphere. The bottom valve was cracked open to slowly allow water to imbibe into the model through the bottom horizontal well. Pore volume was determined by slowly letting water imbibe into the model from the bottom using gravity feed, slowly displacing air from the top. Knowing the total water imbibed to fill the volume and that of dead volume of tubing and valves, the pore volume was calculated. Then the model was allowed to stand overnight to ensure that there is no leakage from the model. After the standing period, water was circulated through the model. Distilled water was circulated from top of the model in a top-down gravity stable fashion to ensure washing of the sands and stabilization of the sandpack. 3–4 pore volumes of water were circulated through the model. For permeability determination, the burette was filled to the top and connected to the top well of the model. The outlet was fully opened with the burette stopcock closed. Stopcock was then opened and flow was established. The time taken for water level to drop 10 cm in the burette was noted for a particular graduation (arbitrary) in the burette. Readings were repeated a few times to ensure reproducibility. The height difference between this particular graduation and the top of sand was noted and the potential difference between the inlet and outlet was calculated. Permeability was thus calculated using this potential difference, flowrate and other known geometrical and fluid parameters.
2.5.2. Establishing Original Oil Saturation in the Model
A burette filled with red dyed decane was connected to the top well. The burette was positioned as high as possible from the model so as to maximize the pressure head for flow. This helped to quickly displace all the mobile water from the sand-pack model. It was important to ensure that there was no obstruction including needle valves at the outlet of the model. The outlet of the model was connected to two burettes connected through a diverter valve so as to be able to have one burette online at a time, with the other isolated. Decane was allowed to flow into the model in a top-down gravity stable manner. Decane displaced the water in the model and was produced in the downstream burette. The flow of decane was continued till there was no more water production at the outlet. The volume of water produced was noted down. The volume of water produced gave the original oil in place in the model.
2.5.3. Experimental Runs
The model was connected to the downstream oil and gas collection and metering system. Data acquisition system was also connected. Prior to the start of runs with injectants, an experimental run was carried on to quantify the recovery with just the gravity in play by having the inlet open to the atmosphere. This was pure gravity drainage and served as the base case for rest of the runs with injectants. For nitrogen injection runs, Nitrogen flow rate was maintained using a regulator and a mass flow meter. Various flow rates ranging from 2.5–20 SCCM were used for flooding.
3. Results
The results are given in the following subsections.
3.1. Conceptual Validation of SW-GAGD Design
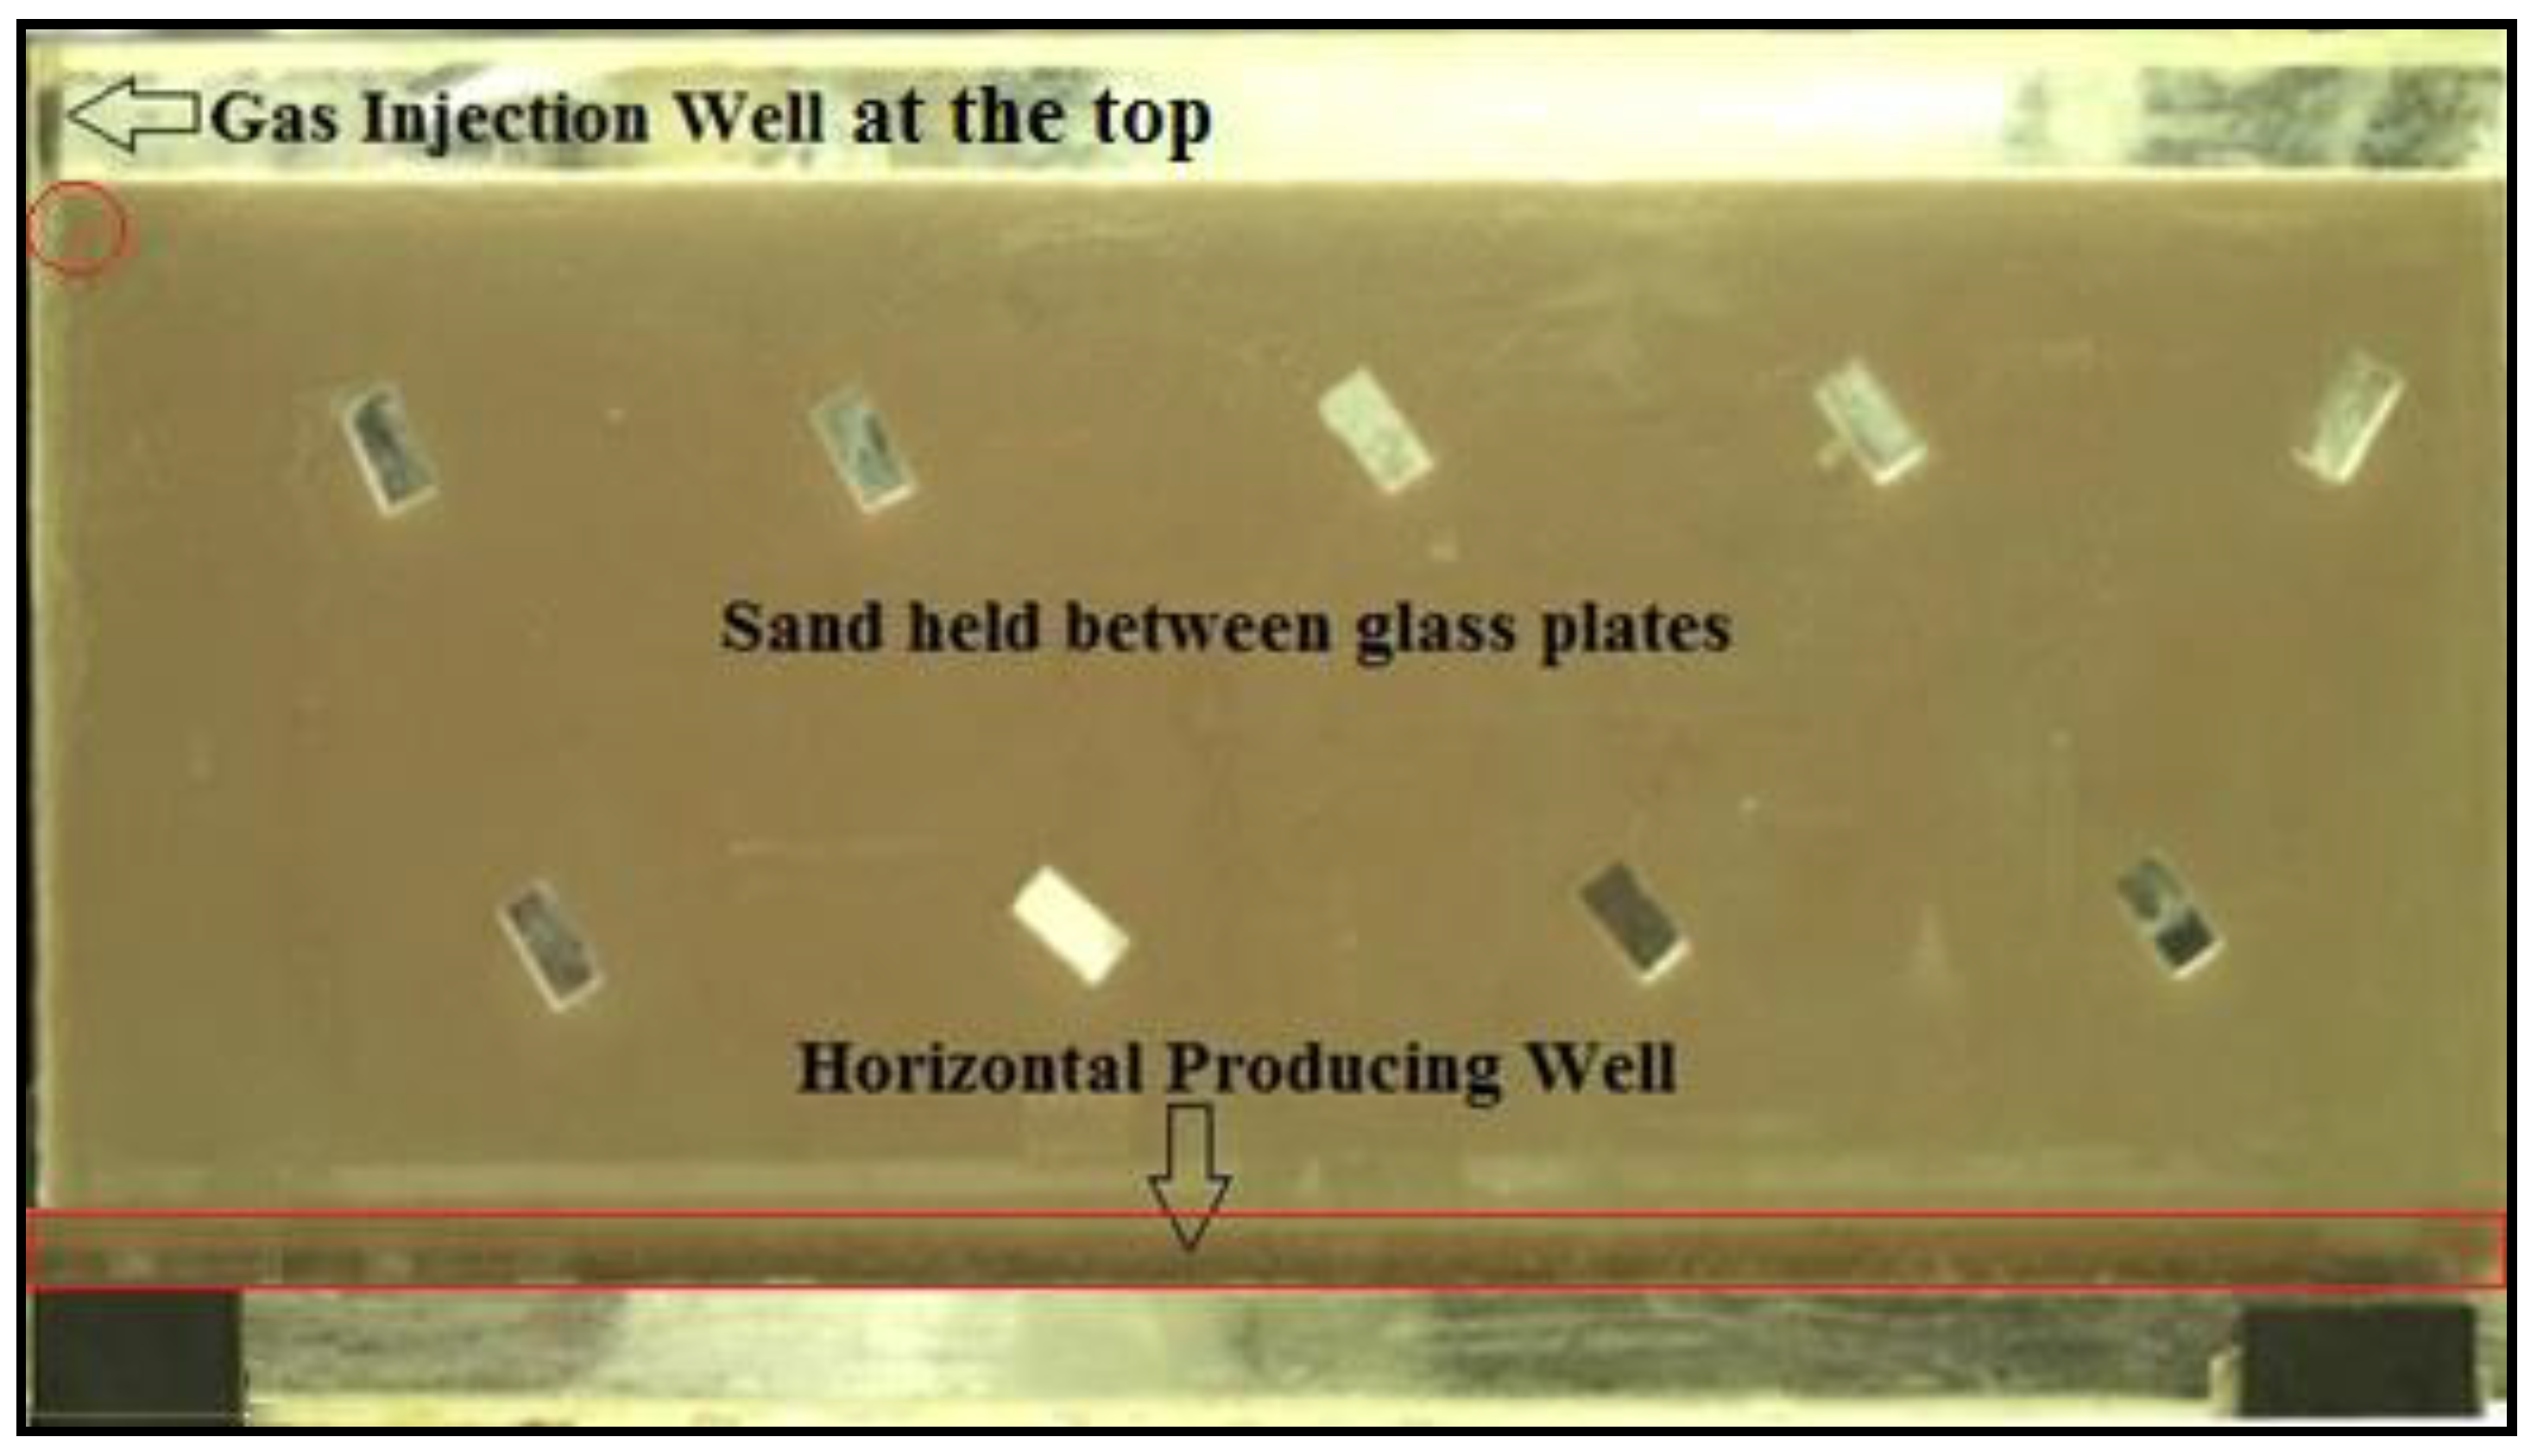
Firstly, conceptual validation of SW-GAGD process was undertaken using a sandpack glass model. Picture of a SW-GAGD sandpack model is shown in Figure 2. It has a horizontal producer spanning the entire width of the model and a single injector (top perforations) at the left top edge of the model.
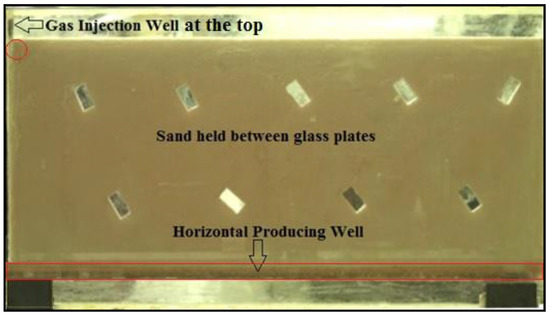
Figure 2.
Conceptual schematic of a SW-GAGD well configuration.
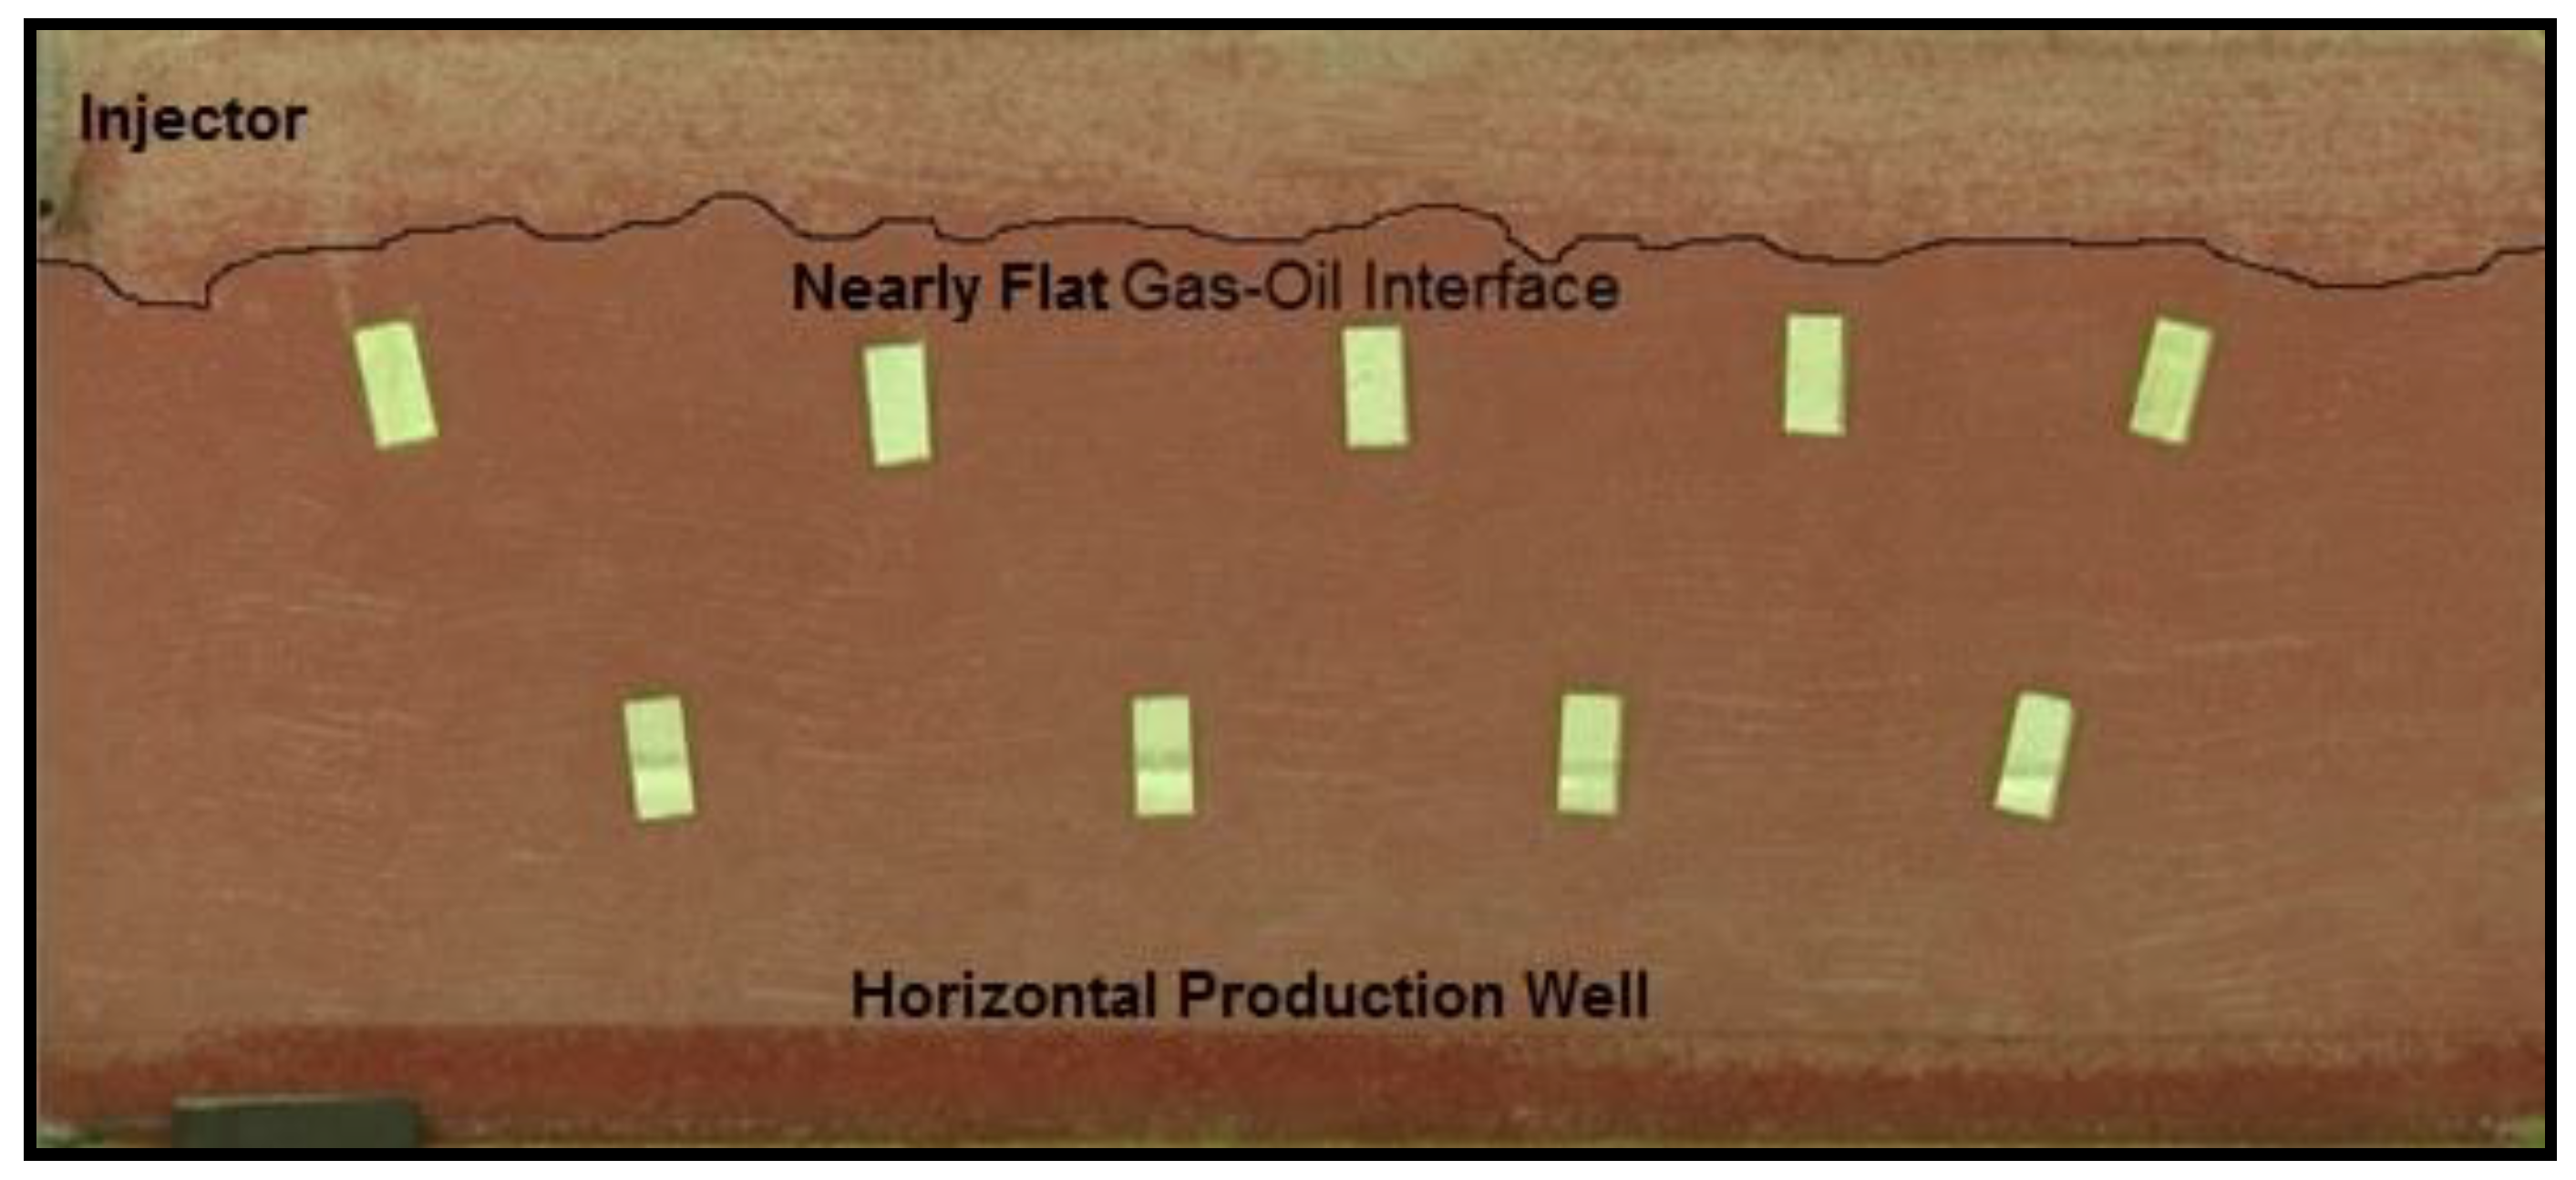
One of the main concerns with SW-GAGD configuration was the profile of the gas front as the gas is injected through the injection perforations. Short circuiting of the injected gas to the horizontal producer was highly suspected. This could have led to poorer sweep of the model volume, resulting in shelving of the concept itself. As was observed in Figure 3, these concerns were allayed, when instead of short-circuiting, the injected gas was observed to spread out horizontally to fill the entire model top, before starting a top-down displacement of the model volume. As shown the frontal profile was gravity stable and gas zone filled up the entire top of the model.
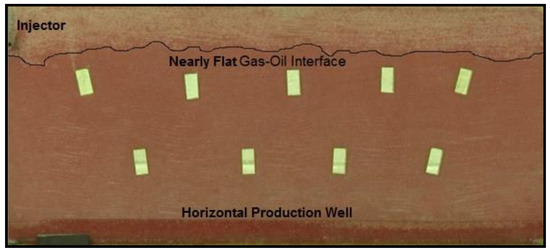
Figure 3.
Conceptual validation of SW-GAGD Process.
3.2. Effect of Rate on SW-GAGD Process
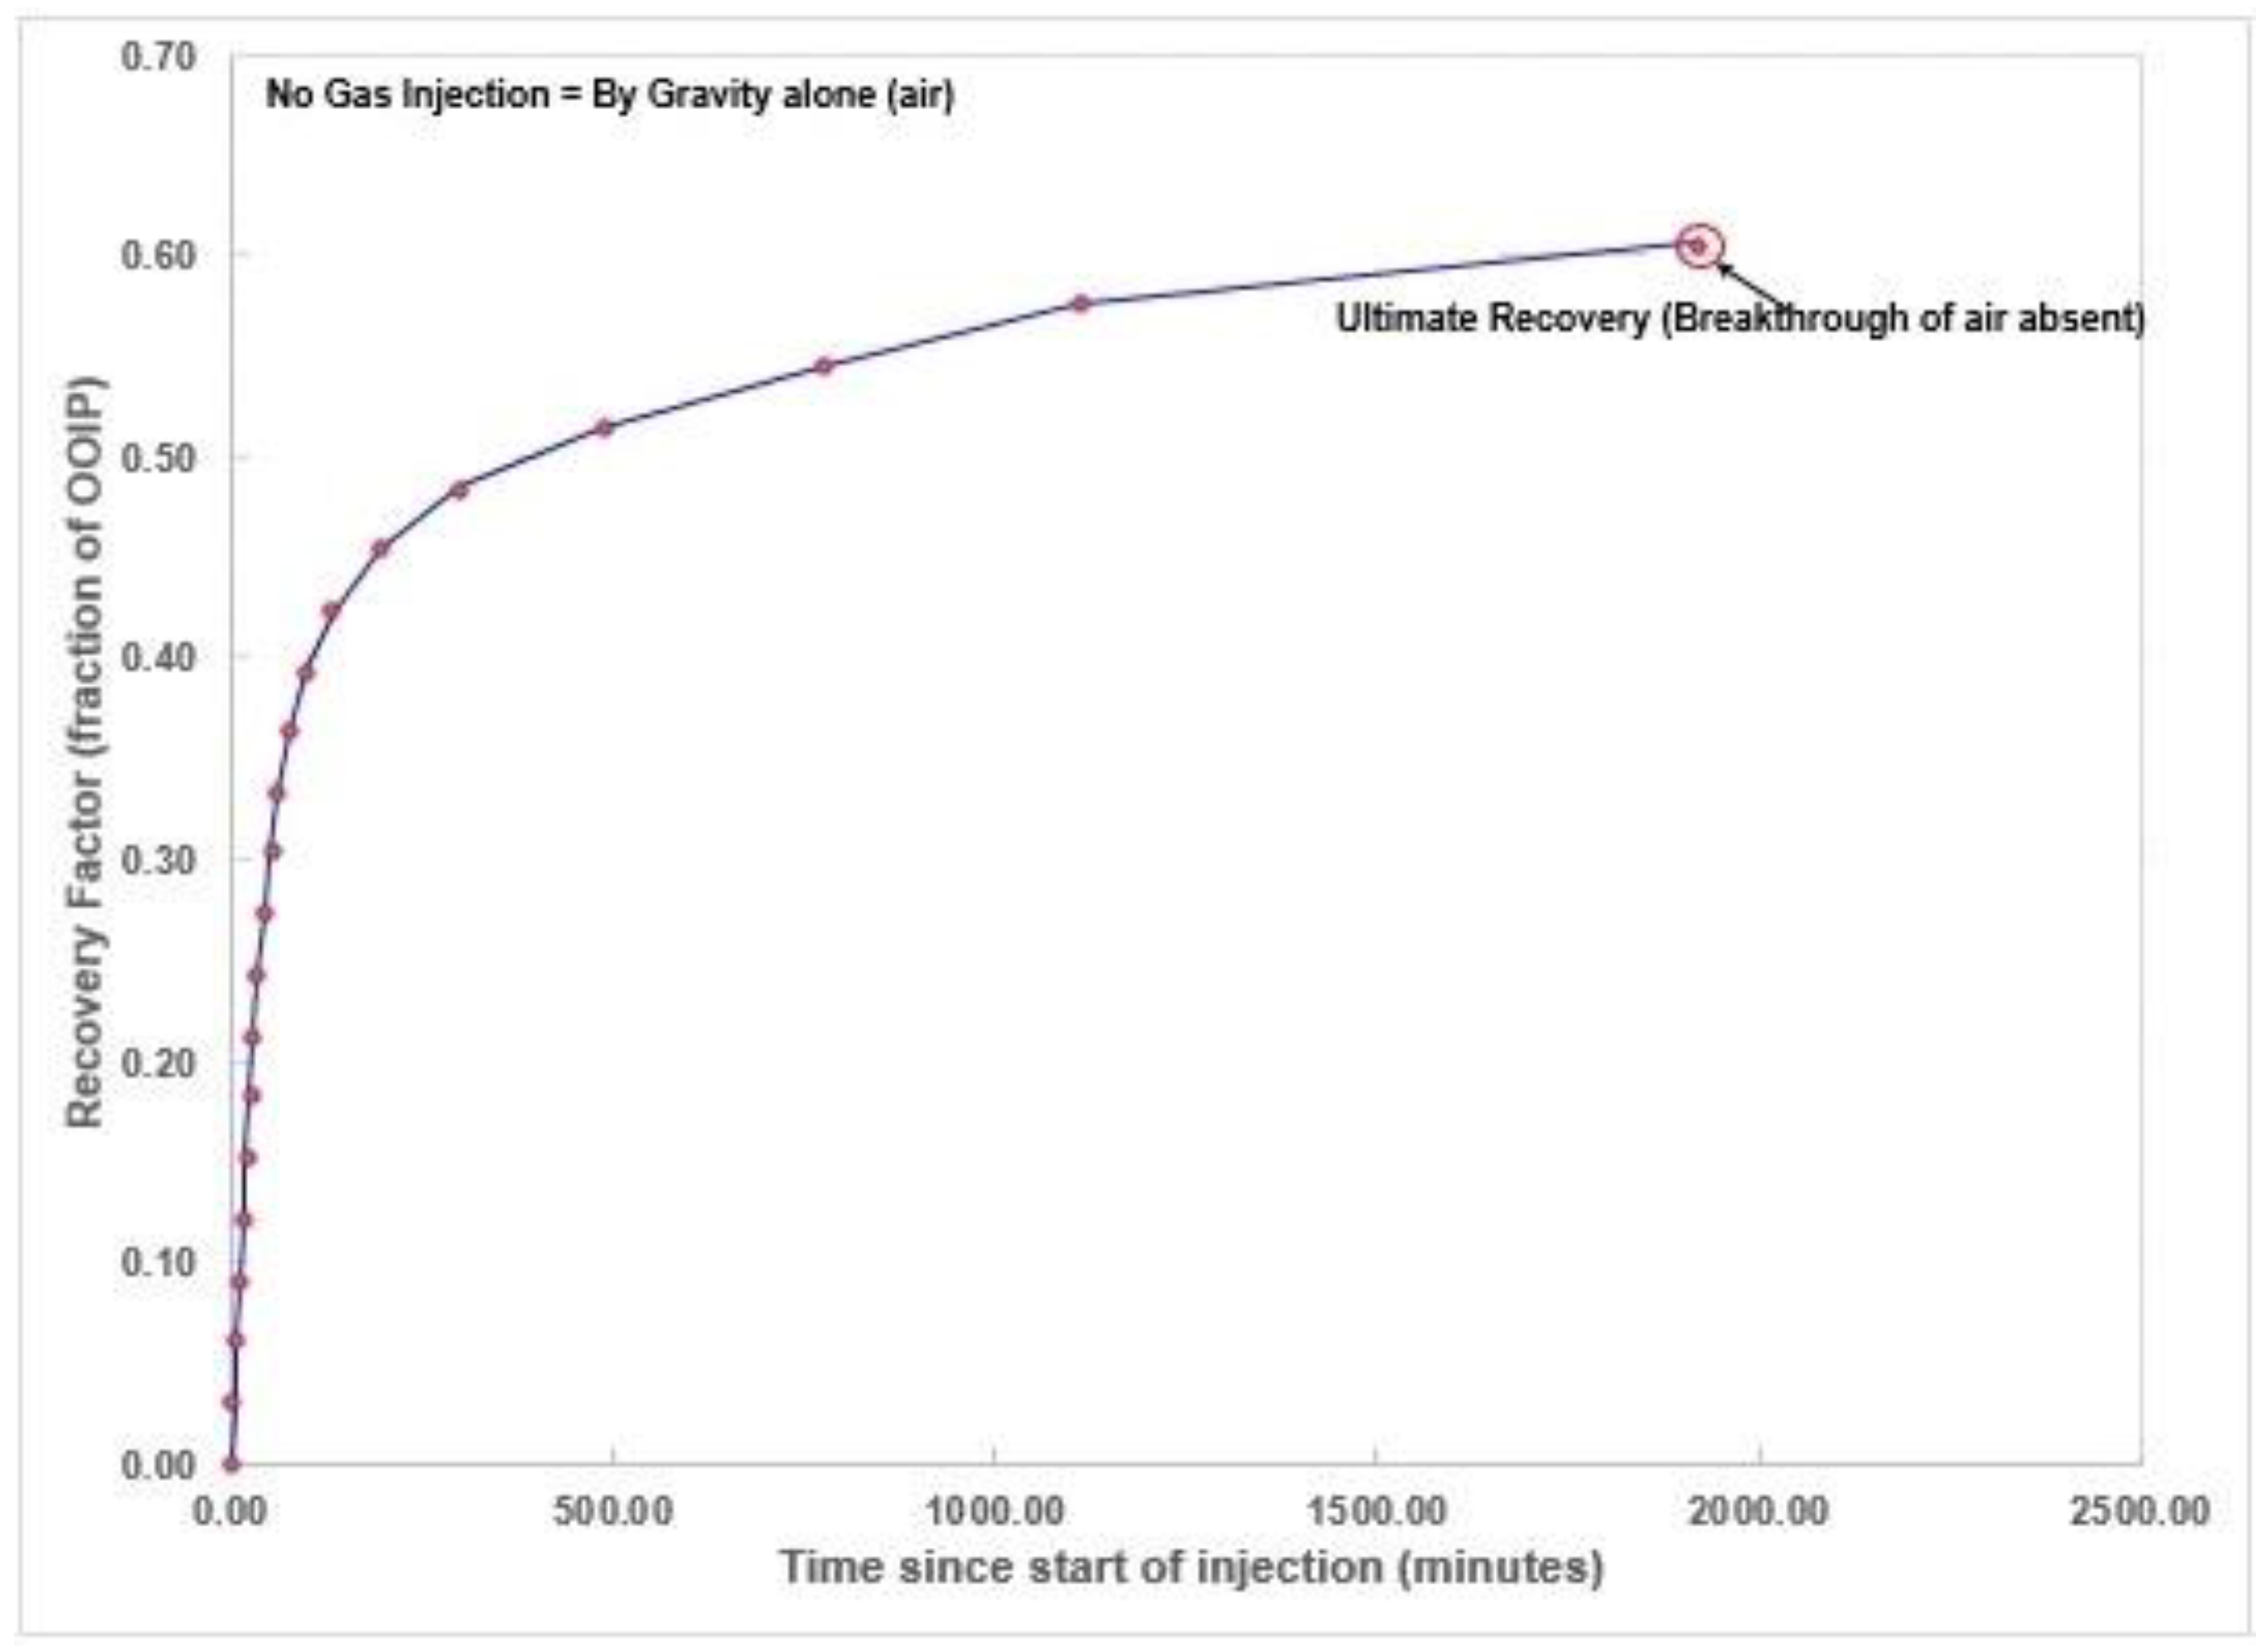
Injection rate is a critical operational parameter in maximizing the performance of recovery processes. Too high a rate is fraught with viscous instability and early breakthrough of the injected gas leading to poorer sweep and resultant low ultimate recoveries. At the same time, too low a rate could mean low production rates and subsequently lower cash inflow and net present value of the project. To understand the effect of injection rate on the SW-GAGD process, experimental runs were carried out in SW-GAGD model with five different gas injection rates, viz., 2.5, 5, 10, 15 and 20 SCCM. Nitrogen gas was chosen as the injectant since it was immiscible with decane, the oil phase used in the model. Recovery of the model was also evaluated when the production was simply due to gravity force alone, i.e., without any gas injection. Figure 4 shows this base case when the production was solely due to gravity drainage. As can be seen from Figure 4 the production rate gradually slowed down with time and the ultimate recovery was around 61%. Almost 39% of the original oil in place (OOIP) remained trapped within the model because of the capillary and frictional forces.
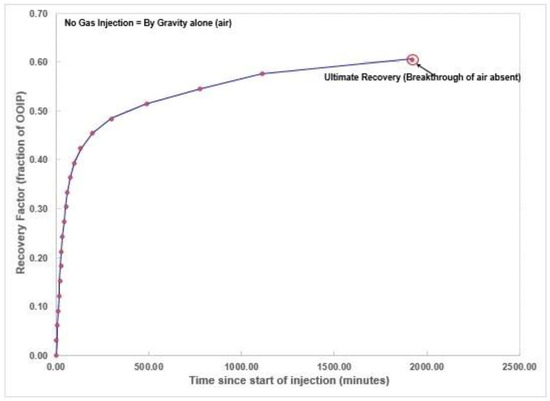
Figure 4.
Recovery plot by gravity drainage alone.
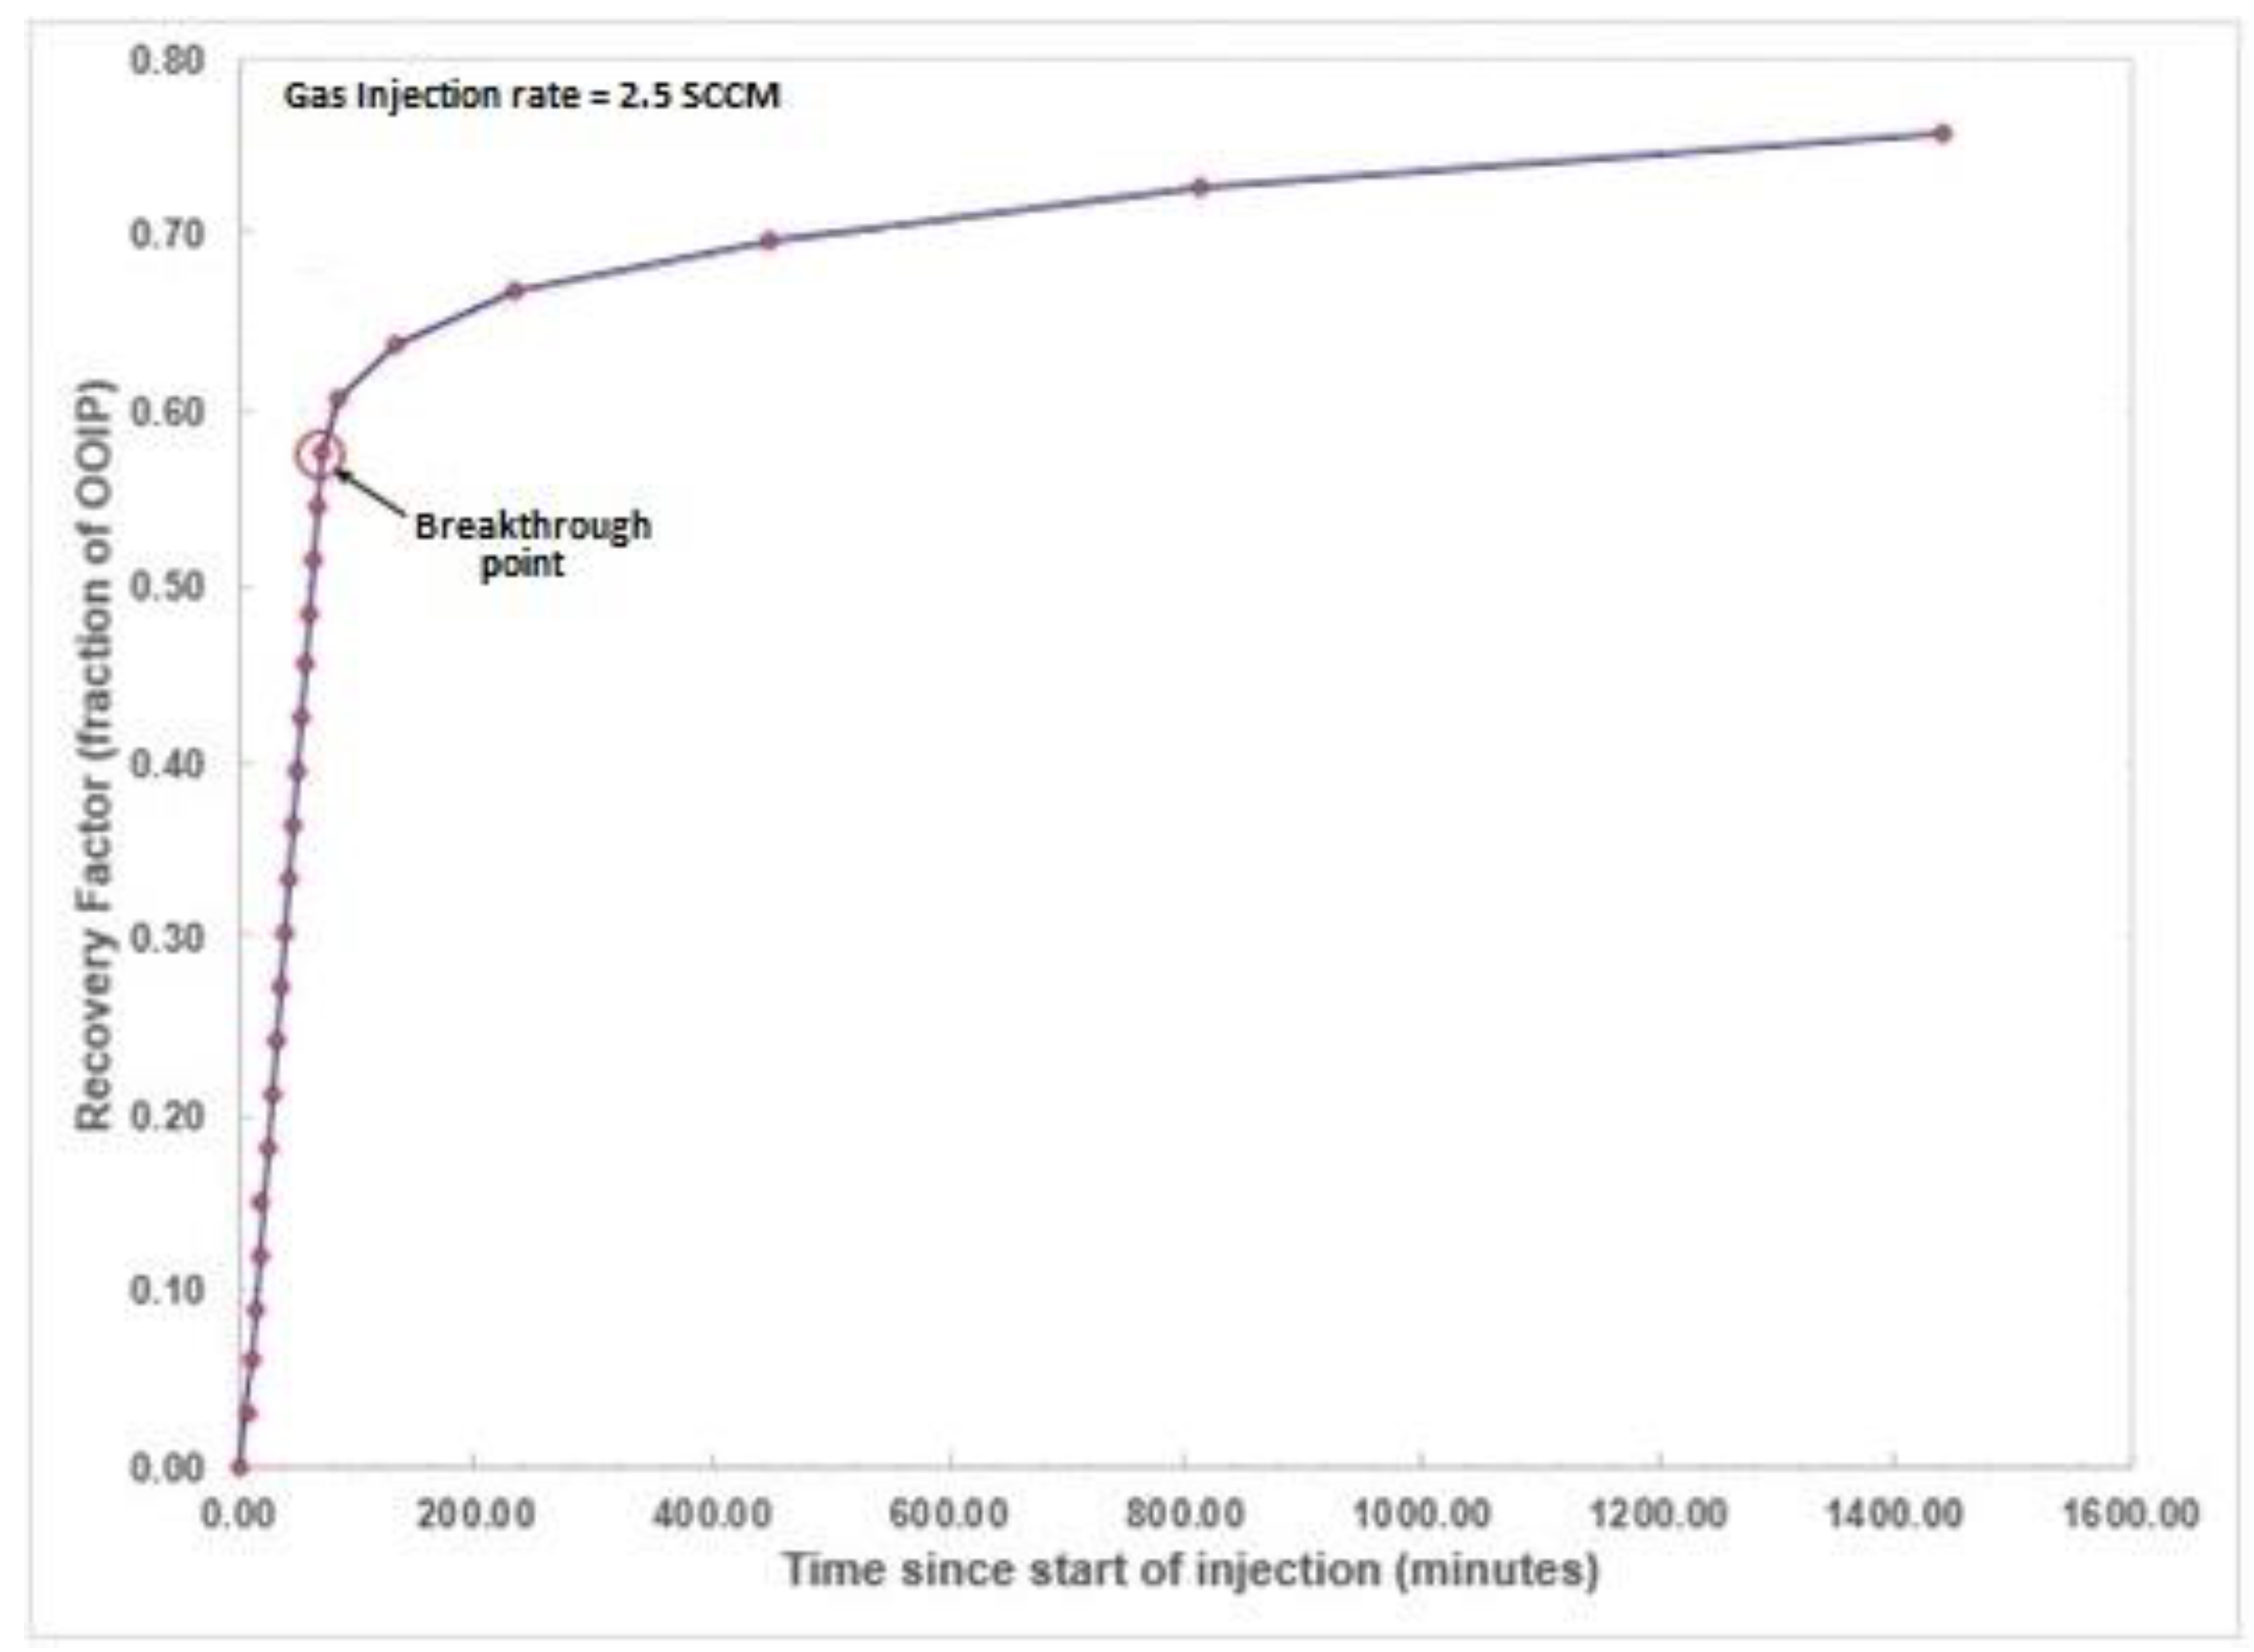
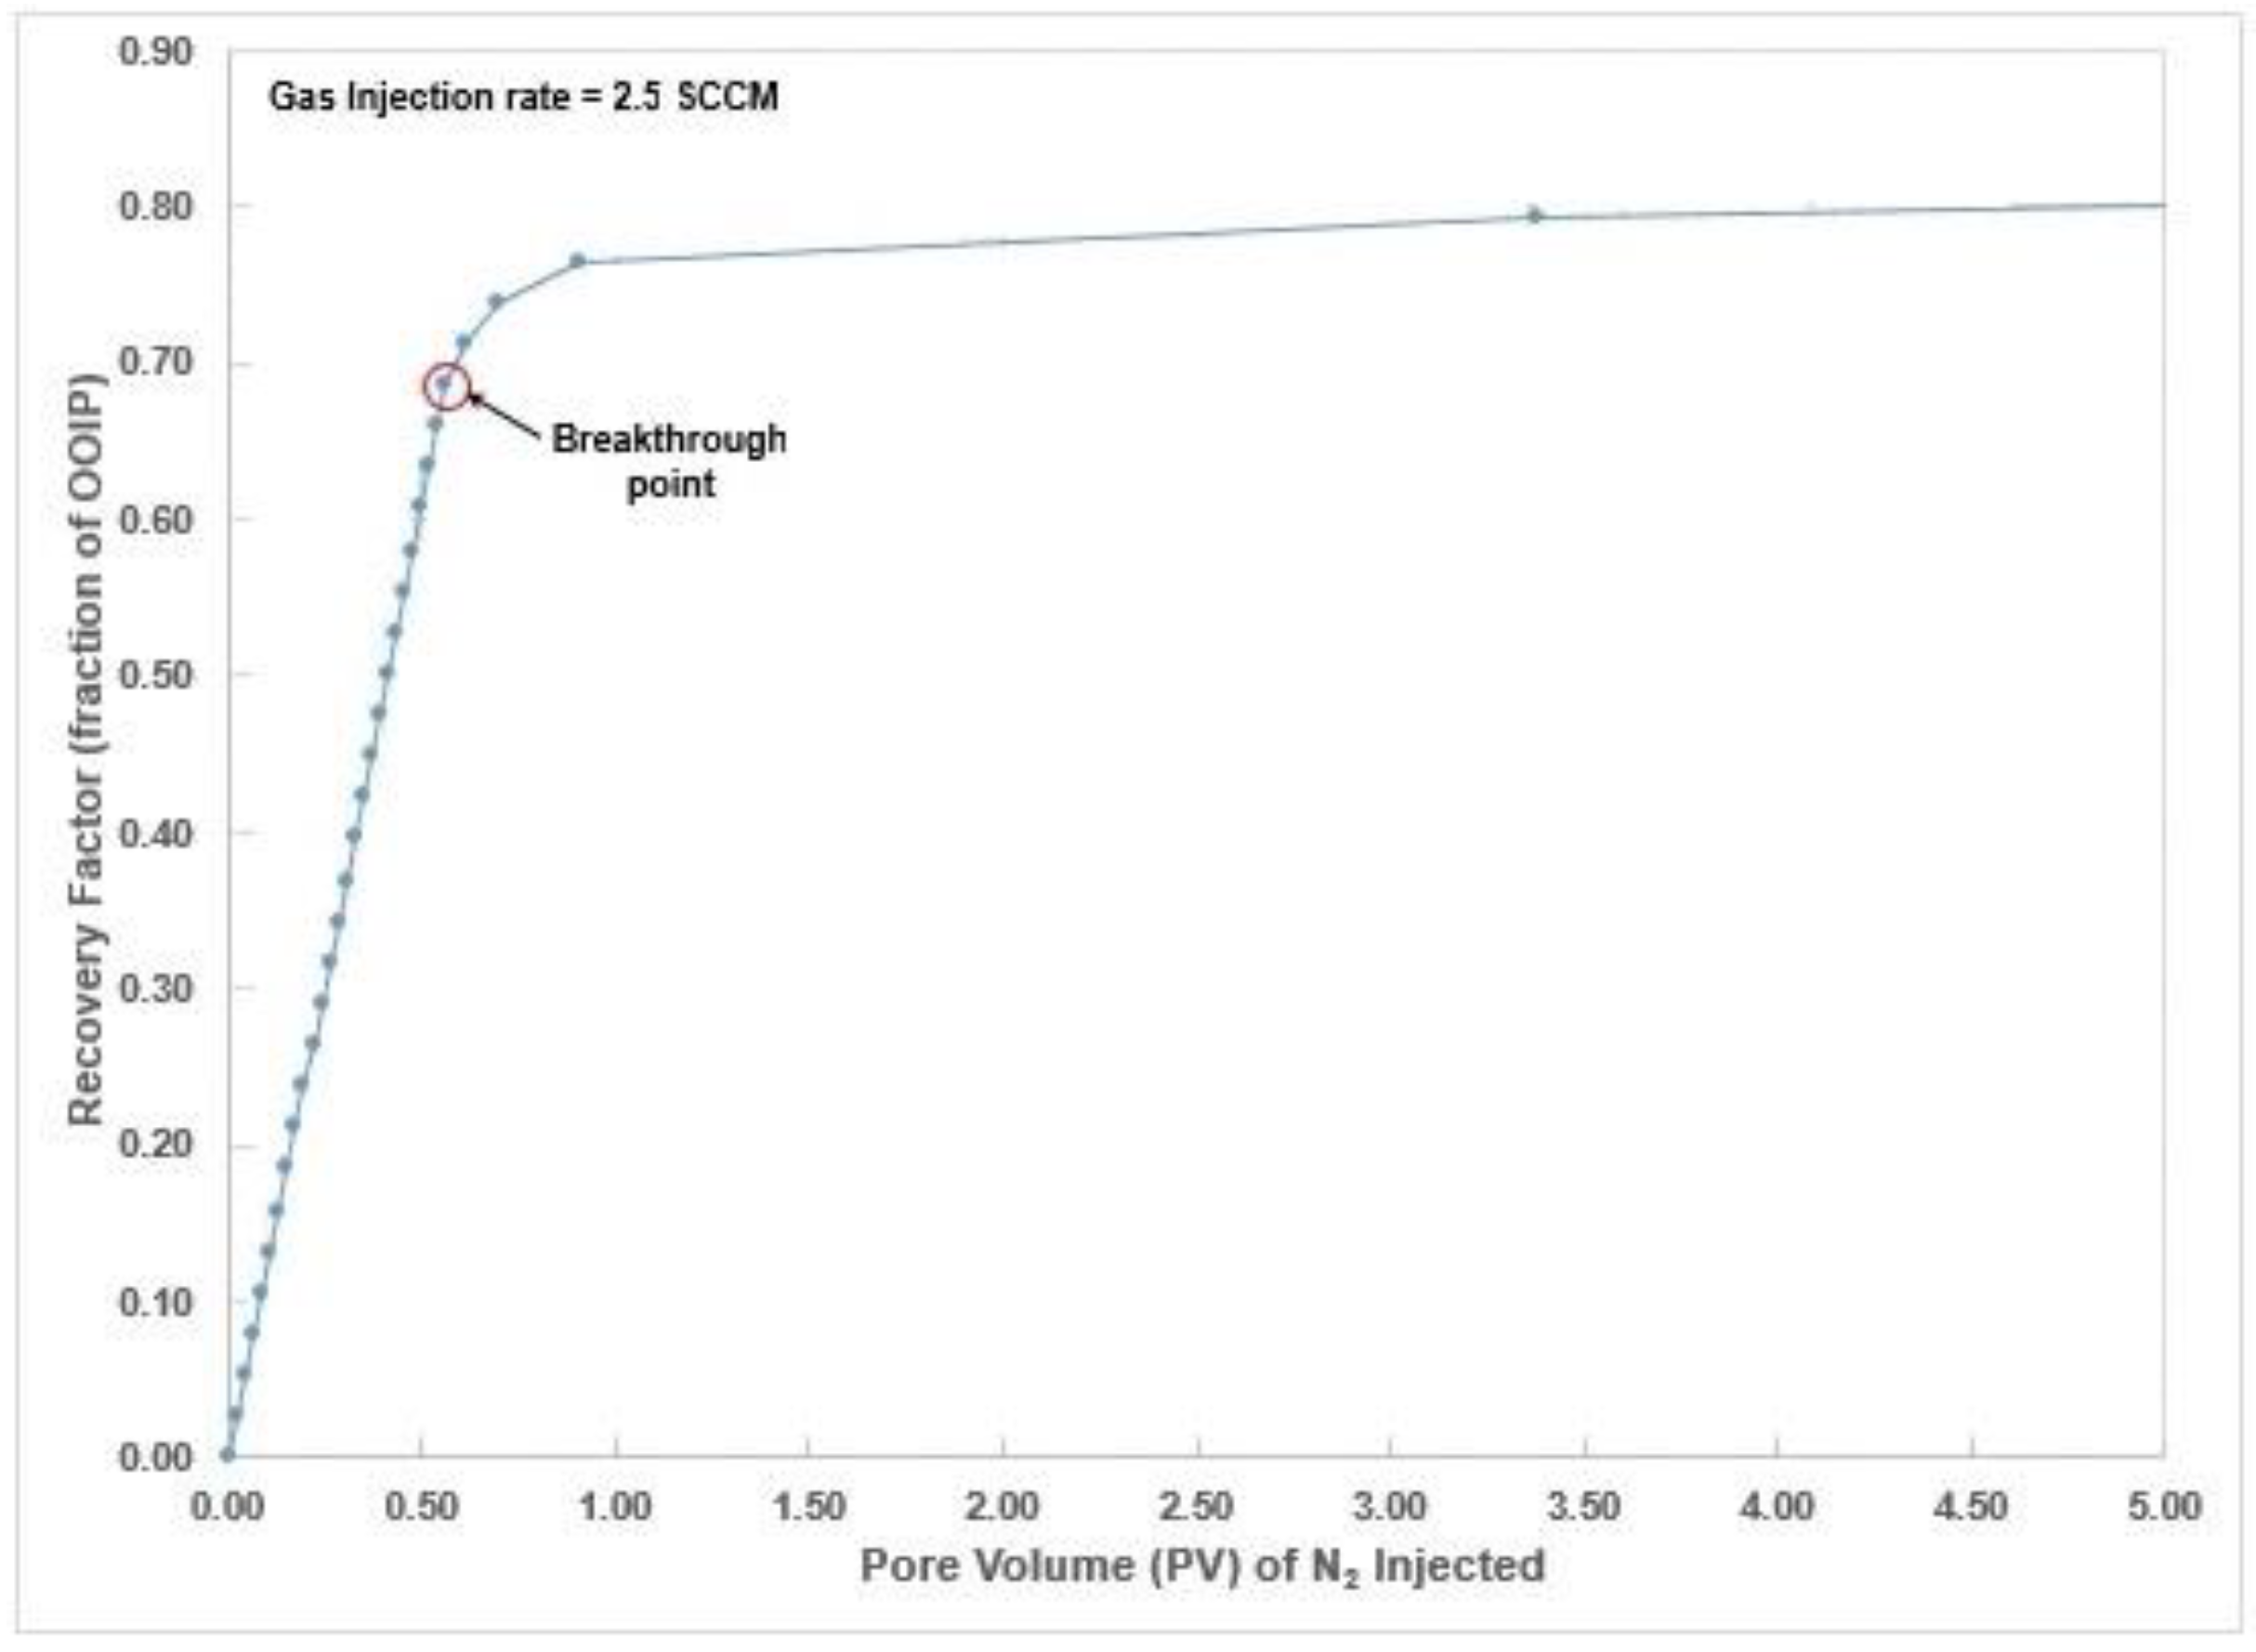
Figure 5 shows the corresponding recovery profile for a very low injection rate of 2.5 SCCM. Comparing Figure 4 for pure gravity drainage with that of Figure 5, it is immediately apparent that injection of gas significantly decreased the time needed to recover the ultimate recovery (UR) figure of the base case, i.e., 61% OOIP. Table 2 lists the time it took to reach UR of 61% OOIP for the base case and that with injection rates of 2.5 and 20 SCCM.
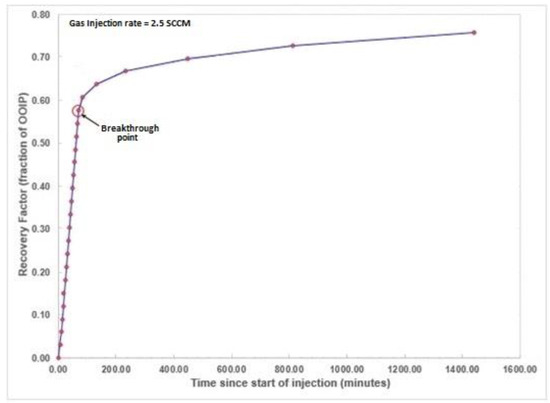
Figure 5.
Recovery plot for a gas injection rate of 2.5 SCCM.
Table 2.
Time to reach 61% (Ultimate recovery with pure gravity drainage) recovery factor.
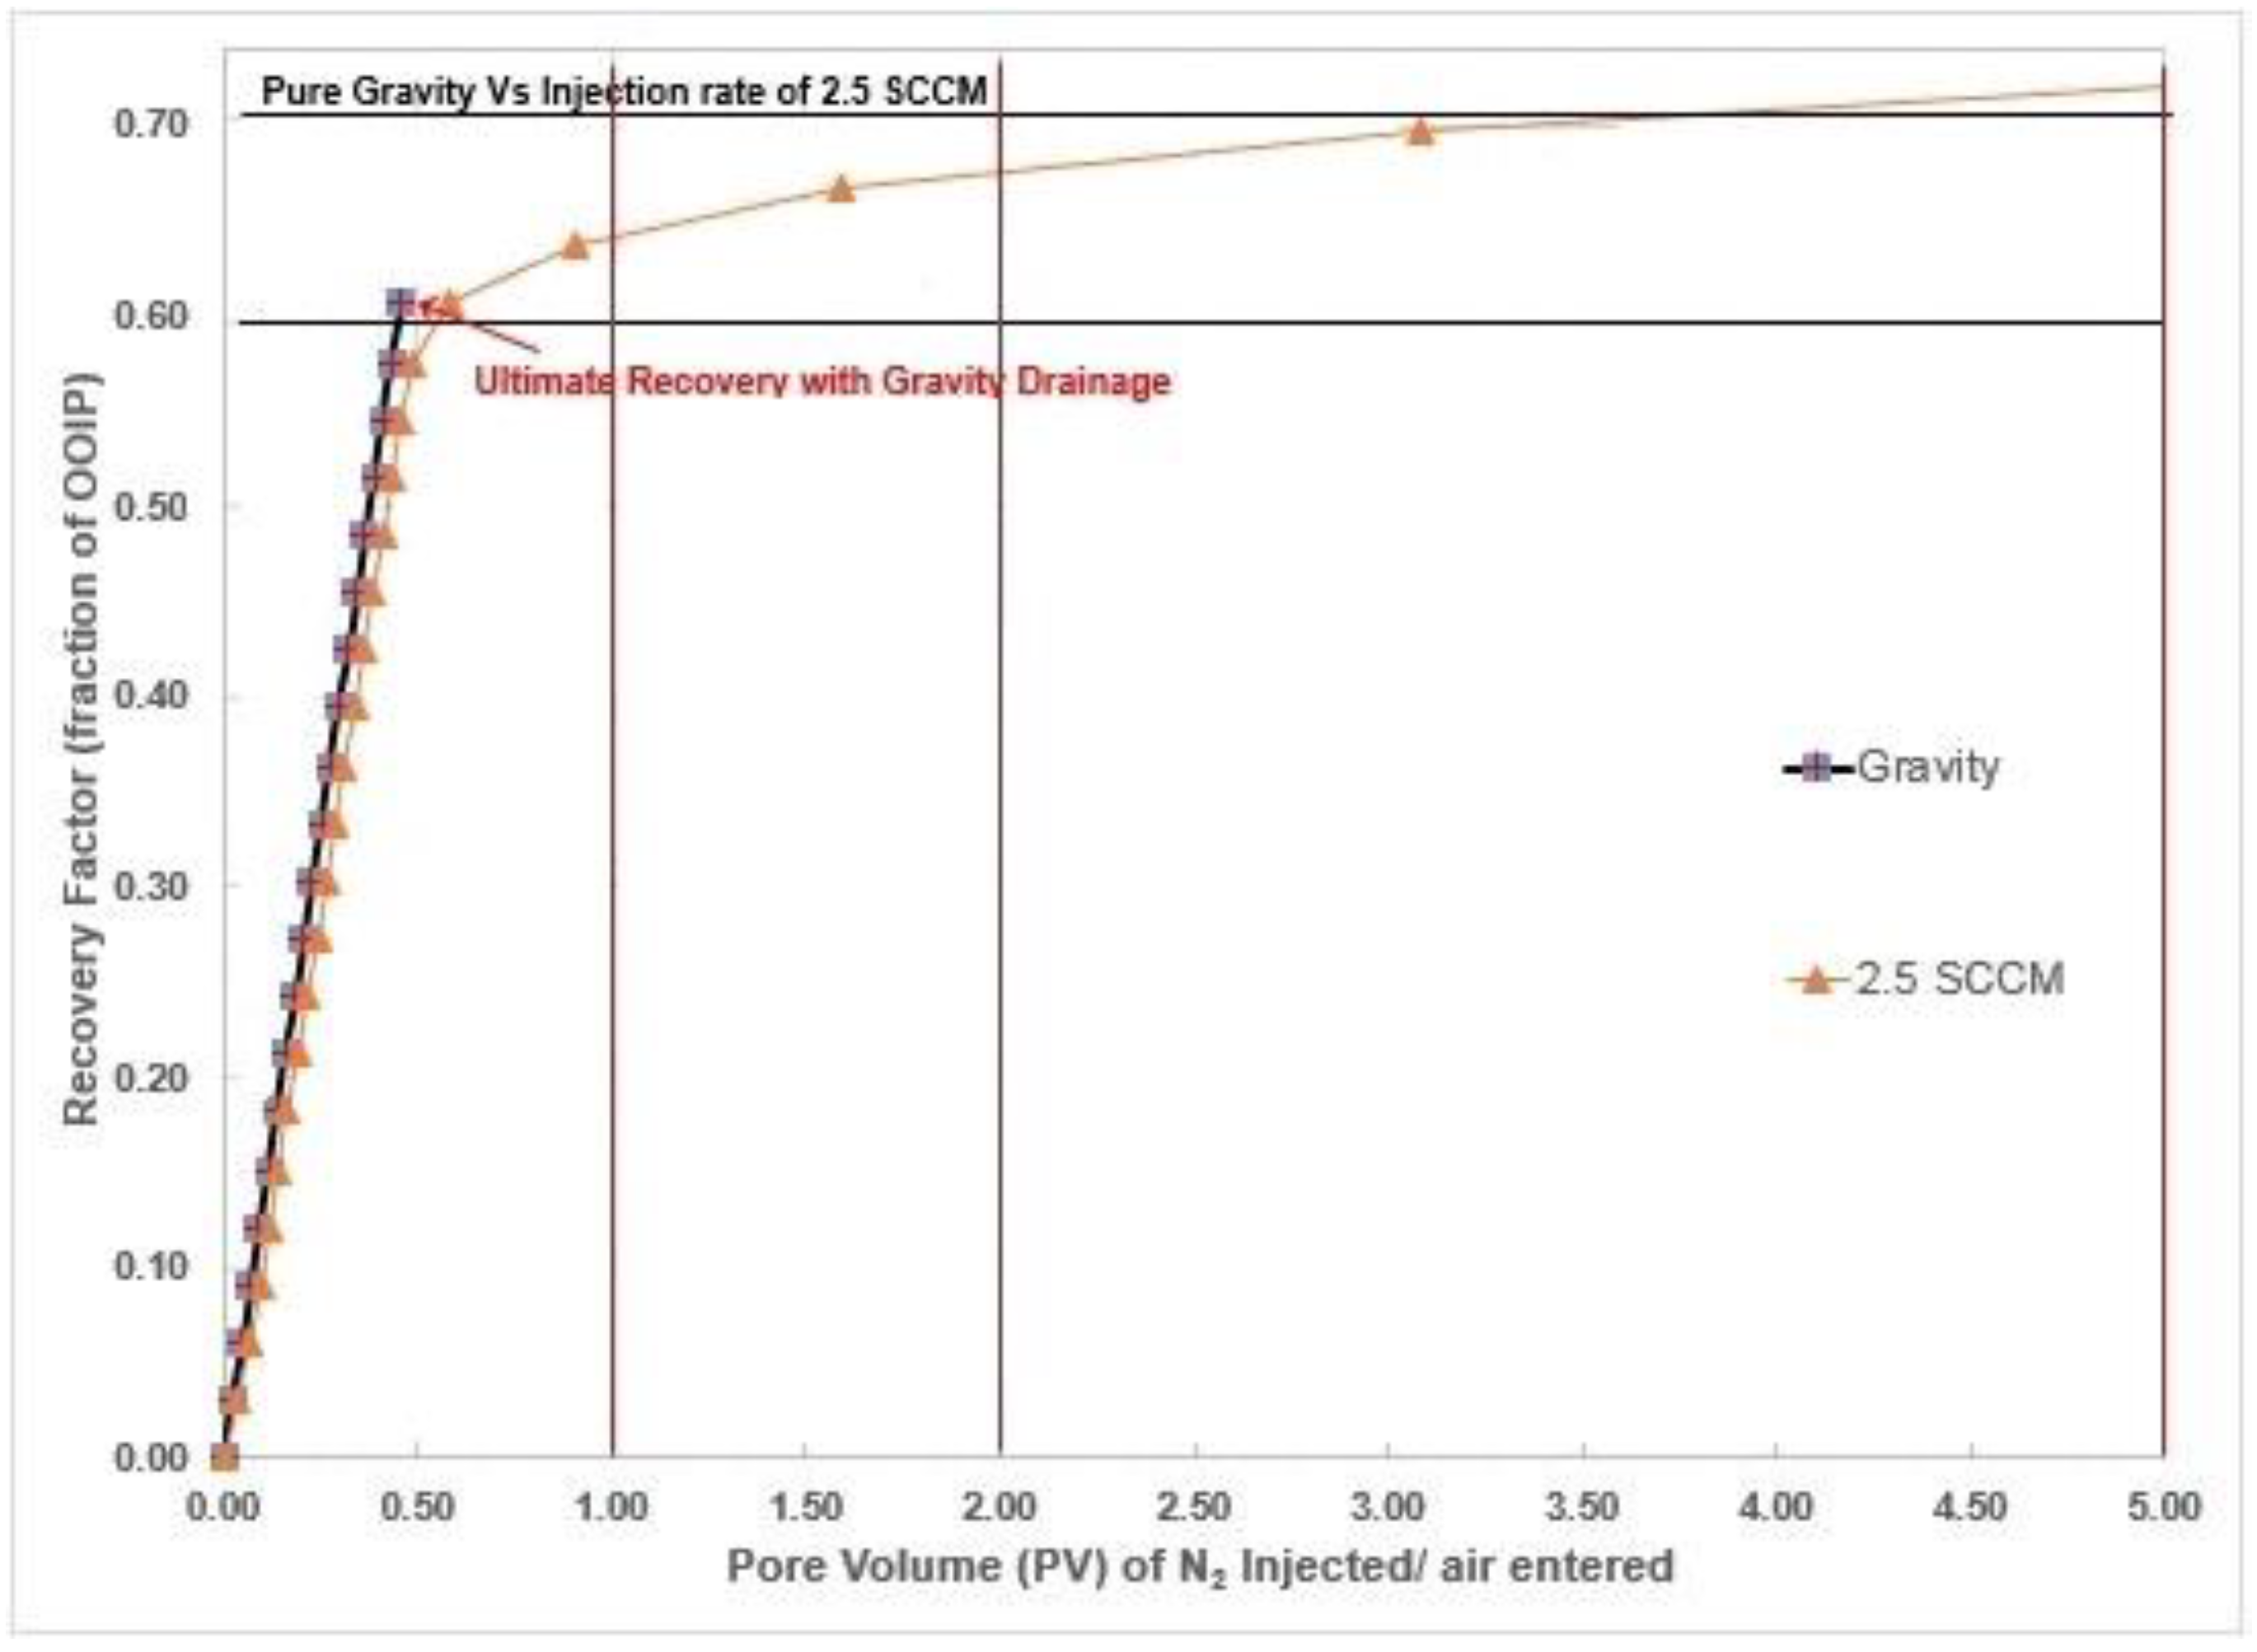
Gravity drainage is known to be one of the most efficient recovery methods and the only drawback with natural gravity drainage process is the speed of such a process [15,16,17,18]. By the injection of gas, not only did we remove this inherent limitation, but we also increased the recovery factor. The increase in the recovery factor can be gauged referring to Figure 6.

Figure 6.
Comparing Pure Gravity Drainage with 2.5 SCCM of Gas Injection.
As can be seen from Figure 6, just by having an injection rate of 2.5 SCCM, the recovery at 1 PV of gas injection exceeds the ultimate recovery associated with pure gravity drainage by 3% OOIP and that goes up to 5.5% at 2 PV of gas injection. The ultimate recovery (at 5 PV) gas injection was 11%. The additional recovery with gas injection is because of overcoming of capillary and frictional forces by the injected gas. As stated earlier, the rate of recovery plays an important factor determining the economics associated with the production of hydrocarbons. Without high enough production rates, the most efficient recovery method will not be economically sustainable.
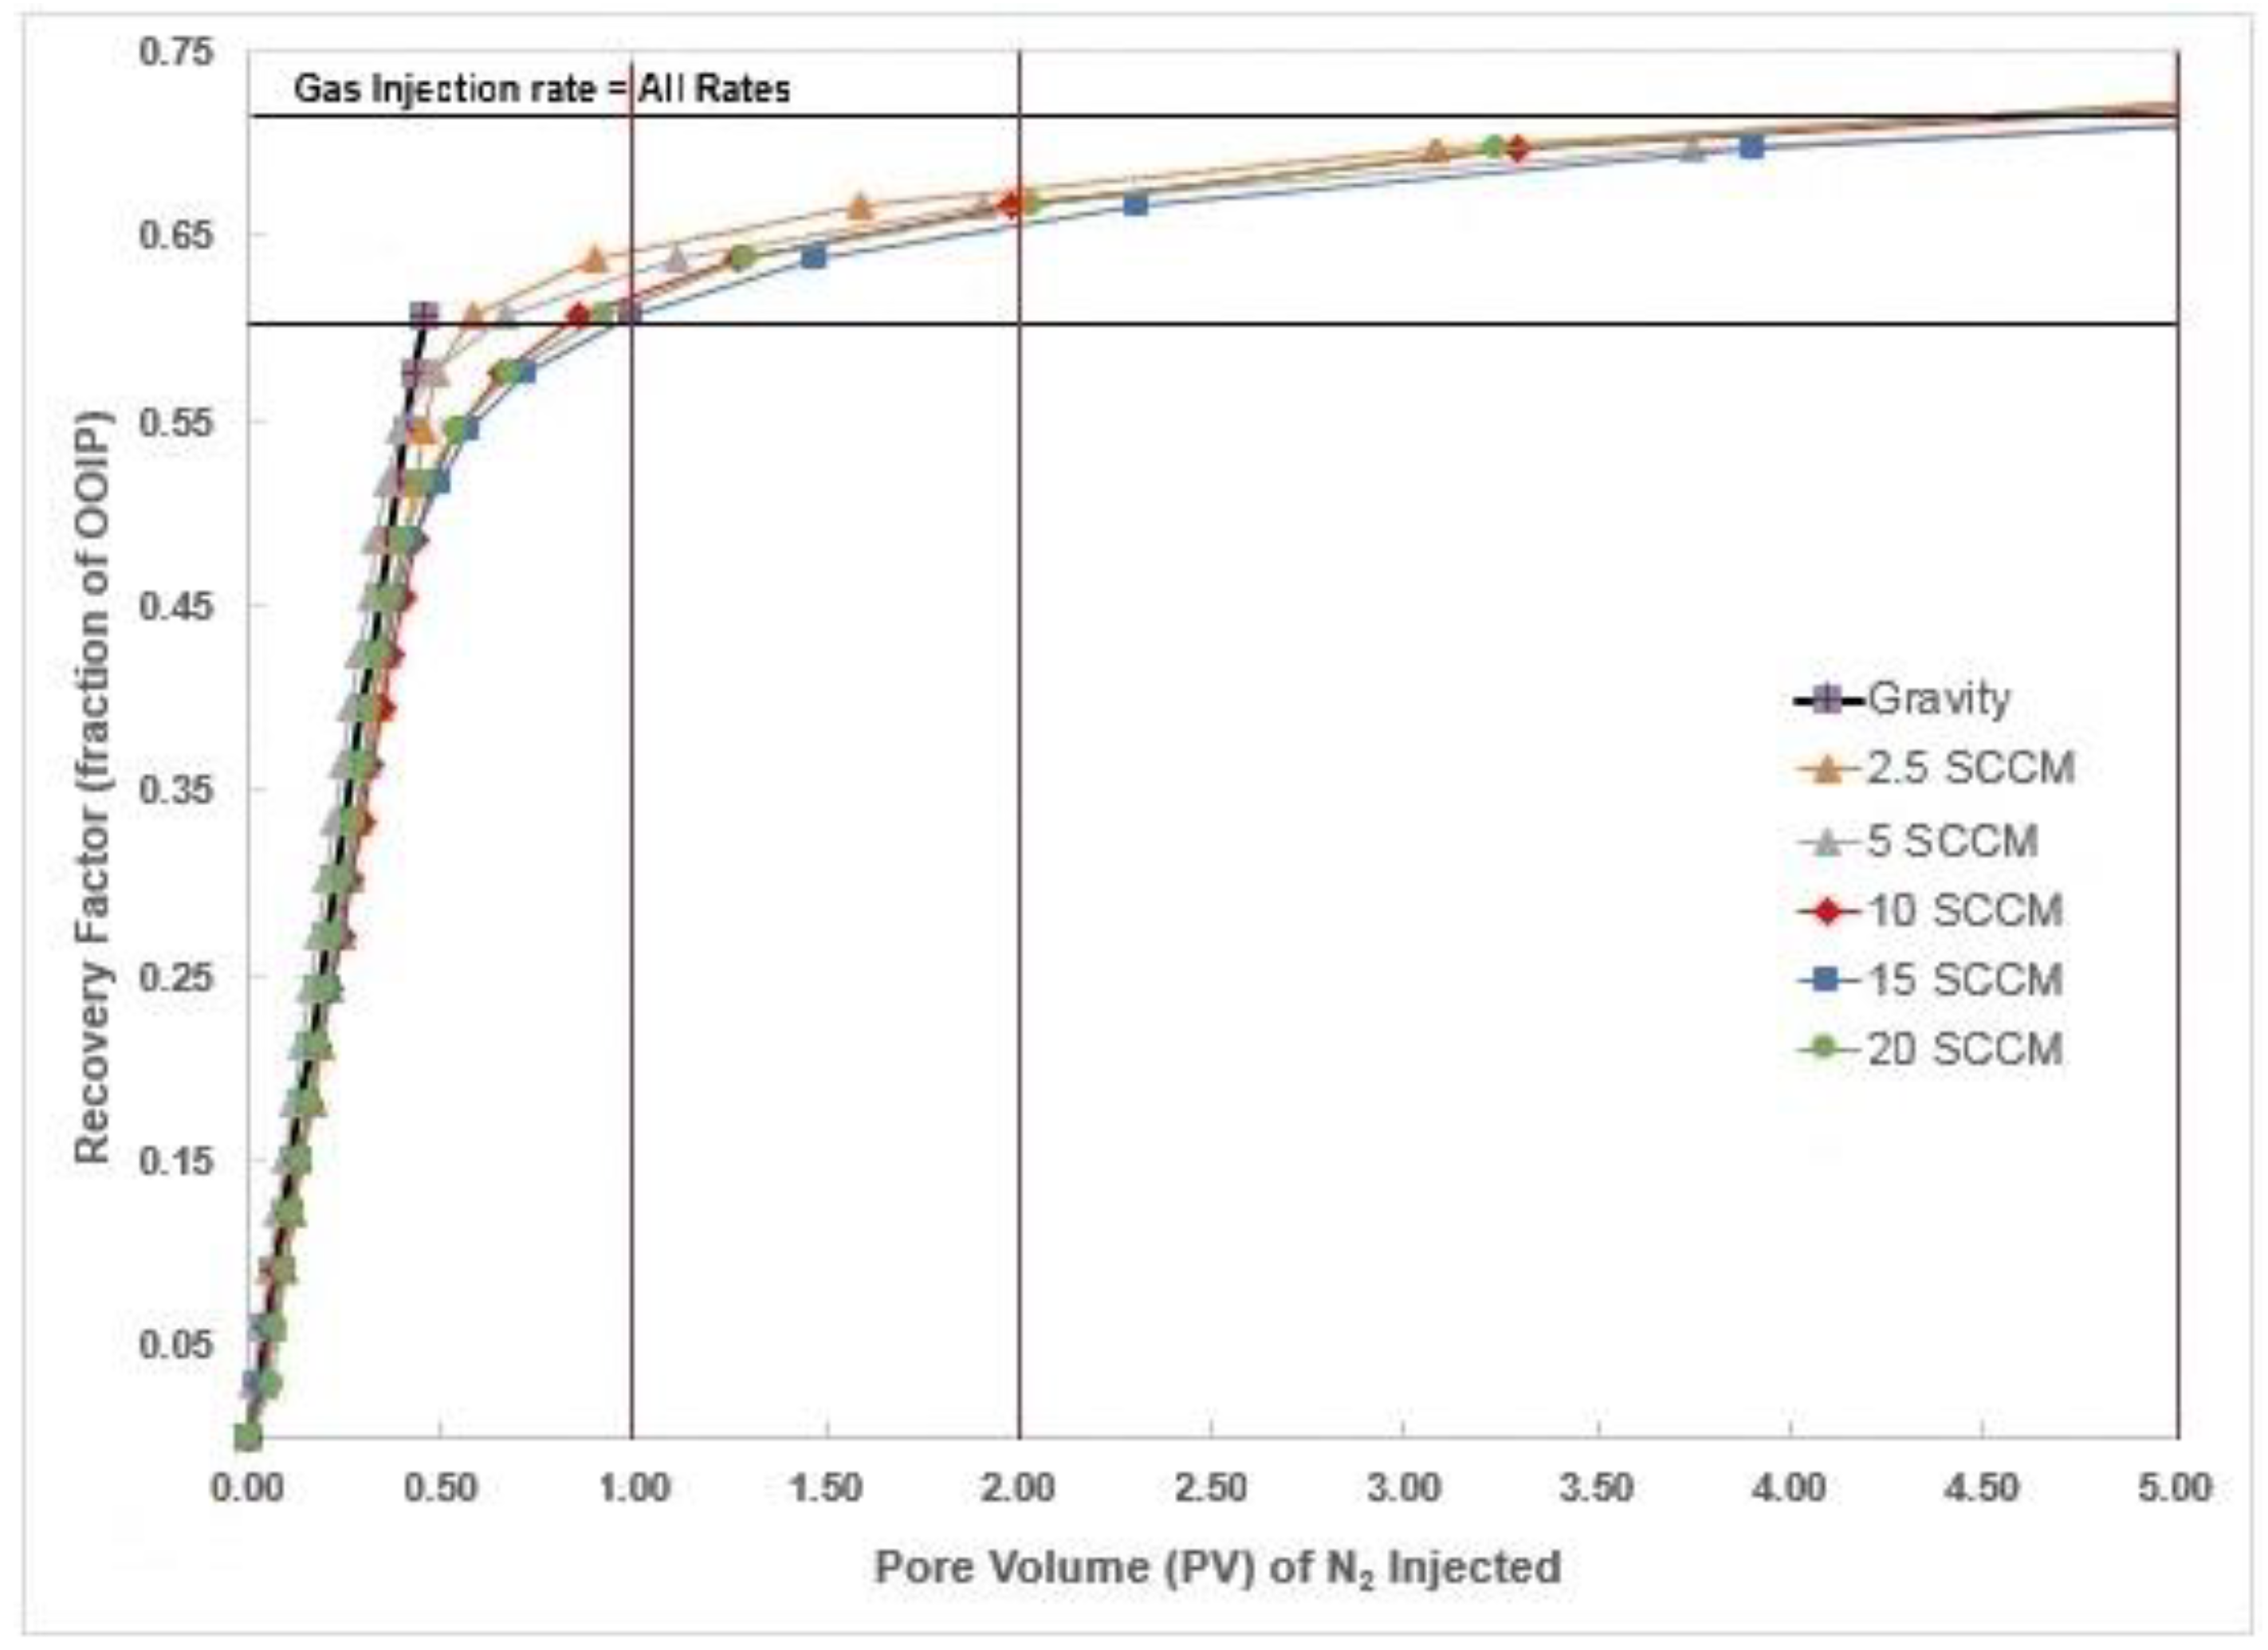
Figure 7 compares recovery factor at different rates, viz. 2.5, 5, 10, 15, and 20 SCCM, including that of pure gravity drainage. Considering the amount of time required to get to the ultimate recovery factor of 61% for pure gravity drainage, it can be seen that it takes much shorter time to reach the same recovery factor in case of forced gravity drainage SW-GAGD process. As listed in Table 2 above time taken in case of 2.5 SCCM is 23 times faster than pure gravity drainage and that in case of 20 SCCM injection rate is 93 times faster. Thus gas injection imparts significant rate enhancement to the gravity drainage process. At this point, the question that arises is—“whether higher injection rates are better than lower injection rates?” Not always! Of course, we get a tremendous enhancement in rates with higher injection rates but the recovery factor gets negatively impacted. As can be seen in Figure 7, the recovery factor at 1 PV injected is higher in case of lower rates than higher rates. Between the rates 2.5 SCCM and 20 SCCM it’s around 4% OOIP at 1 PV injected gas. The recovery factor is observed to improve at higher PVs injected for the higher rates, for example, at 5 PV injected the difference in recovery factor almost vanishes.
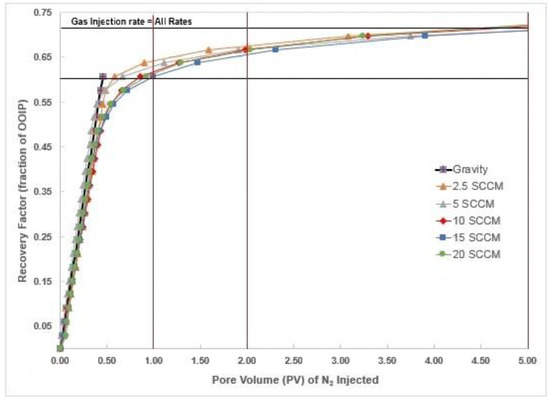
Figure 7.
Recovery Factor vs. PV Injected for all rate.
The reason we have lower recovery factor at 1 PV of gas injection in case of higher rates is because of early arrival of gas-oil displacement front at the production well. There is a sharp discontinuity in the rates of production before and after the arrival of the gas-oil displacement front at the production well. Before the arrival of gas-oil front at the production well, the production is primarily due to displacement at the gas-oil interface. Post arrival of the gas-oil interface at the production well, there is no clear displacement front and the production continues through the interplay of forces of gravity, capillary and inertial. The oil continues to drain to the bottom of the model due to gravity, aided by film flow. As it drains, it tries to connect to other aggregates of left out oil so as to form a continuous layer of oil in the already swept out region. Breakthrough of injected gas at the production well however does not necessarily coincide with the sharp decline in production rates. This is more pronounced in case of higher rates.
3.3. Comparison with Conventional GAGD Process
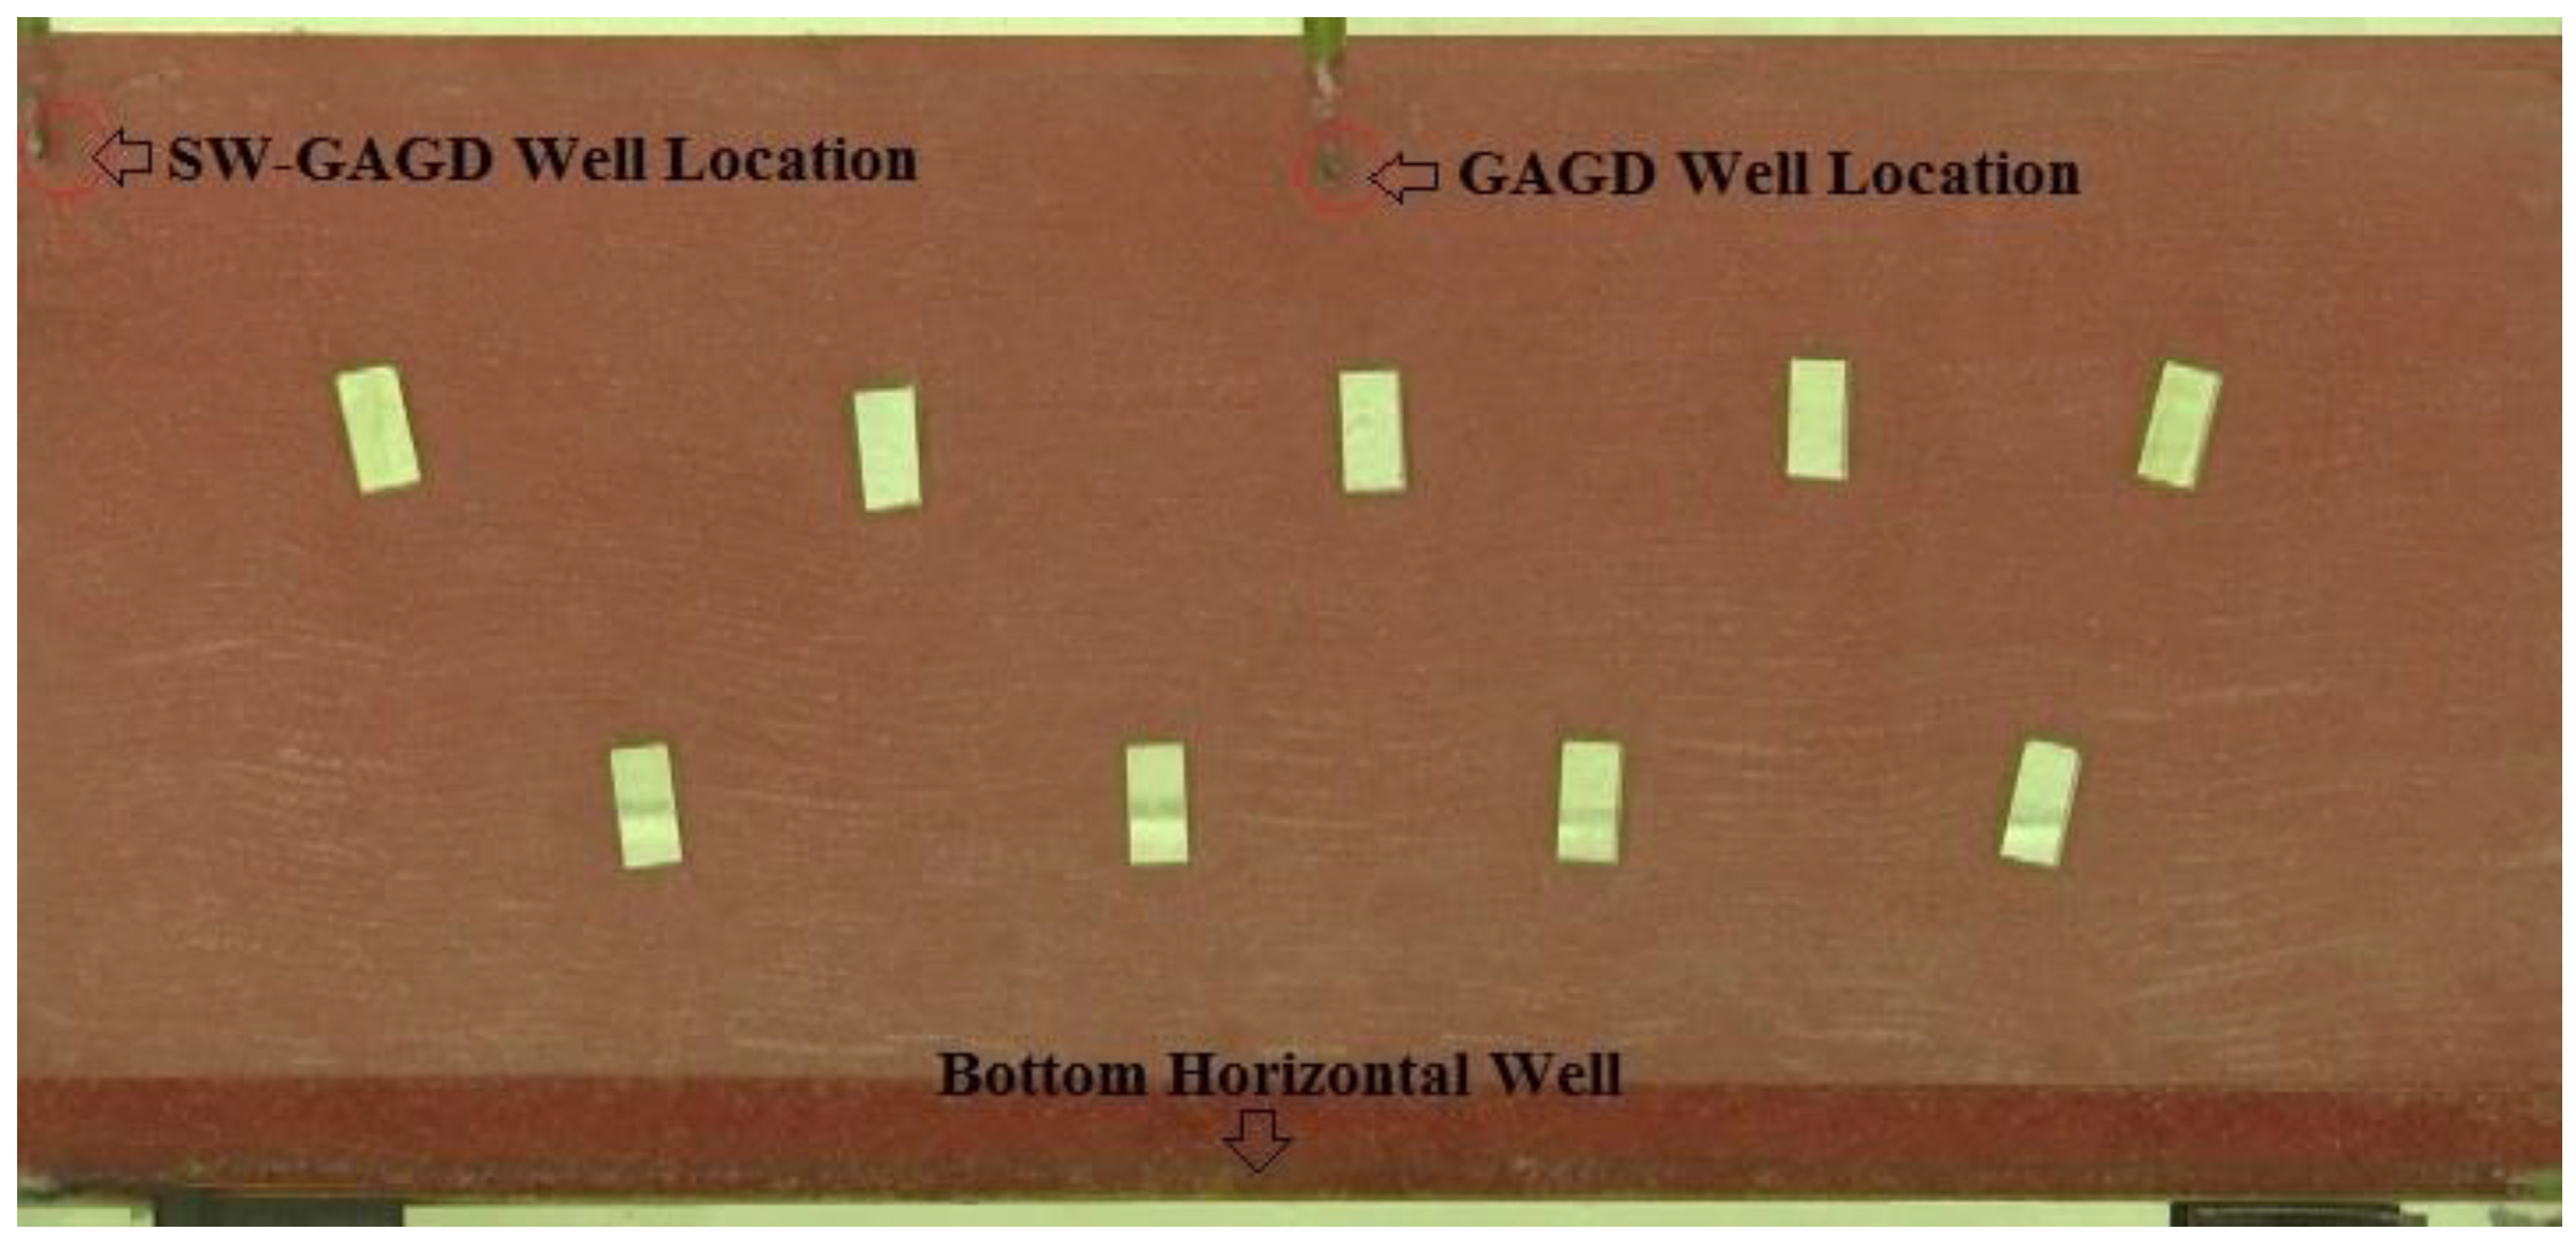
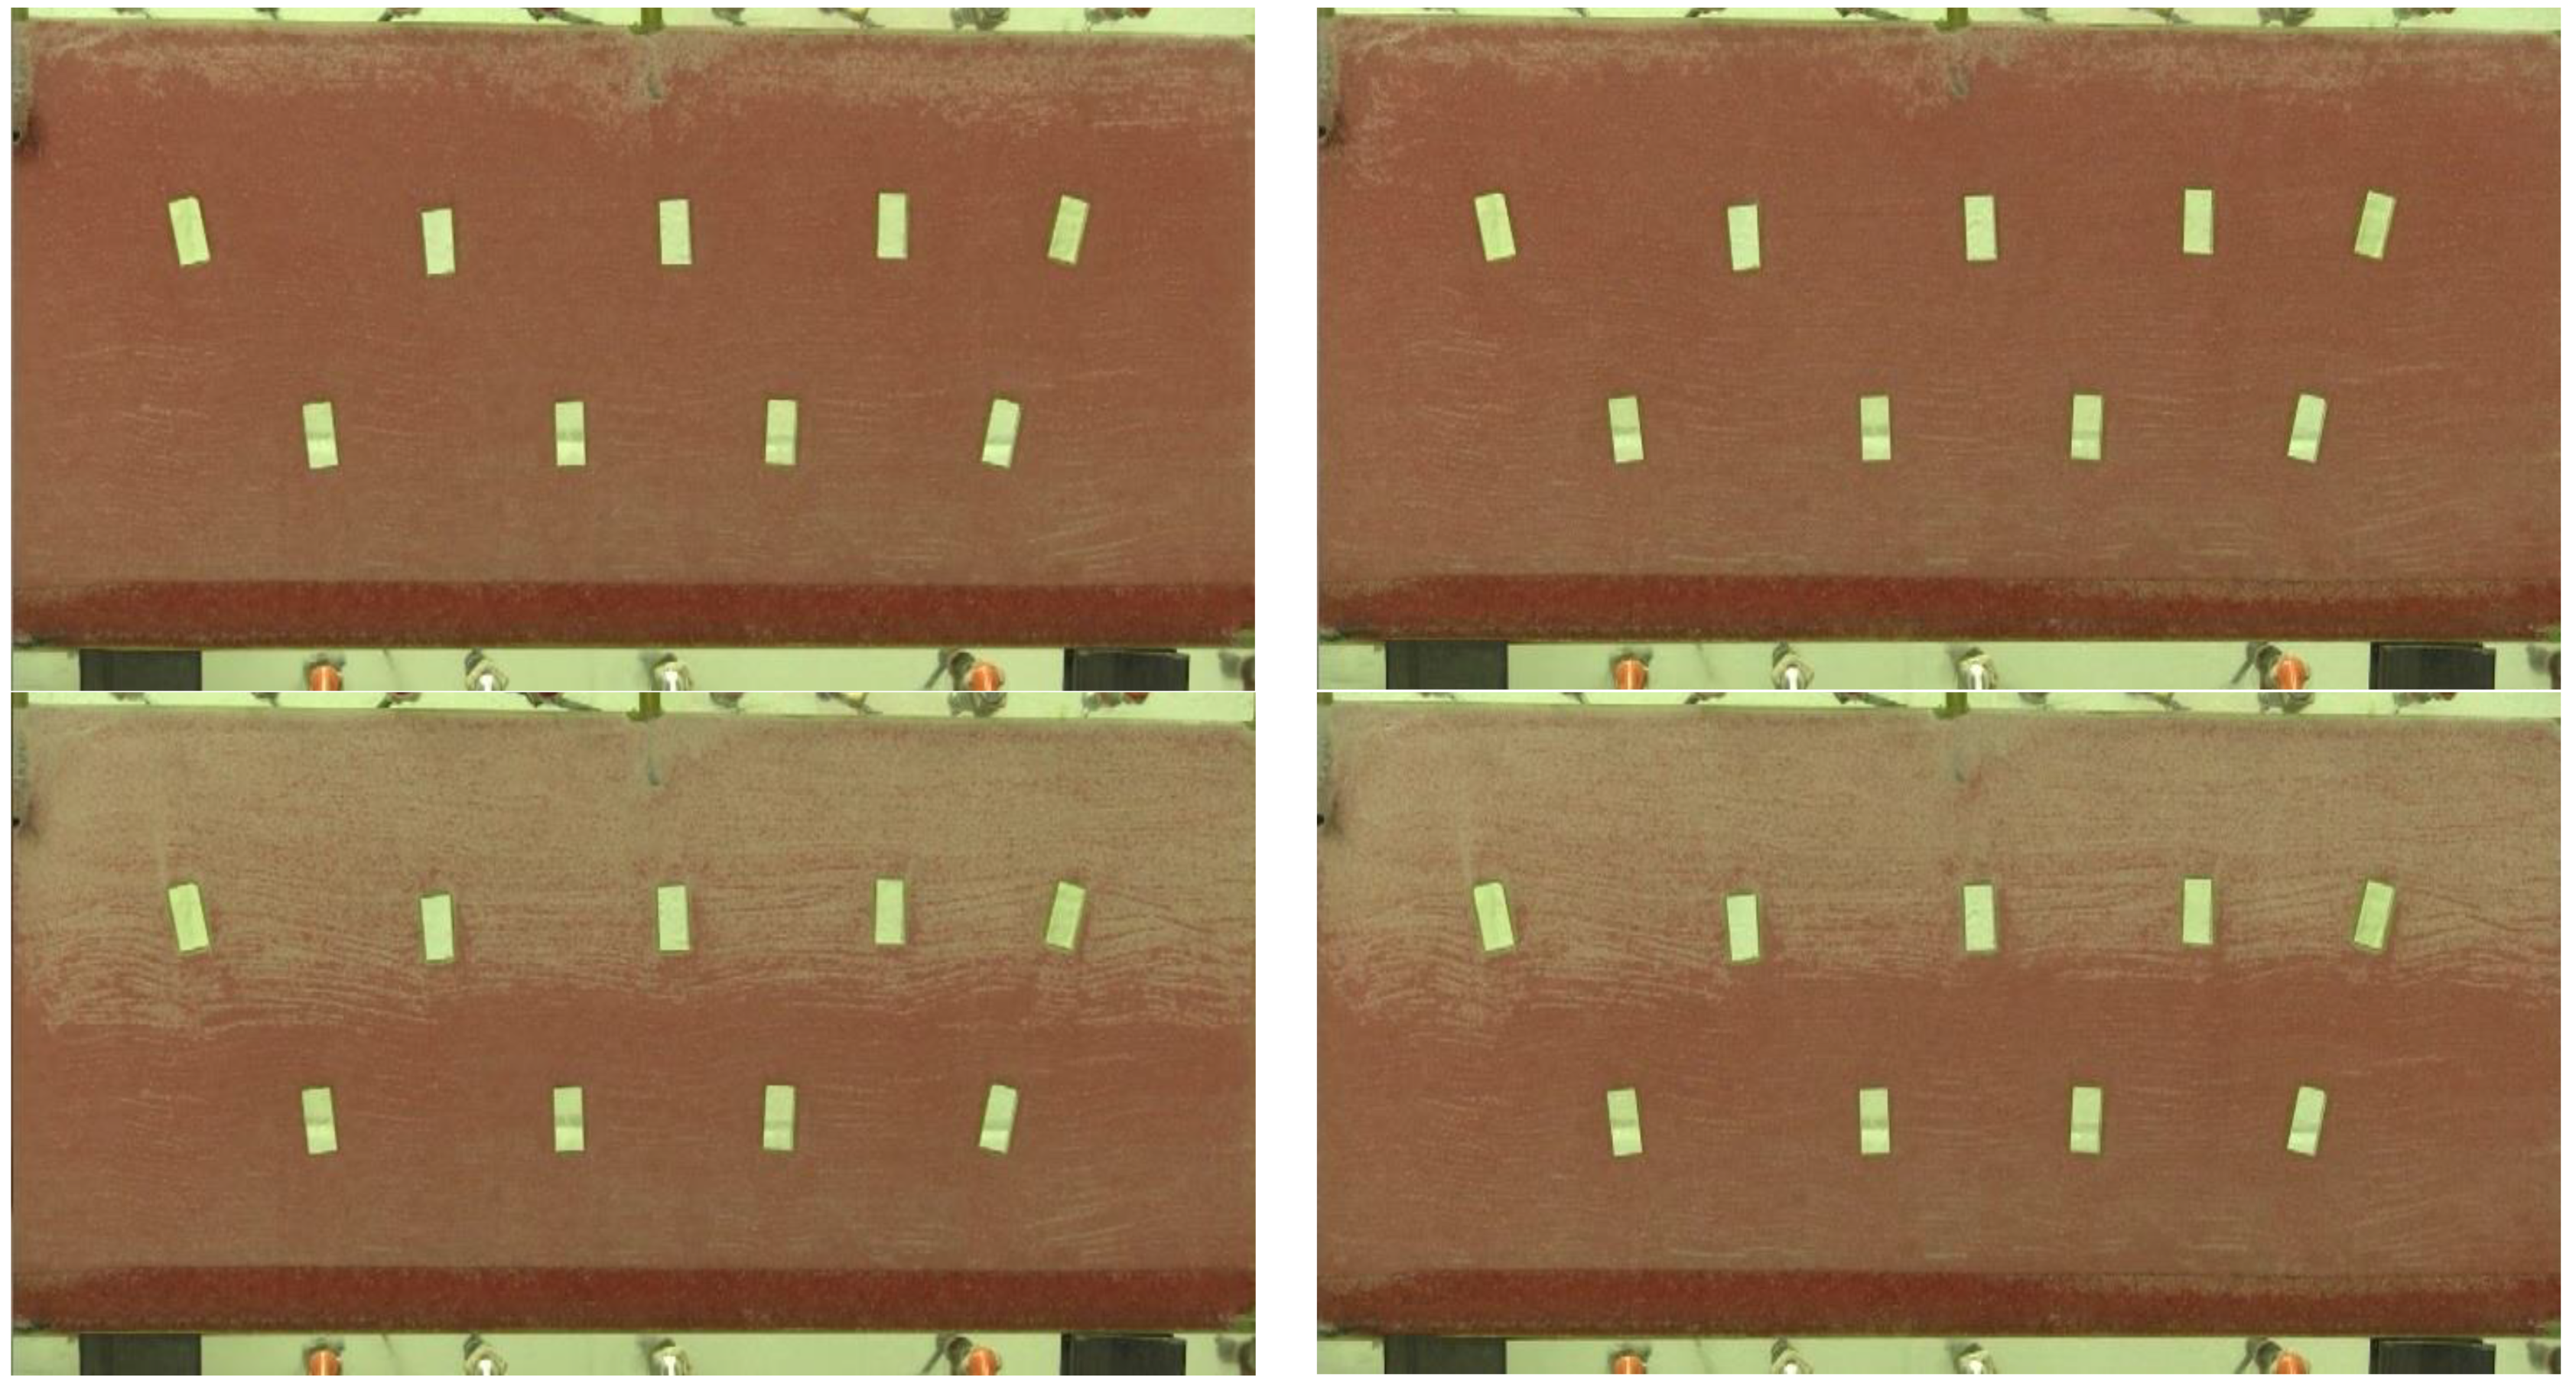
Comparison between a SW-GAGD well configuration and a GAGD well configuration is critical to the design of SW-GAGD process. Figure 8 shows the actual model where both SW-GAGD and GAGD well locations are identified and Figure 9 shows the development and progression of flood front in cases of both GAGD (left) and SW-GAGD process (right).
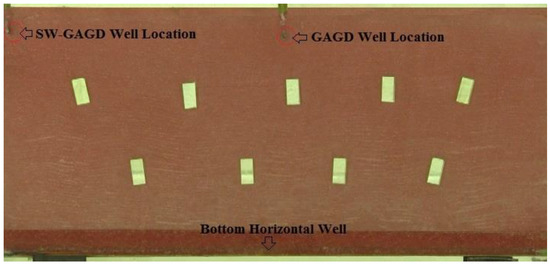
Figure 8.
SW-GAGD vs. GAGD well configurations incorporated within the same model.
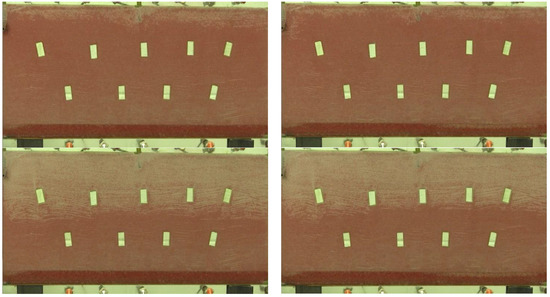
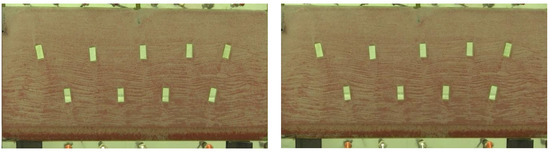
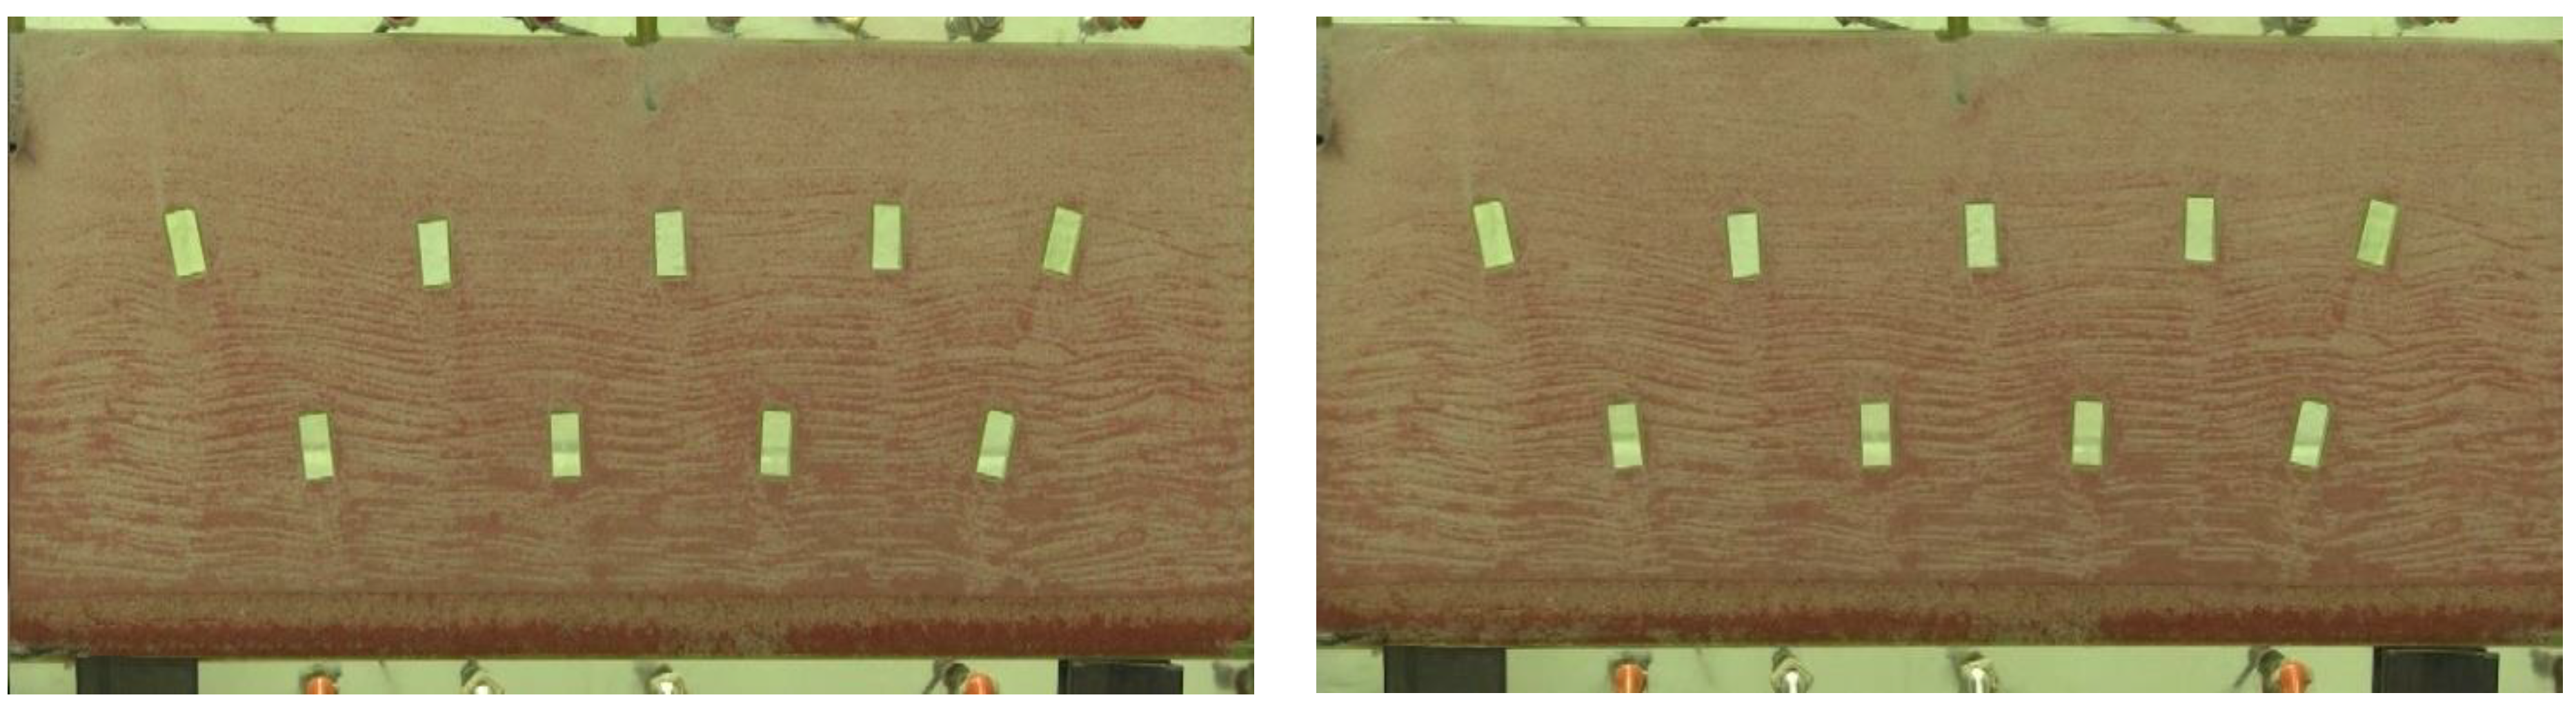
Figure 9.
Displacement front development in GAGD (left) and SW-GAGD configurations (right).
It was anticipated that SW-GAGD might not perform as well as a GAGD process, wherein the injection point is symmetrically located with respect to horizontal production well. Even though the injected gas was observed to spread out at the top before initiating a top-down displacement in case of SW-GAGD well configuration, there were concerns about the progress of the displacement front from start to finish of injection. Moreover, there were apprehensions that mere matching of displacement profiles between them may not mean identical efficiencies in recoveries. So, to put these concerns to rest, a model was built with concurrent placement of two wells in SW-GAGD and GAGD configuration each. This model could be run both as a SW-GAGD process or as a conventional GAGD process. Being able to have both the configurations within the same model meant the comparison will not have influence the data because of use of different models.
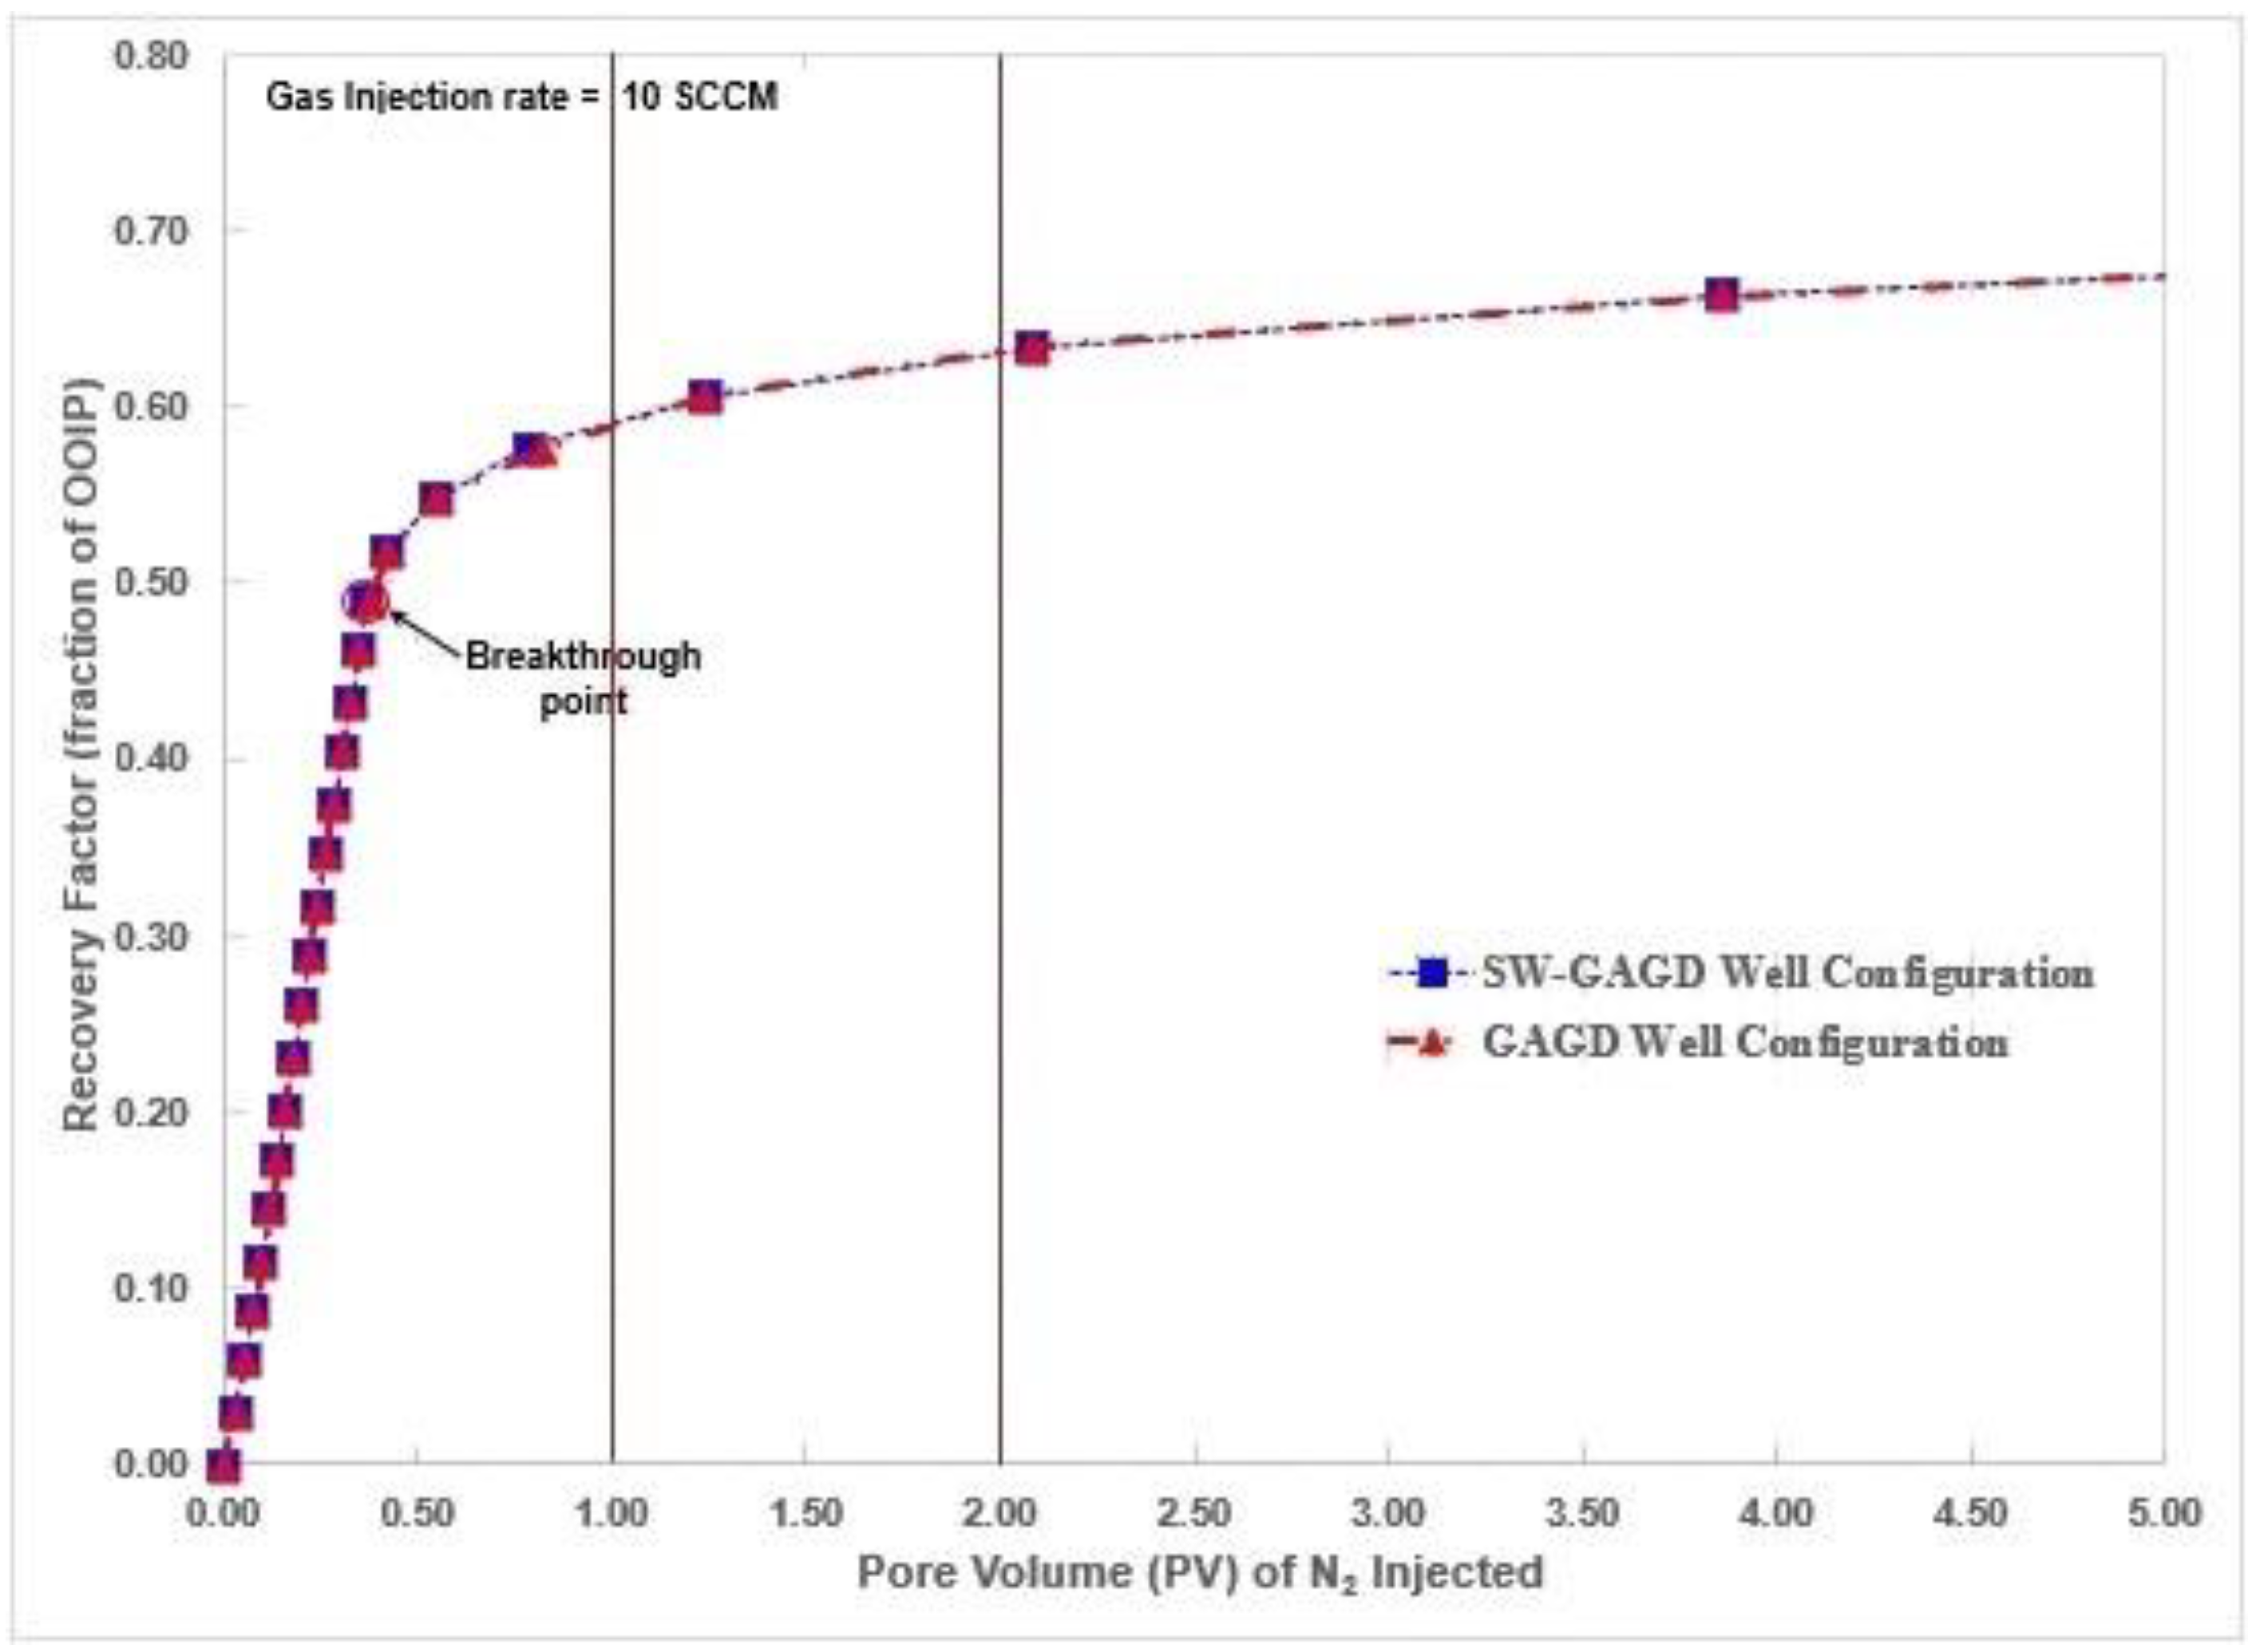
The progression of flood front was almost identical, barring in the initial part, thereby visually establishing the equivalence of the two processes. Figure 10 shows the recovery plot for SW-GAGD and GAGD, juxtaposed on one another for an injection rate of 10 SCCM.
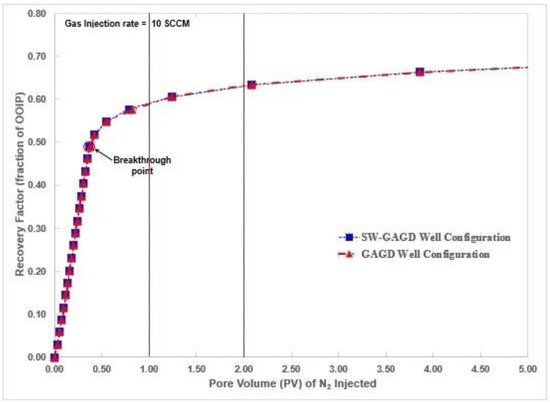
Figure 10.
Developing Recovery plot for SW-GAGD vs. GAGD Injection.
The recovery plots exactly overlapped from the beginning till the very end, dispelling any doubts about under-performance of SW-GAGD process compared to GAGD process. The ultimate recovery at 5 PV was 68% OOIP for both the cases. Thus, we need not be fixated on the idea of having multiple vertical injectors for establishment of the gas zone at the top of the payzone. A single well in SW-GAGD configuration should be able to serve as well thereby saving greatly in terms of the cost. Only limiting factor in case of a SW-GAGD process compared to a GAGD process, would be the rate of gas injection, since as much volume would have to be injected now through a single well. But nowadays, with the advances in horizontal well technology, that should not be a constraint, should it occur.
3.4. Toe-to-Heel Configuration of SW-GAGD Process
Toe-to-heel is a very popular well configuration used in the recovery of heavy oil through toe-to-heel air injection (THAI) process. Since the completion technologies for such a configuration is already available in the oil-industry, hence it was considered a suitable candidate configuration for adapting to a SW-GAGD process. A toe-to-heel configuration was studied for its suitability for incorporation in SW-GAGD process. In a typical toe-to-heel well configured SW-GAGD process, gas would be injected through the toe and oil would be produced through the heel of the horizontal lateral. In adapting a toe-to-heel configuration to SW-GAGD process, some pertinent questions arise that are worth considering. For example—how would such a process perform in case of heterogeneous layered reservoirs? Would toe-up or toe-down well orientation of the lateral have any bearing on SW-GAGD process performance? Such questions were considered and addressed during this part of the study. SW-GAGD models were built to represent the layering in the reservoirs. Three different Toe-to-Heel configurations as given below (a-c) were attempted. In all the toe-to-heel configurations, the top injection point was kept so that the performances of toe-to-heel configurations could be compared with that of top injection point.
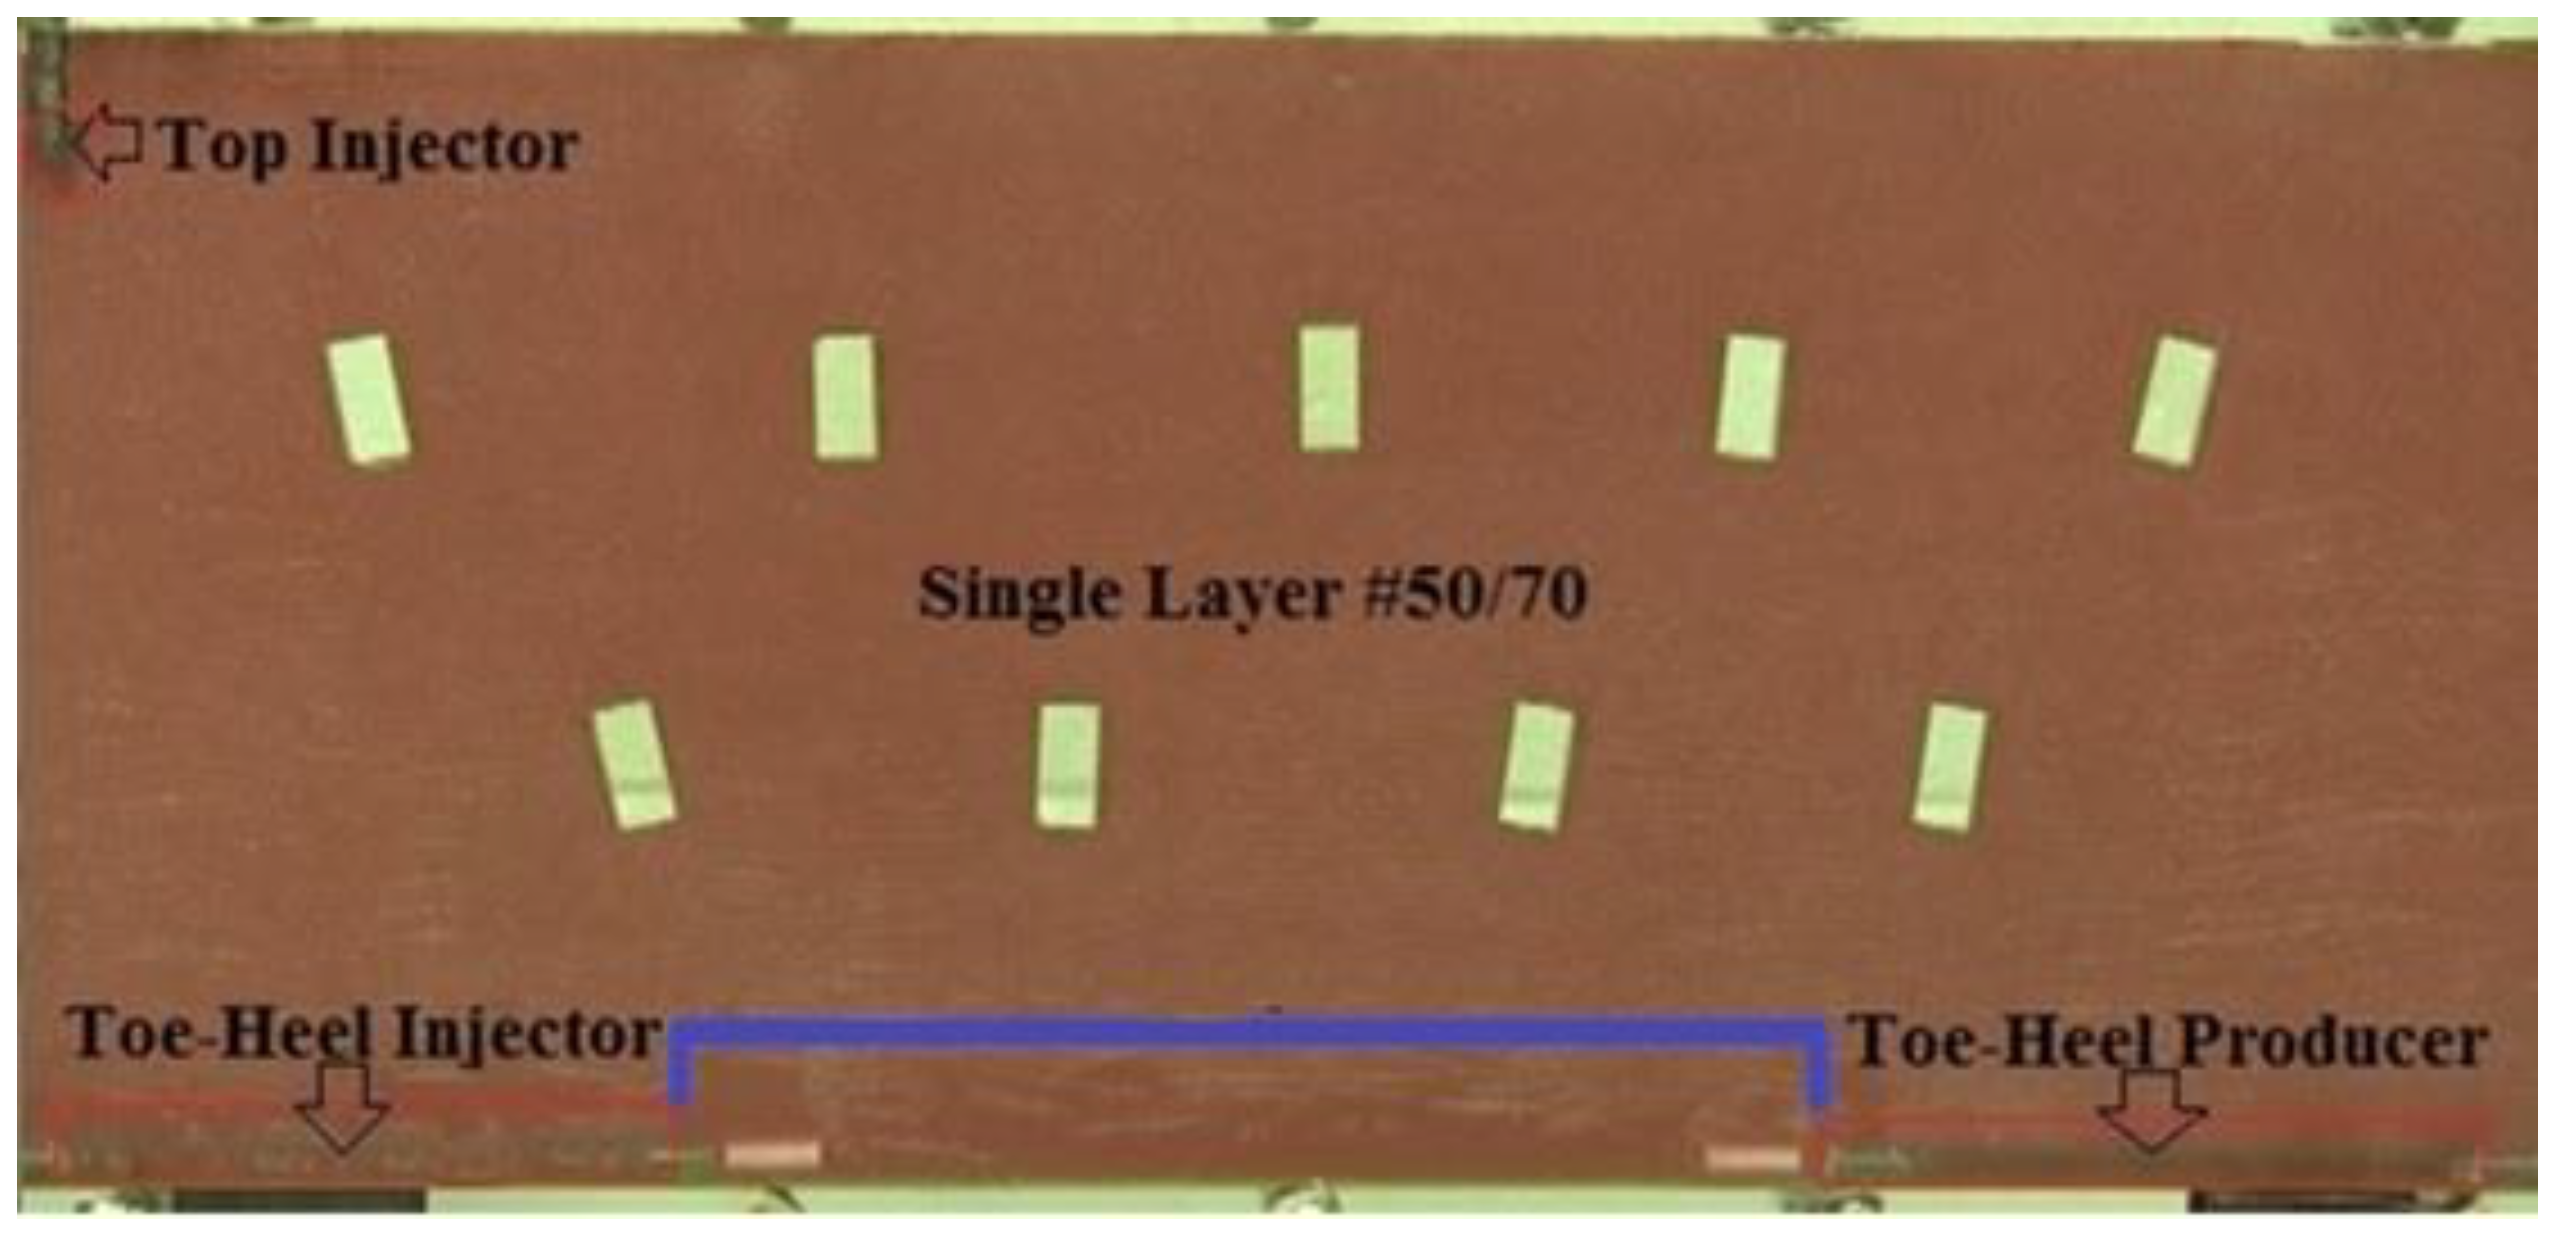
- Single-layer toe-to-heel SW-GAGD model: Model comprises of a single sand grain size (#50/70), giving uniform permeability (3.8 D) throughout the model. Figure 11 shows the model, wherein the toe and heel sections of the well are labelled along with the top injector. This model which had just a single layer served as the base case.
 Figure 11. Single-Layer Toe-to-Heel SW-GAGD model.
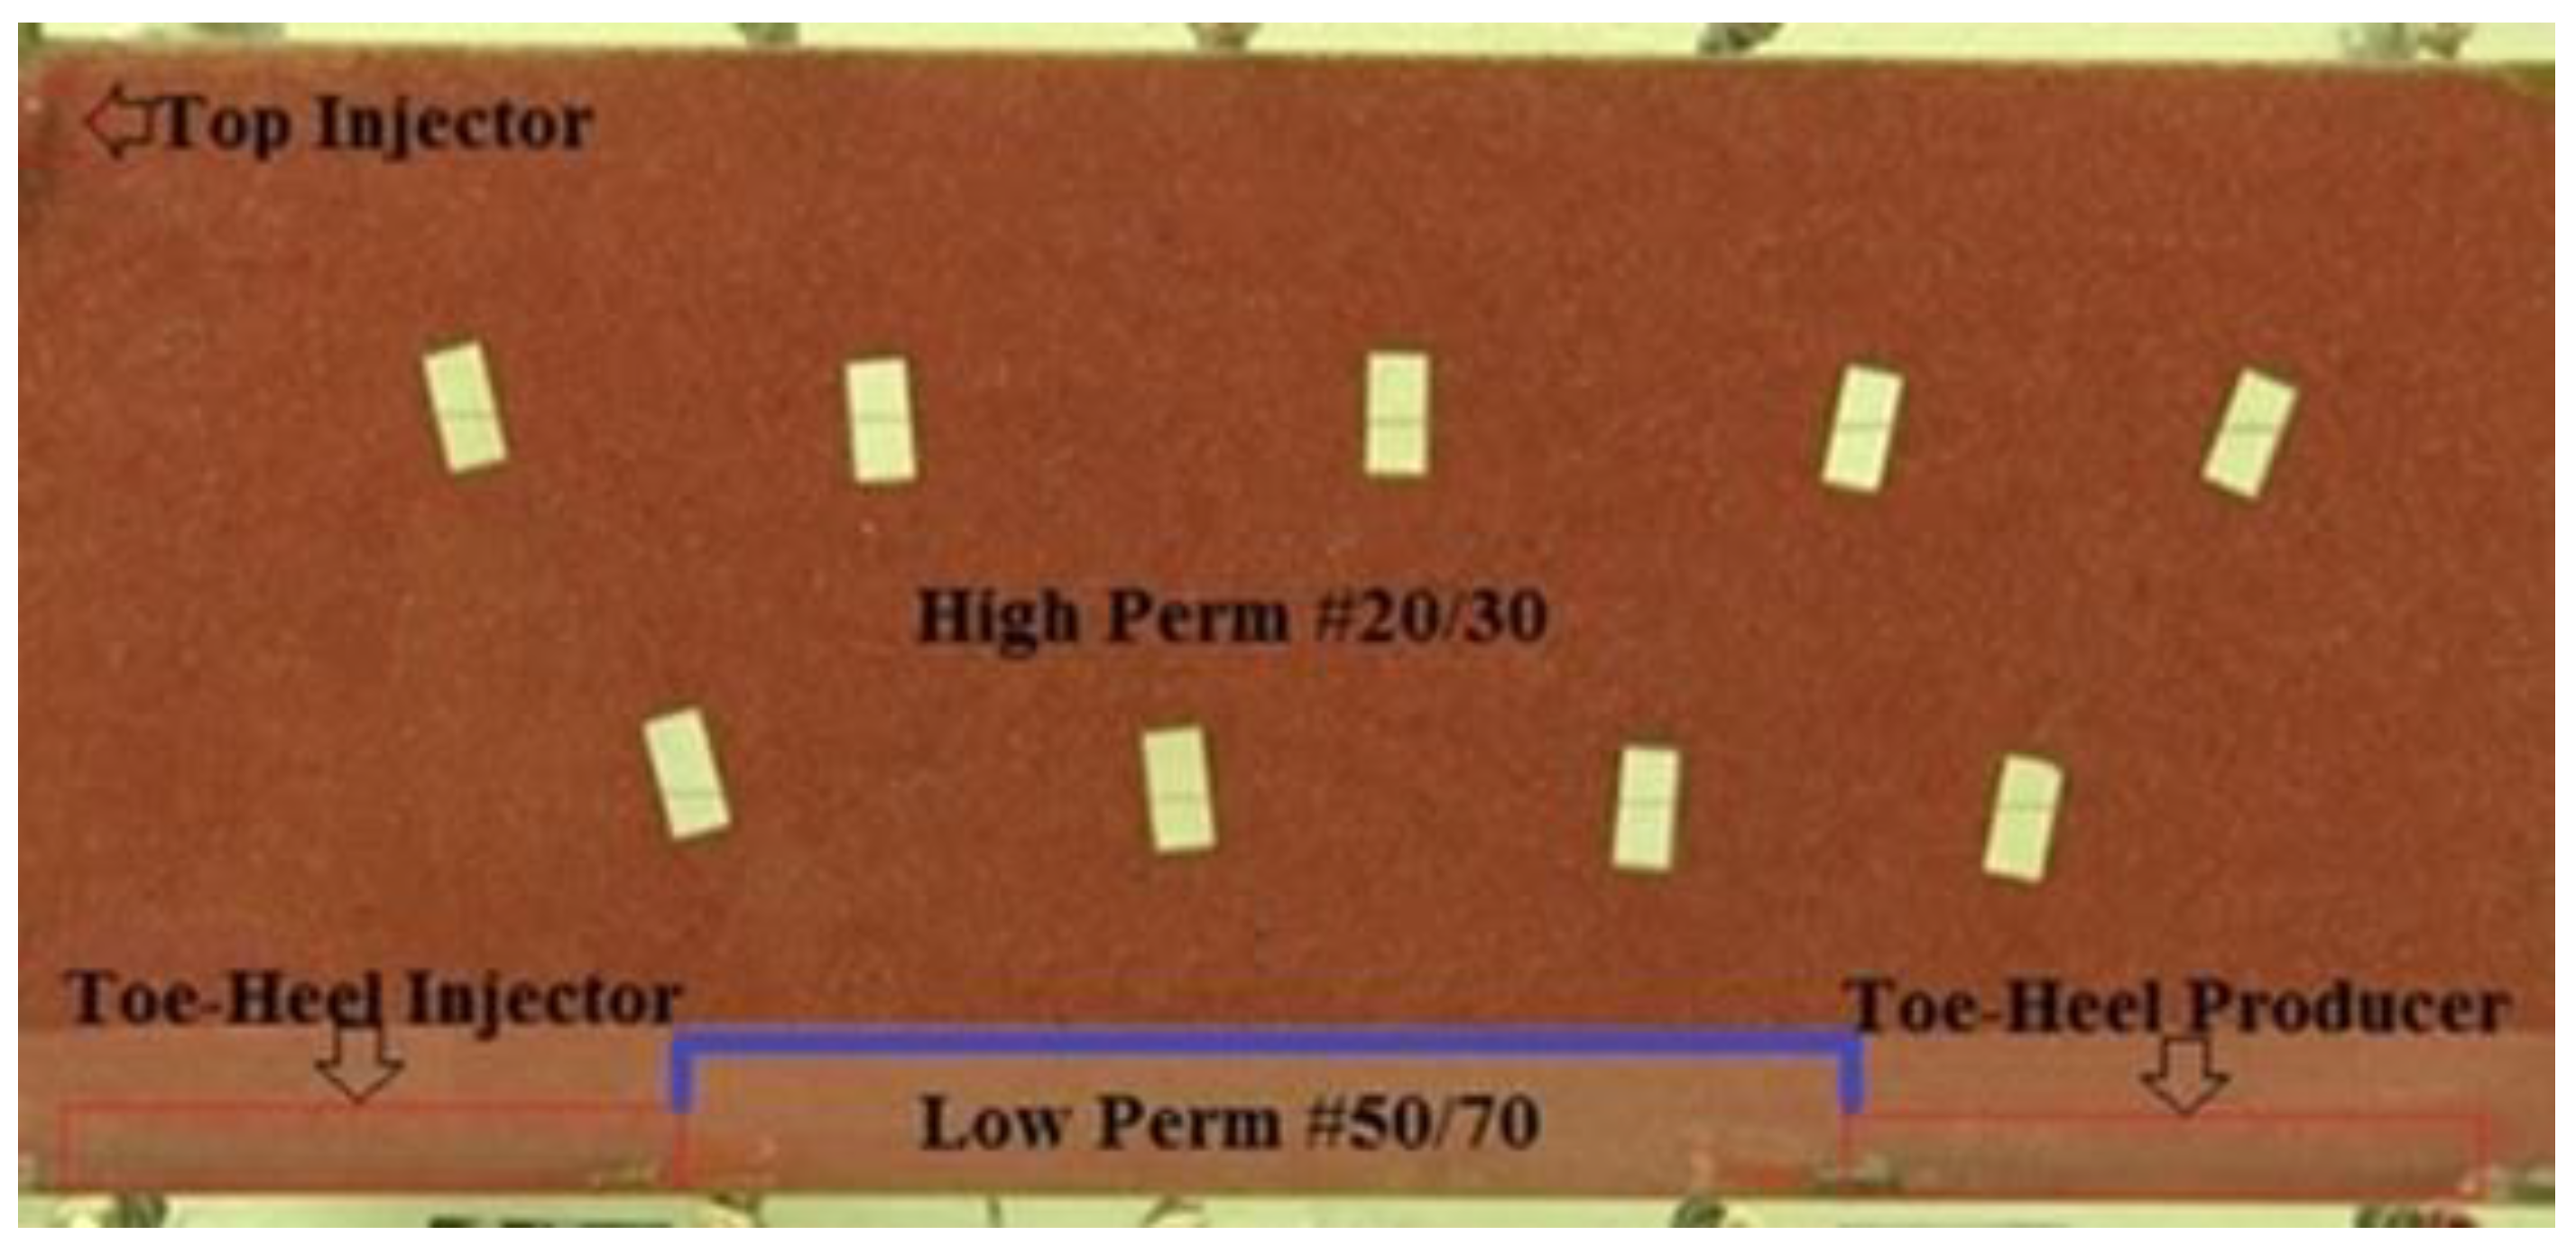
 - Bi-layer toe-to-heel SW-GAGD model with high permeability layer at the bottom: Figure 12 shows the model comprising of two layers with smaller sand grain size (#50/70) on top and larger sand grain size (#20/30) at the bottom, giving a higher permeability (6.1 D) to the bottom layer compared to the upper layer (3.8 D)
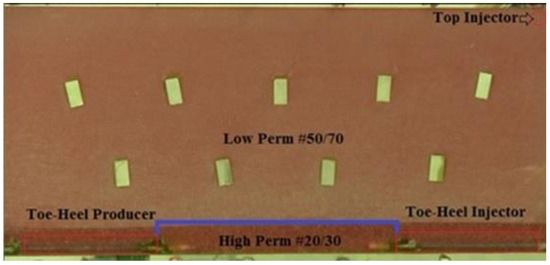 Figure 12. Bi-Layer bottom high permeability Toe-to-Heel SW-GAGD model.
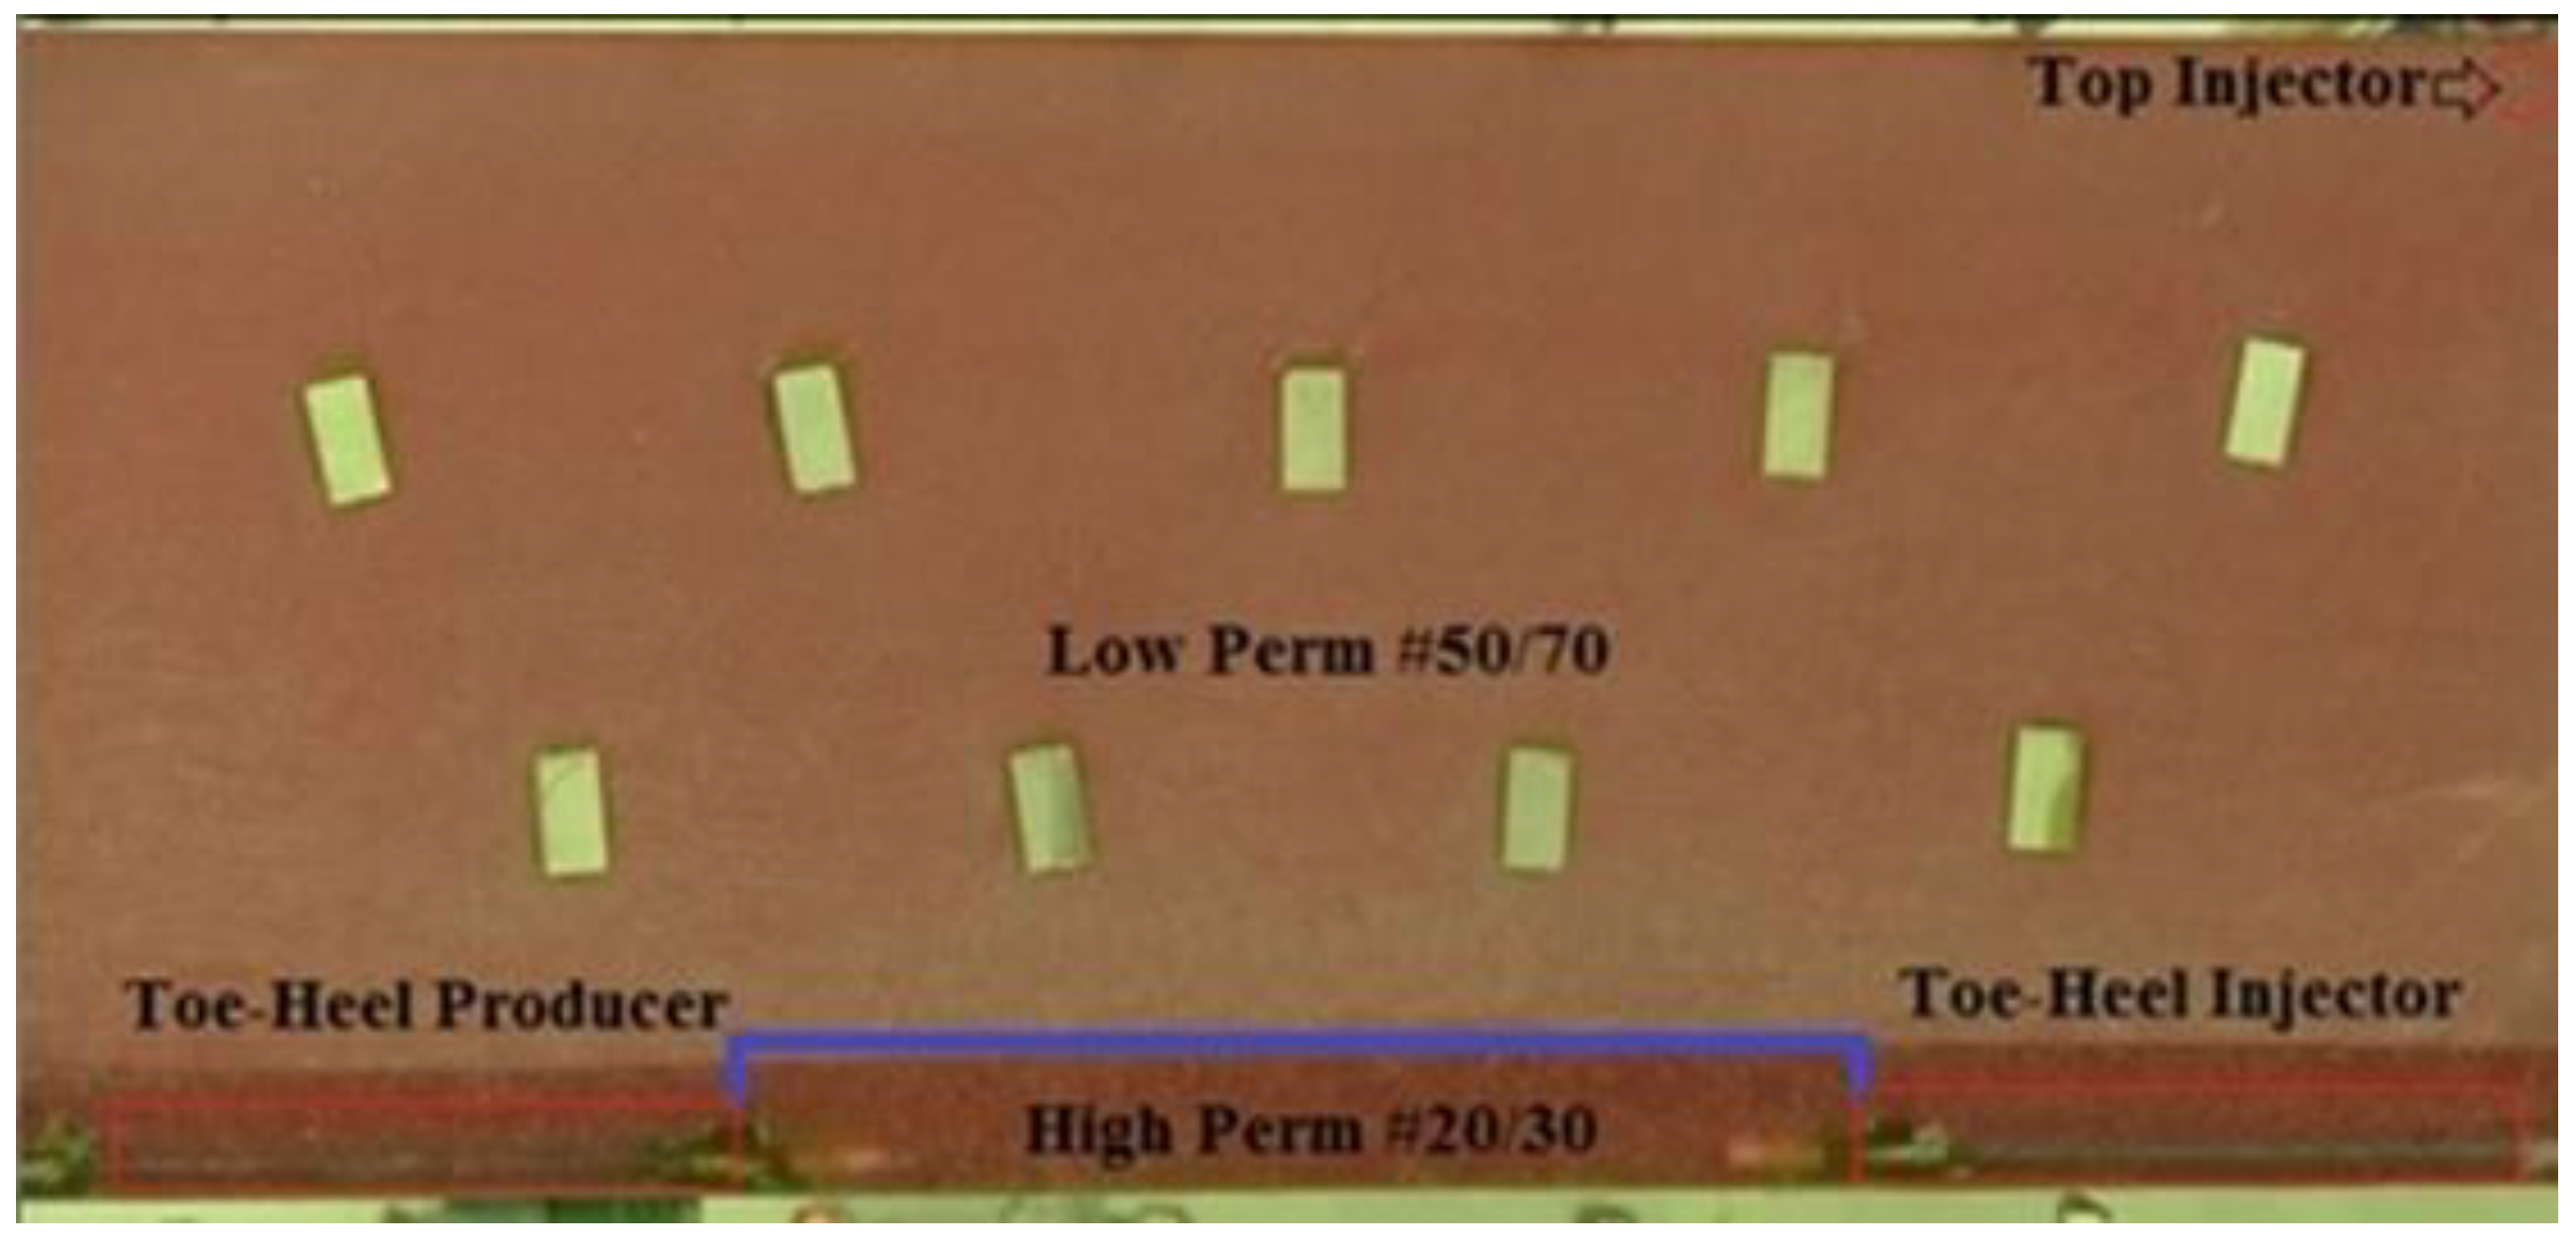
 - Bi-layer toe-to-heel SW-GAGD model with high permeability layer at the top: Figure 13 shows the model comprising of two layers with larger sand grain size (#20/30) on top and smaller sand grain size (#50/70) at the bottom, giving a higher permeability (6.1 D) to the upper layer compared to the bottom layer (3.8 D)
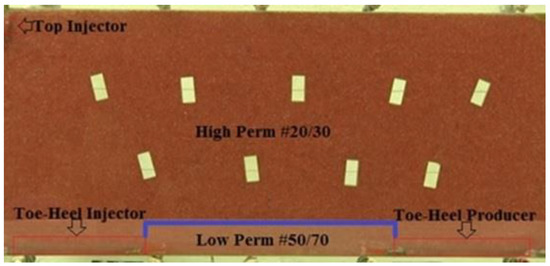 Figure 13. Bi-Layer top high permeability Toe-to-Heel SW-GAGD model.
3.4.1. Single-Layer Toe-to-Heel SW-GAGD Model
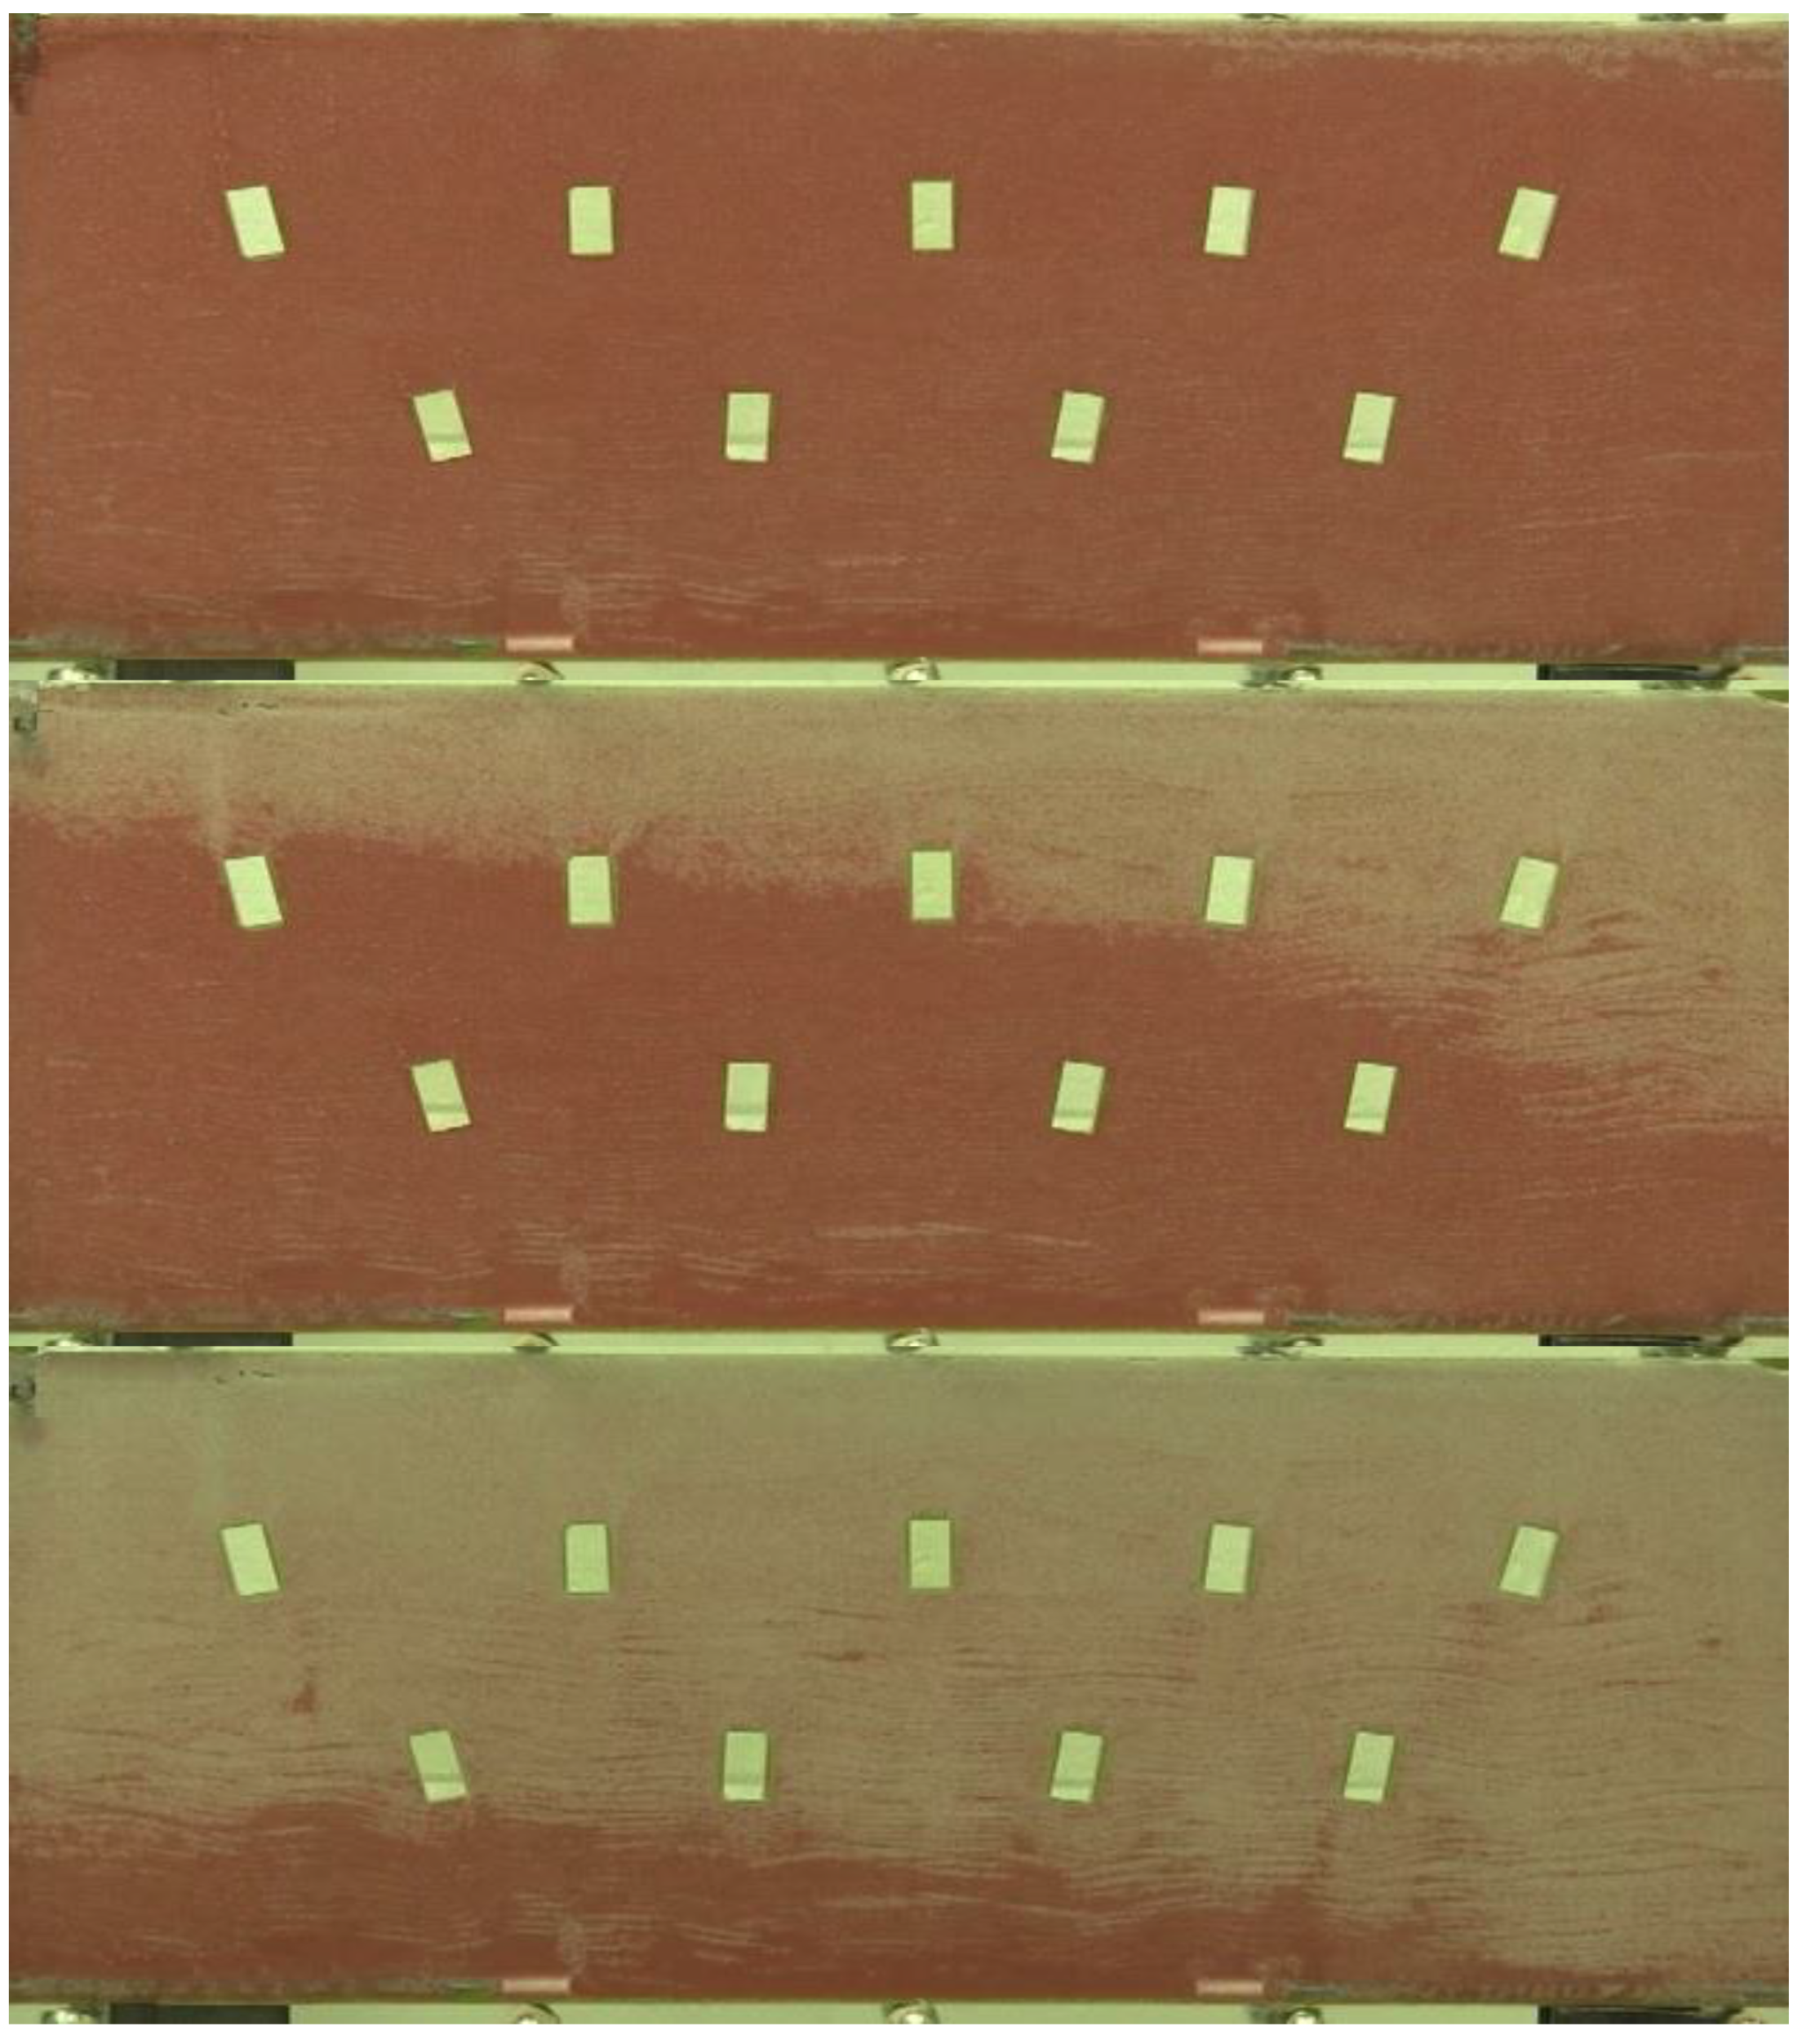
The progression of the SW-GAGD process in this case is shown in Figure 14. Short circuiting of injected gas was fraught because the injection and production ends were placed closed to each other. However, no such short-circuiting of the injected gas was observed. The injected gas from the Toe was seen to rise to the very top of the model before moving down in a gravity stable top-down displacement front. Slight tilting of the front towards the heel (production side) was seen as shown in Figure 14. Significant oil was produced from the heel. The recovery profile in this case was similar to that from a top-down injection from the top injector well. The toe-to-heel configuration in this case performed as well as in top-down injection through the top injection well. The ultimate recovery was 70% OOIP. Thus, a single-layer toe-to-heel SW-GAGD performs at a similar level as a top-down SW-GAGD model, with a slightly tilted displacement front.
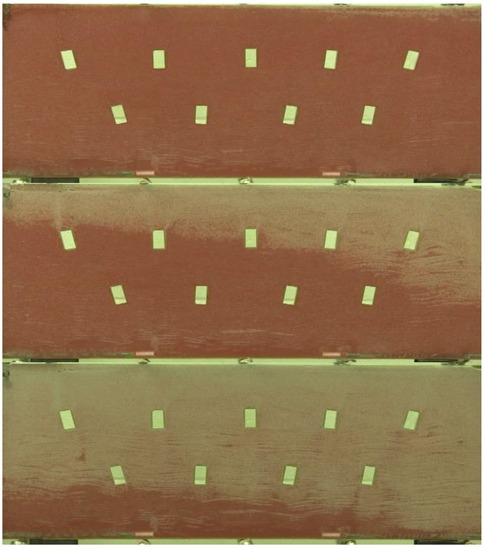
Figure 14.
Progression of flood front in case of Single-Layer Toe-to-Heel SW-GAGD model bottom (from top to bottom).
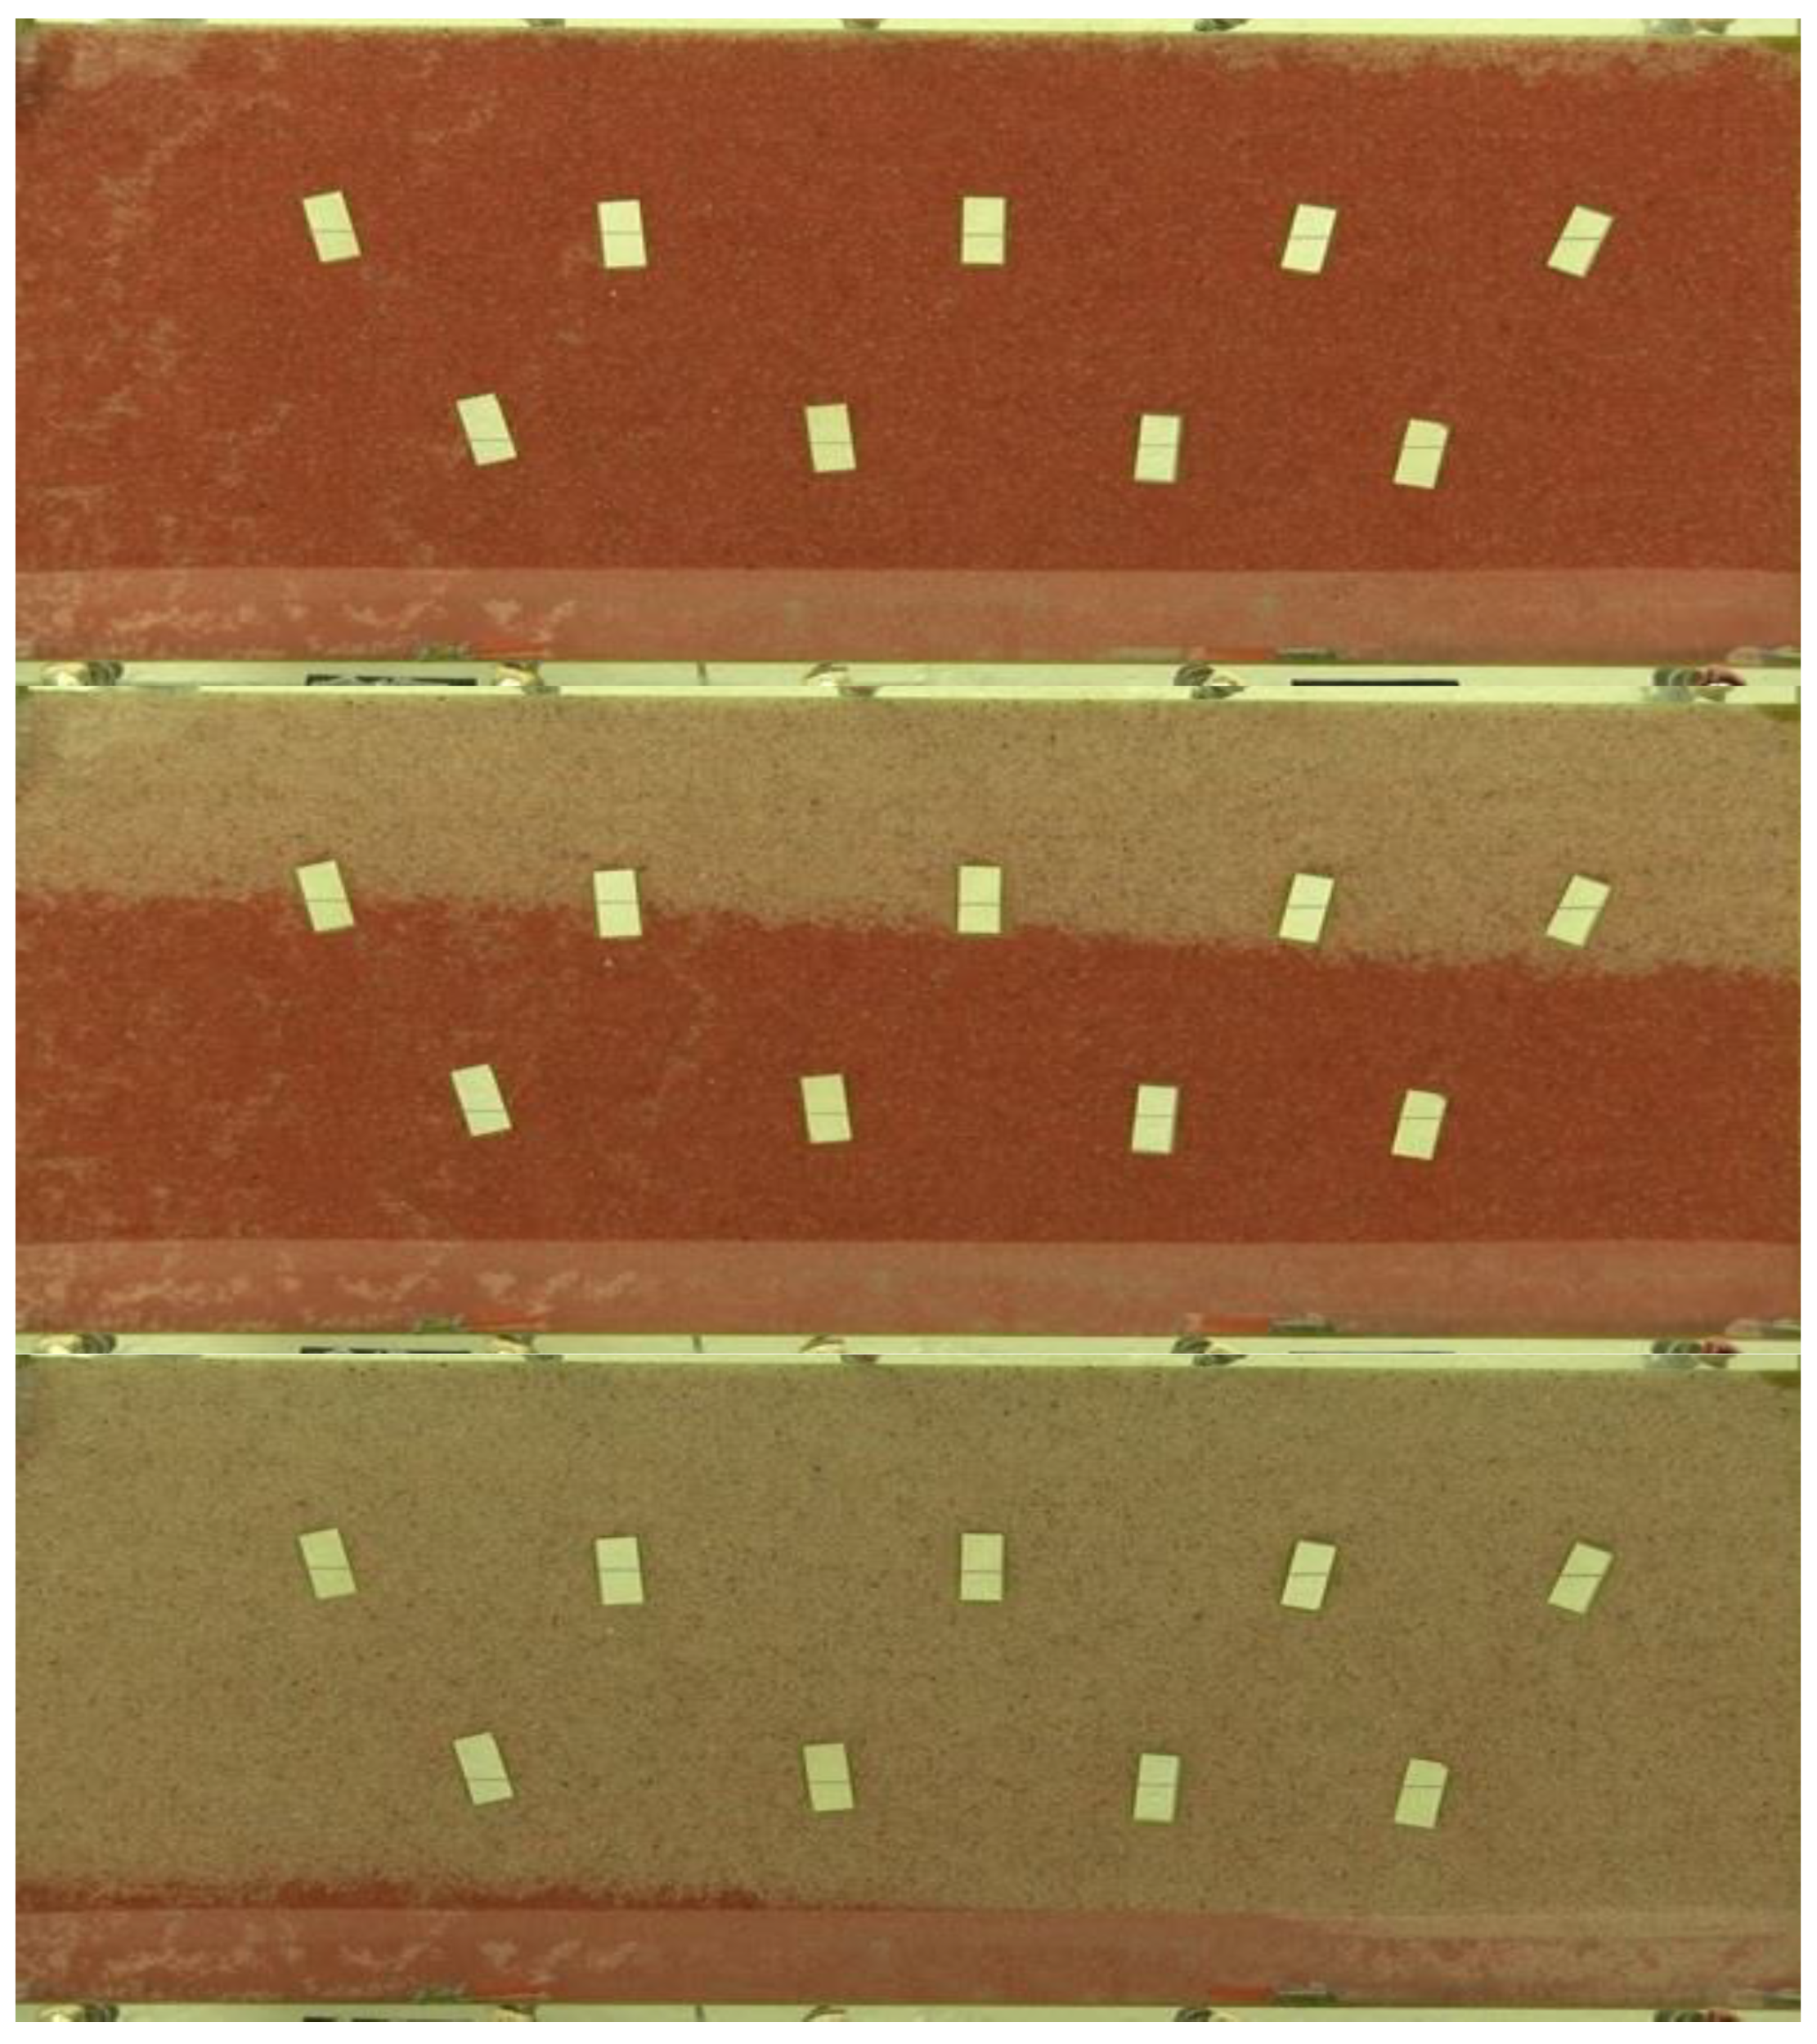
3.4.2. Bi-Layer Toe-to-Heel SW-GAGD Model with High Permeability Layer at the Bottom
The progression of the SW-GAGD process is shown in Figure 15. It was observed that because of high permeability near the horizontal well, the injected gas short circuited to the production well, affecting negligible change in oil saturation in the rest of the model above the high permeable zone. The injected gas was seen to sweep most of the bottom high permeable layer. This can be inferred from the total absence of red dyed color in the bottom layer of the model. Figure 16 is the recovery profile for this case along with the top injection case for comparison. As can be seen from the recovery profile, less than 8% of OOIP was recovered even at 2 PV of gas injection at an injection rate of 10 SCCM. Even a lower rate of 2.5 SCCM did not make any difference to the recovery factor and it remained at 8% OOIP. The rate did not seem to have any effect with respect to short-circuiting of injected gas to the production well. What seemed to matter predominantly was the permeability of the layer surrounding the well vis-à-vis permeability of the rest of the model. The oil recovered was commensurate to what was present in the bottom layer of the model.
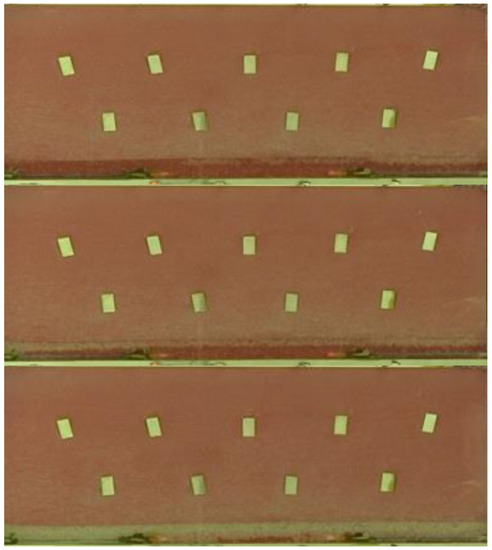
Figure 15.
Progression of flood front in case of Bi-Layer Toe-to-Heel SW-GAGD model with high permeability layer at the bottom (from top to bottom).
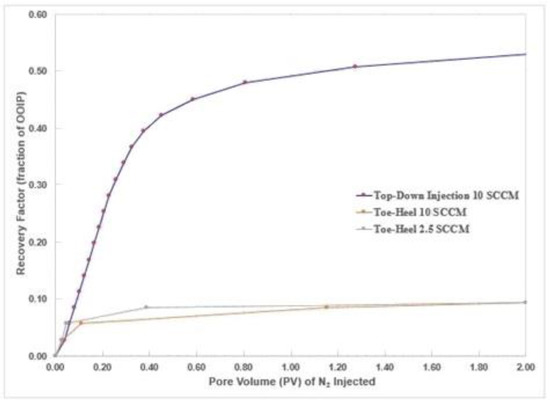
Figure 16.
Recovery profile for Bi-layer bottom high-perm Toe-to-Heel SW-GAGD Model.
Thus, in case of a real-world scenario, if the zone surrounding the toe-to heel well were to have higher permeability than the rest of the payzone, then it’s much likely that the injected gas will short circuit to the production side, without sweeping much of the reservoir. Thus the toe-to-heel configuration would depend on the properties and the layering of the reservoir in which it is placed.
3.4.3. Bi-Layer Toe-to-Heel SW-GAGD Model with High Permeability Layer at the Top
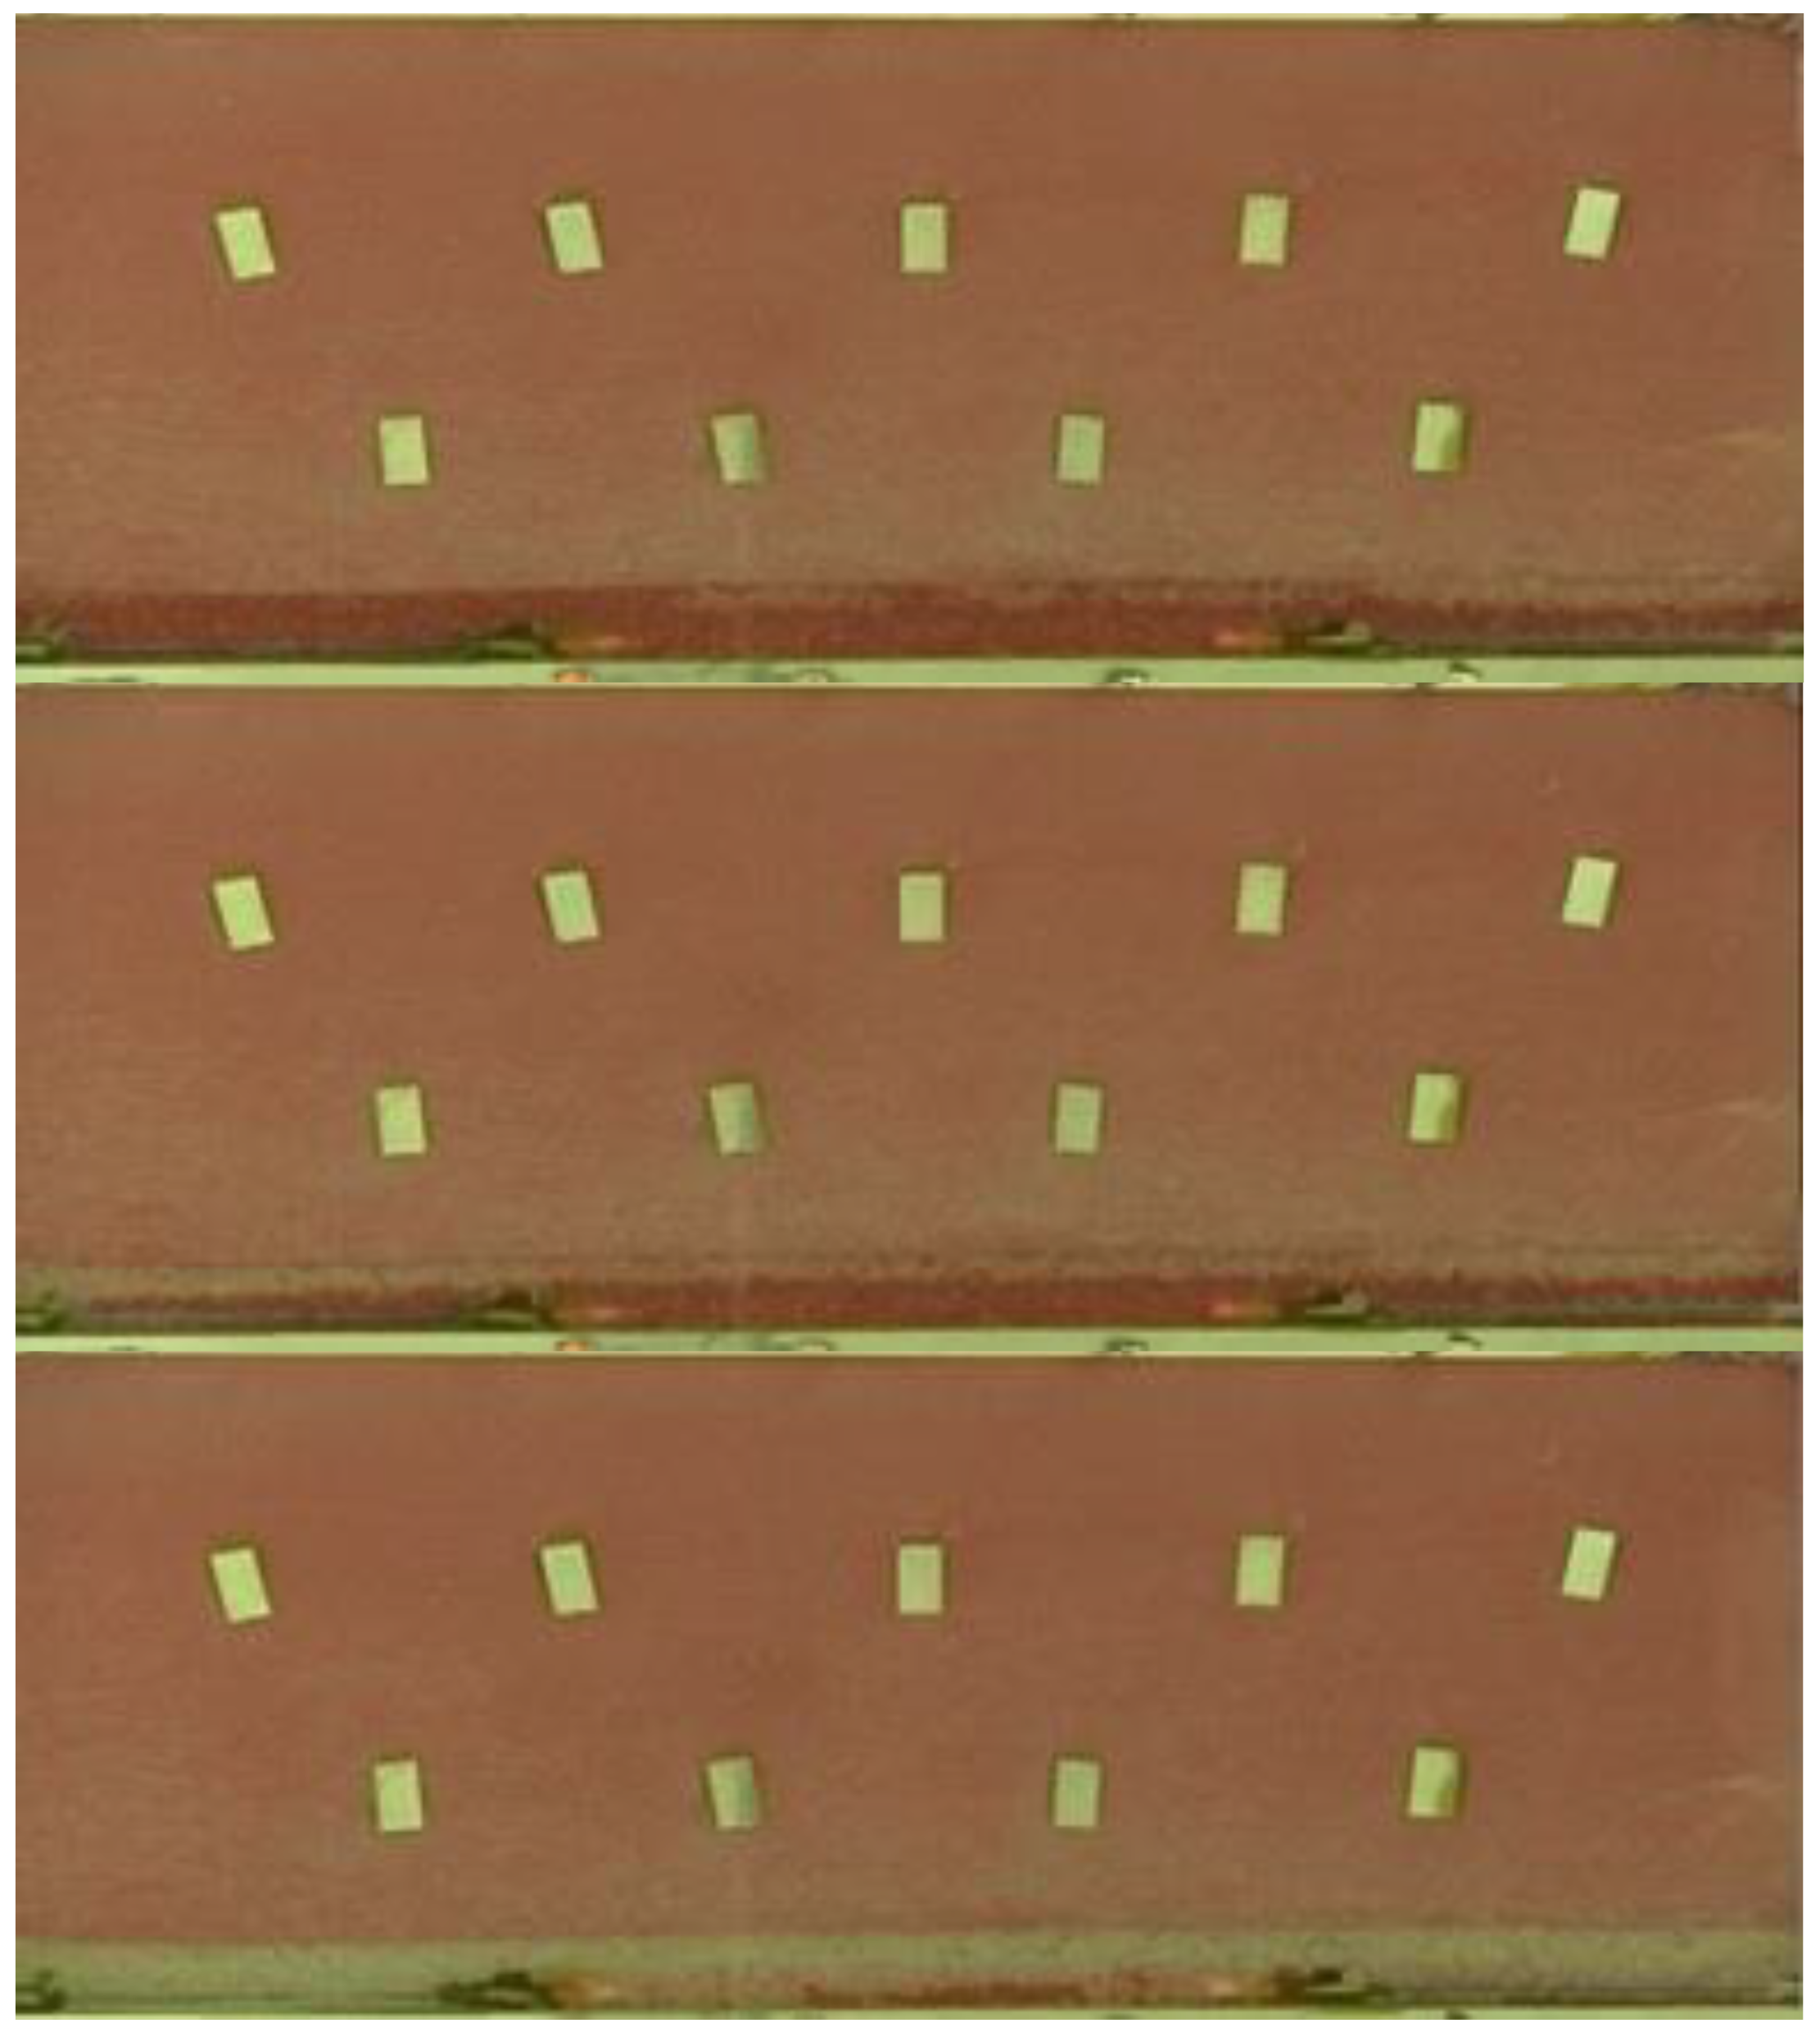
The opposite case to that of 3.4.2 above is when the top layer is of higher permeability than the bottom layer in which the Toe-to-Heel well is placed. The progression of the SW-GAGD process in this case is shown in Figure 17 and the recovery profile in Figure 18. Unlike in case of (B), short circuiting was not observed even though the permeability of the area near was different, albeit lower, than the rest of the model.
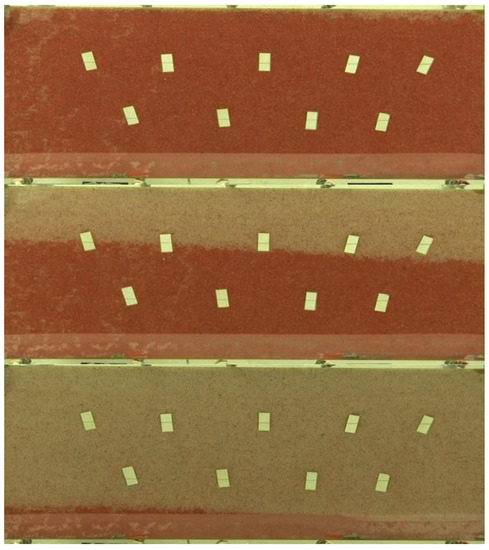
Figure 17.
Progression of flood front in case of Bi-Layer Toe-to-Heel SW-GAGD model with high permeability layer at the top (from top to bottom).
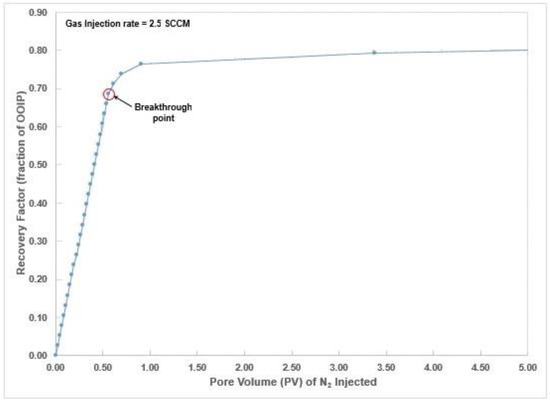
Figure 18.
Recovery profile for Bi-layer top high-perm Toe-to-Heel SW-GAGD Model.
The injected gas was seen to rise through the high permeable upper layer to the top forming a gas zone at the top before moving down in a top-down displacement. Thus, it can be safely inferred that as long as the permeability of the zone near the horizontal well is lower than the top layers, there will be not be any short circuiting. Even though the toe-to-heel configuration was functionally similar between cases A, B and C, the development of the gas-oil displacement front for the three cases is vastly different. Another interesting observation was the development of near flat displacement front unlike that in case A (with single layer). Low permeable zone near the production well acted to flatten out the displacement front as can be seen in Figure 17. It was also observed that the gas-oil displacement front preferred to first sweep the upper higher permeable layer than to move into the bottom lower permeable layer. This is because of higher frictional resistance for the gas to flow in the low permeable layer. This preference of the injected gas to reside in the upper high permeable layer rather than moving down to the lower low permeable layer leads to much better sweep of the upper layer. Figure 18 gives the recovery plot for this case. The recovery factor at 5 PV is 80% and even the breakthrough recovery factor is close to 70%. This is a remarkably high recovery factor in the domain of immiscible gas injection. Compared to the single layer case, there is an improvement in recovery of over 10% OOIP. Thus, a lower permeable zone near the wellbore can greatly increase the recovery efficiency in case of immiscible gas injection under a gravity stable top-down displacement, the likes of SW-GAGD. In case of a real field scenario, such a layering would help the toe-to-heel configuration of SW-GAGD process. But reservoir layering is not in our control and is an act of nature. Even though this case promises high returns because of better sweep efficiency, there is a chance that it may not even work, if the layering were like in case (B), so in view of the fact that a toe-up SW-GAGD configuration would be the best option that is more or less immune to adverse heterogeneity effects of reservoir layering. Thus, the conclusion that can be drawn from this is that so as not to face the adverse impact of reservoir heterogeneity for the case of gravity stable injection and to maximize the recovery in case of favorable layering, injection at the top of the reservoir payzone, either using casing perforation at the top or a toe-up configuration should be utilized.
4. Conclusions
- (1)
- A single-well gas-assisted gravity drainage (SW-GAGD) process has been shown to be technically feasible by carrying out a proof of concept study of the process through partially scaled physical model experimentation. The SW-GAGD process outperformed natural gravity drainage not only in terms of recovery, but was also found to be order of magnitude faster. For a low gas injection rate of 2.5 SCCM, it was 23 times faster and that jumped to 93× at 20 SCCM. Increase in the rate of injection resulted in increase in the recovery factor in the shorter term, but over the longer term with higher volumes of pore volume (PV) injected, the ultimate recovery factor was similar even for the lower rates. The mechanism of oil production was seen to be primarily the displacement at the gas-oil interface until the arrival of the displacement front at the horizontal producing well. Post arrival, there is no clear displacement front and the production proceeded through interplay of gravity, capillary and inertial forces.
- (2)
- A comparison between SW-GAGD and GAGD processes, established exact equivalence between the two processes in terms of progression of displacement front as well as recovery profile. Recovery factor was 68% OOIP for both cases. This equivalency in their recovery performance paves the way for SW-GAGD process to be utilized in high cost environment with similar commercial benefits.
- (3)
- The toe-to-heel well configuration was tested for its use as a version of the SW-GAGD process. It was seen that if the injected bottom layer had a higher permeability than the upper layer, then there is severe short-circuiting of the injected gas to the production heel of the well, leaving all of the upper layers upswept with ultimate recovery of only 8% OOIP. Hence, layering of the reservoir as well as placement of the heel of the Toe-to-Heel well are critical factors while considering Toe-to-Heel configuration. Toe-Up orientation with Toe placed at the top of the payzone or top-point injection in general is thus the safest bet to avoid the short-circuiting of the injected gas.
- (4)
- In case of a layered reservoir with lower permeability layer at the bottom of the payzone, the location of the toe-to-heel lateral within the bottom low permeable layer facilitated flattening of the gas-oil displacement front. The gas oil displacement front first preferred to sweep the upper higher permeable layer than to move down into the bottom lower permeable layer. This preference of the injected gas leads to better sweep of the upper high permeable layer and consequently higher recoveries, 80% OOIP i.e., 10% additional recovery. This fact can be used to inform placement of toe-to-heel well lateral and gas injection point to maximize recoveries.
Author Contributions
B.D.S. contributed towards conceptualization, methodology, formal analysis, investigation, resources; writing—original draft preparation; visualization; funding acquisition. D.N.R.: Contributed towards conceptualization; methodology; formal analysis, investigation, resources; writing—review and editing; supervision; project administration; funding acquisition. All authors have read and agreed to the published version of the manuscript.
Funding
This research received no external funding
Data Availability Statement
Data is contained within the article. The data presented in this study are available in [Saikia, Bikash Deep, “Development of Single-Well Gas Assisted Gravity Drainage Process for Enhanced Oil Recovery” (2016). LSU Doctoral Dissertations. 4290. https://digitalcommons.lsu.edu/gradschool_dissertations/4290, accessed on 21 March 2021].
Acknowledgments
Authors acknowledge support of LSU board of regents’ Economic Development Assistantship during the completion of the work.
Conflicts of Interest
The authors declare no conflict of interest.
Appendix A
The detailed protocol for the construction of the glass models is given below.
- (1)
- Glass pieces of following dimensions were cut of plate glass (all dimensions in inches):
- 24.5 (L) × 12.5 (W) × 0.25 (T)—2 nos. frame glass
- 21.0 (L) × 1.0 (W) × 0.375 (T)—1 no. spacer
- 23.375 (L) × 1.0 (W) × 0.375 (T)—1 no. spacer
- 10.125 (L) × 1.0 (W) × 0.375 (T)—2 nos. spacers
- 1.0 (L) × 0.5 (W) × 0.375 (T)—9 nos. spacers
- (2)
- All glass pieces were thoroughly cleaned using acetone to remove dust and any oil smears on the surface. They were then dried to remove moisture on the surface. Frame glass was then marked appropriately.
- (3)
- Epoxy-based glue EP41S-1HT from Masterbond (Hackensack, NJ, USA) was used for the purpose of glass bonding. Based on the area of spread, right amount of hardener (30% w/w) was added to the epoxy and was thoroughly mixed. Proper mixing is essential to ensure good bond. This resultant mixture was then used for bonding.
- (4)
- For the purpose of bonding, the glue was applied to one surface of the spacers using an applicator. It is important to have a uniform layer of glue on the surface of the spacer and excess glue was wiped off.
- (5)
- Firstly, spacers (c)–(e) were bonded to one of the frame glasses as per the markings. The bond does well with applied pressure. Clamps were placed 1–2 inches apart to ensure proper bonding.
- (6)
- This assembly (hereafter referred as part A) was then left overnight (12–15 h) for curing at ambient temperature followed by high temperature (225 °F) curing for 3.5 h.
- (7)
- A horizontal well was prepared using ¼” plastic tubing and by drilling fine holes in it with a handheld drill machine with 0.0046785 inches’ size drill bit. Holes were drilled all around the tubing to minimize trapped oil volume within the model.
- (8)
- The horizontal well was placed in part A sub-assembly very carefully and held in place by using the same glue. This is essential otherwise that will be the weakest point for leakage later on.
- (9)
- Upon placement of horizontal well, the 2nd frame glass (part B) was similarly glued and clamped onto assembly A and allowed to stand for 8 h. Next both sides of horizontal well were filled up with this glue and allowed overnight curing at room temperature.
- (10)
- The whole assembly was then hot cured again at 225 °F for 3.5 h.
- (11)
- Sand grain sizes of 20/30 and 50/70 mesh were used for making the sandpack in these glass models. Sand-packing was carried out to incorporate the natural layering of reservoir. Frequent shaking and levelling of the sand was done to uniformly pack the sand bed in the model.
- (12)
- Upon completion of the sand-packing, spacer (a) was glued in place and the entire assembly was again allowed to cure at room temperature overnight before hot curing at 225 °F for 3.5 h.
- (13)
- This was followed by tight packing of the sand with frequent rocking of the model for the sand to get into the nooks and corners and really pack in snugly. This step was essential to tighten the sand pack on all sides of the model.
- (14)
- The top well was then fitted in place and sealed using the same glue and was allowed to cure using the earlier mentioned curing protocol.
- (15)
- As an extra step the model was also sealed on all sides by a bi-layer comprising Epon-828 epoxy resin (miller-stephenson, Danbury, CT, USA) and silicone. This was done to doubly ensure that model didn’t leak out.
- (16)
- This basic procedure was followed overall with appropriate modifications when different well configurations were attempted in the glass model. The model was then connected to rest of the flow apparatus and data acquisition system.
References
- US EIA. Trends in U.S. Oil and Natural Gas Upstream Costs; US Department of Energy: Portland, OR, USA, 2016.
- Lach, J. IOR for Deepwater Gulf of Mexico; Knowledge Reservoir: Houston, TX, USA, 2010. [Google Scholar]
- Christensen, J.R.; Stenby, E.H.; Skauge, A. Review of WAG Field Experience. SPE Reserv. Eval. Eng. 2001, 4, 97–106. [Google Scholar] [CrossRef]
- Johnston, J.R. Weeks Island Gravity Stable CO2 Pilot. In Proceedings of the SPE/DOE Enhanced Oil Recovery Symposium, Tulsa, Oklahoma, 17–20 April 1988. [Google Scholar]
- Bangia, V.K.; Yau, F.F.; Hendricks, G.R. Reservoir Performance of a Gravity-Stable Vertical CO2 Miscible Flood: Wolfcamp Reef Reservoir, Wellman Unit. SPE Reserv. Eng. 1993, 8, 261–269. [Google Scholar] [CrossRef]
- Dullien, F.A.; Chatzis, I.; Macdonald, I.F. Enhanced Oil Recovery Process. U.S. Patent No. 4,953,619, 1990. Available online: https://rb.gy/ik0fb0 (accessed on 2 August 2020).
- Rao, D.N.; Ayirala, S.C.; Kulkarni, M.M.; Sharma, A.P. Development of Gas Assisted Gravity Drainage (GAGD) process for improved light oil recovery. In Proceedings of the SPE/DOE IOR Symposium, Tulsa, Oklahoma, 17–21 April 2004. [Google Scholar]
- Al-Mudhafar, W.; Rao, D.N. Lessons Learned from the Field-Scale Simulation of the Gas-Assisted Gravity Drainage (GAGD) Process in a Heterogeneous Sandstone Oil Reservoir. In Proceedings of the SPE Western Regional Meeting, Bakersfield, CA, USA, 23–25 April 2017. [Google Scholar]
- Dinh, H.K.; Le, N.V.; Peter, M.G.; Dang, T.S.; Nguyen, V.Q.; Hoang, N.D.; Truong, T.A.; Tran, H.M.; Nguyen, K.B.N. Gas-Assisted Gravity Drainage GAGD Huff n Puff Application for Fractured Basement Reservoir—Case Study. In Proceedings of the SPE/ATMI Asia Pacific Oil & Gas Conference, Jakarta, Indonesia, 8–12 October 2017. [Google Scholar]
- Loomis, A.G.; Crowell, D.C. Theory and Application of Dimensional and Inspectional Analysis to Model Study of Fluid Displacements in Porous Media; Report of Investigations 6546; US Dept of the Interior, Bureau of Mines: Washington, DC, USA, 1964.
- Gonzalez, D.L.; Mahmoodaghdam, E.; Lim, F.; Joshi, N. Effects of Gas Addition to Deepwater Gulf of Mexico Reservoir Oil: Experimental Investigation of Asphaltene Precipitation and Depositions. In Proceedings of the SPE ATCE, San Antonio, TX, USA, 8–10 October 2012. [Google Scholar]
- Huijgens, R.J.M.; Hagoort, J. Interfacial Tension of Nitrogen/Volatile Oil Systems. In Proceedings of the SPE ATCE, Houston, TX, USA, 9–13 October 1993. [Google Scholar]
- Deepwater Gulf of Mexico-America’s Expanding Frontier. Available online: http://www.geographic.org/deepwater_gulf_of_mexico/production_rates.html (accessed on 11 May 2020).
- Mahmoud, N.T.; Rao, D.N. Mechanisms and Performance Demonstration of the Gas-Assisted Gravity-Drainage Process Using Visual Models SPE-110132. In Proceedings of the SPE Annual Technical Conference and Exhibition, Anaheim, CA, USA, 11–14 November 2007. [Google Scholar]
- Cardwell, W.T.; Parsons, R.L. Gravity Drainage Theory. Pet. Technol. 1948, 179, 199–215. [Google Scholar] [CrossRef]
- Dykstra, H. The Prediction of Oil Recovery by Gravity Drainage. J. Pet. Technol. 1978, 30, 818–830. [Google Scholar] [CrossRef]
- Hagoort, J. Oil Recovery by Gravity Drainage. Soc. Pet. Eng. J. 1980, 20, 139–150. [Google Scholar] [CrossRef]
- Terwilliger, P.; Wilsey, L.; Hall, H.N.; Bridges, P.; Morse, R. An Experimental and Theoretical Investigation of Gravity Drainage Performance. J. Pet. Technol. 1951, 3, 285–296. [Google Scholar] [CrossRef]

Publisher’s Note: MDPI stays neutral with regard to jurisdictional claims in published maps and institutional affiliations. |
© 2021 by the authors. Licensee MDPI, Basel, Switzerland. This article is an open access article distributed under the terms and conditions of the Creative Commons Attribution (CC BY) license (http://creativecommons.org/licenses/by/4.0/).