Article

Penalty Electricity Price-Based Optimal Control for Distribution Networks

1
School of Information and Control Engineering, Qingdao University of Technology, Qingdao 266520, China
2
School of Electrical Engineering, Shandong University, Jinan 250061, China
3
School of Information and Electronic Engineering, Shandong Technology and Business University, Yantai 264005, China
*
Author to whom correspondence should be addressed.
Energies 2021, 14(7), 1806; https://doi.org/10.3390/en14071806
Submission received: 20 February 2021 / Revised: 19 March 2021 / Accepted: 22 March 2021 / Published: 24 March 2021
(This article belongs to the Section A1: Smart Grids and Microgrids)

Abstract

:
With the integration of large-scale renewable energy and the implementation of demand response, the complexity and volatility of distribution network operations are increasing. This has led to the inconsistency between the actual net power consumption of power users and their optimal dispatching orders. As a result, the distribution networks cannot operate according to their optimization strategy. The study proposed a penalty electricity price mechanism and the optimal control method based on this electricity price mechanism for distribution networks. First, we established the structure of the distribution network optimal control system. Second, aiming at the actual net power consumption (including power generation and consumption) of power users tracking their dispatching orders, we established a penalty electricity price mechanism. Third, we designed an optimal control strategy and process of distribution networks based on the penalty electricity price. Finally, we verified the proposed method by taking the IEEE-33 node system as an example. The verification results showed that the penalty electricity price could effectively limit the net power consumption fluctuations of power users to achieve optimal control of distribution networks.

1. Introduction

The only way to solve the energy crisis and global warming problems is to develop a sustainable energy strategy, in which renewable energy is the primary source [1]. An increasing proportion of the renewable energy generation in distribution networks is uncertain, and the reserve capacity of power grids is obviously insufficient. This insufficiency has resulted in a serious phenomenon of abandoning wind power (WP) and photovoltaic (PV) power, which has seriously limited the consumption of renewable energy [2]. The energy internet, which uses the power grid as the core, can ensure the horizontal complementarity of power, natural gas, and thermal energy as well as the vertical coordinated operation of the source-network-load-storage. Thus, it is an effective way to accommodate a high proportion of renewable energy sources [3,4,5,6,7,8]. The large number of fluctuating and flexible renewable energy generations has introduced opportunities and challenges to the modern power grid. On the one hand, the fluctuating renewable energy generations and loads make the real-time dispatching of power grids particularly difficult, and cause extra degradation in the distribution grid’s cable network [9,10,11]; on the other hand, the flexible energy conversion devices and loads, such as energy storage equipment, electricity-to-gas equipment, cogeneration units, and demand-side response, have improved the flexibility of power grid real-time dispatching [12,13]. To take full advantage of the energy internet and ensure the power supply and demand balance of distribution networks with a high penetration of renewable energy, it is essential to study the optimal control of distribution networks under the backdrop of energy internet [14].
In recent years, optimal control of power grids in the energy internet has become a hot topic, and many achievements have emerged. To minimize the total cost of the power supply chain, a hierarchical optimal control strategy for energy internet was proposed in [14]. Dong et al. [15] established a coordinated scheduling model with an optimization objective that maximizes the profit of the power system which efficiently balanced economy and flexibility in optimizing WP and PV consumption. Sun et al. [16] built a multi-stage energy scheduling model for microgrids (MGs) based on a multi-agent system (MAS). In the upper layer, the mixed-integer linear programming (MILP) method was used to optimize the internal operation problem of each agent. In the lower layer, the particle swarm optimization (PSO) algorithm was applied to realize the coordination optimization of MGs. Shi et al. [17] presented a hierarchical model predictive power dispatch and control strategy for modern power systems with price-elastic controllable loads in energy internet. Lan et al. [18] developed a support vector machine-based energy management approach in renewable MGs. Zafar et al. [19] proposed a second-order cone programming and semidefinite programming models in order to solve the multiperiod optimal control problem of unbalanced three-phase distribution grids with battery energy storage systems. Aiming to minimize the grid operation cost and maximize the renewable energy utilization rate, these achievements realized the optimal dispatching of the power grid in the energy internet. Most renewable energy generations and flexible loads could not be controlled directly by the control center of distribution networks, which resulted in the failure of optimal control strategies. Zhang et al. [20] proposed a model predictive control-based integrated optimal dispatch method for a micro-energy grid. Muqeet et al. [21] discussed an energy management system strategy for campus prosumer microgrid to reduce its operational cost and increase its self-consumption from green distributed generators. Alfaverh et al. [22] designed a residential load management mechanism based on the incorporation of energy resources. Dinh et al. [23] developed a home energy management systems (HEMS) with renewable energy and energy storage to control and schedule every electrical device. Although these studies achieved the direct load control and cost minimization for end users, they could not meet the optimal dispatching of the power grid. Control centers, power generation companies and power consumers are economic entities with different interests, and each economic entity has its own control strategy to maximize its interests. Thus, it is impossible for power consumers to control their electrical equipment according to the optimal dispatching strategy of power grids. As a result, it has not been possible to implement the optimal dispatching strategy of power grids. The power market is the best way to coordinate the economic entities in the power system [24]. Thus, in the context of the power market, research to control power users to generate or consume electricity according to the optimal dispatching strategy of power grids has become indispensable.
Although different countries adopt different power market models, the electricity price is the most effective means to guide the power generation and consumption behaviors of various economic entities in the power market [25]. Electricity price policy mainly includes marginal pricing [26], time-of-use pricing (TOU) [27,28,29], and real-time pricing (RTP) [30,31,32,33]. TOU and RTP can realize peak cutting and valley filling and have been applied widely in power grids to encourage users’ active participation in demand response (DR). Zhang et al. [27] proposed a dynamic TOU pricing strategy for electric vehicle charging considering the degree of user satisfaction and realized the effective dispatching of electric vehicle charging load based on price signals. This study applied only to electric vehicle charging loads. Zhou et al. [28] presented an optimization model of TOU pricing for the user-side microgrid from the perspective of power supply chain management. Results showed that it minimized the total cost of the power supply chain and optimized the charging–discharging behaviors of end users. Hung et al. [29] discussed a general stochastic modeling framework for consumers’ power demand based on which customers could select their TOU contract to minimize their mean electricity price. Yao et al. [30] proposed a fuzzy controller for the HEMS to optimally manage the integrated power of the smart home. Tao et al. [31] focused on the smart grid with the integration of distributed energy and storage devices and formulated a related RTP as a noncooperative game. Zhang et al. [32] proposed a novel real-time distributed market framework at the distribution grid level based on which each region maximized its individual social welfare.
These researches have shown that TOU and RTP can encourage customers’ participation in demand-side management (DSM) in response to dynamic electricity price and effectively reduced peak load, balanced supply and demand, and enhance the welfare of users and providers. TOU and RTP, however, are formulated according to the aggregate consumption level of the power grid, and all users must adopt the global electricity price irrespective of users’ individualized energy consumption patterns. Because these electricity prices cannot be set according to users’ contribution to the grid, they fail to suitably incentivize users to participate in DSM. Rasheed et al. [34] proposed a dynamic pricing mechanism on the basis of users’ consumption level rather than aggregate basis. The individualized price profiles for each user were constructed based on a day-ahead price information and load demand and consumption variation of associated users. This pricing mechanism incentivized users to participate in DSM to a certain extent. Because the electricity price increased with the increase in the electricity consumption of users, it was unfair to heavy-load users. Furthermore, the utility company encouraged customers to increase their electricity power consumption during valley periods.
An optimal dispatching strategy of the whole power grid has been formulated in many previous studies. If the optimal dispatching strategy is divided into the optimal dispatching orders of each user, and if each user consumes or generates power according to its optimal dispatching order, the whole power grid can operate according to the optimal dispatching strategy to minimize peak–valley differences and power loss and maximize consumption of renewable energy. Each user is an independent economic entity, which cannot be directly controlled by the control center of a utility company. Thus, it has become indispensable to identify a novel electricity pricing mechanism that can control each power user’s power consumption and generation patterns to meet its optimal dispatching order. Thus, we have proposed a penalty electricity price mechanism and optimal control method for distribution networks.
The contribution of this work is summarized as follows.
  • We proposed a penalty electricity price mechanism calculated on the basis of the deviation between the actual net power consumption of each user and its optimal dispatching order. The purpose of the penalty electricity price is to guide each user to control its power consumption and generation behaviors in accordance with the optimal dispatching order.
  • We developed an optimal control strategy of distribution networks based on the penalty electricity price according to the optimal object, and the implementation process of the control strategy was designed.
  • We verified the proposed optimal control based on the penalty electricity price for distribution networks by taking the IEEE-33 node system as an example. The simulation results verified the effectiveness of the proposed penalty electricity price.
  • We compared the proposed penalty electricity price mechanism with a credit electricity price by simulating in the IEEE33 node system to prove the advantages of the proposed penalty electricity price.
The remainder of this paper is organized as follows. Section 2 analyzes the problems of traditional real-time pricing. Section 3 provides the structure of the distribution network optimal control system. Section 4 proposes the penalty electricity price-based optimal control mechanism for distribution networks. Section 5 discusses the simulations and results. Section 6 presents the conclusion and future work.

2. Problem of Traditional Real-Time Pricing

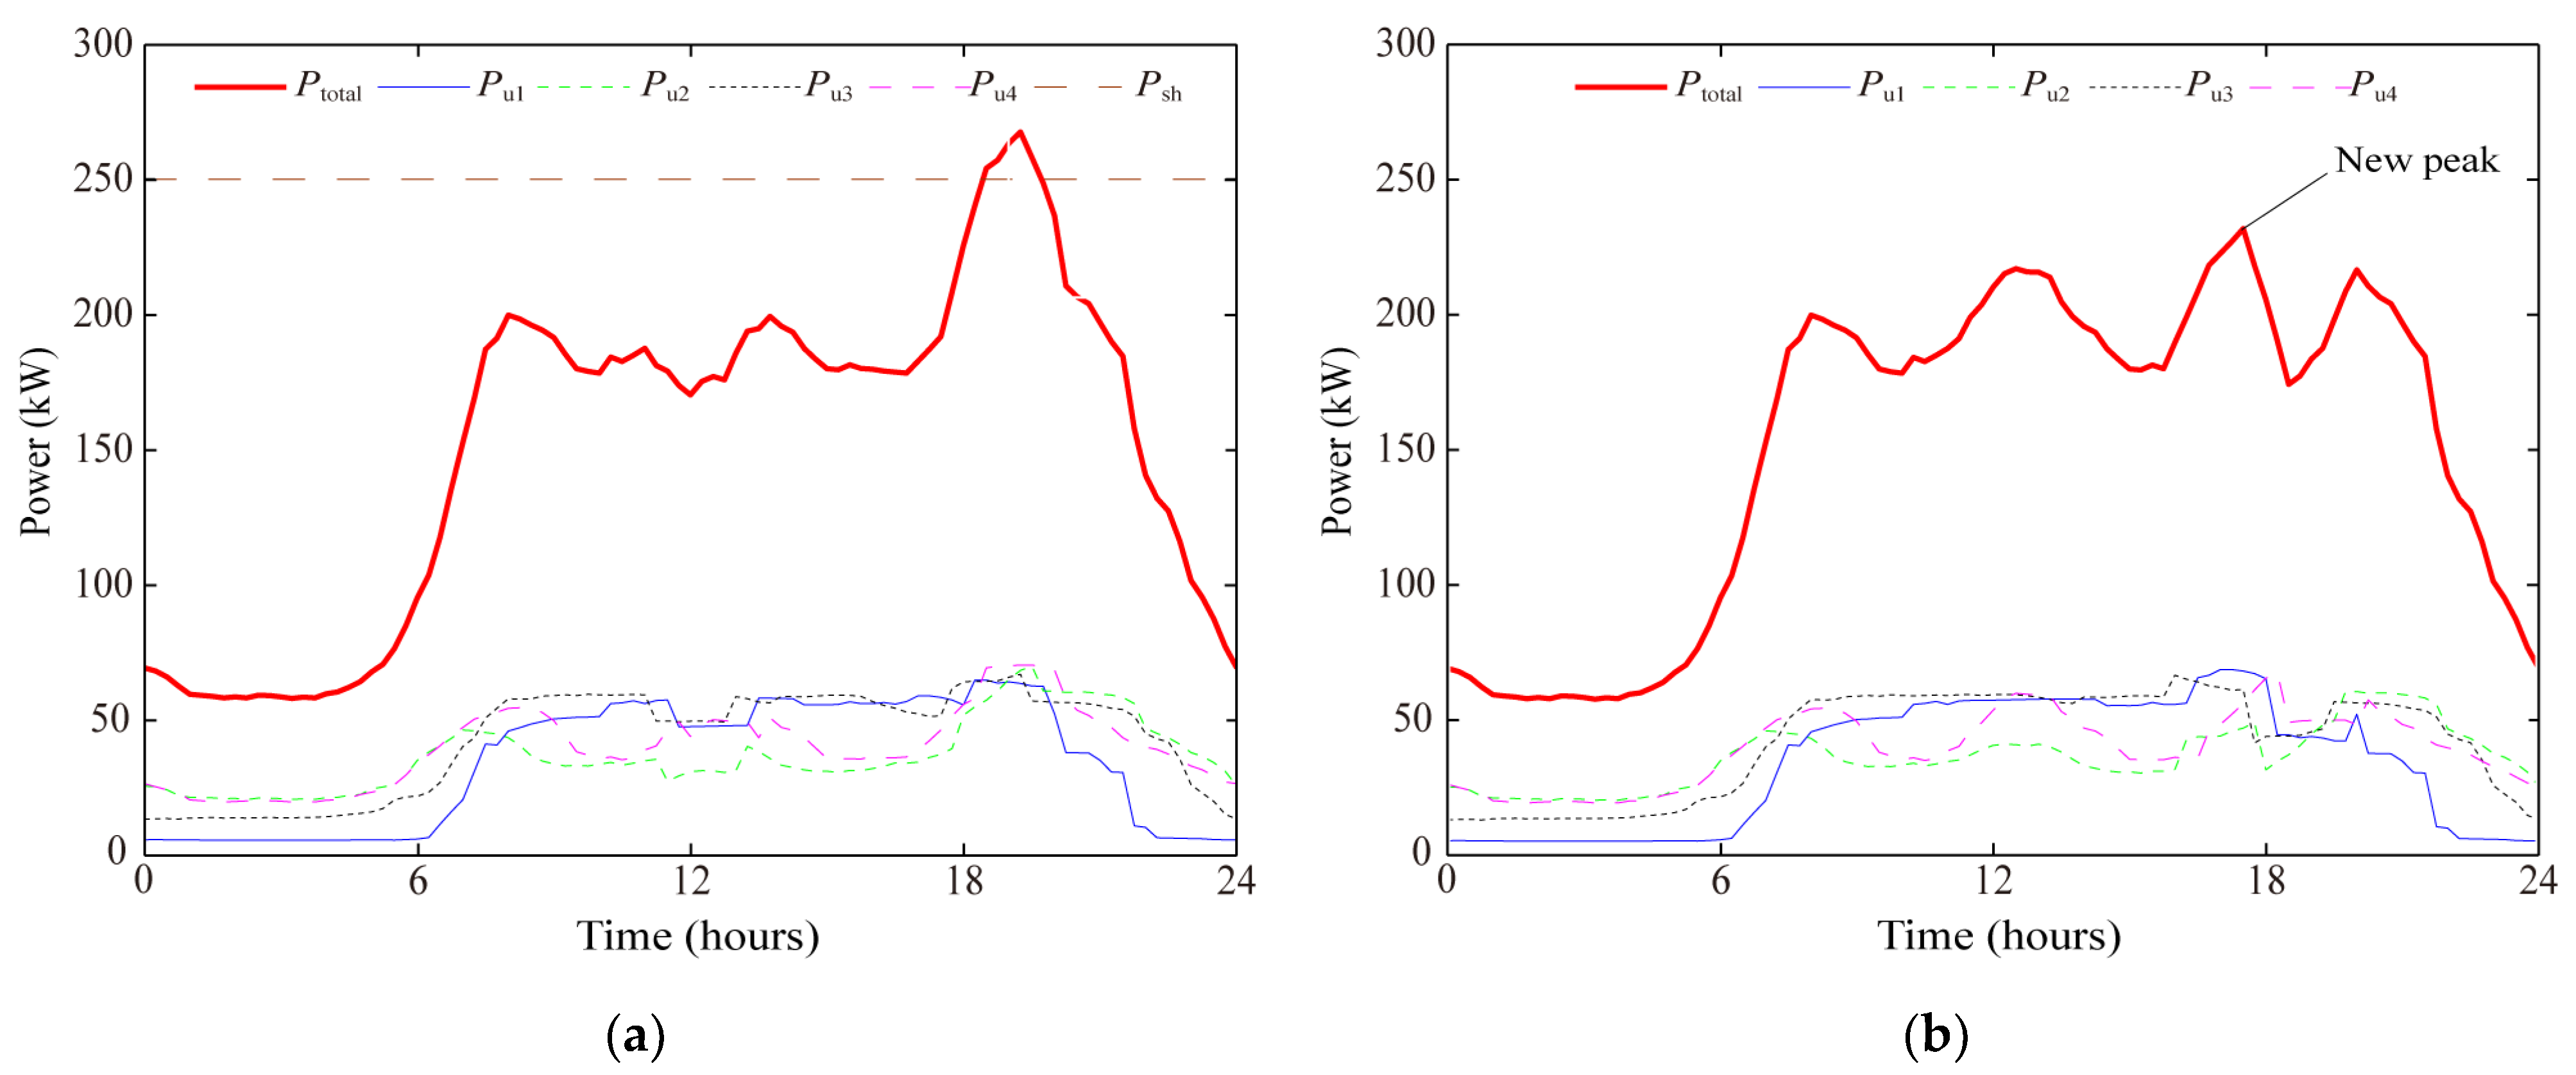
The current real-time pricing is a kind of day-ahead electricity price that changes with time. It is formulated by the utility company according to the aggregate load forecast of power grids for the next day and is announced to users on a day-ahead basis. The purpose of this type of pricing is to realize peak cutting and valley filling. In the day-ahead economic energy management stage, the reduction of the daily operation cost of power grids is comprehensively considered by the utility company. At this stage, however, the users’ loads are random. There is no guarantee that users will manage their loads according to the predicted load profiles. The users, for example, might not shift their loads from high-price time periods to low-price time periods. As a result, the aggregate power consumption profile cannot be smoothed. Furthermore, loads exceed the threshold or form new peaks. Consider, for example, a simple distribution network with four power users. The day-ahead real-time pricing is shown in Figure 1, and the forecasted load profiles of the power grid and users for the next day are shown in Figure 2, where Ptotal is the total power and Pu1, Pu2, Pu3 and Pu4 are the power of user 1, user 2, user 3 and user 4, respectively. If the actual power consumption profiles of the power grid and users occur as shown in Figure 3, the real-time pricing cannot play its due role. As shown in Figure 3a, if the power in the peak period increased and exceeded the threshold, it would seriously affect the system stability. As shown in Figure 3b, a new peak in the power consumption profile would also disturb system stability. To overcome these problems, the traditional real-time pricing mechanism must be improved.

3. Energy Optimal Control System

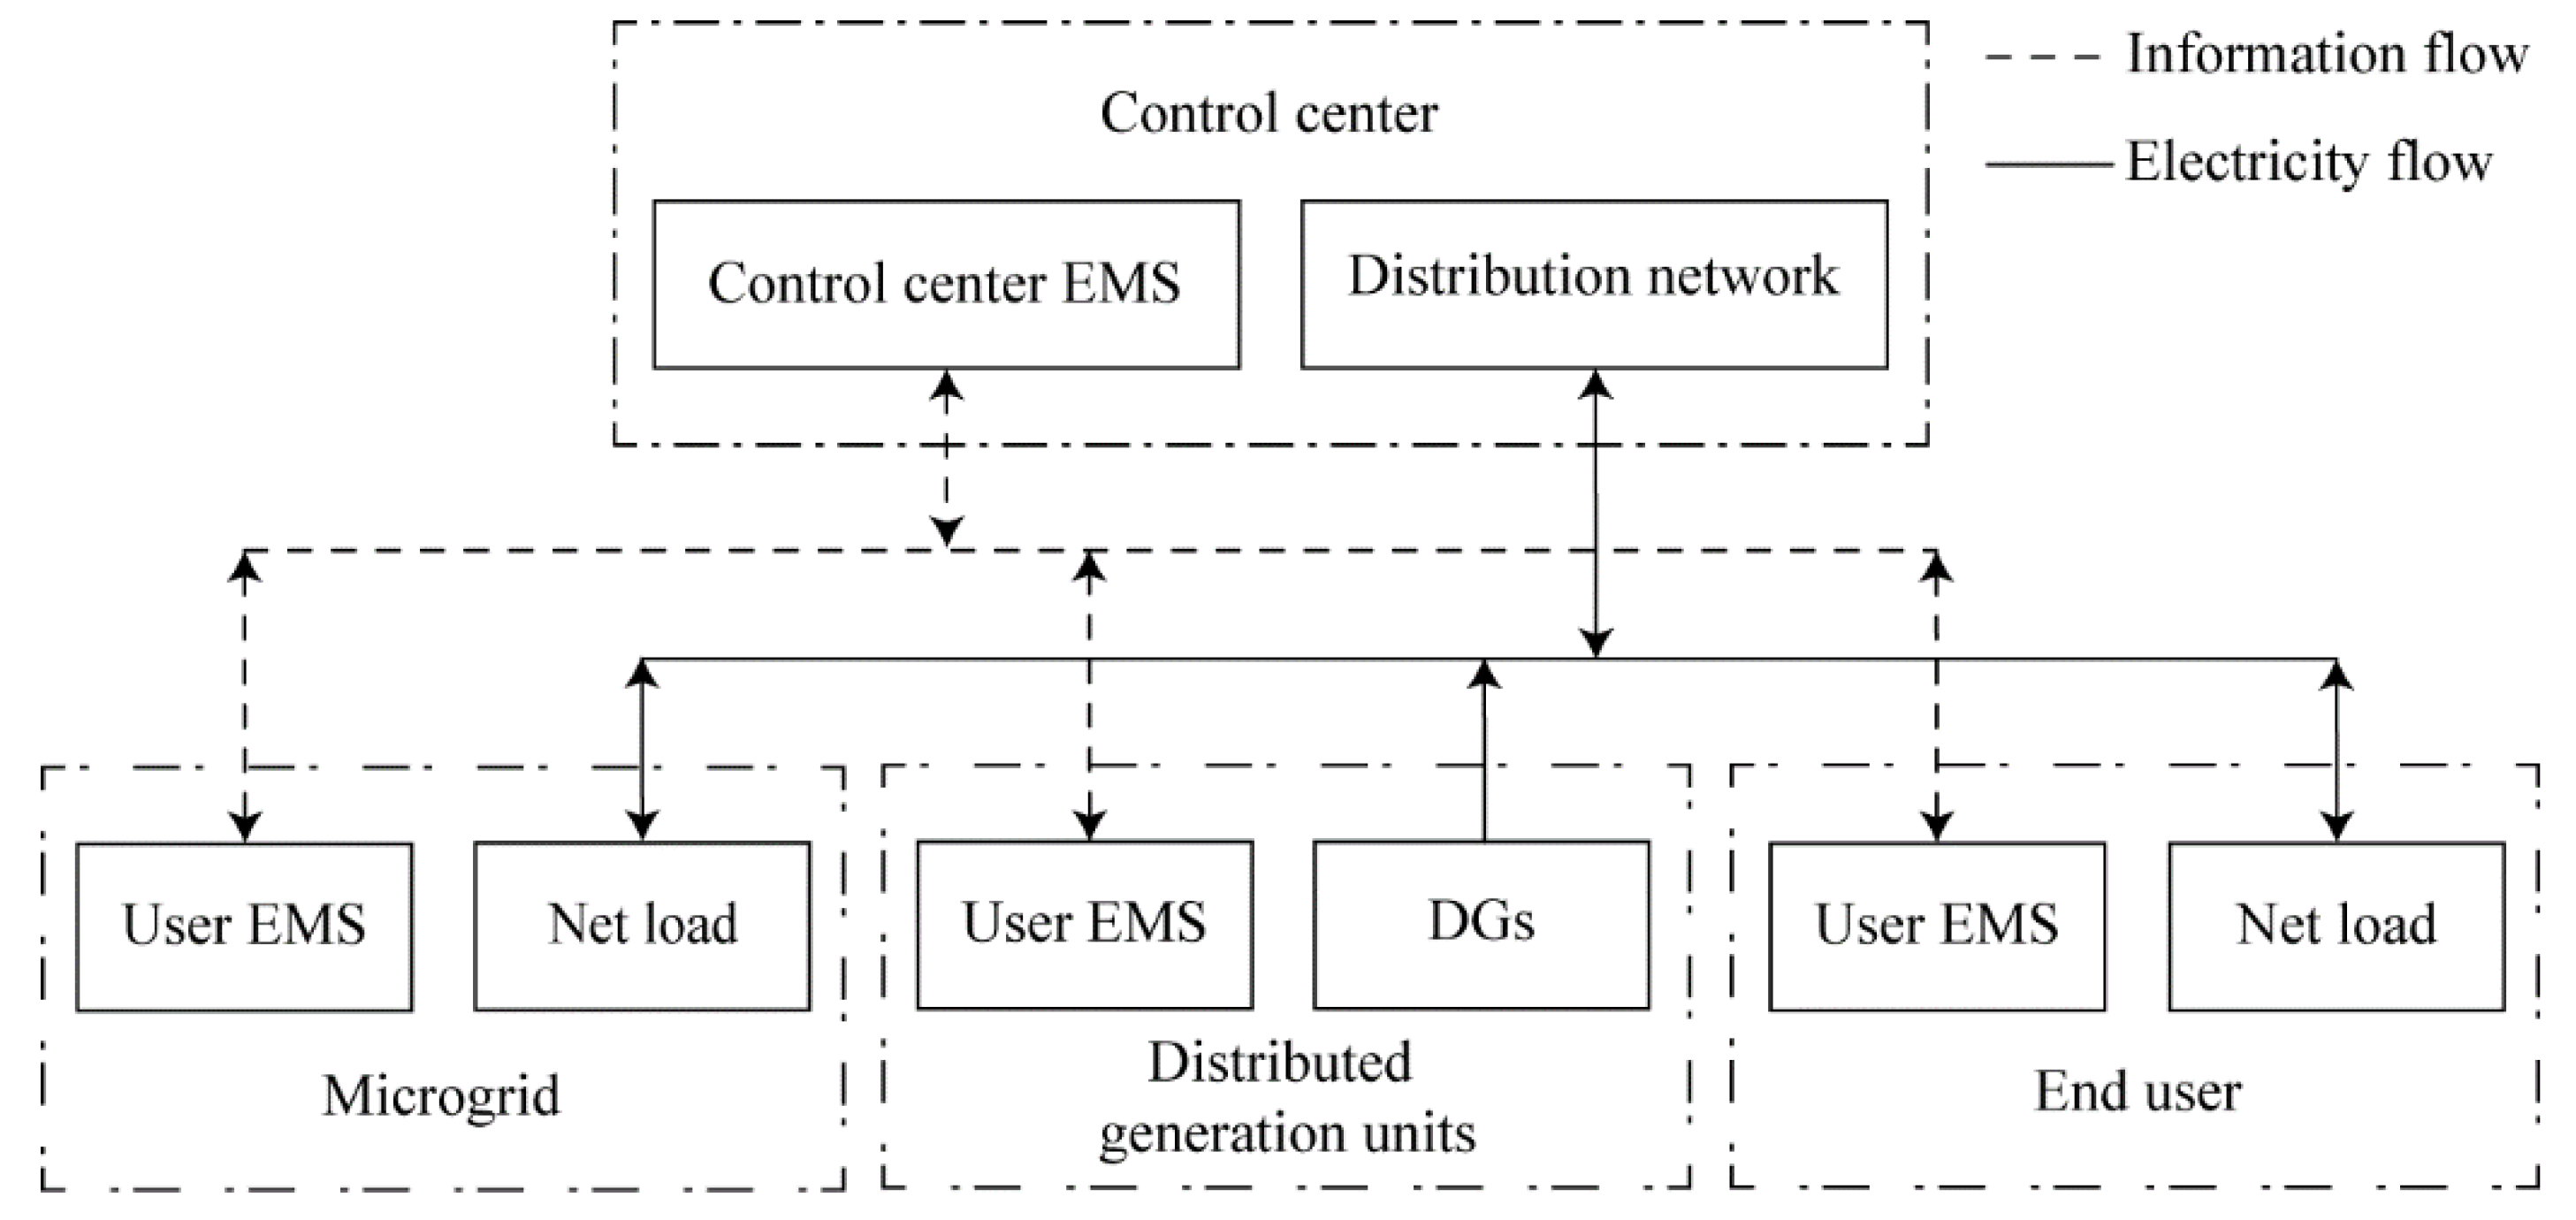
The structure of the distribution network optimal control system is shown in Figure 4. The system is composed of power users and a control center that is affiliated with a utility company. They can interact with each other through the control center energy management system (EMS) in the main station and the user EMS in the user terminal. Power users include microgrids, distributed generation units, and power end users, and a microgrid, a generating unit or a power end user can be considered as a power end user. They each can generate electricity and transmit power to the power grid, or they can consume power from the power grid. For simplicity, we defined the generated power and consumed power for power users as negative power consumption and positive power consumption, respectively, and called the sum of negative power consumption and positive power consumption “net power consumption”. If the net power consumption for a power user was positive, it meant that the power user consumed electric power; otherwise, it meant that the power user generated electric power. We defined all the electrical equipment of power generation and consumption of a power user as “net load.” Power users participated in the optimal control of energy in the distribution network by changing their net power consumption behavior.
Each power user forecasted its net loads and uploaded it to the control center. According to the net load forecast reported by each power user, the control center formulated the day-ahead real-time pricing, which was broadcasted in the power grid. The power user designed its net power consumption plan to maximize its benefits according to the day-ahead real-time pricing and then uploaded it to the control center. According to the power consumption plans of all users, the control center formulated the aggregate optimal dispatching order for the distribution network to balance the supply and demand and maximize its benefits, and divided the aggregate optimal dispatching order into optimal dispatching orders for each power user, and then transmitted them to the power users. The power user changed its power consumption behaviors to meet its optimal dispatching order and reported their actual net power consumption to the control center. The control center formulated a penalty electricity price and bills for each user and transmitted them to power users.

4. Penalty Electricity Price-Based Optimal Control

4.1. Penalty Electricity Price Mechanism

To limit each power user to its optimal dispatching order, when its net power consumption deviated from its optimal dispatching order, the power user would be penalized, and a penalty electricity price was applied to the deviations. The penalty electricity price was formulated by considering the net power consumption deviations and the day-ahead real-time pricing; the larger the deviations and the higher the day-ahead real-time pricing, the higher the penalty electricity price. Therefore, the penalty electricity price is defined as follows:
ρ pen ( t ) = { k pen ρ rt ( t ) P pen ( t ) % ,   ρ pen ( t ) ρ max pen ρ max pen ,   ρ pen ( t ) > ρ max pen ,
where ρpen(t) is the penalty electricity price sequence of the power user; kpen is the penalty electricity price coefficient; ρrt(t) is the day-ahead real-time pricing sequence; ρ max pen is the maximum penalty electricity price; and Ppen(t)% is the penalty power percentage sequence, which can be calculated according to the following equation:
P pen ( t ) % = { 0 , P pen ( t ) k thr P ord ( t ) P pen ( t ) | P ord ( t ) | , P pen ( t ) > k thr P ord ( t ) ,
where kthr is the penalty power threshold coefficient; the coefficient can ensure that the power user will not be penalized when the deviation is small, because the small deviation belongs to the normal fluctuation of net power consumption; Pord(t) is the optimal dispatching order sequence; and Ppen(t) is the penalty power sequence, which can be calculated using the following equation:
P pen ( t ) = | P act ( t ) P ord ( t ) | ,
where Pact(t) is the actual net power consumption sequence.
In a certain time period T, the cost of penalty power consumption for power user Cpen,T is calculated as follows:
C pen , T = n = 0 N 1 ρ pen ( n Δ t ) P pen ( n Δ t ) Δ t ,
where ∆t is the time interval of electricity price, and N is the number of time intervals divided by time period T, N = T/∆t.
According to the penalty electricity price and day-ahead real-time pricing, the total power consumption cost of a power user in one day Ctot,D is calculated as follows:
C tot , D = n = 0 N 1 ( ρ rt ( n Δ t ) P act ( n Δ t ) + ρ pen ( n Δ t ) P pen ( n Δ t ) ) Δ t .
Under the effect of penalty electricity price, the power users actively controlled their net power consumption behaviors for their own benefit. Their actual net power consumption could track their optimal dispatching order, thus ensuring the optimal operation of the distribution network.

4.2. Optimal Control for Control Center

The optimal dispatching orders of all power users in the distribution network constituted the aggregate optimal dispatching order of the distribution network. When the actual net power consumption of the distribution network was consistent with the aggregate optimal dispatching order, the efficiency of the distribution network was at the highest level. Therefore, the optimal objective of net power consumption for the control center is as follows:
min Δ P σ = min ( t = 0 24 | P σ act ( t ) P σ ord ( t ) | ) ,
where ΔPσ is the cumulative deviation between the actual net power consumption sequence P σ act ( t ) and the aggregate optimal dispatching order sequence P σ ord ( t ) for the distribution networks during the day. P σ act ( t ) and P σ ord ( t ) are calculated as follows:
P σ act ( t ) = i = 1 M P i act ( t ) ,
P σ ord ( t ) = i = 1 M P i ord ( t ) ,
where P i act ( t ) is the actual net power consumption sequence of the power user i; P i ord ( t ) is the optimal dispatching order sequence of the power user i; and M is the number of power users in the distribution network.
The control center broadcasted the penalty electricity price mechanism in the distribution network, and sent each power user its optimal dispatching order. With the help of the penalty electricity price mechanism, the control center controlled each power user to consume power according to its optimal dispatching order, so that the whole distribution network can operate according to the optimal dispatching strategy.

4.3. Optimal Control for Power User

Under the penalty electricity price mechanism, the power users controlled their loads to make their actual net power consumptions consistent with their optimal dispatching orders to reduce their electricity cost. Therefore, the power user control system was designed as shown in Figure 5. The net power consumption optimization objective of the controller is as follows:
min Δ P i = min ( t = 0 24 | P i act ( t ) P i ord ( t ) | ) ,
where ΔPi is the cumulative deviation between the actual net power consumption sequence P i act ( t ) and the optimal dispatching order sequence P i ord ( t ) of the power user i. The control strategy ui(t) can be determined as follows:
u i ( t ) = f ( P i ord ( t ) , P i dem ( t ) , ρ rt ( t ) , ρ i pen ( t ) ) ,
where P i dem ( t ) is the net power consumption demand sequence of the power user i; ρ i pen ( t ) is the penalty electricity price of the power user i; and f ( · ) is a function of the actual net power consumption strategy of the power user i.

4.4. Optimal Control Algorithm Based on Penalty Electricity Price

The optimal control algorithm process of distribution networks based on penalty electricity price can be described as follows:
  • Step 1: Power users made their day-ahead net power load forecast and reported them to the control center.
  • Step 2: The control center formulated the day-ahead real-time pricing based on the net power load forecasts of all power users and communicated it to power users in the distribution network.
  • Step 3: Power users developed their net power consumption plans over a day and reported them to the control center.
  • Step 4: The control center formulated the optimal dispatching order for each power user according to user’s net power consumption plans and provided it to each power user.
  • Step 5: The power user controlled its actual power consumption to meet its optimal dispatching order by changing its power consumption patterns and reported its actual power consumption to the control center.
  • Step 6: The control center formulated penalty electricity price for each user according to the actual power consumption deviations and transmitted the bills to users.

5. Simulation and Discussion

5.1. Simulation Model of Distribution Networks

This paper used the IEEE33 bus distribution system to verify the optimal control algorithm. The structure of this distribution system is shown in Figure 6, and the node data are given in Baran et al. [35]. Seven, six, and four wind turbines were installed at node 3, 14, and 23, respectively, and the rated capacity of each wind turbine was 100 kW. Two, three, and four PV units are installed at nodes 10, 20, and 29, respectively, and the rated capacity of a single PV unit was also 100 kW.
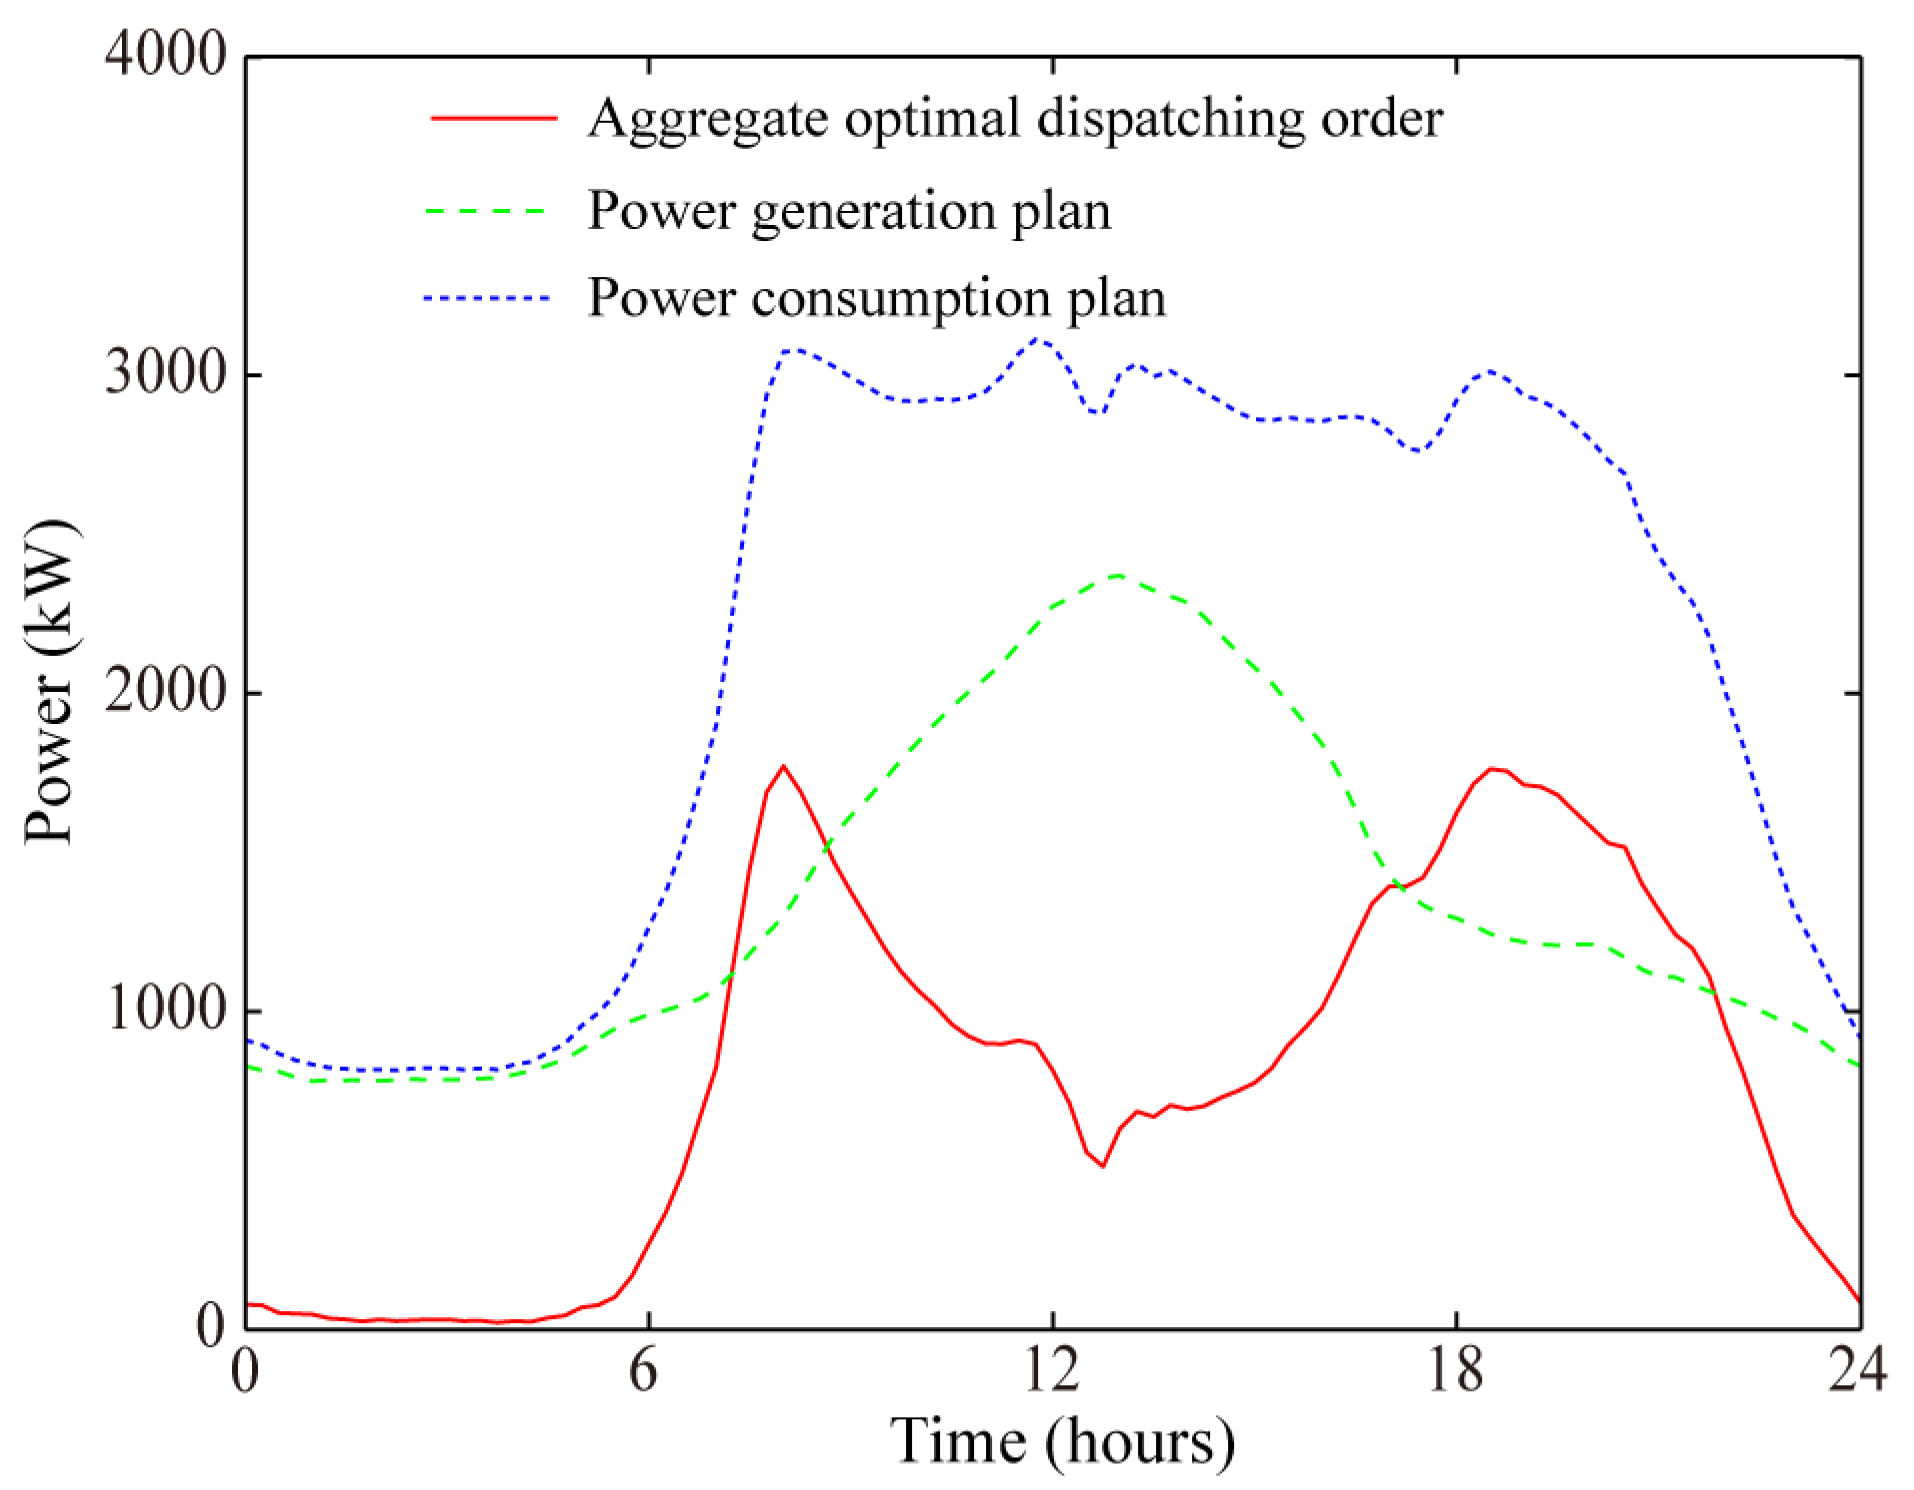
We regarded the microgrid, generating unit or power end user at each node in the distribution system as a power user, and the day-ahead net power load forecast was sent to the control center. The control center formulated the day-ahead real-time pricing based on the aggregate day-ahead net power load forecast of all power users and the generation forecast for the distribution network, as shown in Figure 7. Power users developed their net power consumption plans over a day and reported them to the control center. The control center formulated the generation plan, power consumption plan, and aggregate optimal dispatching order of the distribution network, as shown in Figure 8. The control center simultaneously developed the optimal dispatching order for each power user. The power consumption dispatching orders and the distributed generation dispatching orders are shown in Figure 9. In these figures, N represented the node, WP represented the wind power, and PV represented the photovoltaic. These dispatching orders were transmitted to the power users.

5.2. Simulation of Penalty Electricity Price

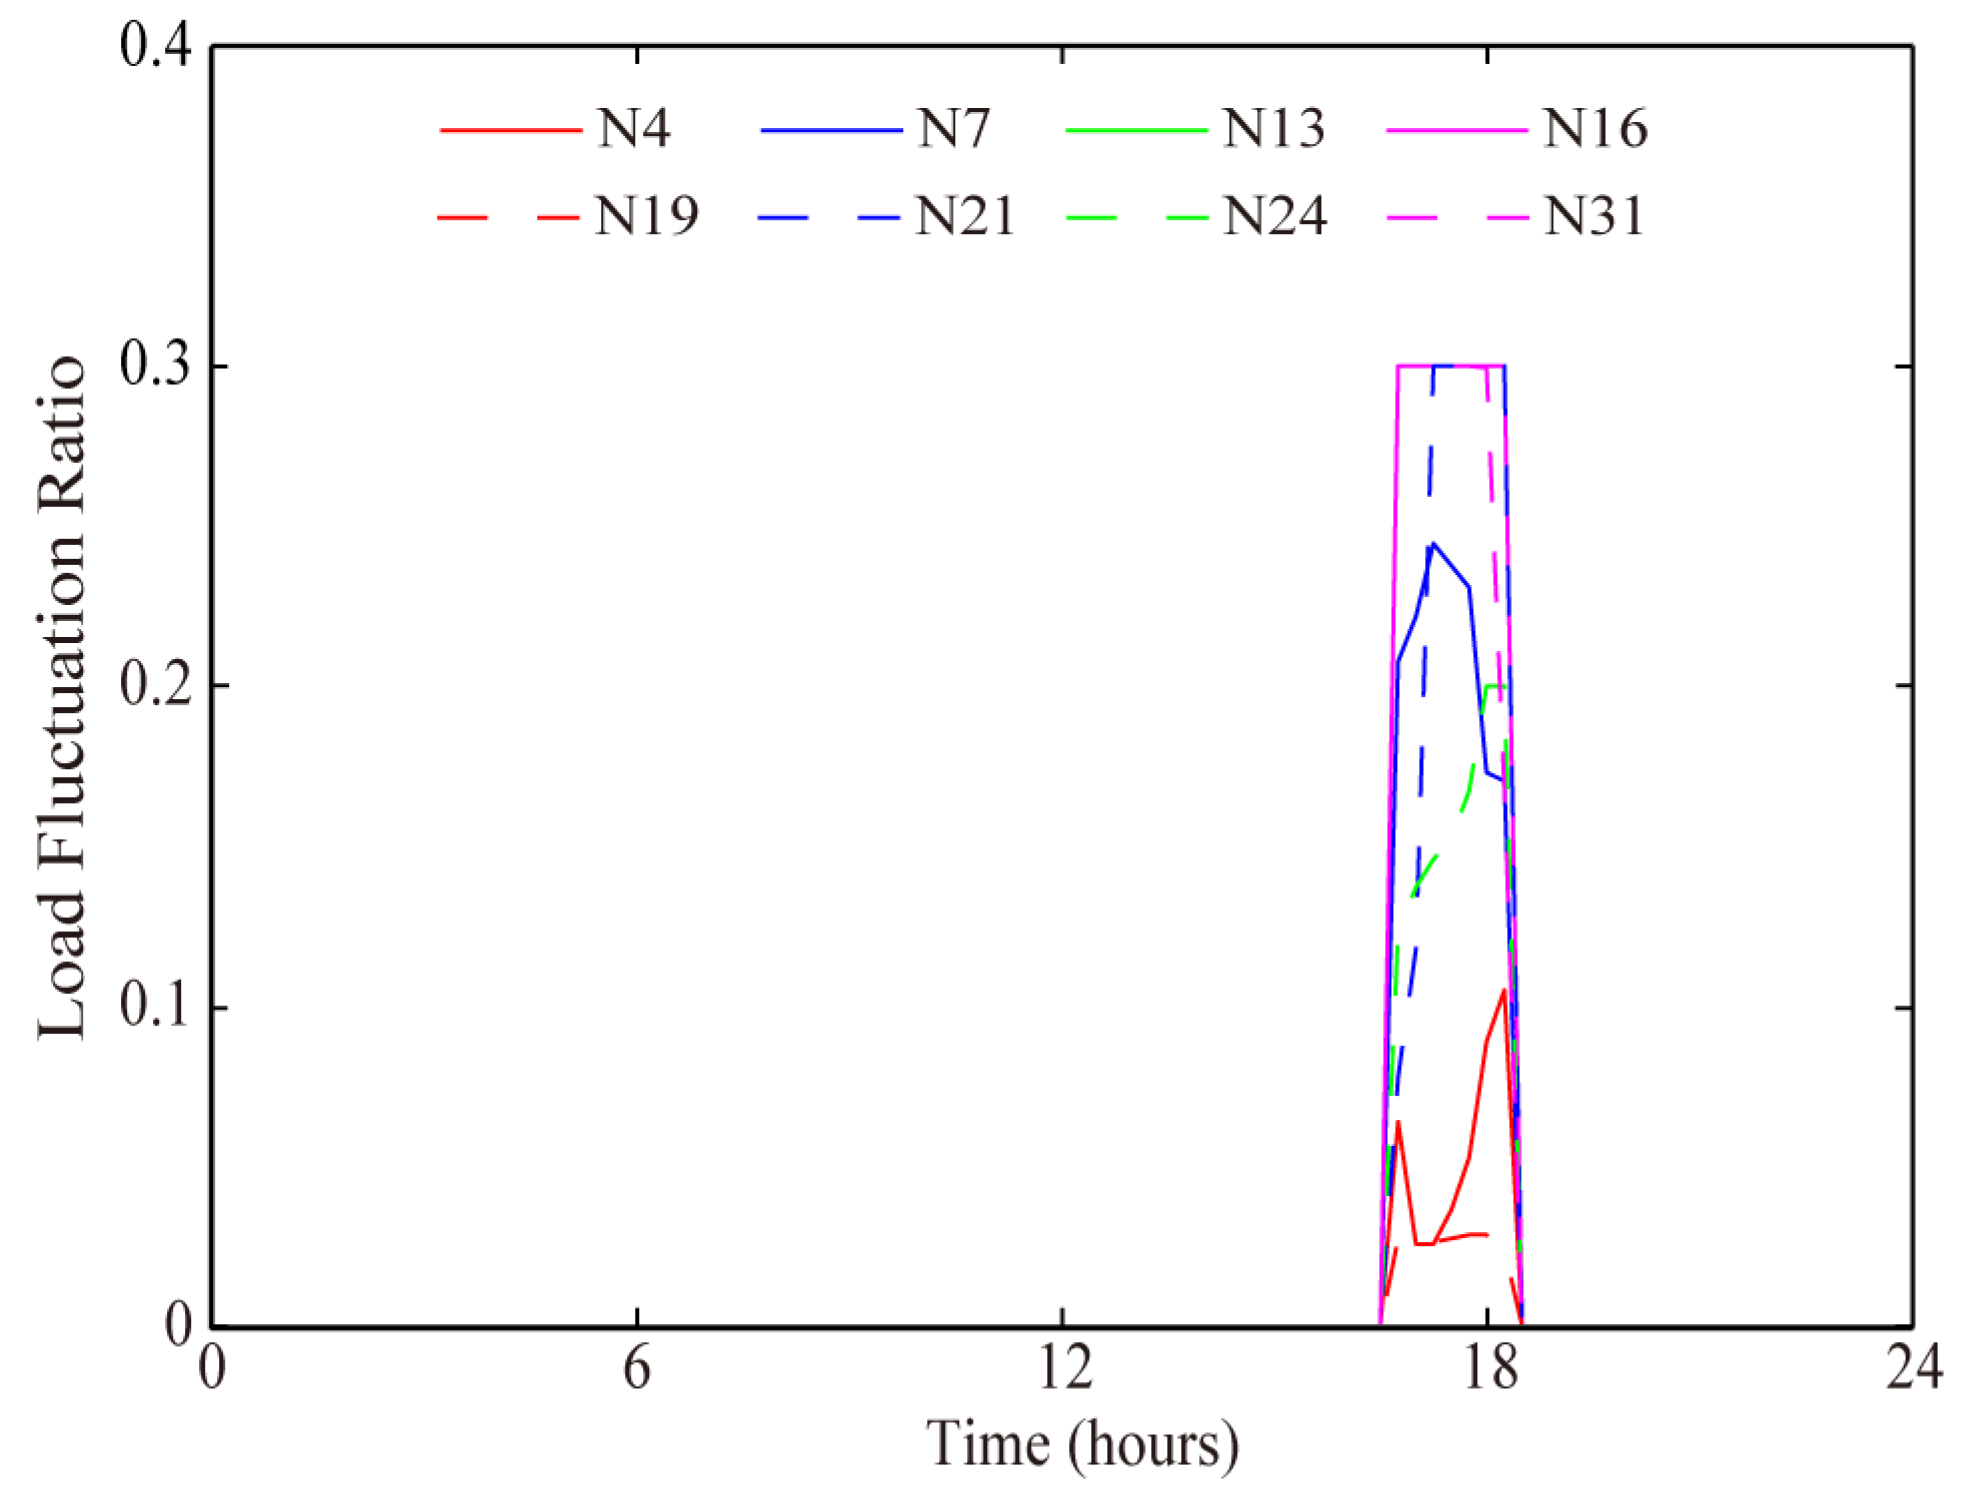
In the actual operation, each node had a random load fluctuation, which was less than 3% of the dispatching order, kthr = 3%. We adopted the day-ahead real-time pricing policy for the power consumption of power users. We assumed that the large load fluctuations of power users at nodes 4, 7, 13, 16, 19, 21, 24, and 31 from 6:00 p.m. to 7:30 p.m. exceeded their penalty power threshold; the load fluctuation ratios are shown in Figure 10. These large load fluctuations resulted in the actual aggregate power consumption of the distribution system exceeding its optimal dispatching order, as shown in Figure 11.
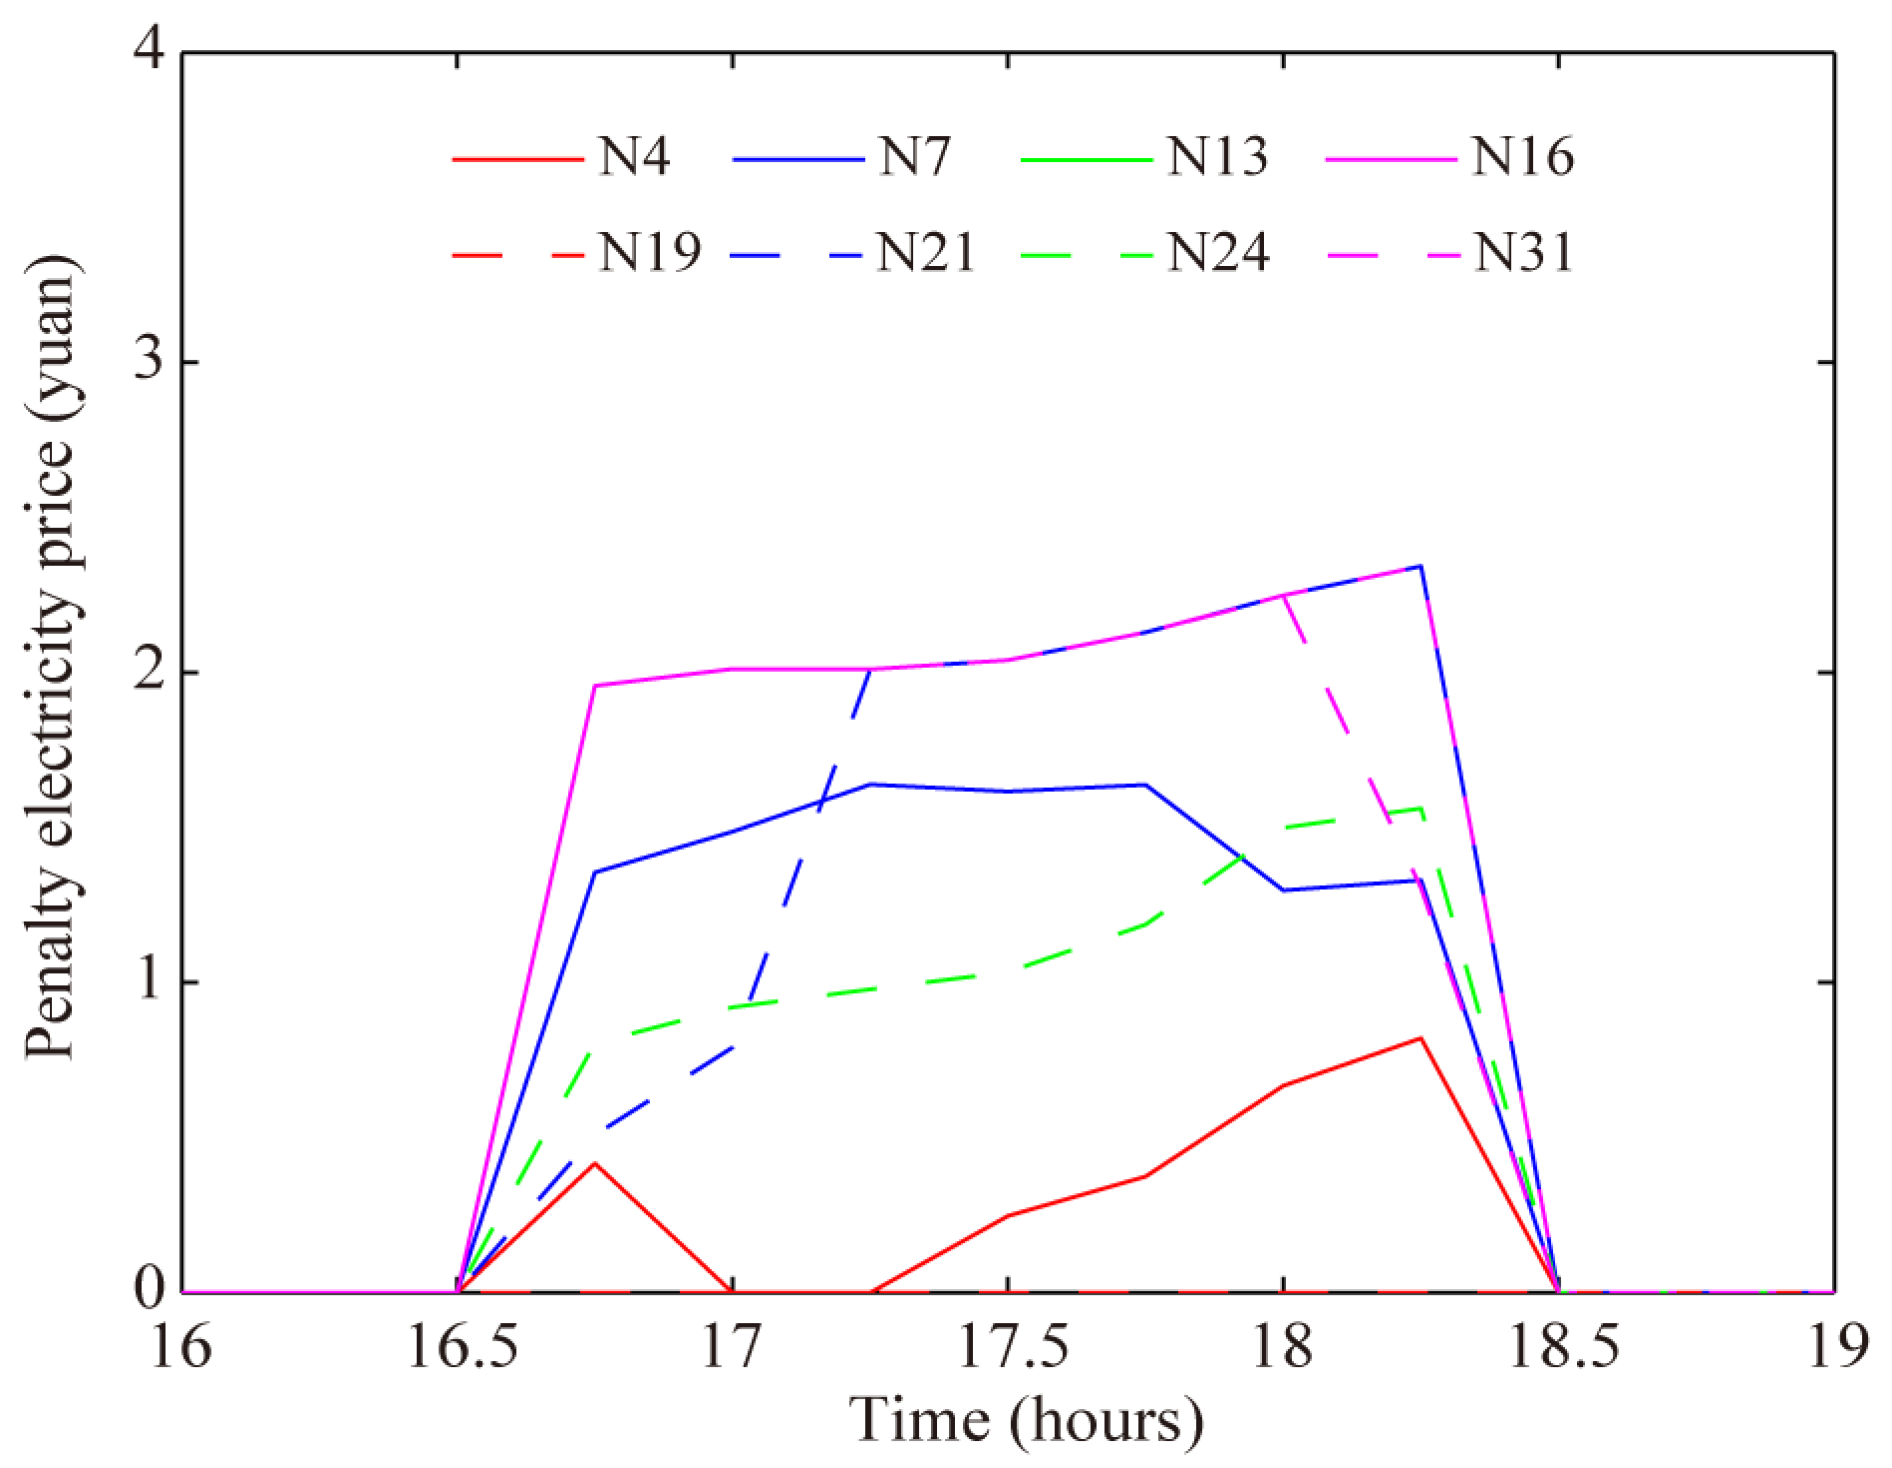
The control center adopted the penalty electricity price mechanism for the electric power beyond this threshold. If kpen = 10, the penalty electricity price of each node could be formulated, as shown in Figure 12. It could be seen from the figure that the larger the load fluctuation ratio, the higher the penalty electricity price.

5.3. Simulation of Optimal Control

In the above case, if these users did not take any control measures on their electrical equipment, they would need to pay extra penalty electricity charges on the basis of the original day-ahead real-time pricing charges. The penalty electricity charges paid by these users are shown in Figure 13. To avoid paying extra electricity charges, these users controlled their power equipment to make their power consumption consistent with their dispatching order. PID controller was used and the transfer function of controlled object was set to G(s) = 200/(s(0.5s + 1)) in the power user control system; the aggregate power consumption profiles of these power users after control are shown in Figure 14, where CP was the controlled power consumption and UCP was the uncontrolled power consumption and DO was the power dispatching order. It could be seen from the figure that the controlled power consumption of these power users could accurately track their power consumption dispatching order. After control, the extra penalty electricity charges are shown as in Figure 13; these power users would need to pay very little for penalty electricity charges. The aggregate power consumption profile of the distribution system after control is shown in Figure 11. Figure 11 shows that the aggregate power consumption profile of the distribution system after control was basically consistent with its aggregate power consumption order profile. This alignment with consumption ensured that the whole distribution network operated in accordance with the optimal dispatching strategy.

5.4. Comparison Between Penalty Electricity Price and Credit Electricity Price

To further verify the advantages of the penalty price, we compared the penalty electricity price with the real-time electricity price based on power credit (credit electricity price) in Sun et al. [36]. It remained true that the power consumption at nodes 4, 7, 13, 16, 19, 21, 24, and 31 exceeded their dispatching order, as discussed in Section 5.2. The proportions of the actual consumed powers of node 7 and node 31 that exceeded their dispatching orders are shown in Figure 15. We used the penalty price method and credit price method to formulate the floating real-time electricity price respectively. The penalty electricity price and credit electricity price corresponding to node 7 and node 31 are shown in Figure 16. Figure 15 showed that the proportion of the actual consumed power exceeding the dispatching order of node 31 was larger than that of node 7, thus the floating real-time electricity price of node 31 should be higher than node 7. Whereas, the credit electricity price of node 7 was higher than node 31 as shown in Figure 16, which was impractical. The penalty electricity price proposed in this paper truly reflected the proportion of users’ actual consumed power that exceeded the dispatching order, which was consistent with the actual situation.
The random fluctuation of the user loads in other periods was a common phenomenon. The fluctuation did not affect the penalty electricity prices, and the penalty electricity prices under the random fluctuation are shown in Figure 17. The credit electricity prices, however, were significantly affected by the random fluctuation, and the degree of effect was also different for different fluctuations. Figure 18 shows the credit prices affected by the two kinds of random fluctuations. These figures show that when there were random fluctuations of user loads, the credit electricity price changed greatly and was unstable, and it was difficult to apply, whereas the proposed penalty electricity price was robust and easy to apply.
The simulation results showed that the power users who generated and consumed electricity power that deviated from their dispatching orders were penalized. To reduce electricity expenses, the power users adjust their power consumption behaviors to meet their optimal dispatching order. Thus, the distribution network could operate according to its optimal dispatching strategy to support the grid balancing of supply and demand to reduce the cost of the entire electric power supply chain.
Power users can freely choose between the penalty electricity price mechanism and the traditional real-time price mechanism. To encourage the power users to adopt the penalty price mechanism, the real-time price in the penalty electricity price mechanism can be set to be lower than the traditional real-time price, the electricity expenses of the power users using the penalty electricity price mechanism will be lower than that using the traditional real-time price mechanism when they consume power according to their optimal dispatching orders. Thus, power users are willing to accept the penalty electricity price mechanism. Meanwhile, the penalty electricity price mechanism will help the balance of supply and demand and reduce the power supply cost of the power grid in different market modes. The penalty pricing mechanism can be applied to all countries that implement the real-time pricing policy.

6. Conclusions

In this paper, we proposed a penalty electricity price to encourage power users to participate in the optimal control of distribution networks. The penalty electricity price limited net power consumption of the power user on the basis of its optimal dispatching order. Under the penalty electricity price policy, the optimal dispatching of distribution networks was achieved with the help of an optimal dispatching order to power users. Simulation results demonstrated that the penalty electricity price was effective and the proposed penalty electricity price had the advantages of robustness and easier application compared with the credit electricity price. The penalty pricing mechanism could be applied to all countries that implement the real-time pricing policy. During the implementation of the penalty electricity price, some power users increased their net power consumption in the coming time period, whereas other power users decreased their net power consumption in this period. To improve power system flexibility and apply this novel electricity price mechanism, in the future, we will study peer-to-peer trading electricity pricing and an optimal control system based on multi-agent technology for distribution networks.

Author Contributions

Conceptualization, Q.P. and H.G.; methodology, Q.P.; software, X.L. and C.H.; validation, Q.P., L.Y. and Y.Z.; formal analysis, Q.P.; investigation, Q.P.; resources, Q.P.; data curation, Q.P.; writing—original draft preparation, Q.P.; writing—review and editing, Q.P. and H.G.; visualization, Q.P. and L.Y.; supervision, Q.P.; project administration, Q.P.; funding acquisition, H.G. All authors have read and agreed to the published version of the manuscript.

Funding

This research was funded by the National Natural Science Foundation of China (Grant No. 51877127).

Institutional Review Board Statement

Not applicable.

Informed Consent Statement

Not applicable.

Data Availability Statement

Not applicable.

Conflicts of Interest

The authors declare no conflict of interest.

References

  1. Chen, G.; Li, M.; Xu, T.; Liu, M. Study on Technical Bottleneck of New Energy Development. Proc. CSEE 2017, 37, 20–27. [Google Scholar]
  2. Fu, Y.; Liao, J.; Li, Z.; Qian, X.; Tang, X. Day-Ahead Optimal Scheduling and Operating of Active Distribution Network Considering Violation Risk. Proc. CSEE 2017, 37, 6328–6338. [Google Scholar]
  3. Joseph, A.; Balachandra, P. Energy Internet, the Future Electricity System: Overview, Concept, Model Structure, and Mechanism. Energies 2020, 13, 4242. [Google Scholar] [CrossRef]
  4. Liu, Z. Research of Global Clean Energy Resource and Power Grid Interconnection. Proc. CSEE 2016, 36, 5103–5110. [Google Scholar]
  5. Cao, J.; Zhang, W.; Xiao, Z.; Hua, H. Reactive Power Optimization for Transient Voltage Stability in Energy Internet via Deep Reinforcement Learning Approach. Energies 2019, 12, 1556. [Google Scholar]
  6. Feng, C.; Liao, X. An Overview of ‘Energy + Internet’ in China. J. Clean. Prod. 2020, 258, 120630. [Google Scholar] [CrossRef]
  7. Lv, Z.; Kong, W.; Zhang, X.; Jiang, D.; Lv, H.; Lu, X. Intelligent Security Planning for Regional Distributed Energy Internet. IEEE Trans. Ind. Inform. 2020, 16, 3540–3547. [Google Scholar] [CrossRef]
  8. Wang, Z.; Perera, A.T.D. Integrated Platform to Design Robust Energy Internet. Appl. Energy 2020, 269, 114942. [Google Scholar] [CrossRef]
  9. Zapf, M.; Blenk, T.; Müller, A.C.; Pengg, H.; Mladenovic, I.; Weindl, C. Lifetime Assessment of PILC Cables with Regard to Thermal Aging Based on a Medium Voltage Distribution Network Benchmark and Representative Load Scenarios in the Course of the Expansion of Distributed Energy Resources. Energies 2021, 14, 494. [Google Scholar] [CrossRef]
  10. Csányi, G.M.; Tamus, Z.Á.; Varga, Á. Impact of Distributed Generation on the Thermal Ageing of Low Voltage Distribution Cables. In Technological Innovation for Smart Systems. DoCEIS 2017; Camarinha-Matos, L., Parreira-Rocha, M., Ramezani, J., Eds.; IFIP Advances in Information and Communication Technology; Springer: Cham, Switzerland, 2017; Volume 499, pp. 251–258. [Google Scholar]
  11. Csányi, G.M.; Bal, S.; Tamus, Z.Á. Dielectric Measurement Based Deducted Quantities to Track Repetitive, Short-Term Thermal Aging of Polyvinyl Chloride (PVC) Cable Insulation. Polymers 2020, 12, 2809. [Google Scholar] [CrossRef]
  12. Wei, B.; Han, X.; Wang, P.; Yu, H.; Guo, L. Temporally Coordinated Energy Management for AC/DC Hybrid Microgrid Considering Dynamic Conversion Efficiency of Bidirectional AC/DC Converter. IEEE Access 2020, 8, 70878–70889. [Google Scholar] [CrossRef]
  13. Villalón, A.; Rivera, M.; Salgueiro, Y.; Muñoz, J.; Dragičević, T.; Blaabjerg, F. Predictive Control for Microgrid Applications: A Review Study. Energies 2020, 13, 2454. [Google Scholar] [CrossRef]
  14. Sun, Q.; Teng, F.; Zhang, H. Energy Internet and Its Key Control Issues. Acta Autom. Sin. 2017, 43, 176–194. [Google Scholar]
  15. Dong, H.; Li, S.; Dong, H.; Tian, Z.; Hillmansen, S. Coordinated Scheduling Strategy for Distributed Generation Considering Uncertainties in Smart Grids. IEEE Access 2020, 8, 86171–86179. [Google Scholar] [CrossRef]
  16. Sun, Y.; Cai, Z.; Zhang, Z.; Guo, C.; Ma, G.; Han, Y. Coordinated Energy Scheduling of a Distributed Multi-Microgrid System Based on Multi-Agent Decisions. Energies 2020, 13, 4077. [Google Scholar] [CrossRef]
  17. Shi, X.; Wen, G.; Cao, J.; Yu, X. Model Predictive Power Dispatch and Control with Price-Elastic Load in Energy Internet. IEEE Trans. Ind. Inform. 2019, 15, 775–1787. [Google Scholar] [CrossRef]
  18. Lan, T.; Jermsittiparsert, K.; Alrashood, S.T.; Rezaei, M.; Al-Ghussain, L.; Mohamed, M.A. An Advanced Machine Learning Based Energy Management of Renewable Microgrids Considering Hybrid Electric Vehicles’ Charging Demand. Energies 2021, 14, 569. [Google Scholar]
  19. Zafar, R.; Ravishankar, J.; Fletcher, J.E.; Pota, H.R. Optimal Dispatch of Battery Energy Storage System Using Convex Relaxations in Unbalanced Distribution Grids. IEEE Trans. Ind. Inform. 2020, 16, 97–108. [Google Scholar] [CrossRef]
  20. Zhang, X.; Yang, J.; Wang, W.; Zhang, M.; Jing, T. Integrated Optimal Dispatch of a Rural Micro-Energy-Grid with Multi-Energy Stream Based on Model Predictive Control. Energies 2018, 11, 3439. [Google Scholar] [CrossRef] [Green Version]
  21. Muqeet, H.A.U.; Ahmad, A. Optimal Scheduling for Campus Prosumer Microgrid Considering Price Based Demand Response. IEEE Access 2020, 8, 71378–71394. [Google Scholar] [CrossRef]
  22. Alfaverh, F.; Denaï, M.; Sun, Y. Demand Response Strategy Based on Reinforcement Learning and Fuzzy Reasoning for Home Energy Management. IEEE Access 2020, 8, 39310–39321. [Google Scholar] [CrossRef]
  23. Dinh, H.T.; Yun, J.; Kim, D.M.; Lee, K.; Kim, D. A Home Energy Management System with Renewable Energy and Energy Storage Utilizing Main Grid and Electricity Selling. IEEE Access 2020, 8, 49436–49450. [Google Scholar] [CrossRef]
  24. Zhang, C.; Wang, S.; Zhao, Q. Distributed Economic MPC for LFC of Multi-Area Power System with Wind Power Plants in Power Market Environment. Int. J. Electr. Power Energy Syst. 2021, 126, 106548. [Google Scholar] [CrossRef]
  25. Hong, Y.; Taylar, J.V.; Fajardo, A.C. Locational Marginal Price Forecasting in a Day-Ahead Power Market Using Spatiotemporal Deep Learning Network. Sustain. Energy Grids Netw. 2020, 24, 100406. [Google Scholar] [CrossRef]
  26. Poyrazoglu, G. Determination of Price Zones during Transition from Uniform to Zonal Electricity Market: A Case Study for Turkey. Energies 2021, 14, 1014. [Google Scholar] [CrossRef]
  27. Zhang, Q.; Hu, Y.; Tan, W.; Lo, C.; Ding, Z. Dynamic Time-of-Use Pricing Strategy for Electric Vehicle Charging Considering User Aatisfaction Degree. Appl. Sci. 2020, 10, 3247. [Google Scholar] [CrossRef]
  28. Zhou, K.; Wei, S.; Yang, S. Time-of-Use Pricing Model Based on Power Supply Chain for User-Side Microgrid. Appl. Energy 2019, 248, 35–43. [Google Scholar] [CrossRef]
  29. Hung, Y.; Michailidis, G. Modeling and Optimization of Time-of-Use Electricity Pricing Systems. IEEE Trans. Smart Grid 2019, 10, 4116–4127. [Google Scholar] [CrossRef]
  30. Yao, L.; Hashim, F.H.; Lai, C. Dynamic Residential Energy Management for Real-Time Pricing. Energies 2020, 13, 2563. [Google Scholar] [CrossRef]
  31. Tao, L.; Gao, Y. Real-Time Pricing for Smart Grid with Distributed Energy and Storage: A Noncooperative Game Method Considering Spatially and Temporally Coupled Constraints. Int. J. Elect. Power Energy Syst. 2019, 115, 105487. [Google Scholar] [CrossRef]
  32. Zhang, K.; Hanif, S.; Hackl, C.M.; Hamacher, T. A Framework for Multi-Regional Real-Time Pricing in Distribution Grids. IEEE Trans. Smart Grid 2019, 10, 6826–6838. [Google Scholar] [CrossRef]
  33. Wang, H.; Gao, Y. Real-Time Pricing Method for Smart Grids Based on Complementarity Problem. J. Mod. Power Syst. Clean Energy 2019, 7, 1280–1293. [Google Scholar] [CrossRef] [Green Version]
  34. Rasheed, M.B.; Qureshi, M.A.; Javaid, N.; Alquthami, T. Dynamic Pricing Mechanism with the Integration of Renewable Energy Source in Smart Grid. IEEE Access 2020, 8, 16876–16892. [Google Scholar] [CrossRef]
  35. Baran, M.E.; Wu, F.F. Network Reconfiguration in Distribution Systems for Loss Reduction and Load Balancing. IEEE Trans. Power Deliver. 1989, 4, 1401–1407. [Google Scholar] [CrossRef]
  36. Sun, M.; Ji, J.; Ampimah, B.C. How to Implement Real-Time Pricing in China? A Solution Based on Power, Credit Mechanism. Appl. Energy 2018, 231, 1007–1018. [Google Scholar] [CrossRef]
Figure 1. Day-ahead real-time pricing.
Energies 14 01806 g001
Figure 2. Forecasted load profiles of the power grid and users.
Energies 14 01806 g002
Figure 3. (a) Actual power consumption profiles with exceeding the threshold of the power grid; (b) Actual power consumption profiles with new peak of the power grid.
Energies 14 01806 g003
Figure 4. Structure of the distribution network optimal control system.
Energies 14 01806 g004
Figure 5. Structure of power user control system.
Energies 14 01806 g005
Figure 6. IEEE 33 bus distribution system.
Energies 14 01806 g006
Figure 7. Day-ahead real-time pricing.
Energies 14 01806 g007
Figure 8. Optimal dispatching orders of the distribution network.
Energies 14 01806 g008
Figure 9. (a) Power consumption dispatching orders of the power users; (b) Distributed generation dispatching orders.
Energies 14 01806 g009
Figure 10. Load fluctuation ratio.
Energies 14 01806 g010
Figure 11. Actual aggregate power consumption of the distribution network.
Energies 14 01806 g011
Figure 12. Penalty electricity price of each node.
Energies 14 01806 g012
Figure 13. Penalty electricity charges of each user.
Energies 14 01806 g013
Figure 14. Power consumption profiles after control.
Energies 14 01806 g014
Figure 15. Proportion of the actual consumed power exceeding the dispatching order.
Energies 14 01806 g015
Figure 16. Comparison between penalty electricity price and credit electricity price.
Energies 14 01806 g016
Figure 17. Penalty electricity price under random fluctuation.
Energies 14 01806 g017
Figure 18. Credit electricity price under random fluctuation. (a) Random fluctuation A; (b) Random fluctuation B.
Energies 14 01806 g018
Publisher’s Note: MDPI stays neutral with regard to jurisdictional claims in published maps and institutional affiliations.