Article

The Effect of Climate on the Solar Radiation Components on Building Skins and Building Integrated Photovoltaics (BIPV) Materials

by
Hassan Gholami
* and
Harald Nils Røstvik
City- and Regional Planning, Institute of Safety, Economics and Planning (ISØP), Faculty of Science and Technology, University of Stavanger, 4021 Stavanger, Norway
*
Author to whom correspondence should be addressed.
Energies 2021, 14(7), 1847; https://doi.org/10.3390/en14071847
Submission received: 1 March 2021 / Revised: 18 March 2021 / Accepted: 23 March 2021 / Published: 26 March 2021
(This article belongs to the Special Issue Building Integrated PV System)

Abstract

:
The business model of building-integrated photovoltaics (BIPV) is developing expeditiously and BIPV will soon be recognised as a building envelope material for the entire building skins, among other alternatives such as brick, wood, stone, metals, etc. This paper investigates the effect of climate on the solar radiation components on building skins and BIPV materials in the northern hemisphere. The selected cities are Stavanger in Norway, Bern in Switzerland, Rome in Italy, and Dubai in the UAE. The study showed that for all the studied climates, the average incident radiation on the entire building skins is slightly more than the average incident radiation on the east or west facades, regardless of the orientations of the building facades. Furthermore, the correlation between solar radiation components and different BIPV technologies is discussed in this paper. It is also found that when it comes to the efficiency of different BIPV cells, the impact of the climate on some of the BIPV technologies (such as DSC and OSC) is much more significant than others (such as c-Si, mc-Si and CIGS). The evidence from this study suggests that in climates with higher diffuse radiation-or with more overcast days per year-the contribution of IR radiation decreases. Therefore, the efficiency of BIPV materials that their spectral responses are dependent on the IR radiation (like Si and CIGS) in such a climate would drop down meaningfully. On the other hand, the DSC and OSC solar cells could be a good option for cloudy climates since they have more stable performance, even in such a climate. Although, their efficiency compared to other BIPV materials such as Si-based BIPV solar cells is still significantly less thus far.

1. Introduction

Renewable energy technologies in urban areas have been at the forefront of research and development due to concerns related to the environment as well as energy independence and high fossil fuel costs. Among the options, building-integrated photovoltaics (BIPV) has attracted increasing interest in the past decade. BIPV refers to photovoltaic materials that are used to substitute traditional building materials in parts of the building skins, such as the facades, roofs, or skylights, to generate clean energy from sunshine [1]. Therefore, it must play a role in the building envelope that contains at least one additional function in addition to electricity generation. The BIPV secondary function could be as insulation or an exterior weather barrier [2,3]. The photovoltaic cells in the BIPV system can be ventilated with active or passive ventilation [4,5,6,7,8], and the system can be in the forms of tiles, foils, modules, or glazing [9,10].
During the past ten years, much more information has become available on the feasibility of the BIPV roof as well as BIPV on the south, east, and west façade. Along with this growth in the valuable insights into the feasibility of the BIPV system on building skins, however, there is an increasing concern over the feasibility of the BIPV on the untraditional orientations of building skins for BIPV applications. It looks that there seems to have been an assumption in which the northern façades (in the northern hemisphere) are economically unfeasible because the radiation there is low [11,12,13,14,15,16,17,18,19,20,21,22].
On the other hand, recent studies depict that different BIPV technologies have a different spectral response to the incident solar radiation and its components [23,24,25], and therefore the climate plays a key role in the performance of BIPV systems. However, there is a lack of studies investigating the effect of climates with different solar radiation spectrums and components in the literature.
Therefore, this study set out with four aims:
First, assessing the incident solar radiation components on building skins considering different climates;
Second, analysing the solar radiation potential of the entire building skins for the BIPV application (if BIPV is seen as a building envelope material for the entire building skin);
Third, evaluating the effect of climates on the overall efficiencies of different BIPV technologies and materials which are currently available in the market;
Fourth, investigating the effect of building orientation on the irradiance values of the building skins and the contribution of each solar radiation component.
The selected cities for this study are Stavanger, Bern, Rome, and Dubai.
In Section 2, a brief introduction of solar radiation and the available measuring methods, as well as the location of the case studies, are presented. The analysis of radiation on the building skins is discussed in Section 3. A correlation analysis between climate/radiation and climate/technology is accomplished in detail in Section 4 and Section 5. A sensitivity analysis is accomplished in Section 6 in order to see the effect of orientations on incident solar radiation on building skins. Finally, in Section 7, the conclusion is presented.

2. Materials and Methods

In this section, solar radiation components and spectrum are discussed. Then, different methods of incident solar radiation measurement at the earth’s surface are introduced and reviewed thoroughly. The selected city and their climates are briefly presented as well.

2.1. Solar Radiation Components

The incident radiation to a surface on earth has three components which are direct radiation, diffuse radiation, and reflected radiation.
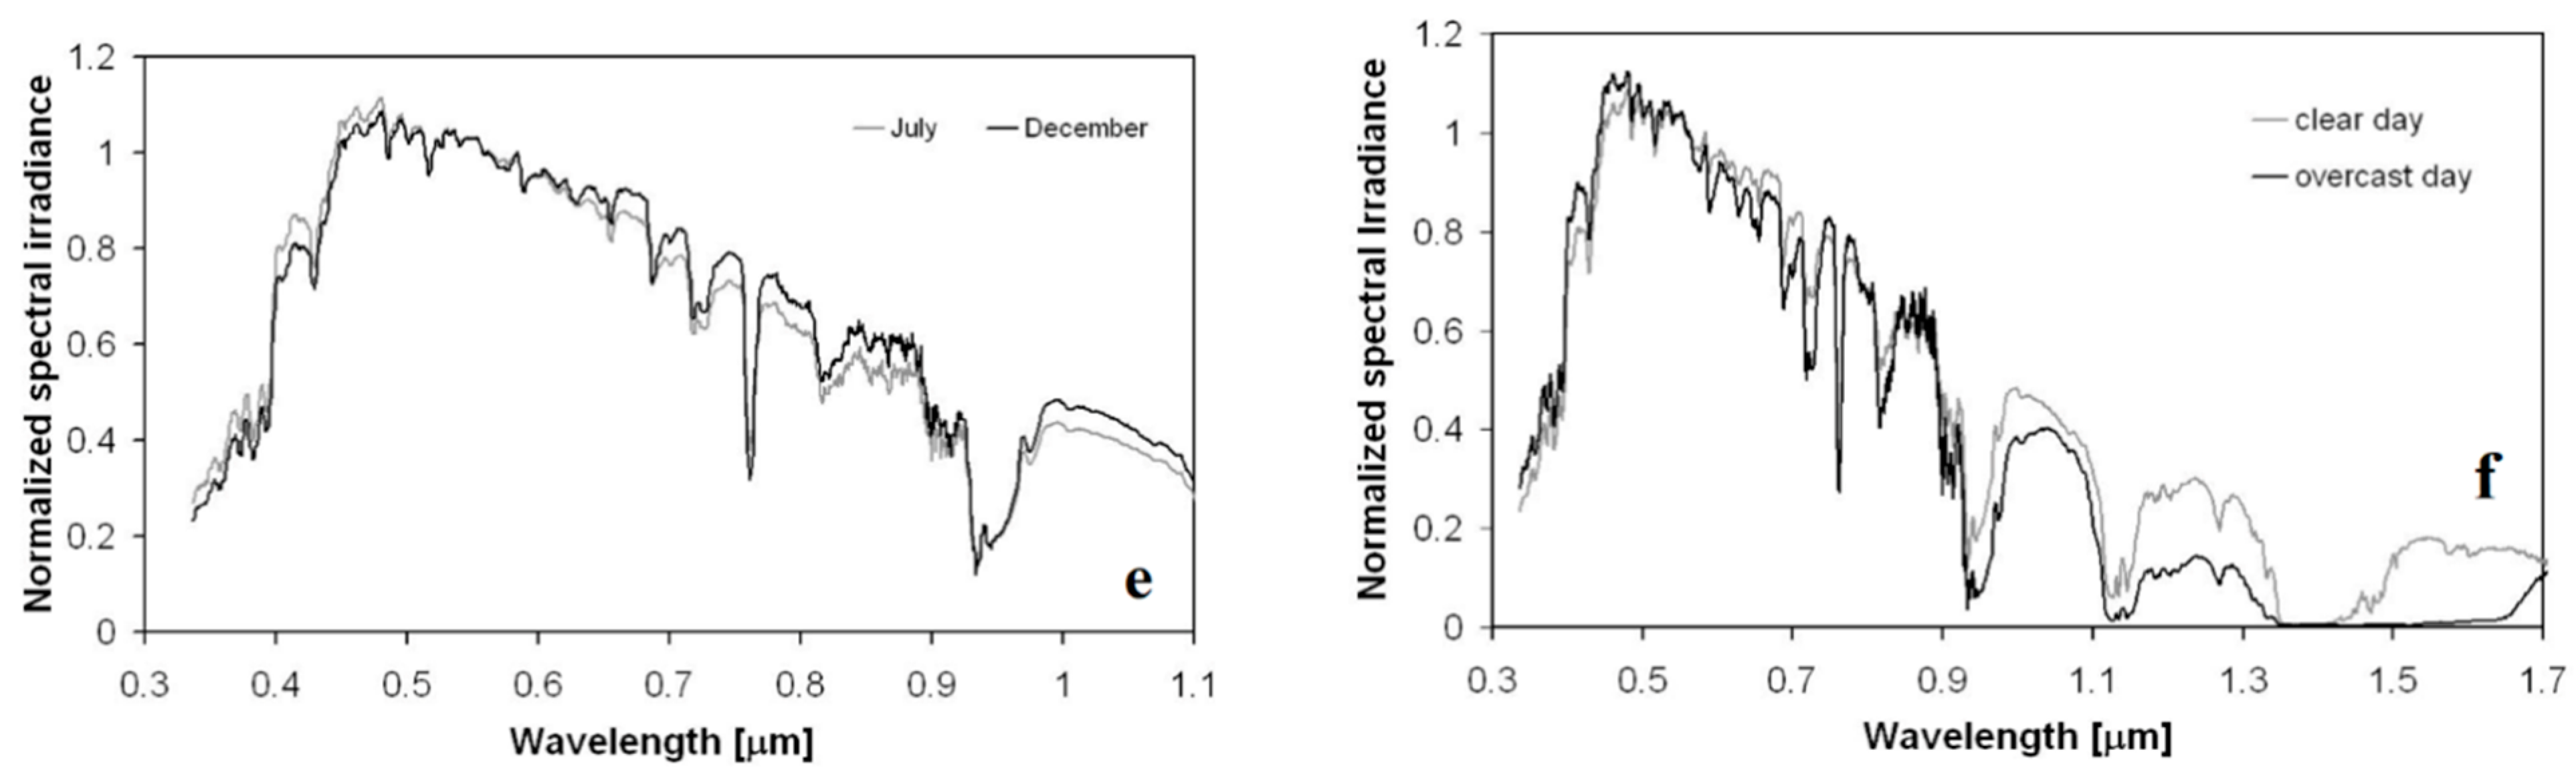
  • Direct radiation is also called, “beam radiation” or “direct beam radiation”. It is used to describe solar radiation coming on a straight line from the sun, down to the surface of the earth. For sunny days with a clear sky, most of the solar radiation is direct radiation. On overcast days, the sun is shadowed by clouds, and the beam radiation is zero.
  • Diffuse radiation is sunlight that has been dispersed or scattered by particles and molecules in the atmosphere and still made its way down to the surface. Diffuse radiation is commonly referred to as sky radiation because it comes from all regions of the sky. The amount of diffuse radiation is up to 100% of the total radiation for cloudy skies and 10% to 20% of the total radiation for clear skies.
  • Reflected radiation is the reflection of direct and diffuse radiation on the ground. This contribution is small unless the collector is tilted at a steep angle from the horizontal, like a building façade.

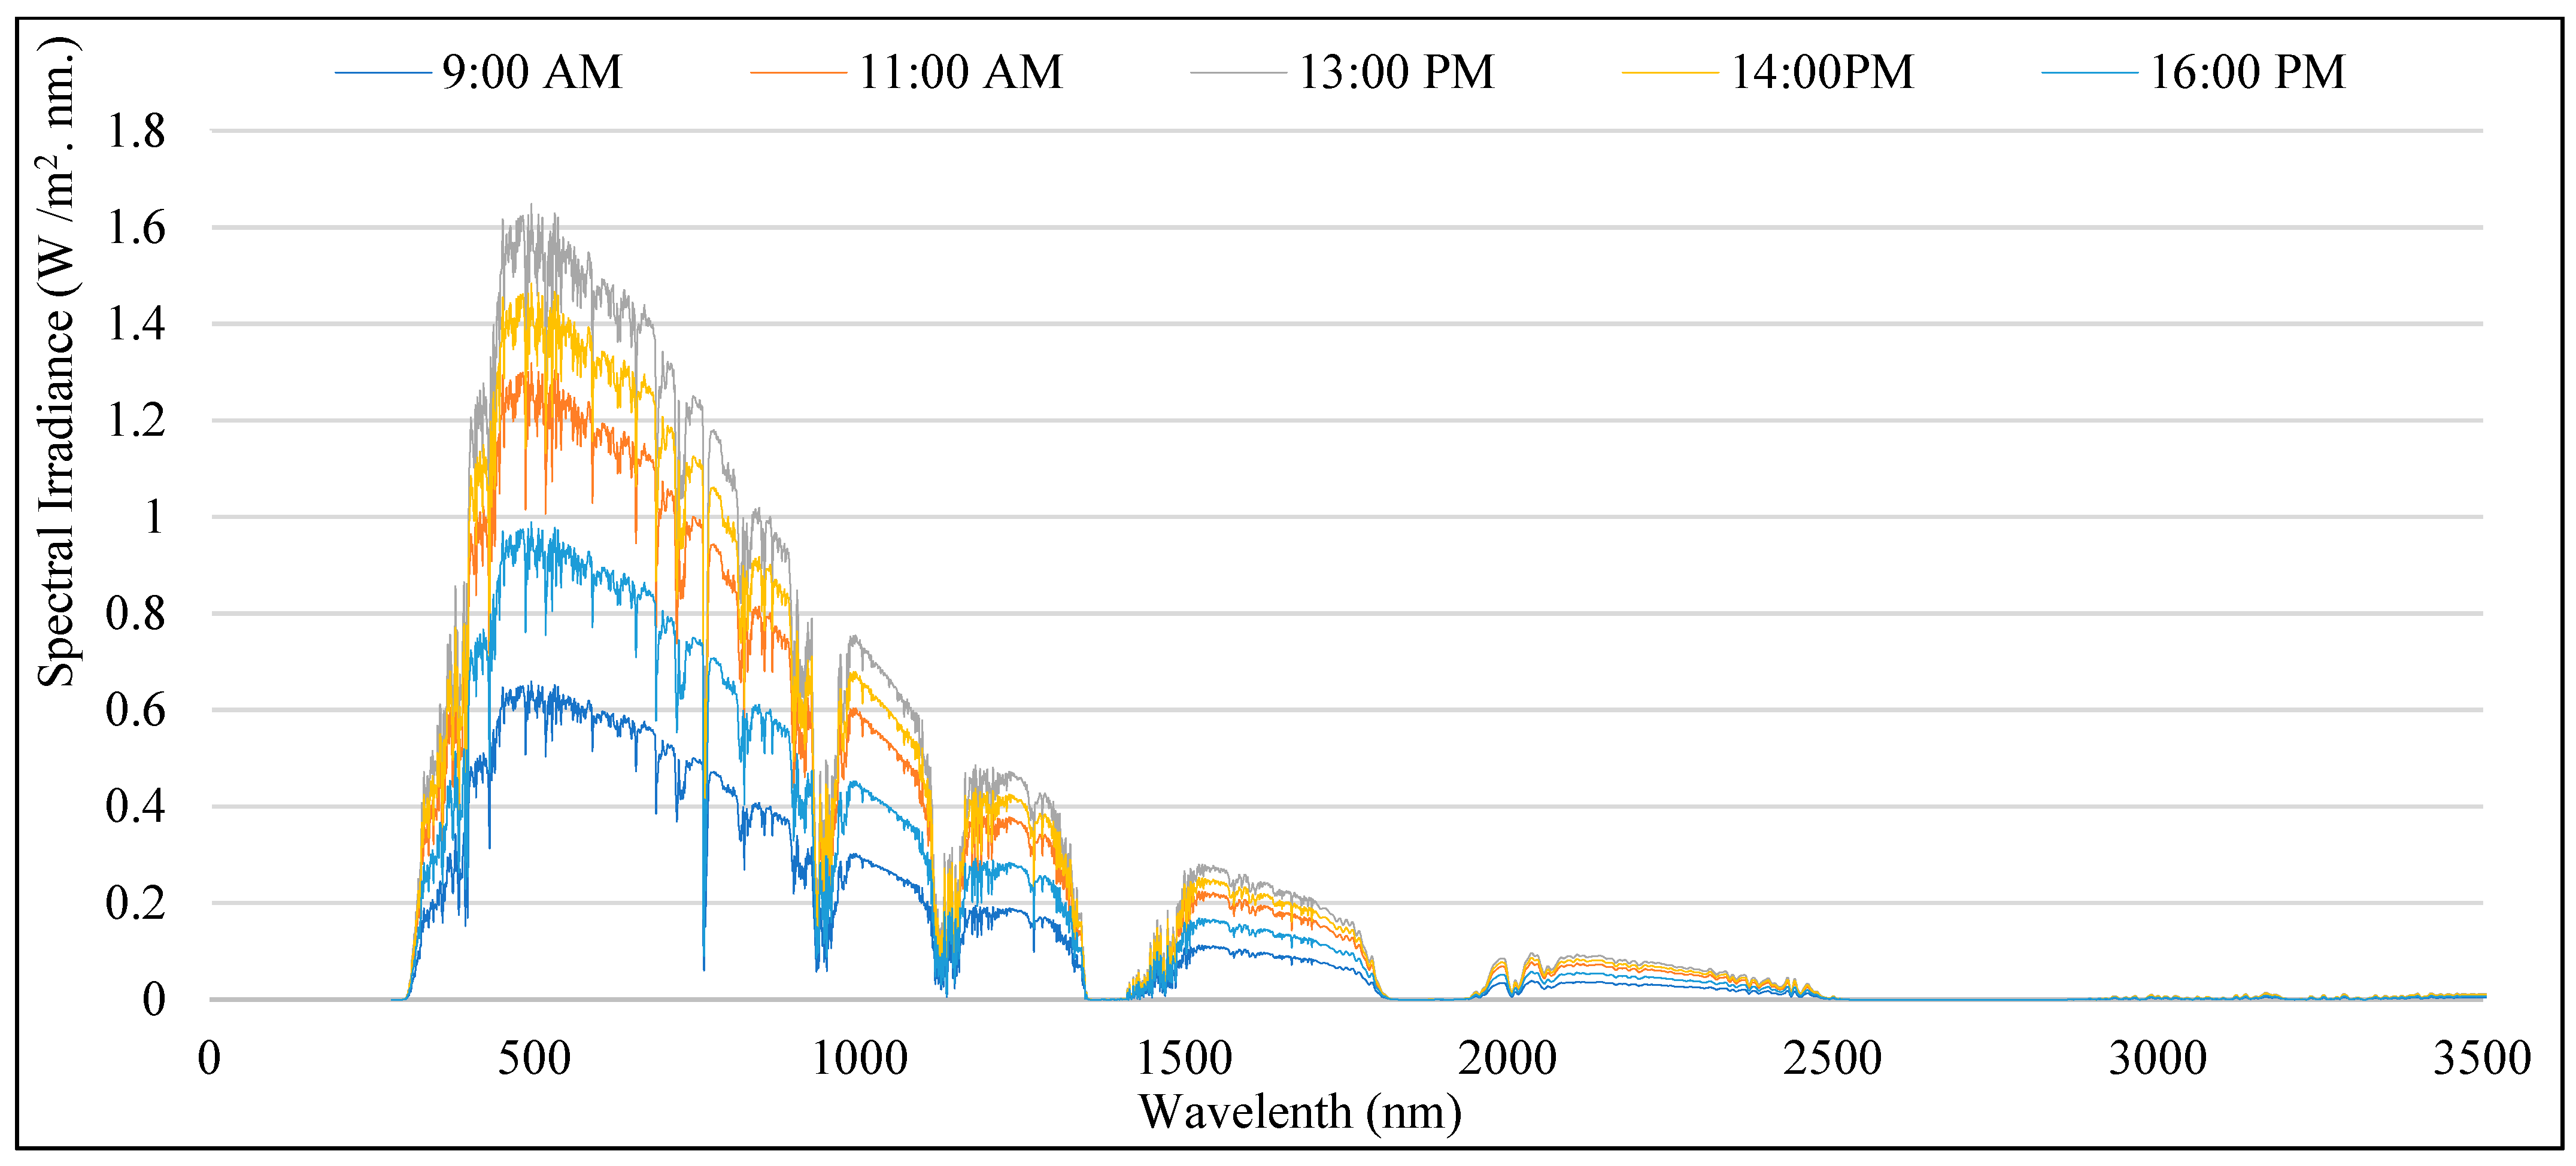
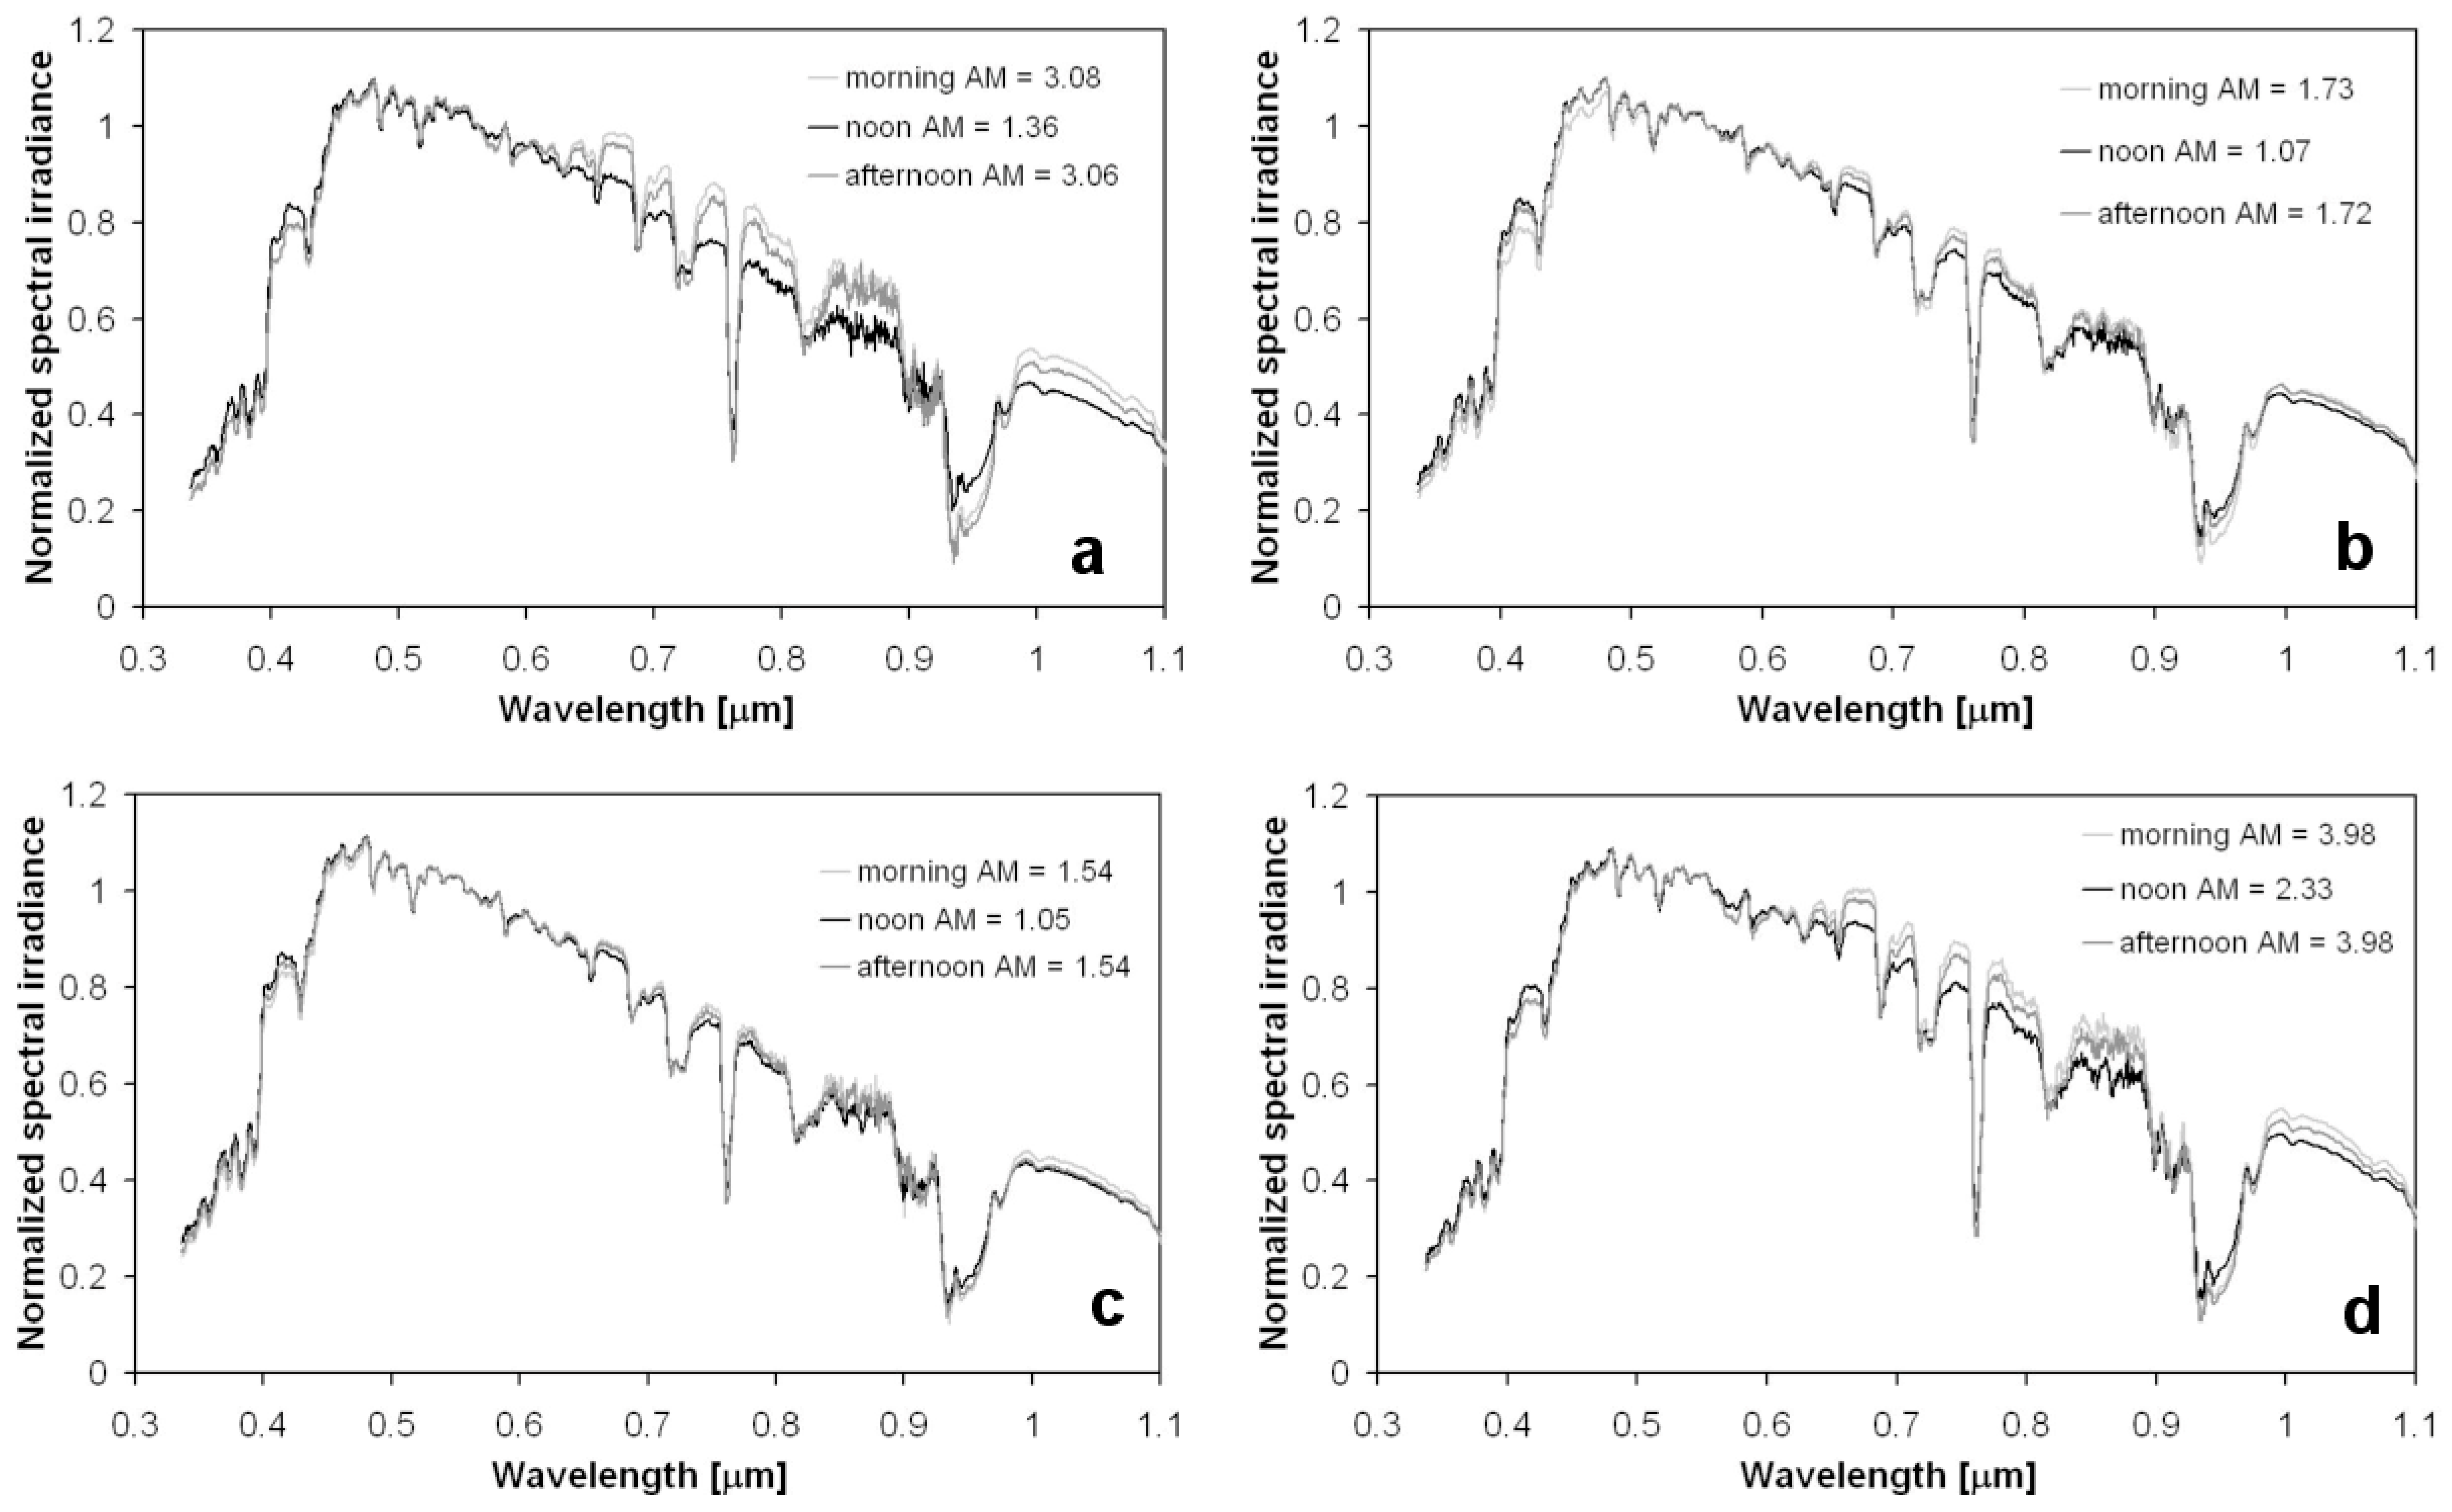
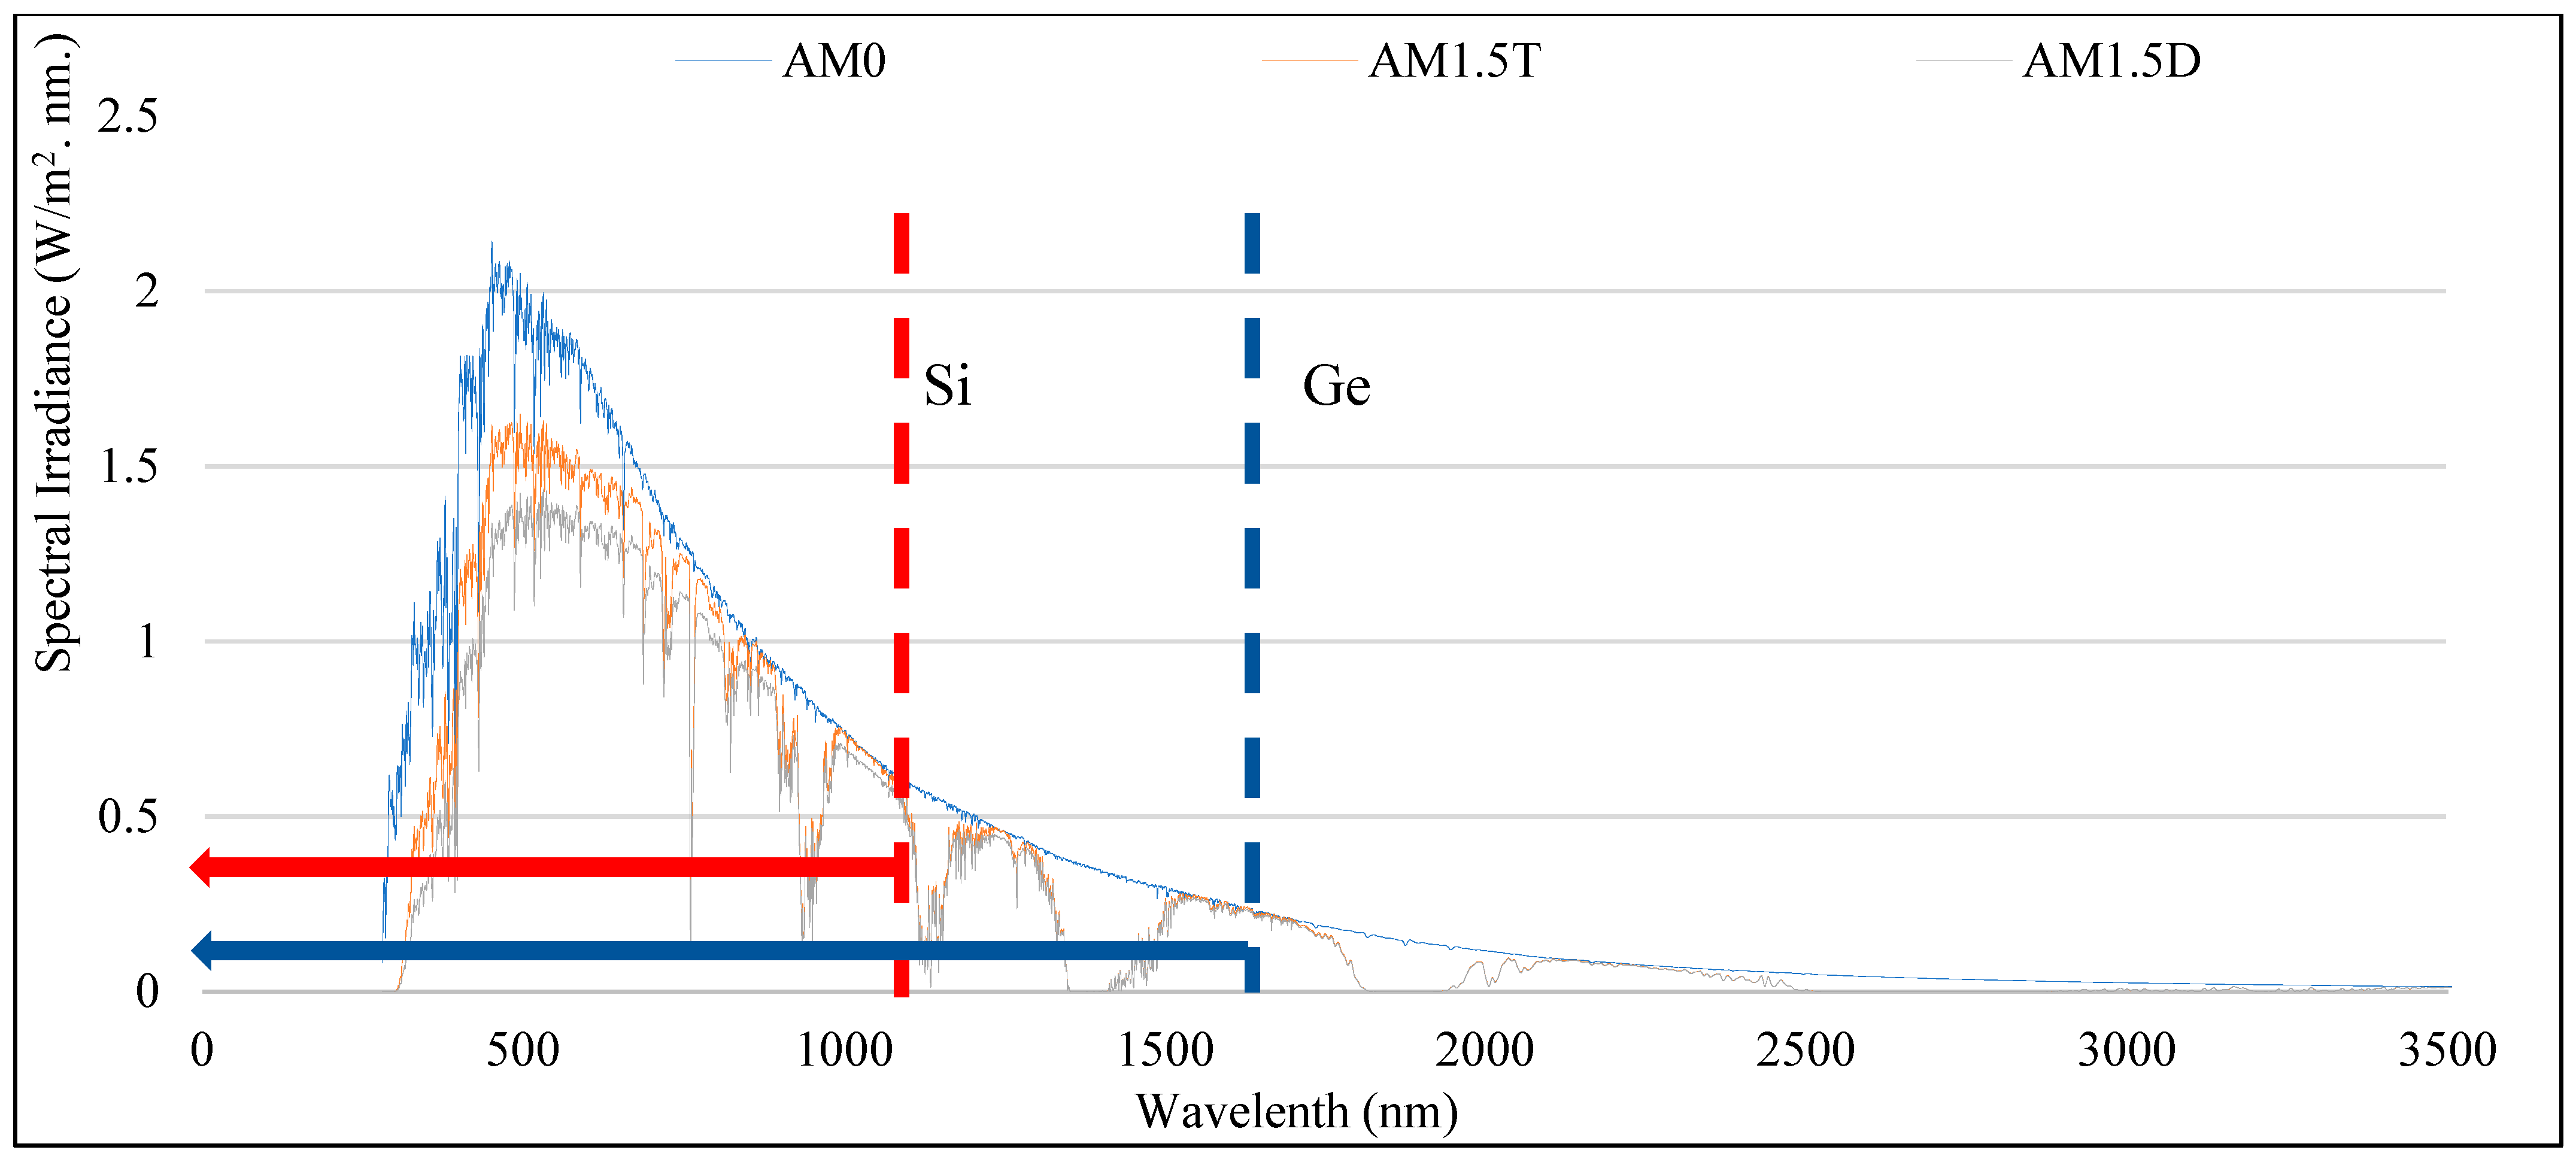
2.2. Solar Radiation Spectrum

The radiation spectrum coming from the sun to the earth is subdivided into three main groups of ultraviolet, visible light, and infrared.
  • Ultraviolet (UV) is wavelengths from 250 nm to 380 nm. UV rays are invisible to the human eyes and may be dangerous in the case of overexposure because they damage surfaces, colours and age materials.
  • Visible light is wavelengths from 380 nm (violet) to 740 nm (red). Visible light rays are detectable by the human eyes and enable the sight of shapes, relief and colours.
  • Short wave infrared (IR) constitutes wavelengths from 740 nm to 2500 nm. IR is invisible and is felt as heat. It constitutes most of the sun’s energy that hits the earth.
Figure 1 shows the solar irradiance outside (Airmass equal to 0) and inside (Airmass equal to 1.5) of the atmosphere (Standard number ASTM G-173-03). The letters T and D stand for total and direct incident radiation. In terms of solar radiation inside of the atmosphere and at sea level, around 3% of solar radiation on earth is UV, around 42% is visible light, and the rest (55%) is IR.

2.3. Solar Radiation Measurement Methods at the Earth’s Surface

There are three methods to either measure or calculate the incident solar radiation on a surface at the earth, which are as follows:

2.3.1. Radiation Measuring Devices

In this method, the incident radiation is measured by a high-quality sensor which, thanks to the technology, is gaining greater accuracy nowadays. There are many sensors available on the market for this purpose and, based on the type of measured radiation, they fall into two subcategories of pyranometer and pyrheliometer. Sensor measurements should fulfill some conditions to be useful, such as [26]:
  • Only high-quality measurement sensors should be used.
  • Measurements should be performed at a reasonable interval (at least every hour).
  • Sensors should be calibrated and cleaned regularly.
  • Data should be available for a long period.
Currently, the number of radiation measurement stations that fulfill all these criteria is relatively low, and the stations are often spaced far apart. Therefore, this method is not a suitable way to measure incident solar radiation globally.

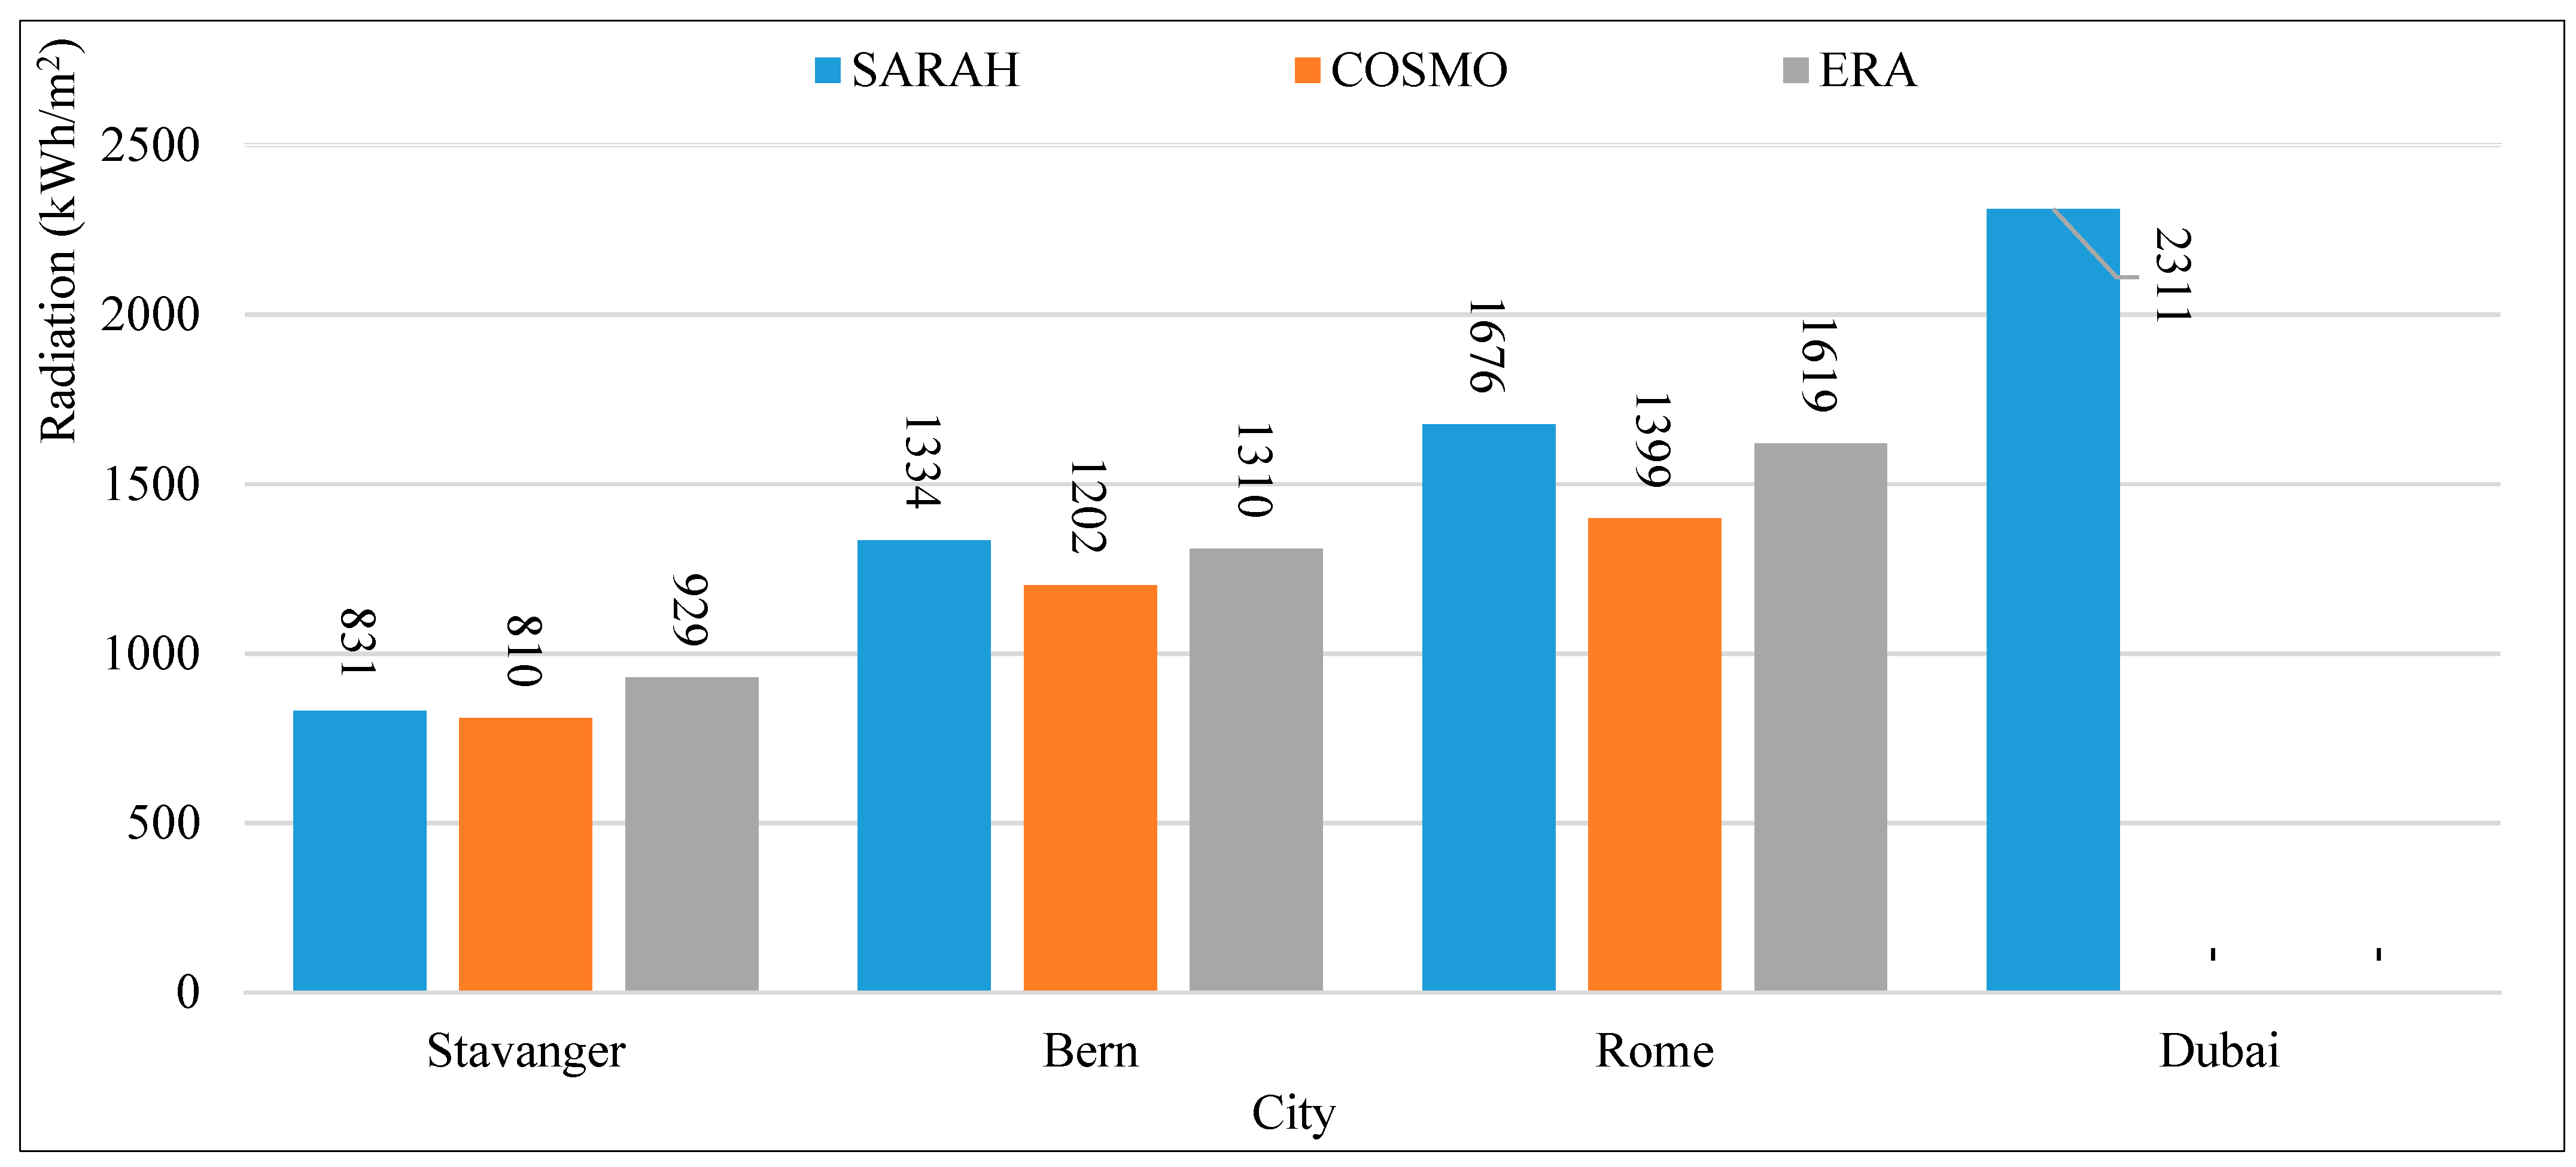
2.3.2. Satellite-Based Irradiation Data

Calculating irradiation data on a surface at the earth using satellite data has become more and more common currently. This method mostly uses data from geostationary meteorological satellites. In this method, the incident radiation data is available for the whole area covered by the satellite. For instance, the METEOSAT satellites cover Europe, Africa, and most of Asia up to 60° N, with a resolution of a few kilometers [27]. The satellite data is usually available for a long time as well. The issue with this method is that the solar radiation at ground level must be calculated using complicated mathematical algorithms that use satellite data as well as data on aerosols (dust, particles), atmospheric water vapor, and ozone. Some conditions (such as snow, which can be mistaken for clouds or dust storms, which can be challenging to detect in the satellite images) can cause the calculations to lose accuracy. Moreover, despite the perfect accuracy of satellite-based solar radiation data, this method also does not cover the polar area. This method has been described in some papers [27,28,29]. An example of satellite-based irradiation data is PVGIS-SARAH. This data set has been calculated by the Satellite Application Facility on Climate Monitoring (CM SAF) and the Photovoltaic Geographical Information System (PVGIS) team with a spatial resolution of 31 km [26].

2.3.3. Climate Reanalysis Data

Another type of solar radiation estimate is from climate reanalysis data. Reanalysis data are calculated by employing numerical weather forecast models, re-running the models for the past, and making corrections by the known meteorological measurements. The output is a large number of meteorological quantities, usually including incident solar radiation at ground level. These data sets generally have global coverage (including the polar areas) while the satellite methods do not. However, there are certain drawbacks associated with the use of this method such as its low spatial resolution and low accuracy, etc. The resolution of this method usually is one value every 30km or more and the accuracy of the incident solar radiation is not as precise as the satellite-based solar irradiance data over the areas covered by both data sets [30]. In this study, two reanalysis-based solar radiation data sets have been employed, which are ECMWF ERA-5 [31] and COSMO-REA [30].

2.4. Locations

Three locations within Europe are selected to analyse the satellite-based and climate reanalysis-based irradiation data. The radiation status of Dubai in the UAE is analysed as well because of its climate and perfect solar energy potential compared with other locations. Therefore, the selected cities are Stavanger in Norway, Bern in Switzerland, Rome in Italy, and Dubai in the UAE. Table 1 shows geographical information about the locations.

2.4.1. Stavanger

Stavanger is a city located on a peninsula on the southwest coast of Norway. Due to the warmer temperature created by the gulf stream, the climate (warm and temperate) is more pleasant compared to other cities at similar latitudes [32]. The city experiences an oceanic climate with five months above 10 °C mean temperature and an annual average of 1428 mm of precipitation, which makes the city relatively wet. The city also has a small continental climate influence, which creates subzero lows during winter [33].

2.4.2. Bern

Bern is the capital of Switzerland with a marine west coast climate. The climate is mild, warm, and temperate with no dry season. The average temperature in Bern is 8.8 °C, and the annual precipitation is 911 mm [34]. The city has 103.7 days of air frost, 22.3 ice days, 14.1 days of snowfall, 36.7 days of snow cover and the average amount of snow measured per year is 52.6 cm for the period of 1981–2010 [32,35].

2.4.3. Rome

Rome is the capital city of Italy, with an annual average temperature of 16.7 °C. According to Köppen and Geiger, its climate is classified as a Mediterranean climate with cool, humid winters and warm, dry summers. The temperature in July averages 24.4 °C, which is the warmest month of the year. In January, the average temperature is 7.7 °C, which is the lowest average temperature of the whole year [32,36].

2.4.4. Dubai

Dubai is a city in the UAE with a desert climate, according to Köppen climate classification. There is almost no rainfall during the year in Dubai. The temperature there averages 26.7 °C with annual precipitation of about 87 mm. The month of August has an average temperature of 34.2 °C and January has an average temperature of 18.6 °C, they are the warmest and coldest months of the whole year. [32,37].

3. Solar Radiation Analysis on Building Skins

In order to be able to compare the outcome of the databases, the year 2015 has been selected, which is the most recent year that the incident radiation data for all selected European cities are available.
Figure 2 shows the total annual radiation on one square meter of a flat roof of the cities based on investigated databases. As can be seen from the figure, among the three databases, the only available database for Dubai is the SARAH database. Moreover, there is an insignificant variation between databases and, as mentioned earlier, the most accurate database currently is the SARAH database, which is a satellite-based database. Therefore, in order to elaborate solar radiation components on building skins of the cities, the SARAH database is selected, and this study investigated the data belonging to this database for more precise analysis.
The business model of BIPV is transitioning to a new business model with three players, which are BIPV manufacturers, installers and the main contractors [2]. Therefore, the BIPV is going towards the direction that soon it will be seen as a building envelope material option for building skins among other options like brick, wood, aluminum, etc. To see the annual solar irradiance on the building skins, incident solar radiation on building skins (BS) has been introduced. The annual solar irradiance on BS is calculated by the average of incident radiation on different orientations of the building envelope, which here is south, east, west, north façade, and roof area. This parameter could be used to evaluate the feasibility of the BIPV as a building envelope material for building skins.
Figure 3 depicts the annual incident solar radiation on one square meter of different orientations of building skins, and also BS for the selected cities as well as their components. The data illustrates that the difference between radiation on the south façade and the roof in the urban area becomes more and more significant when moving from cities with higher latitudes to lower latitudes. The northern façade has the lowest incident radiation while, in terms of Stavanger, the radiation there is significant when comparing western or eastern façade. The radiation on the eastern and western façade, which is sometimes also called morning and evening façade, is also quite the same for all cities. As can be predicted from the climate and latitude, the incident solar radiation on building skins in Dubai is significantly higher than in other European cities. The values of BS vary from 570 kWh/m2 in Stavanger to 1280 kWh/m2 in Dubai. There is also a clear correlation between solar irradiance on the east/west façade and BS, regardless of climate. As a general conclusion, it can be said that the average radiation on the building skins with the defined configuration in this study is always a little more than the incident solar radiation on the east/west skin of the building.
In order to investigate the data in more detail, the contribution of each component together with the total radiation of each orientation is mentioned in Table 2. Except for the north façade, the major component of radiation on building skins for Bern, Rome and Dubai is direct radiation, which is because of the climate condition there.
The average number of sunny hours in the cities is mentioned in Table 3 [38,39]. As the table shows, Stavanger has the least average annual hours of sunshine among the cases. Hence, the contribution of diffuse radiation on building skins for Stavanger is significantly higher and even more than the direct radiation in some facades. The incident radiation on the northern façade is different from other areas of the building. As can be seen from Table 2, the contribution of direct radiation in the northern façade is significantly low and, instead of direct radiation, diffuse radiation plays an important role in this orientation. Diffuse radiation constitutes around 70% of the total radiation of the northern façade.
By moving from higher latitudes to lower latitudes, the contribution of the south façade is becoming less while the contribution of the roof is becoming bigger, which makes sense when considering the location of the sun in the sky as depicted in Figure 4. Moreover, the contributions of the morning and evening façades are around 36% no matter which climate or latitude the building is in. The contribution of the northern façade is also around 6%, except Stavanger because of higher diffuse radiation on building skins, the incident radiation there is around 9%.

4. Climate and Radiation

On a sunny day, the solar spectral irradiance of different hours of a day is as shown in Figure 5. (Standard number ASTM G-173-03).
What is interesting in this data is that it seems what changes in daytime hours is the power of the wavelengths with a specific ratio or proportion. For example, it appears that the values of spectral irradiance at 11:00 are twice as big as the spectral irradiance at 09:00 on every wavelength.
A normalisation procedure would be a useful asset to evaluate the spectral characteristics of the solar spectra measured at various times and climates. The spectral irradiance has been normalised with respect to the intensity value measured at 560 nm at the same location and in the same spectrum (because environmental conditions have the least effect on the intensity at this wavelength). The normalised spectra during the day, during the year, and for an overcast day have been presented in Figure 6 [40].
The most striking result to emerge from Figure 6 is that, in a cloudy sky or on an overcast day, a significant portion of IR radiation is absorbed by the clouds and the normalised amounts of UV and visible light spectrum during both weather conditions is almost the same. In other words, it could be perceived that the sky attempts to eliminate IR radiation in overcast days while the normalised spectral irradiance of the UV and visible light spectrum is following the same pattern.
The normalised spectral irradiance for different hours of a sunny day, regardless of the season, is following the same patterns. It means that the effect of solar altitude on the spectral irradiance of different wavelengths is uniform.
Interestingly, there are differences in the normalised spectral irradiance of UV and IR radiation during a sunny day in winter and summer while the normalised spectral irradiance of the visible light spectrum during the winter and summer is almost the same. Therefore, the effect of the seasonal declination on the spectral irradiance of different wavelengths is as follows: for the UV spectrum, the normalised spectral irradiance during a sunny day in summer is more than winter; in terms of IR radiation, the normalised spectral irradiance during a sunny day in winter is more than in summer; finally, in terms of the visible light spectrum, the normalised spectral irradiance is not dependent on seasonal declination.
The relation between solar spectral irradiance and climates is interesting and important because the intensity of solar radiation components and, more specifically, direct and diffuse radiations, is closely linked to the climate. In overcast days or a climate with several cloudy days, a significant portion of the incident solar radiation on building skins is diffuse radiation (Table 2) and the sky absorbs a significant portion of IR irradiance (Figure 6f). Therefore, it could be concluded that the contribution of the IR radiation to diffuse radiation is less than its contribution to beam radiation on building skins.

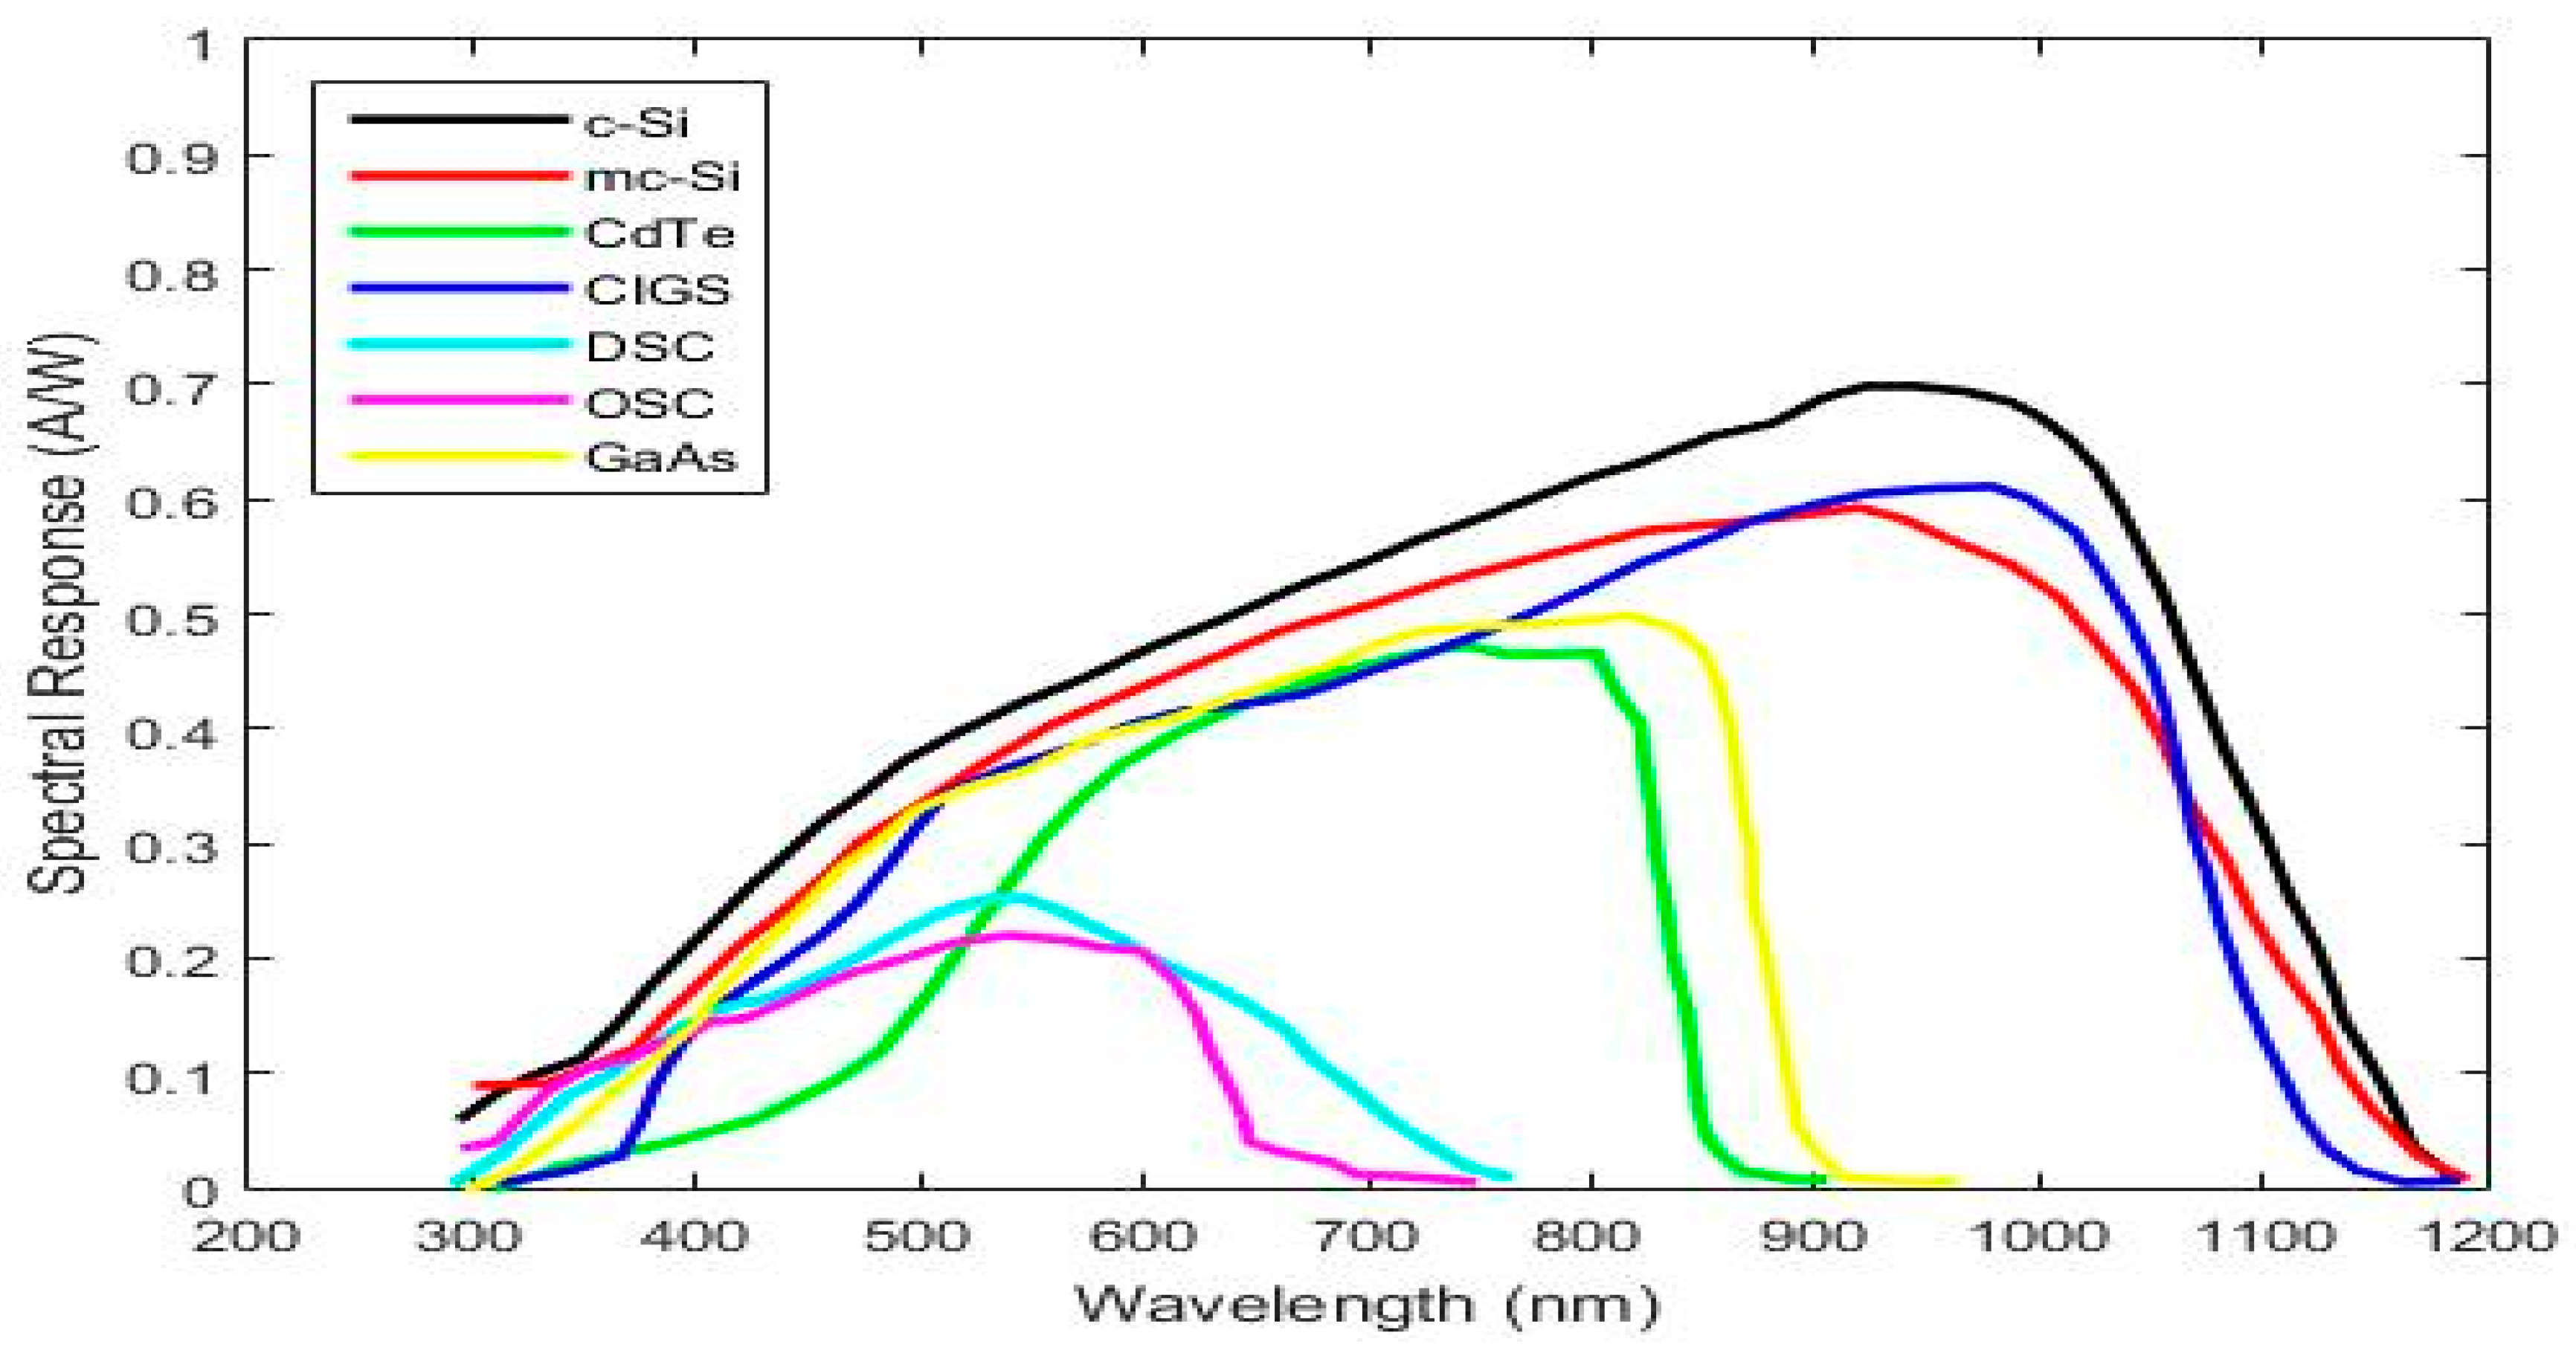
5. Climate and Technology

The energy of each photon is inversely proportional to the wavelength of the associated wave and the BIPV materials are ionised by photons with energies higher than their bandgap. In other words, the BIPV materials are ionised by wavelengths lower than the wavelength corresponding to their bandgap. Figure 7 shows the absorption wavelengths of crystalline Silicon and Germanium as an example on the solar spectrum.
Since Ge can absorb most of the solar spectrum, it might lead to creating only Ge cells. However, what is essential in BIPV materials is their efficiency and not their ability to absorb a wider band. Ge cells produce much more current per square centimeters than Si cells do, but their generated voltage is much smaller. Therefore, the output power per area unit and the efficiency of Ge would be lower than Si. Figure 8 illustrates all these explanations by Si and Ge Current-Voltage and Power-Voltage curves.
Figure 9 represents the spectral responses of a variety of BIPV technologies. They can be divided into three categories based on their spectral responses.
The dye-sensitised solar cell (DSC) and organic solar cell (OSC) are placed in the first group. The spectral responses of this group are almost adjusted to the visible light spectrum. It means that the efficiencies of these technologies are only correlated to the visible light spectrum. As mentioned earlier, the contribution of the visible light spectrum to the beam or diffuse radiation is almost the same. Therefore, it can be concluded that the efficiencies of DSC and OSC technologies are almost constant in different climates and radiation conditions, such as either low radiation or clear sky condition.
The second group includes Copper Indium Gallium Selenide (CIGS), monocrystalline Silicon (c-Si), and multi-crystalline Silicon (mc-Si). Their spectral responses cover wavelengths less than 1200 nm, but with different efficiencies. This means that the efficiencies of these technologies would drop down in a climate with several overcast days due to their significant dependency on IR radiation.
Two remaining technology, Gallium Arsenide (GaAs) and Cadmium Telluride (CdTe) constitute the third group. These materials are sensitive to UV, visible, and IR radiation of less than 900 nm. It means that their efficiency is neither completely dependent on the visible light (like the first group) nor that much dependent on the IR radiation (like the second group). The efficiency of this group will be degraded in a climate such as Stavanger but not as much as the second group.
All in all, it can be concluded that-in terms of efficiency-the performance of the first group would be the most stable option in different climates and radiation conditions. Furthermore, a significant reduction in the efficiency of the second group in a climate with a high contribution of beam radiation compared to a climate with a high contribution of diffuse radiation is predictable. It is worth mentioning also that, in terms of climates like the one in Dubai with several sunny days during the year, there is great potential of gaining solar energy using technologies that are based on concentration, like concentrated photovoltaics technology. On the other hand, for climates with several overcast sky days like Stavanger, solar technology based on the concentration idea is not a suitable choice because of low annual beam radiation in this climate.

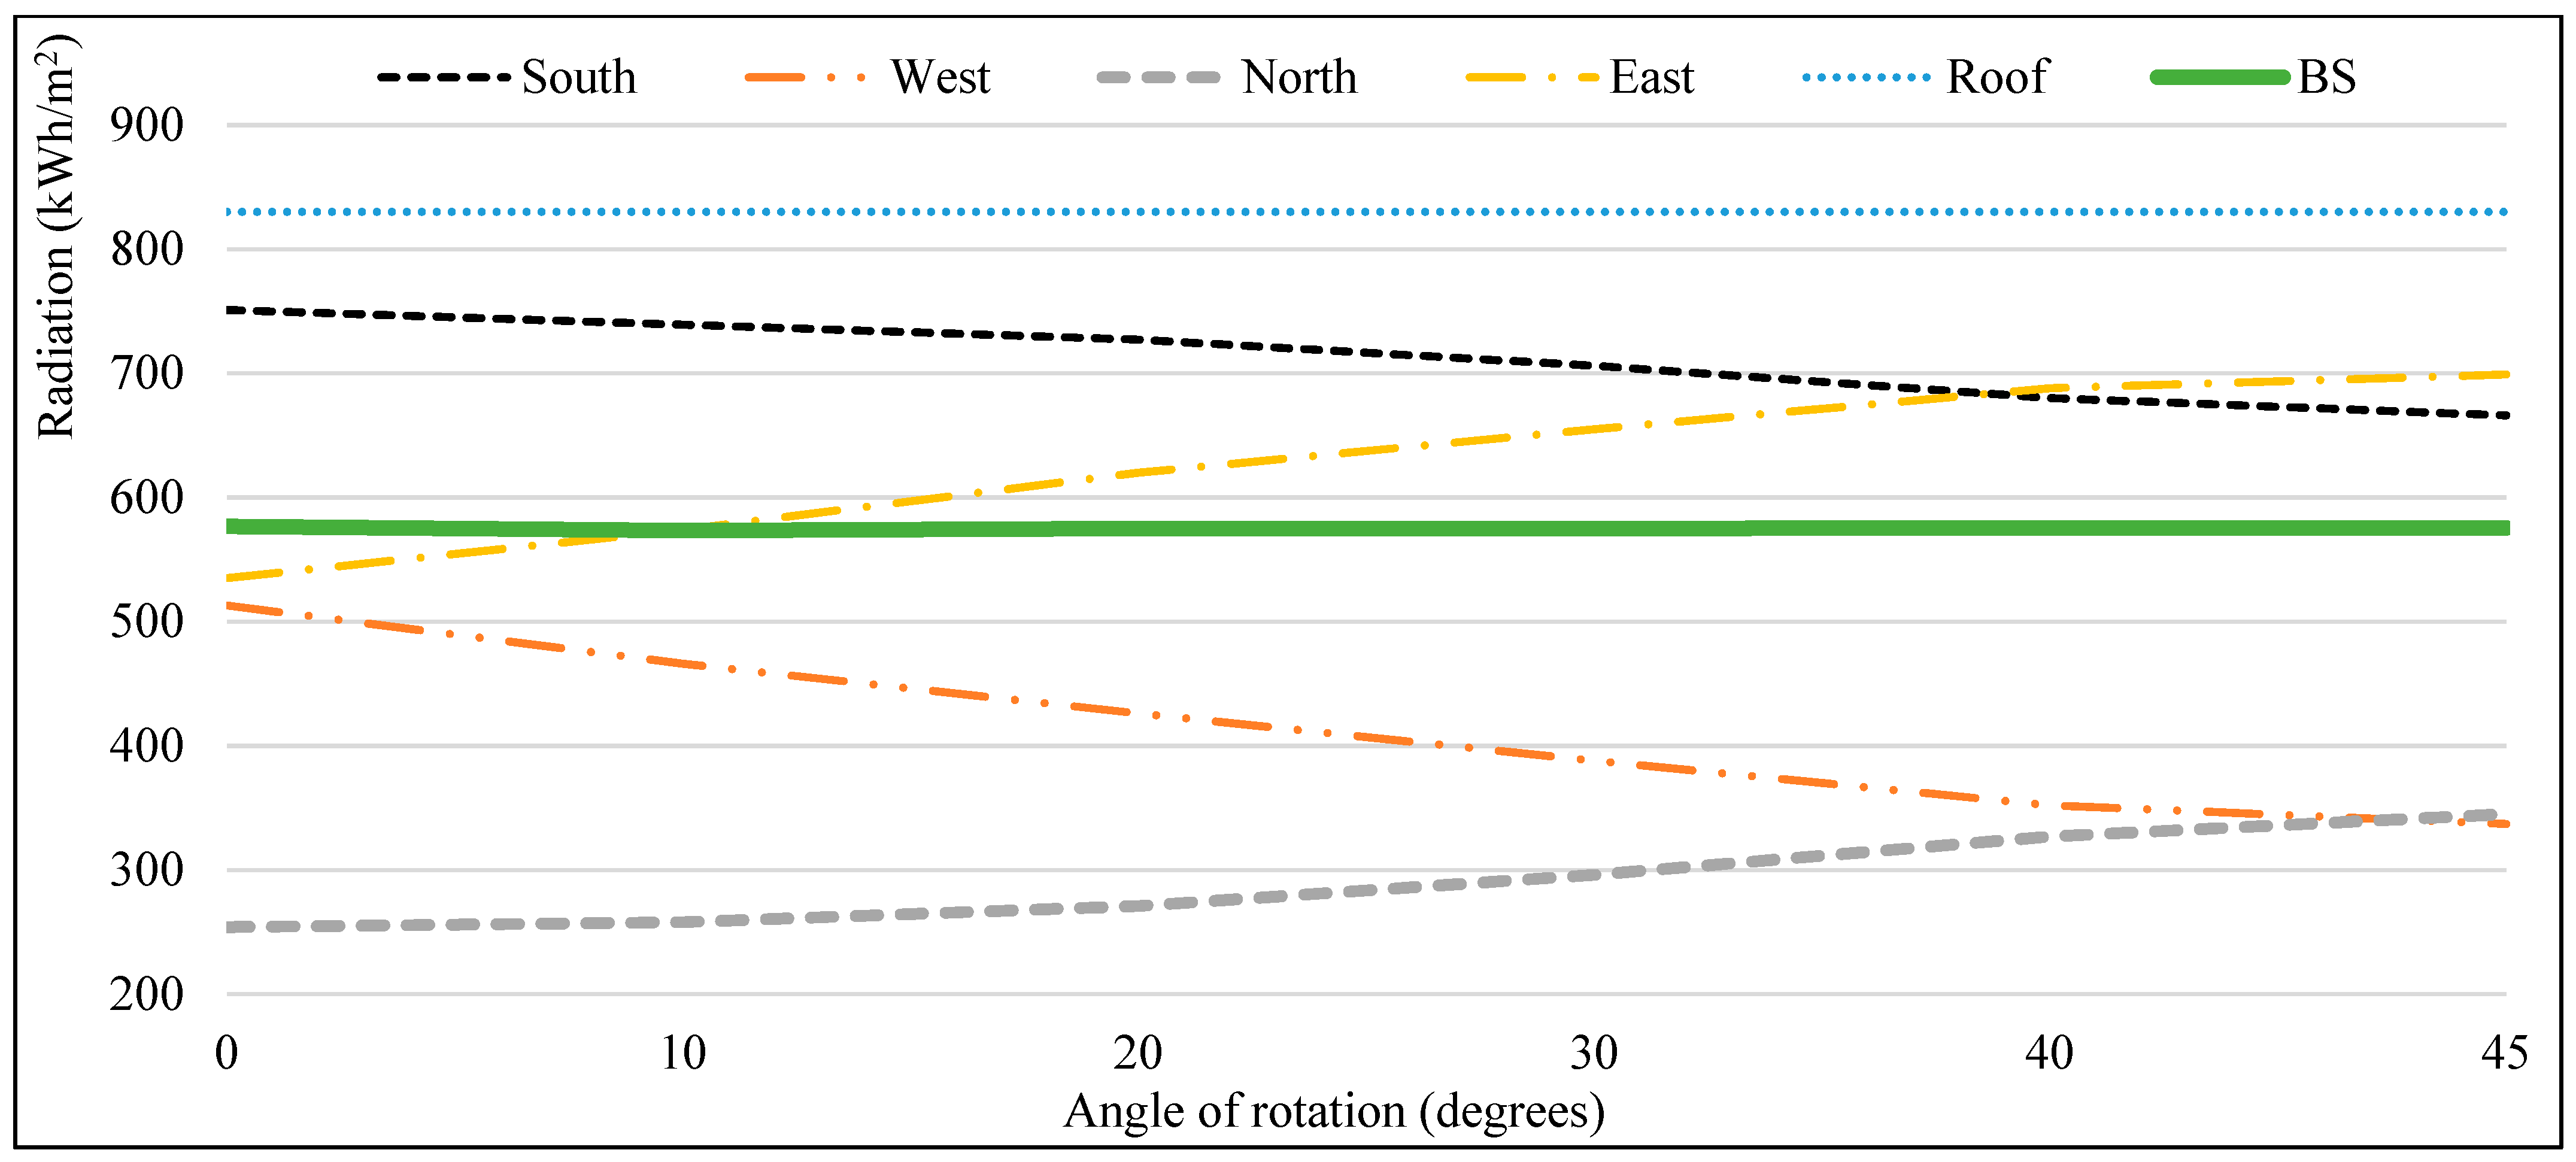
6. Sensitivity Analysis of Solar Irradiance and Building Orientation

A sensitivity analysis is done for one of the case studies (Stavanger) in order to evaluate the effect of orientations of the building facades on the quantity of BS as well as the contribution of the solar radiation components. The building is rotated clockwise by the angle of rotations of 10, 20, 30, 40 and 45 degrees and the result is presented in Figure 10. The most interesting aspect of Figure 10 is that the values of BS are almost constant, regardless of the building orientation. Since the radiation on the roof is constant as well, it can be concluded that the total radiation on the building facades is always a constant value that is spread between different facades with different orientations.
The correlation between the contribution of the solar radiation components on building skins and building orientation is the same as the correlation of BS and the building orientation. The contribution of solar radiation components to the BS in Stavanger is always 38%, 53% and 9% for the beam, diffuse and reflected radiation, respectively, regardless of the building orientation. The results of this sensitivity analysis for Stavanger is consistent with other case studies.

7. Conclusions

This study has gone some way towards enhancing our understanding of solar radiation components on building skins with different orientations in different climates. Although the current study is based on four case studies, the findings suggest that the solar radiation potential of BIPV material as a building envelope material for the whole building skins is significant (576, 869, 1043, 1284 kWh per square meters for Stavanger, Bern, Rome, and Dubai). The BS values are slightly more than the morning and evening façade potentials of the case study.
It is also concluded that the climate is a significant factor when it comes to the contribution of incident solar radiation components on a surface. In other words, in order to choose the suitable solar technology to produce energy from incident solar radiation, the climate of the location needs to be studied precisely.
The evidence from this study suggests that in climates with higher diffuse radiation, the contribution of IR radiation decreases. Therefore, the efficiency of BIPV materials that their spectral responses are dependent on the IR radiation (like Si and CIGS) in such a climate would drop down meaningfully. On the other hand, organic and dye-sensitised solar cells could be a good option for a cloudy climate since they have a more stable performance even in such a climate. Although, their efficiency compared to other BIPV materials, such as Si-based BIPV solar cells, is still significantly less until now.
Finally, when it comes to the impact of the climate on the BIPV system, BIPV performance is also very much dependent on temperature and it should also be considered simultaneously with other factors mentioned in this study. In fact, the effect of some of the parameters being considered in this study (spectral response vs. type of solar radiation availability) may be of the same order of magnitude as those coming from temperature. Soiling and snowfall are, of course, other very important issues in some of the climates considered. These are important issues for future research and a further study with more focus on the mentioned parameters is therefore suggested.

Author Contributions

Conceptualization, Hassan Gholami; Data curation, Hassan Gholami; Formal analysis, Hassan Gholami; Funding acquisition, Harald Nils Røstvik; Investigation, Hassan Gholami; Methodology, Hassan Gholami; Project administration, Hassan Gholami and Harald Nils Røstvik; Software, Hassan Gholami; Supervision, Harald Nils Røstvik; Validation, Hassan Gholami; Visualization, Hassan Gholami; Writing–original draft, Hassan Gholami; Writing–review & editing, Harald Nils Røstvik. All authors have read and agreed to the published version of the manuscript.

Funding

The work reported in this paper was supported by the Department of Safety, Economics, and Planning of the University of Stavanger (Project name: Building Integrated Photovoltaic (BIPV) in dense urban areas, Project number: IN-12011).

Institutional Review Board Statement

Not applicable.

Informed Consent Statement

Not applicable.

Acknowledgments

Special thanks also go to the Smart City Group and Future Energy Hub at the University of Stavanger for their support.

Conflicts of Interest

The authors declare no conflict of interest. The funders had no role in the design of the study; in the collection, analyses, or interpretation of data; in the writing of the manuscript, or in the decision to publish the results.

Nomenclature

°CDegree CelsiusIVCurrent-Voltage
AMAir masskWhKilowatt hour
BIPVBuilding integrated photovoltaicsLiDAR Light detection and ranging
BSBuilding skinmc-SiMulti-crystalline Silicon
CdTeCadmium Telluride nmNano meter
CIGSCopper Indium Gallium Selenide OSCOrganic solar cell
CM SAFSatellite application facility on climate monitoringPVGISPhotovoltaic geographical information system
c-SiMonocrystalline Silicon PVPower-Voltage
DDirect incident radiationSiSilicon
DSCDye-sensitized solar cell m2Square meter
GaAsGallium Arsenide TTotal incident radiation
GeGermanium UAE United Arab Emirates
GISGeographic information systemUVUltraviolet Radiation
IRShort wave infrared radiationWWatt

References

  1. Jing Yang, R.; Zou, P.X.W. Building integrated photovoltaics (BIPV): Costs, benefits, risks, barriers and improvement strategy. Int. J. Constr. Manag. 2015, 16, 39–53. [Google Scholar]
  2. Osseweijer, F.J.; Van Den Hurk, L.B.; Teunissen, E.J.; Van Sark, W.G. A comparative review of building integrated photovoltaics ecosystems in selected European countries. Renew. Sustain. Energy Rev. 2018, 90, 1027–1040. [Google Scholar] [CrossRef]
  3. Gholami, H.; Røstvik, H.N. Economic analysis of BIPV systems as a building envelope material for building skins in Europe. Energy 2020, 204, 117931. [Google Scholar] [CrossRef]
  4. Gholami, H.; Sarwat, A.; Hosseinian, H.; Khalilnejad, A. Evaluation of optimal dual axis concentrated photovoltaic thermal system with active ventilation using Frog Leap algorithm. Energy Convers. Manag. 2015, 105, 782–790. [Google Scholar] [CrossRef]
  5. Gholami, H.; Khalilnejad, A.; Gharehpetian, G. Electrothermal performance and environmental effects of optimal photovoltaic–thermal system. Energy Convers. Manag. 2015, 95, 326–333. [Google Scholar] [CrossRef]
  6. Mohammadi, F.; Gholami, H.; Menhaj, M.B. Effect of ventilation on yearly photovoltaic performance. In Proceedings of the 1st International Conference on New Research Achievements in Electrical and Computer Engineering, Tehran, Iran, 13 May 2016. [Google Scholar]
  7. Ibrahim, A.; Fudholi, A.; Sopian, K.; Othman, M.Y.; Ruslan, M.H. Efficiencies and improvement potential of building integrated photovoltaic thermal (BIPVT) system. Energy Convers. Manag. 2014, 77, 527–534. [Google Scholar] [CrossRef]
  8. Agrawal, B.; Tiwari, G. Life cycle cost assessment of building integrated photovoltaic thermal (BIPVT) systems. Energy Build. 2010, 42, 1472–1481. [Google Scholar] [CrossRef]
  9. Shukla, A.K.; Sudhakar, K.; Baredar, P. A comprehensive review on design of building integrated photovoltaic system. Energy Build. 2016, 128, 99–110. [Google Scholar] [CrossRef]
  10. Esmailian, E.; Gholami, H.; Røstvik, H.N.; Menhaj, M.B. A novel method for optimal performance of ships by simultaneous optimisation of hull-propulsion-BIPV systems. Energy Convers. Manag. 2019, 197, 111879. [Google Scholar] [CrossRef]
  11. Biyik, E.; Araz, M.; Hepbasli, A.; Shahrestani, M.; Yao, R.; Shao, L.; Essah, E.; Oliveira, A.C.; del Caño, T.; Rico, E.; et al. A key review of building integrated photovoltaic (BIPV) systems. Eng. Sci. Technol. Int. J. 2017, 20, 833–858. [Google Scholar] [CrossRef]
  12. Jelle, B.P.; Breivik, C.; Røkenes, H.D. Building integrated photovoltaic products: A state-of-the-art review and future research opportunities. Sol. Energy Mater. Sol. Cells 2012, 100, 69–96. [Google Scholar] [CrossRef] [Green Version]
  13. Brito, M.; Freitas, S.; Guimarães, S.; Catita, C.; Redweik, P. The importance of facades for the solar PV potential of a Mediterranean city using LiDAR data. Renew. Energy 2017, 111, 85–94. [Google Scholar] [CrossRef]
  14. Saretta, E.; Caputo, P.; Frontini, F. A review study about energy renovation of building facades with BIPV in urban environment. Sustain. Cities Soc. 2019, 44, 343–355. [Google Scholar] [CrossRef]
  15. Groppi, D.; De Santoli, L.; Cumo, F.; Garcia, D.A. A GIS-based model to assess buildings energy consumption and usable solar energy potential in urban areas. Sustain. Cities Soc. 2018, 40, 546–558. [Google Scholar] [CrossRef]
  16. Vulkan, A.; Kloog, I.; Dorman, M.; Erell, E. Modeling the potential for PV installation in residential buildings in dense urban areas. Energy Build. 2018, 169, 97–109. [Google Scholar] [CrossRef]
  17. Urbanetz, J.; Zomer, C.D.; Rüther, R. Compromises between form and function in grid-connected, building-integrated photovoltaics (BIPV) at low-latitude sites. Build. Environ. 2011, 46, 2107–2113. [Google Scholar] [CrossRef]
  18. Yoon, S.; Tak, S.; Kim, J.; Jun, Y.; Kang, K.; Park, J. Application of transparent dye-sensitised solar cells to building integrated photovoltaic systems. Build. Environ. 2011, 46, 1899–1904. [Google Scholar] [CrossRef]
  19. Domjan, S.; Arkar, C.; Begelj, Ž.; Medved, S. Evolution of all-glass nearly Zero Energy Buildings with respect to the local climate and free-cooling techniques. Build. Environ. 2019, 160, 106183. [Google Scholar] [CrossRef]
  20. Gholami, H.; Røstvik, H.N.; Müller-Eie, D. Holistic economic analysis of building integrated photovoltaics (BIPV) system: Case studies evaluation. Energy Build. 2019, 203, 109461. [Google Scholar] [CrossRef]
  21. Gholami, H.; Røstvik, H.N.; Müller-Eie, D. Analysis of solar radiation components on building skins for selected cities. In Proceedings of the 14th Conference on Advanced Building Skins, Bern, Switzerland, 28–29 October 2019; pp. 541–549. [Google Scholar]
  22. Gholami, H.; Røstvik, H.N.; Kumar, N.M.; Chopra, S.S. Lifecycle cost analysis (LCCA) of tailor-made building integrated photovoltaics (BIPV) façade: Solsmaragden case study in Norway. Sol. Energy 2020, 211, 488–502. [Google Scholar] [CrossRef]
  23. Nofuentes, G.; García-Domingo, B.; Muñoz, J.; Chenlo, F. Analysis of the dependence of the spectral factor of some PV technologies on the solar spectrum distribution. Appl. Energy 2014, 113, 302–309. [Google Scholar] [CrossRef]
  24. Brennan, M.; Abramase, A.; Andrews, R.; Pearce, J. Effects of spectral albedo on solar photovoltaic devices. Sol. Energy Mater. Sol. Cells 2014, 124, 111–116. [Google Scholar] [CrossRef] [Green Version]
  25. Nofuentes, G.; De La Casa, J.; Solís-Alemán, E.M.; Fernández, E.F. Spectral impact on PV performance in mid-latitude sunny inland sites: Experimental vs. modelled results. Energy 2017, 141, 1857–1868. [Google Scholar] [CrossRef]
  26. Photovoltaic Geographical Information System (PVGIS). Overview of PVGIS Data Sources and Calculation Methods. Available online: https://ec.europa.eu/jrc/en/PVGIS/docs/methods (accessed on 1 January 2021).
  27. Amillo, A.G.; Huld, T.; Müller, R. A new database of global and direct solar radiation using the eastern meteosat satellite, models and validation. Remote Sens. 2014, 6, 8165–8189. [Google Scholar] [CrossRef] [Green Version]
  28. Mueller, R.; Behrendt, T.; Hammer, A.; Kemper, A. A New Algorithm for the Satellite-Based Retrieval of Solar Surface Irradiance in Spectral Bands. Remote Sens. 2012, 4, 622–647. [Google Scholar] [CrossRef] [Green Version]
  29. Mueller, R.; Matsoukas, C.; Gratzki, A.; Behr, H.; Hollmann, R. The CM-SAF operational scheme for the satellite based retrieval of solar surface irradiance—A LUT based eigenvector hybrid approach. Remote Sens. Environ. 2009, 113, 1012–1024. [Google Scholar] [CrossRef]
  30. Bollmeyer, C.; Keller, J.D.; Ohlwein, C.; Wahl, S.; Crewell, S.; Friederichs, P.; Hense, A.; Keune, J.; Kneifel, S.; Pscheidt, I.; et al. Towards a high-resolution regional reanalysis for the European CORDEX domain. Q. J. R. Meteorol. Soc. 2015, 141, 1–15. [Google Scholar] [CrossRef]
  31. Hennermann, K.; Berrisford, P. ERA5 Data Documentation. Copernicus Knowledge Base. 2017. Available online: https://confluence-test.ecmwf.int/display/CKB/ERA5%3A+data+documentation (accessed on 1 January 2021).
  32. Peel, M.C.; Finlayson, B.L.; McMahon, T.A. Updated world map of the Köppen-Geiger climate classification. Hydrol. Earth Syst. Sci. Discuss. 2007, 439–473. [Google Scholar]
  33. Climate-Data.org. Climate Stavanger. 2018. Available online: https://en.climate-data.org/europe/norway/rogaland/stavanger-647/ (accessed on 1 January 2021).
  34. Climate-Data.org. Climate Bern. 2018. Available online: https://en.climate-data.org/europe/switzerland/bern/bern-55/ (accessed on 1 January 2021).
  35. MeteoSwiss. Climate Normals Bern/Zollikofen Reference Period 1981−2010. Available online: https://www.meteoswiss.admin.ch/product/output/climate-data/climate-diagrams-normal-values-station-processing/BER/climsheet_BER_np8110_e.pdf (accessed on 1 January 2021).
  36. Climate-Data.org. Climate Rome. 2018. Available online: https://en.climate-data.org/europe/italy/lazio/rome-1185/ (accessed on 1 January 2021).
  37. Climate-Data.org. Climate Dubai. 2018. Available online: https://en.climate-data.org/asia/united-arab-emirates/dubai/dubai-705/ (accessed on 1 January 2021).
  38. Data, C. Climate of European Cities. Available online: https://www.climatedata.eu/climate.php?loc=itxx0067&lang=en (accessed on 1 January 2021).
  39. World Weather & Climate Information. Average Monthly Hours of Sunshine in Dubai. Available online: https://weather-and-climate.com/average-monthly-hours-Sunshine,dubai-ae,United-Arab-Emirates (accessed on 1 January 2021).
  40. Cornaro, C.; Andreotti, A. Solar spectral irradiance measurements relevant to photovoltaic applications. In Proceedings of the International Conference on Applied Energy (ICAE 2011), Perugia, Italy, 16 May 2011. [Google Scholar]
  41. National Technology and Engineering Solutions of Sandia. Spectral Response. Available online: https://pvpmc.sandia.gov/modeling-steps/2-dc-module-iv/effective-irradiance/spectral-response/ (accessed on 1 January 2021).
Figure 1. The solar spectral irradiance outside and inside of the atmosphere.
Energies 14 01847 g001
Figure 2. Annual incident solar radiation on a flat roof in the selected cities as per the databases.
Energies 14 01847 g002
Figure 3. Incident solar radiation components on building skins of the cities.
Energies 14 01847 g003
Figure 4. The seasonal declination differences of the sun, viewed from a building in the northern hemisphere.
Energies 14 01847 g004
Figure 5. Solar spectral irradiance of different hours of a clear day.
Energies 14 01847 g005
Figure 6. (a) Daily spectra variation of a clear day in March; (b) daily spectra variation of a clear day in May; (c) daily spectra variation of a clear day in July; (d) daily spectra variation of a clear day in December; (e) Normalised spectra for July and December; (f) irradiance spectra taken on the 5th (clear day) and 8th (overcast day) of December. [40].
Energies 14 01847 g006aEnergies 14 01847 g006b
Figure 7. The absorption wavelengths of Si and Ge.
Energies 14 01847 g007
Figure 8. The I-V and P-V curves of Si and Ge BIPV cells.
Energies 14 01847 g008
Figure 9. Spectral responses from a variety of BIPV cell technologies [41].
Energies 14 01847 g009
Figure 10. The correlation of radiation on the building skins and the building orientation in Stavanger.
Energies 14 01847 g010
Table 1. The Geographical information of the selected cities.
CityCountryLatitude
(Degree)
Longitude
(Degree)
Altitude
(Degree)
StavangerNorway58.965.7315
BernSwitzerland46.947.45542
RomeItaly41.9012.4932
DubaiUAE25.2755.290
Table 2. Annual incident solar radiation on building skins with the contribution of each component.
CityOrientationTotal Radiation (kWh/m2)Direct Radiation Contribution (%)Diffuse Radiation Contribution (%)Reflected Radiation Contribution (%)
StavangerSouth75147%42%11%
East53539%48%13%
West51338%49%13%
North2546%74%21%
Roof83140%60%0%
BS57738%52%9%
BernSouth113856%32%11%
East81650%38%12%
West76349%39%12%
North2968%71%21%
Roof133458%42%0%
BS86951%40%9%
RomeSouth134059%29%12%
East95953%35%12%
West92752%36%12%
North31510%70%20%
Roof167665%35%0%
BS104356%36%9%
DubaiSouth134452%32%16%
East118251%36%13%
West115451%36%13%
North43311%67%22%
Roof231168%32%0%
BS128555%36%9%
Table 3. Average annual hours of sunshine [38,39].
CityNumber of Hours
Stavanger1538
Bern1639
Rome2516
Dubai3570
Publisher’s Note: MDPI stays neutral with regard to jurisdictional claims in published maps and institutional affiliations.

