Abstract
As electric vehicles are gaining increasing worldwide interest, advances in driving range and safety become critical. Modern automotive battery management systems (BMS) compete with challenging performance and safety requirements and need to monitor a large amount of battery parameters. In this paper, we propose power line communications (PLC) for high voltage (HV) traction batteries to reduce the BMS wiring effort. By modeling a small-scale battery pack for frequencies up to 300 MHz, we predict the PLC channel transfer characteristics and validate the results using a PLC hardware demonstrator employing a narrowband single-carrier modulation. The results demonstrate that battery PLC is a demanding task due to low access impedances and cell coupling effects, yet transfer characteristics can be improved by optimal impedance matching. PLC for HV BMS not only saves weight and cost, but also improves flexibility in BMS design. PLC enables single-cell monitoring techniques such as online electrochemical impedance spectroscopy (EIS) without additional wiring. Online EIS can be used for in-situ state and temperature estimation saving extra sensors. This work unveils possible coexistence issues between PLC and battery monitoring. In particular, we demonstrate that certain PLC data or packet rates have to be avoided not to interfere with EIS measurements.
1. Introduction
The ever-increasing demand for safe and clean energy is pushing the development of innovative electrical energy storage and transportation systems. Electromobility has clearly become a key innovation topic over the last decade. One of the most essential modules of hybrid and battery electric vehicles (HEVs, BEVs) is the traction battery system. It limits both the power and the mileage of the electric vehicle (EV). Lithium-ion (Li-ion) batteries are most widely applied in EVs due to their high energy density, long lifespan and high efficiency [1,2]. As Li-ion batteries are sensitive to misapplications such as over or under voltage, a battery management system (BMS) has to ensure a safe, efficient, and reliable operation [3]. For battery state estimation such as state of charge (SOC) and state of health (SOH), the BMS requires external sensors attached to the cells, which traditionally measure voltage, current, and temperature [4]. In general, the BMS is implemented using a centralized or distributed topology, where the latter can be based on a multi or single-cell approach [5]. The single-cell approach offers the highest battery system modularity and variability and enables advanced single-cell monitoring techniques such as electrochemical impedance spectroscopy (EIS). From this perspective, the single-cell approach forms the foundation for the emerging field of smart cells and smart battery systems as recently reviewed in [6]. EIS is a powerful nondestructive method widely used for electrochemical process characterization, and gains significant interest in BMS applications, thereby often referred to as “online EIS” [7,8,9,10]. Using EIS, the battery cell’s complex impedance over frequency is determined by exciting the cell with an AC signal and measuring its response [11]. The quantity of publications available correlating EIS with SOC [12,13,14], SOH [14,15], and temperature [12,13,16,17] estimation demonstrates its high potential to improve future BMS designs in terms of safety and performance. A complete review of EIS applications utilized for commercial Li-ion cells can be found in [18].
Despite the benefits coming along with a single-cell-based BMS such as gaining additional cell information by the usage of EIS, the effort for additional wiring and hardware let the complexity and cost of the BMS increase. Data acquired by sensors attached to the cells need to be periodically sent to the central battery management unit (BMU), which is typically done via a serial communication bus system [19].
Recently, high voltage (HV) power line communication (PLC) has been proposed as an attractive and innovative communication technique to improve cost efficiency and reduce weight and wiring overhead in the battery system [20,21,22,23,24]. For HV PLC, the dedicated HV power lines including the HV battery are utilized as a communication channel by superimposing a modulated carrier signal. In this way, the existing serial communication bus could either be omitted or used as a redundant communication system to reduce failure risks. Putting it together, PLC over the traction battery could enable a single-cell-based BMS featuring EIS for advanced state estimation without the need for additional wiring.
We therefore propose a BMS architecture as illustrated in Figure 1, where each cell is equipped with a cell monitoring circuit (CMC) and a communication interface. The communication between the CMCs and the BMU is realized by PLC, and the traditional sensing of voltage (V), current (I), and temperature (ϑ) is upgraded by EIS monitoring circuits.
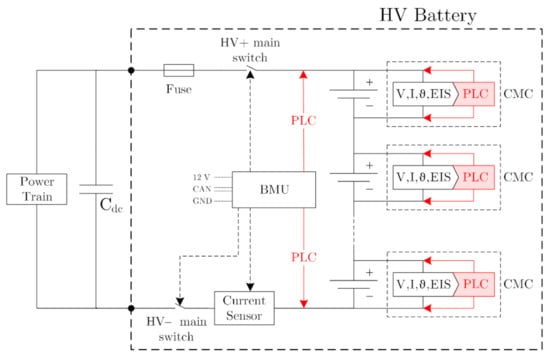
Figure 1.
Proposed BMS architecture enabling single-cell monitoring including EIS, while saving additional wiring effort by employing HV PLC. The HV battery supplies the electric power train and the DC-link capacitor . The BMU is connected to the 12 V on-board power supply and the control area network (CAN) of the EV.
Several challenges come along with integrating PLC and EIS into the battery system. Besides the characterization of the PLC channel and development of a suitable PLC modem, also the compatibility between PLC and the coexisting battery monitoring including EIS needs to be clarified. Beyond this, the HV power line channel provides a harsh environment for data communication as it is optimized for power transmission and suffers from many noise sources such as motor drives and DC/DC converters [25,26]. Specifically, the HV traction battery contains hundreds of single Li-ion cells to obtain sufficient energy and power capability [27]. This leads to an extensive number of PLC nodes, which is still accompanied by low PLC access impedances due to low-ohmic cell impedances [28].
While research on PLC for smart grids (e.g., [29]) and in-vehicle low voltage (LV) PLC (e.g., [26,30,31]) is already well advanced, HV PLC for automotive battery systems is still an emerging research field, where only little work has been published. The main reasons are its high Automotive Safety Integrity Level (ASIL) requirements [22] and the specific serial channel topology that is entirely different to conventional PLC systems, where all PLC modems are connected in parallel between the power line rails [32].
Takanashi et al. [33] developed an HV PLC system that can control multiple power electronic devices in real time. Although they evaluated the PLC channel characteristics of the HV power line, they did not consider a PLC within the HV battery pack.
First, Ouannes et al. [21] proposed an HV PLC for the potential application in an automotive BMS. By characterizing and modeling a prismatic Li-ion cell, they were able to predict the channel transfer characteristics of an HV PLC system. Continued in [34], the authors specialized on the physical layer performance analysis using different single and multi-carrier modulation techniques.
Bolsinger et al. [22] introduced a high frequency model of a prismatic Li-ion cell to simulate the PLC channel transfer characteristics in an HV battery stack and investigated serial and parallel PLC coupling methods.
In [24,35], Opalko et al. concentrated on PLC signal coupling using Rogowski coils, channel performance simulations, and disturbance investigations. For modeling the PLC channel, they extended the circuit-based model from [21] by a three-dimensional (3-D) electromagnetic (EM) model of the battery pack environment.
The cited previous works did not consider hardware implementations of PLC for battery cells. Still, small-scale PLC demonstrators for BMS applications can be found in various works [23,32,36] proving the concept of PLC for cylindrical Li-ion cells.
However, it becomes noticeable that the cited works concentrated on either PLC channel modeling or hardware implementation, and a comparison between predicted and actual channel characteristics on an implemented PLC system is missing in literature.
In this work, we address this issue by developing a novel bottom-up PLC channel model parametrized by high frequency (HF) impedance measurements and 3-D EM simulations on cylindrical 18650 Li-ion cells. Including coupling effects among adjacent cells, the cell-based model is scaled up to predict the channel transfer characteristics of a small battery pack, which is validated by using a real hardware PLC demonstrator that we have presented in [32].
To the best knowledge of the authors, there is no literature available investigating the compatibility of PLC and the coexisting BMS monitoring, which inherently share the same power lines. Thus, in the second part of this work, we will analyze the coexistence between PLC and BMS monitoring tasks such as voltage and online-EIS measurements and give suggestions how to avoid interference.
This paper is structured as follows: Section 2 presents the PLC hardware demonstrator. Section 3 introduces the PLC channel model components giving an insight into the high frequency properties of cylindrical Li-ion cells and their physical interpretation. In addition, capacitive and inductive coupling mechanisms are examined in detail by measurements and 3-D EM simulations. In Section 4, the model components are arranged to a complete PLC channel model to simulate the channel transfer characteristics. For the model validation, the PLC hardware demonstrator is used to compare the predicted with the actual channel characteristics. The coexistence between PLC and battery monitoring is investigated in Section 5, and Section 6 concludes the paper with a summary.
2. PLC Hardware Demonstrator
In our previous work [32], we developed a small-scale PLC demonstrator proving the concept of a single-cell-based PLC system. As illustrated in the schematic view of Figure 2a and the photograph of Figure 2b, a PLC system was designed involving six serially connected ICR18650-26J Li-ion cell with a nominal capacity of 2600 mAh (value from the datasheet) by Samsung SDI Co., Ltd. (Yongin, South Korea). Two printed circuit boards (PCBs) were developed each containing a PLC modem, PLC coupling networks and a stable power supply unit. The slave PCB is connected to and directly supplied by a single 18650 Li-ion cell, whereas the master PCB is attached in parallel to the small-scale battery pack being supplied externally. The PLC signal is fed into the HV power lines by coupling capacitors denoted as , thus high DC voltages are not a concern for the AC-coupled low voltage PLC signal. The PLC demonstrator employs a narrowband single carrier modulation using on-off keying (OOK) also known as binary amplitude shift keying (2-ASK). Narrowband communication was selected because of its high reliability and energy efficiency. The carrier frequency was chosen to be 20 MHz for the following reasons:
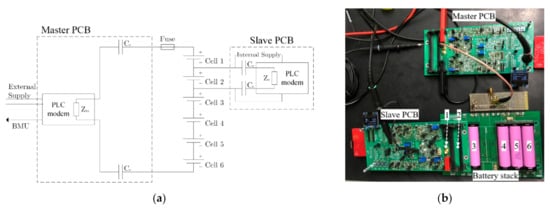
Figure 2.
PLC hardware demonstrator composed of a small-scale battery pack and both a master and a slave PCB comprising PLC modems and coupling circuits: (a) Schematic representation; (b) Photograph of the laboratory setup [32]. The slave board is connected to cell 2 as indicated in (a) by putting the PCB on top of the stack (b).
- (1)
- The PLC system needs to meet high data rate requirements of 2 Mbps as reported in [33,35]. High data rates are required because voltage and current measurements of all cells within the pack need to be updated every 50–100 ms [5].
- (2)
- Li-ion battery cells provide a low-ohmic access impedance to PLC devices. In consistence with [37], the access impedance defines the impedance seen by a PLC modem connected in parallel to a PLC access point, which in our case is a single Li-ion cell as indicated in Figure 2a. Due to their rolled-up geometrical structure, cylindrical Li-ion cells inherently exhibit an inductive nature for frequencies above some kilohertz [38]. Considering the inductive reactance , high frequencies are favorable to obtain a higher access impedance. As will be discussed in Section 3.1, frequencies above 1 MHz are preferred.
- (3)
- The HV power lines are corrupted by various electrical devices connected to the network, which generate impulsive noise [26]. Noise investigations on the voltage and current harmonic content of the HV power lines [31,33,39] revealed that the noise power decreases significantly for increasing frequency and can even be considered as “white” for narrow frequency bands above approximately 10 MHz.
- (4)
- The PLC system needs to comply with electromagnetic compatibility (EMC) regulations. For HV components, the EMC is tested according to CISPR 25 [40]. To keep radiated electromagnetic emissions to a minimum, PLC frequencies have to be selected as low as possible, which is contrary to (1)–(3), demanding a tradeoff between the stated points.
For proving the concept of PLC over battery cells, the hardware demonstrator was designed to establish a PLC link among a master and a slave modem connected to the battery pack as in Figure 2a. In various test scenarios, battery parameters such as cell voltage were recorded by the microcontroller on the slave PCB and periodically sent to the master upon request in a half-duplex communication. Data packets containing 12 bytes of data and a cyclic redundancy check (CRC) were sent to the master, while no bit errors were found. More information on the hardware implementation and verification can be found in [32]. To develop the presented proof-of-concept board further towards an actual PLC system for HV batteries, we will introduce our PLC channel modeling approach in the following Section.
3. PLC Channel Model Components
PLC system development requires a thorough understanding and modeling of the channel transfer characteristics. To gain broadband information about the PLC channel, a wide frequency range from 10 kHz to 300 MHz is considered in the following.
Commonly, there are two main approaches for PLC channel modeling reported in literature: deterministic and statistical [25]. The first approach relies on a detailed description of the network topology including accurate data link models, whereas the second approach uses statistical descriptions of the topology, often supplemented by extensive measurement campaigns used for model fitting [25]. Conventional in-home PLC systems usually require statistical modeling because the number of PLC coupling points and its locations within the system can vary [30].
In contrast, automotive HV batteries are large-format systems that are built from Li-ion cells connected in series, parallel or mixed configurations to obtain the necessary power for the traction motor and auxiliary systems [41]. Once implemented in the EV, the HV battery does not change its topology because no additional, unpredictable loads can be connected to the system except of an electric charger. Hence, we can consider the battery PLC system as static [24] enabling us to apply a deterministic channel modeling approach.
In the following, we present our bottom-up modeling approach, which is based on circuit-based models of (1) the battery cell, (2) coupling mechanisms among cells, and (3) the electrical connection between cells. The model components are derived from measurements and 3-D EM simulations and aim to describe the small-scale battery pack presented in the previous Section. Although it is quite common to use transmission line theory for PLC channel modeling [25], we applied circuit-based modeling throughout this work to obtain a meaningful PLC channel model allowing physical interpretations of the results. This is reasonable because the physical dimensions of the battery pack components are well below the considered wavelengths.
3.1. High Frequency Model of a Single Battery
As the development of EVs advances, an increasing number of highly dynamic loads such as DC/DC converters and motor drives are being connected to the HV battery. To predict their impact on conducted emissions in the HV power lines, high frequency modeling of batteries recently gained increasing attention [42]. However, as most of the reported HF battery models such as [21,22,43,44] are limited in frequency and follow a black-box approach, we presented a novel physical-based model of cylindrical Li-ion cells valid for frequencies from 1 kHz to 300 MHz in [45]. The derived equivalent electrical circuit (EEC) model is depicted in Figure 3a and can be considered as a grey-box model as it gives insights into different resistive-inductive effects occurring inside the battery in specific frequency bands. Besides, the physical-based model elements are related to the geometrical structure of the cell. In general, cylindrical Li-ion cells are manufactured by coating metallic current collector foils with the active electrode materials to form anode and cathode, which are wound with separator foils in between into a jelly roll. The rolled-up layers are usually placed into a firm metal casing, where metallic tabs connect the cathode to the positive terminal and the anode to the negative terminal and cell casing [46]. Typically, additional safety devices such as current interrupt devices (CIDs) are implemented [47].
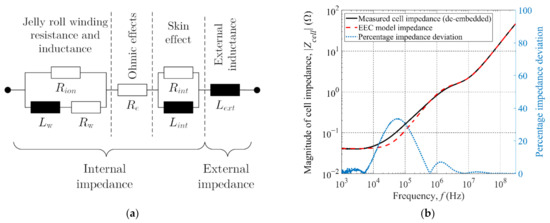
Figure 3.
High frequency characterization of a cylindrical battery cell: (a) Physical-based EEC battery model including internal and external cell impedance valid from 1 kHz to 300 MHz; (b) Measured and modeled HF impedance response versus frequency and percentage deviation.
The spiral structure inherently leads to an increased inductive behavior of the cell for high frequencies (already starting above some kilohertz), which is modeled by the inductance and the resistance of the current collector windings, and the ionic resistance of the stacked electrode layers. Remaining external inductive effects due to tabs, bonding wires, and the cell’s electrical length are summarized in the component . The resistance summarizes ohmic effects caused mainly by the limited electrolyte conductivity and contact resistances within layers and between layer interfaces. For frequencies above 10 MHz, the current penetration depth in the collector foils decreases due to electromagnetic field effects, which is known as the skin effect. The increasing current concentration on the conductor’s surface let the internal resistance of the conductor increase, while the internal inductance decreases. In the EEC model, this is described by and , respectively. It should be noted that the EEC model does not include electrochemical battery reactions with time constants >1 ms as they are not relevant for the PLC frequency range of interest [45]. The model was parametrized by HF impedance measurements on the Samsung ICR18650-26J Li-ion cell using a vector network analyzer (VNA) with the shunt-through method, which is specialized for broadband low-ohmic impedance measurements [48]. The model parametrization was optimized for PLC frequencies yielding an adequate fit from 500 kHz up to 300 MHz as visible in Figure 3b. The resulting fitted values of the EEC elements are summarized in Table 1. As designated in Figure 3a, the cell impedance can be separated into an internal and an external impedance part, where the external part formed by will interact with the environment as demonstrated in Section 3.2.2. The value of the external inductance is comparable with the self-inductance of a hollow cylinder with the same physical dimensions as the 18650 cell, suggesting a similar behavior of cell and cylinder for high frequencies. For a more detailed EEC model derivation and validation, the reader is referred to our previous work [45]. As mentioned before, the cell impedance is low-ohmic for low frequencies, which can be seen from the impedance modulus results in Figure 3b. For higher frequencies, the cell impedance increases because of its inductive properties and exhibits an impedance greater than 1 Ω above 1 MHz. Therefore, PLC frequencies above this frequency are preferred, although an access impedance of 1 Ω is still challenging [25]. Previous works focusing on larger prismatic Li-ion cells found similar impedance values for a 24 Ah cell [34] and significantly smaller values (≈0.2 Ω at 10 MHz) for a 34 Ah cell [49].

Table 1.
EEC elements of the battery model of Figure 3a including their physical interpretation and value range for the Samsung ICR18650-26J. The given frequency ranges indicate, where the elements contribute most to the overall impedance.
3.2. Capacitive and Inductive Coupling Effects between Cells
For an accurate PLC channel model, it is important not only to model the Li-ion cells, but also to include coupling mechanisms among cells in the model. When Li-ion cells are placed in close proximity, capacitive coupling between adjacent cells can be observed as reported in previous works [21,22,50]. Moreover, we also expect inductive coupling to be a significant contributor to the overall PLC channel characteristics. As no literature could be found on quantifying cell-coupling mechanisms over frequency, we investigate both broadband capacitive and inductive coupling in the following.
3.2.1. Capacitive Coupling
As can be seen from the PLC demonstrator photograph (Figure 2b), the cells are placed in triplet plastic cell holders, which ensure a distance of 1 mm between adjacent cells. To measure the coupling capacitance, two Samsung ICR18650-26J were placed next to each other into an unmounted triplet cell holder. Both cells are electrically isolated from each other and one pole of each cell was connected to a VNA port as illustrated in the inset of Figure 4a. Using the VNA reflect method [45], the high ohmic impedance between the two cells was determined by measuring the reflection coefficient , and the cell-to-cell coupling capacitance was calculated according to:
with the frequency and the characteristic impedance , which is 50 Ω in this work. As visible in the inset of Figure 4a, the “Y”-shaped VNA connector exhibits serial inductances as well as capacitive coupling between the connecting leads. These effects have been excluded by de-embedding techniques similar to [49]. To gain deeper insight into the capacitive coupling phenomenon, the cell holder was replaced by plastic spacers to alter the distance between the cells. The de-embedded measured coupling capacitances are depicted in Figure 4a for various cell distances. In addition, the raw measurement data of the “Y”-connector are given. As the results suggest, the broadband coupling capacitance is nearly constant above 1 MHz and exhibits approximately 10 pF for a distance of 1 mm. Below this frequency, the high-ohmic reactive impedance of is assumed to significantly deteriorate the VNA measurements. Due to the constant coupling above 1 MHz, we assume that the coupling capacitance is constant over the entire frequency range and only depends on the outer metal casings of the cells and the distance in between them. To prove this, Figure 4b compares the measured coupling capacitances at 20 MHz for various distances with two commonly used capacitor models. As visible, an accurate match could be achieved between measurement and the parallel-cylinder capacitor model [51]:
with the vacuum permittivity , the relative permittivity , the cell length 6.5 cm, the cell diameter mm, and the distance between the cells. The relative permittivity in (2) was set to 2.1 and can be seen as an average value of the cell surrounding. For further validation, the capacitive coupling has been simulated in CST Studio Suite® by Dassault Systemes Deutschland GmbH (Stuttgart, Germany) [52]. The 3-D EM simulation environment is depicted in Figure 5a and was used to calculate the static electric field and the coupling capacitance between two hollow metal cylinders with a 1 mm distance. The resulting electric field is presented in Figure 5b and the simulated coupling capacitance exhibits a value of 9.56 pF, which is close to the measurement value indicated in Figure 4b. As the relative permittivity of the cell holder made of thermoplastic polyester was not given in its datasheet, a typical value was chosen from literature ( 3 … 4 [53]). In conclusion, the capacitive coupling does not depend on the internal cell structure but only on the outer cell casings and their spacing. Further investigations also showed that the orientation of the cells (parallel or antiparallel cell polarity) had no influence.
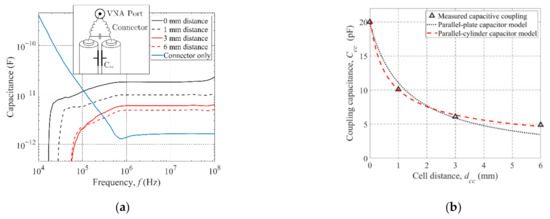
Figure 4.
Measured capacitive coupling between two adjacent cylindrical cells: (a) Measured coupling capacitance versus frequency for various distances between two cells; (b) Coupling capacitance at 20 MHz extracted from the measurements (a). For comparison, two commonly known capacitor models are added.
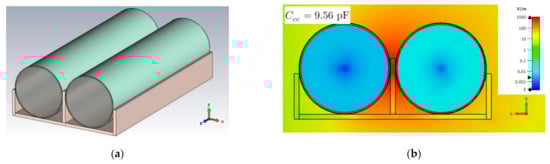
Figure 5.
3-D EM model to simulate capacitive coupling between cylindrical cells: (a) Model structure containing two hollow metal cylinders, PVC heat shrinking tubes, and plastic cell holder; (b) Static electric field distribution.
3.2.2. Inductive Coupling
If two wires are located in close proximity, a time-varying current in one wire generates a magnetic field that induces a voltage drop on the other wire. In circuit analysis, this phenomenon is described by mutual inductance [54]. In the following, we demonstrate that mutual inductive coupling can also be observed in the case of adjacent battery cells. To determine the mutual inductance between two cylindrical cells placed in parallel, the Grover method [55] was used, which links and the self-inductance of a single cell to the total inductance of two cells forming a current loop with:
Generally, this approach applies for linear conductors situated in parallel. To prove its validity also for cylindrical battery cells, a 3-D EM simulation was conducted using CST Studio Suite® (Dassault Systemes Deutschland GmbH, Stuttgart, Germany) A simplified 3-D cell model (depicted in Figure 6a) was used for the simulation because the derivation of a detailed 3-D cell model is out of scope of this work and can be found in literature as in [56]. The 3-D cell model consists of only one spirally wound copper (Cu) current collector foil, which is encased by a hollow metal cylinder and a PVC heat shrinking tube. Nickel (Ni) tabs are attached to the cell windings. The number of windings and tab positions match the Samsung ICR18650-26J and were derived from a computed tomography (CT) scan presented in our previous work [45]. The validity of using only one current collector instead of two is given by the fact that in [57], a strong inductive coupling was found between positive and negative current collectors leading to an effective winding inductance equal to the inductance of a single current collector as we demonstrated in [58]. Using the Partial RLC solver in the 3-D EM simulation, the self-, mutual, and loop inductance values could be determined and are summarized in Figure 6b. In the first two frequency decades of Figure 6b, the simulated self- and total inductance values decrease due to the skin effect, whereas the mutual inductance is nearly constant. The resonance visible at approximately 200 MHz is caused by the boundary conditions, which need to be set to electrical instead of open for the Partial RLC solver [52] and does not refer to the cell coupling.
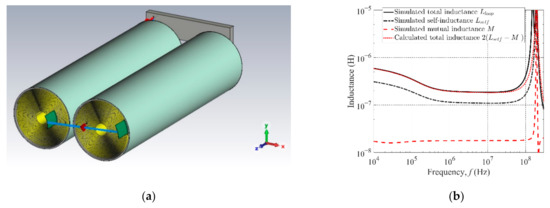
Figure 6.
3-D EM model to simulate inductive coupling between cylindrical cells: (a) Model structure containing two hollow metal cylinders with PVC heat shrinking tubes, one spirally wound Cu current collector, and two Ni tabs each; (b) Simulated and calculated loop, mutual, and self-inductances proving the validity of the Grover method [55].
As can be seen from Figure 6b, the simulated total inductance matches the calculated total inductance using (3) thus validating the Grover method for cylindrical battery cells. Solving (3) for , the Grover method can be used to determine the mutual inductance between two cells placed in parallel by measuring their total inductance and the self-inductance of a single cell.
For the loop inductance measurement, two 18650 cells were placed 1 mm apart and were electrically connected at one end by a solid wire as illustrated in the inset of Figure 7a. Using the VNA shunt-through method [48], the low-ohmic impedance of the serially connected cells was measured and de-embedded from the measurement setup considering lead inductances and the previously determined capacitance coupling. The resulting loop inductance of the two cells was calculated from the measured, de-embedded impedance using:
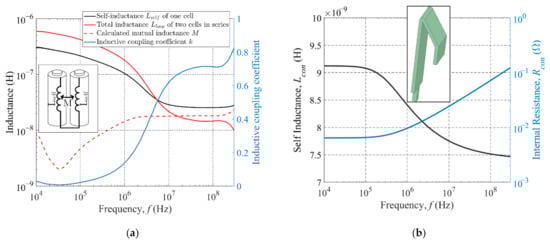
Figure 7.
Inductive coupling among adjacent cells and cell connector resistance and inductance: (a) Measured inductance values of single cells, two serially connected cells and calculated mutual inductive coupling; (b) Self-partial inductance and internal resistance of the cell holder contacts, obtained from 3-D EM simulations.
In the same way, (4) was used to derive the self-inductance of a single cell from the impedance measurement results shown in Figure 3b.
The resulting mutual inductance obtained by Equation (3) and the inductive coupling factor are summarized in Figure 7a. The inductive coupling factor is rather small below 1 MHz, yet increases significantly between 1 MHz and 20 MHz. Figure 7a also depicts the determined self-inductance of a single cell and the total inductance of two cells forming a loop. Both decrease remarkably for higher frequencies, which can be explained by the current distribution inside the cell, which changes over frequency. For frequencies below 1 MHz, most of the current flows in circumferential direction along the current collector windings, thus creating a high jelly roll inductance. At the same time, the metal casing of the cell is assumed to shield the inner magnetic field leading to a small overall inductive coupling. For higher frequencies above 1 MHz, the current tends to concentrate close to the outer cell casing because there, the current experiences the least cylinder inductance and thus reactive impedance [58,59]. In this frequency range, the value of the mutual inductance is approximately constant at 18 nH. This is in accordance with the simulation results of Figure 6b as well as with the mutual inductance formula of two parallel wires according to [55]:
Using the cell’s length 6.5 cm, the cell center distance 19 mm (i.e., 1 mm distance between the cells of 9 mm radius) and the permeability H/m of free space, (5) yields a mutual inductance of approximately 16 nH. Taking into account that (5) does not consider magnetic fringe field effects at the ends of the cells, the theoretical value fits the experimental results. This demonstrates that the external magnetic field of the battery being responsible for the inductive coupling resembles the external magnetic field of a cylindrical conductor with similar dimensions as the 18650, which is in accordance with the previous works [45,59]. While the mutual inductance above 1 MHz is nearly constant, the self and loop inductance values decrease significantly, which let the inductive coupling factor increase. In conclusion, for PLC frequencies above 1 MHz, significant inductive coupling has to be considered up to a coupling factor of 0.8 or mutual inductance values of 18 nH, respectively. The described experiments were also carried out for parallel cells with opposite orientation, showing no difference in the results similar to Section 3.2.1.
To include the mutual inductive coupling in the cell model of Figure 3a, two EEC cell models connected in series were fitted to the corresponding de-embedded impedance measurement of two cells. The results show that including a constant mutual inductance of 18 nH among the external inductances yields a meaningful match between model and measurement. Again, this demonstrates that the mutual inductance above 1 MHz can be considered nearly constant and applies only to the external inductance of the battery cell.
3.3. Electrical Cell Connection and Contact Resistance
Beside the cells and their electromagnetic interaction, also the electrical interconnection among the cells including contact resistances have to be considered in the PLC channel modeling process. For this, the self-inductance and resistance of the 18,650 cell holder contacts have been determined by 3-D EM simulations. The results are illustrated in Figure 7b, exhibiting the typical progression over frequency due to the skin effect. Additional contact resistances may occur between the cell terminals and the cell holder contacts, caused by material surface roughness and passivating film layers [60]. However, cell impedance measurements showed that contact resistances become negligible for high frequencies, which can be explained by capacitive coupling across the connecting interfaces [61].
4. PLC Channel Model and Transfer Characteristics
In this Section, the PLC channel model and simulation results regarding the transfer characteristics are demonstrated. Furthermore, the channel model is validated by measurements on the PLC hardware demonstrator. The simulations were carried out using the circuit simulator SPICE. By cascading the model components presented in Section 3, the small-scale battery pack of Figure 2a was rebuilt in the simulation environment. Figure 8 gives an insight into the cascaded model structure, where multiple EEC cell models are connected in a meandering pattern with the cell connectors, each one modeled by and (indicated by the grey boxes in Figure 8). The model also includes capacitive and inductive coupling effects identified in the previous Section 3 by the elements and , respectively. For better illustration, each internal cell impedance is marked by a yellow-colored box, showing no interaction with the environment as described in Section 3.1.
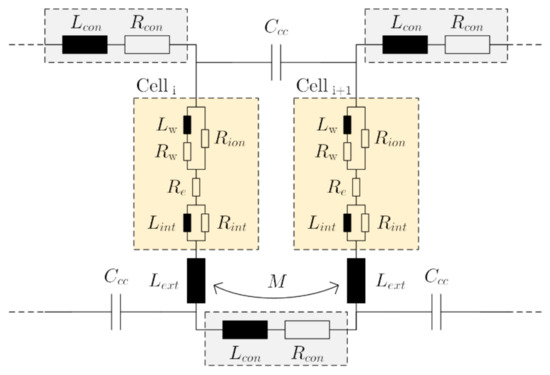
Figure 8.
PLC channel model segment including cascaded battery cell models, coupling capacitances, mutual inductance, and electrical connections (marked by grey boxes). The internal impedances of the cells (i, i + 1 …) are marked by yellow boxes.
4.1. PLC Channel Model Validation
Since the PLC channel model components of Section 3 were parametrized in the frequency domain, it is reasonable to validate the entire channel model in the time domain. For that, the PLC hardware demonstrator introduced in Section 2 was used to generate a real 2-ASK-PLC signal with 160 mVpp across the small-scale battery pack of Figure 2b (details on the signal generation can be found in [32]). The pack voltage and the individual cell voltages were measured and digitalized using an oscilloscope MSO58 by Tektronix GmbH (Cologne, Germany). The measured pack voltage was imported into the SPICE simulation providing an input signal to simulate the PLC voltage drops across the single cells. The results are illustrated in Figure 9a and b in case of cell 1 (leftmost cell in Figure 2b). The comparison between measurement and simulation gives a close match, thus graphically demonstrating the validity of the used PLC channel model. This is also confirmed by the low root mean square error (RMSE) between measurement and simulation, which is approximately 1.0 mV.
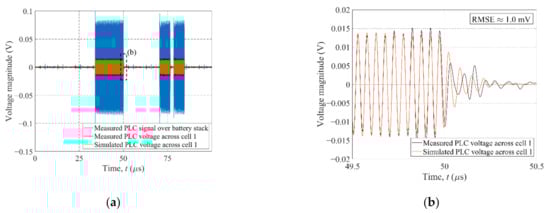
Figure 9.
PLC channel model validation using a real ASK-PLC signal generated by the PLC hardware demonstrator of Figure 2b: (a) Measured PLC voltages across battery stack (blue) and cell 1 (red) in comparison to the simulated PLC voltage across cell 1; (b) Magnified scope view of (a) highlighting the fit between measurement and simulation.
4.2. PLC Transfer Function Simulation
The PLC channel transfer characteristics were evaluated within the simulation for both master-to-slave (downlink) and slave-to-master (uplink) communication. To define the PLC transfer function, Figure 10 redraws the PLC system of Figure 2a as two-port network for the downlink case. The transmitter (TX) of the PLC master modem is linked via the two-port network of the PLC channel to the receiver (RX) of the PLC slave modem, which is located at an arbitrary Li-ion cell within the battery pack. The PLC channel is represented by the channel model of Figure 8. As input or access impedance, the master modem sees the entire pack impedance , whereas the slave modem sees the impedance of a single cell. Based on this representation, the downlink transfer function is given by the relationship between the PLC voltage across the slave cell and the voltage across the PLC master modem:
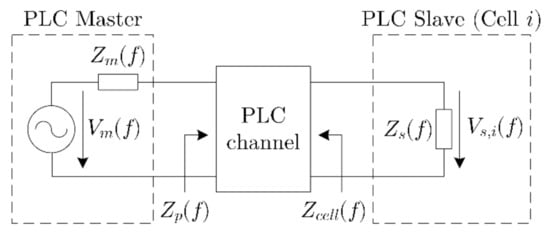
Figure 10.
PLC system as a two-port network. PLC master (TX) and slave modem (RX) are connected by the PLC channel model of Figure 8 exhibiting the downlink transfer function .
If the direction of communication is reversed, transmitter and receiver are swapped in Figure 10 and the uplink transfer function can be calculated likewise. Although and are in general different, we remark that they hold the property of wide sense symmetry [62]. Moreover, if , it follows that [63].
Both uplink and downlink transfer functions were simulated for all six cells of the battery stack using the PLC channel model of Figure 8. For the simulations, the channel model was connected to the master’s internal impedance via coupling capacitors to close the PLC current loop as shown in Figure 2a. Likewise, PLC slave modems were connected in parallel to the single cells. As in PLC systems, the goal is to increase the voltage amplitude rather than the power of the received signal [64], the transmitter’s output impedance is low-ohmic (<2 Ω for our demonstrator), whereas the receiver’s input impedance is set to high values (>100 kΩ in our case). The simulation results are given for downlink and uplink in Figure 11a,b, respectively. The outer cell nodes 1, 3, 4, 6 and the inner nodes 2, 5 show similar transfer characteristics. A more attenuated transfer function is seen across cells 2 and 5 for both uplink and downlink, which can be explained by enhanced inductive coupling in the middle position of the triplet cell holders. Considering the downlink, the battery pack can be seen as a voltage divider, with being the number of cells. Adopting this for our case, has an ideal value of 1/6 or −15.56 dB. As visible in Figure 11a, this value is reached by the outer cell nodes for frequencies >20 MHz. For lower frequencies, the inductance of the cell interconnections causes a higher channel attenuation. The inner cells differ from the outer cells having a 2 dB lower maximum value of located between 1 and 2 MHz. For frequencies above 80 MHz, of all cells is strongly affected by capacitive coupling. Similar observations can be made for the uplink case depicted in Figure 11b. However, has a lower attenuation than , which can be attributed to the master’s adjustable internal impedance . In the uplink case, forms a voltage divider with the battery pack as it is part of the PLC current loop. Therefore, by choosing a reasonably high impedance for , one can significantly improve the uplink transfer characteristics. Still, we remark that the access impedance at the slave nodes remains low, requiring higher currents to generate a viable PLC voltage compared to the downlink.
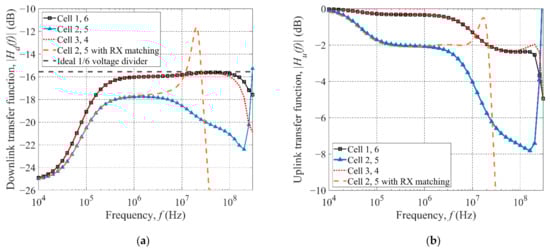
Figure 11.
Simulated PLC channel transfer characteristics for the small-scale battery pack of Figure 2a: (a) Master-to-slave (downlink) transfer function for all cells including an optimized transfer function by appropriate RX matching at the slave node to maximize the received PLC voltage. The ideal behavior of a 1/6 voltage divider is added for comparison; (b) Slave-to-master (uplink) transfer function for all cells including an optimized transfer function by appropriate RX matching at the master node to maximize the received PLC voltage.
Further simulations revealed that the PLC transfer characteristics can still be improved using the findings on optimized receiver impedance matching of [64], where the authors found the real part to be zero and the median value of the imaginary part close to zero in a series of case studies. Accordingly, to maximize the amplitude of the received voltage signal, the impedance of the PLC receiver is set to have the opposite imaginary value to the access impedance (i.e., the battery impedance) and a null real value. Evaluating the imaginary part of both single cell and battery pack impedance at the PLC carrier frequency yields a positive value of the reactance due to the inductive cell behavior. Using , we obtain capacitance values of 2.0 nF and 0.5 nF for PLC slave and master modems, respectively, generating the desired opposite reactance value at . Inserting the calculated capacitances as impedances and of the PLC modems for both uplink and downlink results in the optimized transfer characteristics at as drawn by the dashed orange lines in Figure 11a,b.
In conclusion, the developed PLC channel model can be used for predicting and optimizing the transfer characteristics of a PLC over batteries and can be used also for large-scale battery packs in future works.
5. Coexistence Analysis
For the development of a PLC system, it is essential to address the coexistence between PLC and the existing BMS cell monitoring circuits. Possible interference scenarios need to be examined in order to mitigate them in later design stages. In the following, we will consider the disturbance of BMS CMCs in terms of voltage, current, and impedance sensing caused by PLC signals. In general, the interference is two-fold as it can occur in both directions. However, one direction can be largely excluded.
5.1. PLC Disturbance by BMS Monitoring
BMS monitoring is expected not to cause severe PLC signal distortions for the following reasons: (1) Voltage and current measurements do not require additional excitation signals that could interfere with PLC signals. (2) The frequencies of EIS measurements (typically 1 mHz–10 kHz [65]) are much lower than typical PLC carrier frequencies (>1 MHz). Therefore, no PLC interference coming from the EIS circuitry is expected.
It should be added, though, that online EIS may use a periodical square wave as excitation signal as will be described in the experimental Section 5.2.1. In this case, higher harmonics are inherently present as given by the Fourier series of a periodical square wave with amplitude and frequency :
By calculating the series of harmonics with (7), their attenuation with respect to the fundamental can be determined. The first harmonic is attenuated by 9.54 dB, the third harmonic by 13.98 dB etc. Given the limited EIS frequency range and the fact that EIS voltage responses must not exceed amplitudes of 10 mV to ensure linearity [11], interference with PLC signals in the megahertz range is not expected.
In the case of EIS amplitudes higher than 10 mV, the nonlinear signal response of the battery can generate higher harmonics. As reported in [66], by using nonlinear frequency response analysis (NFRA), the authors were able to detect frequency components up to the fifth harmonic. Still, the electrochemical cell processes responsible for the nonlinearities were found to occur only below 200 Hz [66], which is far below PLC carrier frequencies.
Although PLC interference by BMS monitoring can be largely excluded for the stated reasons, the CMCs attached to the battery cells may alter the PLC channel characteristics. As shown in Figure 12, the PLC access impedance across a single cell node is decreased if the CMC used in the experiments in Section 5.2.1. is connected to the cell under investigation. The resonance at approximately 1.4 MHz is likely caused by the capacitive filter characteristics of the CMC. However, the impact on the overall PLC channel characteristics can be simply mitigated by choosing a PLC carrier frequency placed deliberately above the resonance or by the integration of decoupling circuits.
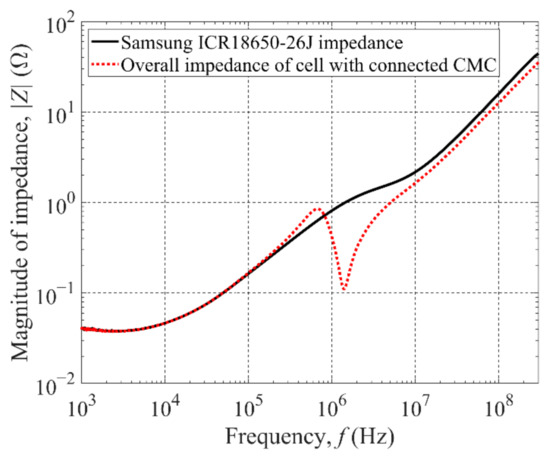
Figure 12.
Difference between single cell impedance and overall access impedance for the case that a CMC is attached to the cell.
5.2. BMS Monitoring Disturbance by PLC
PLC signals may interfere with cell monitoring tasks such as voltage, current and impedance measurements, when PLC frequency components are present in the baseband (<10 kHz). Since DC current and voltage measurements need to withstand electromagnetic interference (EMI) coming from the HV power lines, BMS cell monitoring circuits are usually equipped with EMI filters such as blocking capacitors [67]. Therefore, PLC signals are supposed to be filtered out by the EMI filtering devices and do not affect DC measurements. On the other hand, EIS involves cell perturbation by a single-tone AC voltage or current and acquiring the response signal in terms of amplitude and phase. The frequency-dependent cell impedance is then derived by the relationship between voltage amplitude and current amplitude and their phase shift at various frequencies :
For a rectangular excitation, the impedance is defined in a more general form considering the discrete Fourier transform (DFT) of cell voltage and current at the discrete frequencies :
The signal acquisition can be, for example, realized by a bandpass delta–sigma (∆-𝛴) analog-to-digital converter (ADC) as described in [10]. Supposing a PLC signal being present and containing a frequency component equal to an EIS measurement frequency, it is expected that the spectral component of the PLC signal may pass through the EIS filter structures thus distorting the EIS measurement. Although the frequency bands of EIS (1 mHz–10 kHz) and PLC (carrier frequency > 1 MHz) are quite different, in the following, we will demonstrate in detail that certain PLC data or packet rates may interfere with EIS measurements.
5.2.1. EIS Disturbance by PLC: Experimental Setup
For EIS interference investigations, we designed an experimental CMC board, whose basic structure is shown in Figure 13. A Samsung ICR18650-26J Li-ion cell is stimulated by a PLC signal and an EIS signal at the same time. The PLC signal is created by a signal generator allowing flexibility in terms of PLC amplitude, data rate, and modulation scheme. For impedance measurements, a prototype integrated circuit (IC) by Infineon Technologies AG (Neubiberg, Germany) is used. Besides temperature and DC cell voltage measurements, the IC performs a galvanostatic EIS by forcing an adjustable sinusoidal or rectangular (square wave) AC excitation and sensing the AC voltage response of the cell. The complex-valued cell impedance is determined by internal signal processing within the IC and can be plotted in a Nyquist plot as illustrated in Figure 13. Measurement accuracy and resolution are ensured by narrowband input filters, adjustable acquisition times and a sufficient dynamic range of the ADCs. The IC is supplied by a single Li-ion cell having a local ground reference, where it only sees the low voltage of a single cell rather than the high voltage of the entire pack.
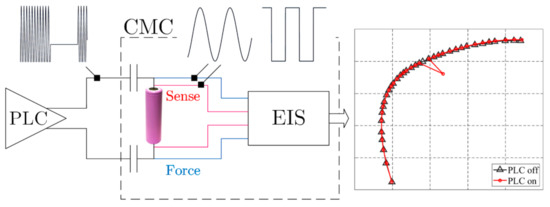
Figure 13.
Experimental setup comprising a Samsung ICR18650-26J Li-ion cell mounted on a CMC board with integrated online EIS by an Infineon prototype IC. An external signal generator can be connected to the CMC providing adjustable PLC signals.
During the experiments, a variety of experimental signal parameters have been modified, which are summarized in Table 2.
Table 2.
Experimental parameters of PLC and EIS signals.
During the experiments, a variety of experimental signal parameters have been modified, which are summarized in Table 2. EIS measurements were performed either for a single frequency or a complete frequency sweep as shown in Figure 13. Two different EIS excitation currents as well as different acquisition times per frequency point were used. For the PLC signals, various sinusoidal carrier amplitudes between 10 mVpp and 100 mVpp were investigated. Different narrowband digital modulation schemes such as 2-ASK, binary frequency shift keying (2-FSK), and binary phase shift keying (2-PSK) were also inspected. As modulating signal, we used a periodical square wave or a pseudo-random bit sequence (PRBS) that is sent either as permanent data stream or allocated in data packets. The modulation frequency (i.e., data rate) was altered between a few hertz and 2 MHz. For each parameter setting, the EIS measurement was conducted ten times and the results were averaged to increase the confidence level.
5.2.2. EIS Disturbance by PLC: Results and Discussion
Since the experimental parameters given in Table 2 lead to multitudinous combinations for both EIS and PLC signals, only selected interference scenarios are presented in the following. Stated beforehand, the majority of experiments did not lead to EIS interference by PLC. As the overall results suggest, an interference only occurs, when a PLC frequency component happens to be close to an EIS measurement frequency. In the experiments, this was found for PLC data or packet rates close to an EIS frequency point. A typical EIS result distorted by PLC can be seen in the Nyquist plot of Figure 13.
Figure 14a shows a time signal measured by an oscilloscope that exemplifies the superposition of a rectangular EIS excitation and a 2-ASK PLC signal modulated by a low data rate square wave. Due to the galvanostatic EIS excitation, both the cell’s voltage response and the applied PLC voltage accumulate and their sum will be measured by the EIS IC. If the frequency of the modulating square wave approaches an EIS frequency point , a selective disturbance of the measurement at can be observed as in Figure 13.
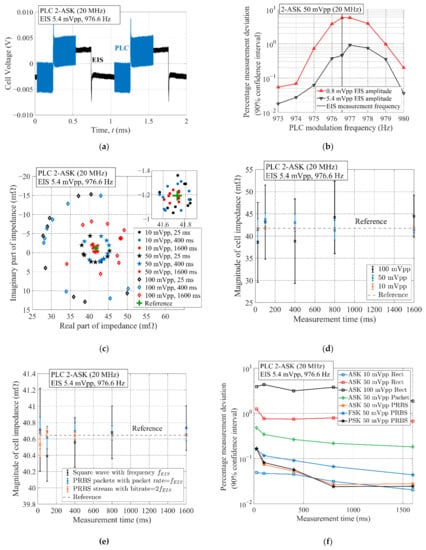
Figure 14.
PLC interference with simultaneous EIS measurement: (a) Time signal of superimposed 2-ASK PLC and rectangular EIS voltage signals measured across the cell terminals (AC-coupled); (b) Percentage EIS measurement deviation for various PLC modulation frequencies around an EIS measurement frequency; (c) Impedance measurement results at a single frequency point for a variety of 2-ASK PLC signal amplitudes and EIS measurement times; (d) Representation of (c) by mean values and 90% confidence interval bars; (e) Impedance deviation for different PLC modulation signals represented by mean values and 90% confidence interval bars; (f) Percentage impedance deviation based on normalized 90% confidence intervals for different PLC amplitudes, modulation signals, and time divisions.
How close the disturber has to approach the EIS frequency to cause an interference is illustrated in Figure 14b for 976.6 Hz. The given percentage impedance measurement deviation is calculated from the 90% confidence interval normalized by the averaged impedance. The closer the modulation frequency is to , the more severe the interference gets, which is approximately six times higher for the lower EIS excitation amplitude (5.7% for 0.8 mVpp, 0.9% for 5.4 mVpp). Only a few hertz apart from , the percentage impedance deviation drops significantly.
To find the origin of the disturbance, a real 2-ASK PLC voltage signal was digitalized by an oscilloscope and the spectrum was calculated using Fast Fourier transform (FFT). The resulting FFT spectrum is shown in Figure 15a displaying one-sided true amplitudes. For comparison, Figure 15b shows the ideal spectrum of the same 2-ASK signal generated by simulation. The spectrum of the ideal ASK signal has only one main spectral component located at the carrier frequency and levels off to both sides. Therefore, ideally no significant baseband components are expected. However, when looking at the spectrum of the real signal, beside higher harmonics of the carrier, there is also an essential baseband component right at the frequency of the modulation signal. We assume that due to non-ideal modulation by the signal generator or other non-ideal down conversion effects, this spectral component is responsible for the EIS interference and may be avoided by prior bandpass-filtering of the PLC signal.
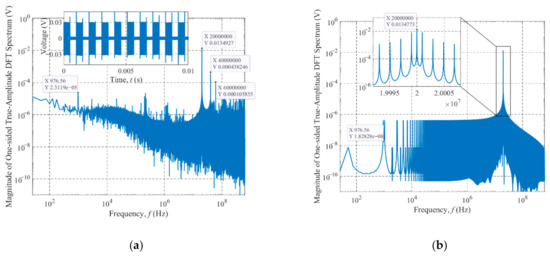
Figure 15.
One-sided true amplitude DFT spectra of a 2-ASK PLC signal modulated by a periodical square wave with frequency 976.6 Hz (a) Real PLC signal spectrum and time signal (inset); (b) Ideal PLC signal spectrum calculated by simulation.
In order to evaluate how different PLC signal properties enforce the selective EIS interference seen in the Nyquist plot of Figure 13, we now intentionally set the PLC modulation frequency exactly to an EIS frequency point . For the following results, the frequency 976.6 Hz is taken as representative for all EIS frequency points.
Figure 14c highlights the influence of different PLC amplitudes and EIS measurement times in case of a square wave modulating signal with 976.6 Hz. Interestingly, all EIS impedance measurements of one PLC setting are located on a sphere around the reference or “true” impedance. Larger PLC amplitudes and shorter measurement times let the impedance error and thus the radius of the sphere increase. However, from Figure 14d averaging the results of Figure 14c including 90% confidence intervals, it becomes clear that only large measurement times (800 ms, 1600 ms) can significantly reduce the impedance measurement spread. For the smallest PLC amplitude (10 mVpp), the inset of Figure 14c indicates that the spherical distribution of the impedance measurements is slightly disarranged by superimposed noise.
The difference between measured and true impedance seen in Figure 14c can be described by an error vector, which circles around the reference value depending on the phase relationship between PLC and EIS signal. Based on (9), the impedance error vector can be broken down into voltage and current DFT error vectors having the same circulating behavior depicted in Figure 16. Summing up the EIS-caused and PLC-caused voltage DFT vectors and results in the overall DFT voltage vector , which is seen by the EIS IC.
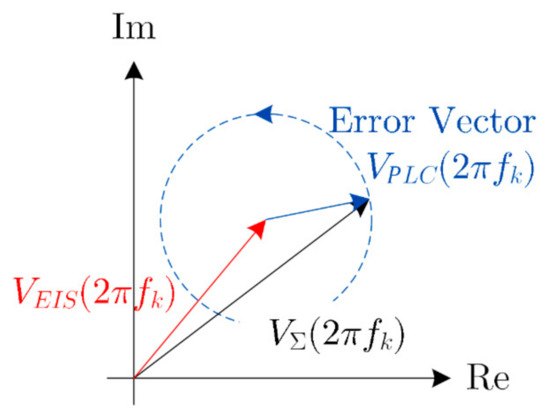
Figure 16.
Argand diagram of the complex voltage DFT values for a specific discrete frequency . The PLC error voltage circles around the reference voltage value . The sum of reference and error vector gives the actually measured voltage DFT value for .
Since the EIS excitation current is still measured correctly by the IC regardless of the superimposed PLC signal, the DFT current error vector is zero, and the impedance error vector can be approximated by the superposition of the voltage DFT vectors at the discrete frequency by the following expression:
with the true impedance and the effectively measured impedance .
In another experiment, the impact of the modulation signal waveforms (listed in Table 2) on the EIS frequency point at was evaluated using the following settings: For the PRBS modulating signal, a bit rate of is chosen because the time per bit is half of the EIS period . For the packet stream, PRBS data with 500 kbps are repeatedly switched on and off with the frequency . As before, the square wave modulating signal has a frequency of . All three signals are 2-ASK modulated onto the sinusoidal carrier located at 20 MHz. The impedance results at for the different modulation signals are averaged and displayed in Figure 14e with 90% confidence intervals. Clearly, the square wave modulation signal has the highest impact on the EIS measurement, whereas the PRBS only leads to small distortions. This can be explained by the higher fundamental content in the periodic square wave than in the PBRS. On the other hand, the PBRS packets are periodically sent with the packet rate , therefore having a higher fundamental content than the continuous PBRS stream, which leads to a more severe interference. In all three cases, longer EIS measurement times lead to a decrease in measurement error.
The presented results are summarized in terms of percentage measurement deviation in Figure 14f, which again highlights the influence of different PLC signal settings. In addition, results are given for different modulation schemes (2-ASK, 2-FSK, 2-PSK), suggesting a rather small impact on the measurement deviation.
In conclusion, the most relevant factor for EIS disturbance by PLC is the modulation signal’s frequency. As the typical frequency range of EIS is below 10 kHz, the critical parameter is the data packet rate rather than the data rate, which is expected to be well above the EIS frequency range. This means, interference can be largely mitigated by avoiding PLC packet rates equal to EIS measurement frequencies.
6. Conclusions
Power line communications for HV battery systems is an attractive alternative communication technique for BMS data transmission and can pave the way for advanced single-cell monitoring methods such as electrochemical impedance spectroscopy being implemented in future smart cells and smart battery systems. In this work, we developed a bottom-up PLC channel model that can predict the PLC channel transfer characteristics for both uplink (CMC to BMU) and downlink (BMU to CMC) communication in a small-scale 18650 battery pack. Using a self-made PLC hardware demonstrator, the model was successfully validated with real PLC signals on the battery pack.
The PLC channel model considers high frequency properties of cylindrical Li-ion cells as well as capacitive and inductive coupling effects among adjacent cells. Impedance characterization and modeling of a single Li-ion cell showed that for typical PLC frequencies above 1 MHz, access impedances greater than 1 Ω per cell can be expected. Investigations on the coupling mechanisms revealed that the coupling capacitance as well as the mutual inductance between adjacent cylindrical cells can be approximated over a wide frequency range by well-known formulas used for hollow metallic cylinders. Cell coupling is predominantly determined by the geometrical cell arrangement, while the direction of current flow in two adjacent cells determines the sign (positive for same, negative for opposite current direction) of the mutual inductance among them as described in [55].
The simulated PLC channel transfer characteristics vary between inner and outer cells forming the battery stack, which is due to higher mutual inductive coupling inside the stack. Capacitive coupling is observed to affect the transfer characteristics only above approximately 80 MHz.
For future work, the presented modeling approach can be used for predicting the transfer characteristics of large-scale HV battery packs as well as for designing customized PLC modems. The model can also be adapted to large-format automotive cells with higher capacity as long as they exhibit a similar rolled-up internal structure as the 18650 cells, such as prismatic cells having elliptically wound electrodes [41]. As large-scale battery packs consist of a high number of single Li-ion cells, the PLC channel is expected to have a significantly higher attenuation than for the investigated PLC demonstrator. Because the cells within a pack may be distributed three-dimensionally in space, they will not entirely follow the parallel placement as in our setup (Figure 2b). This can lead to different coupling among cells placed in series, which is expected to be smaller compared to the parallel arrangement.
The presented circuit-based PLC channel model can be used for further physical layer analysis concerning channel noise characteristics, signal-to-noise ratio and bit error rate (BER) requirements. According to the previous works [34,35], the PLC physical layer can be modeled by (1) the master-slave channel transfer characteristics as determined in this work, and (2) additive white Gaussian noise (AWGN) present for frequencies above 40 MHz. For example, desired BERs below 10−3 were achieved by an (energy per bit to noise power spectral density ratio) of 9 dB in [35].
For the success of PLC for BMS applications, it is important to unfold and quantify possible coexistence issues between PLC and BMS monitoring. Therefore, in the second part of our work, we investigated various interference scenarios applying a large amount of PLC signals with different settings. As the results demonstrate, BMS monitoring is not expected to interfere with PLC signals. However, monitoring circuits attached to the cell may slightly change the PLC access impedance and transfer characteristics. In contrast, PLC signals can interfere with BMS monitoring, yet only in particular cases regarding EIS. To prevent EIS distortions, PLC signals with packet rates equal to EIS measurement frequencies should to be avoided or passed through effective bandpass filter devices. DC monitoring is not affected by PLC signals since the measurement interfaces are protected by effective filter structures.
Author Contributions
Conceptualization, methodology, validation and formal analysis, T.F.L.; investigation, T.F.L., G.H.; resources, G.S. and G.H.; writing—original draft preparation, T.F.L.; writing—review and editing, G.S., G.H., M.R. and A.J.; visualization, T.F.L.; supervision, M.R. and A.J.; project administration, A.J.; funding acquisition, M.R. and A.J. All authors have read and agreed to the published version of the manuscript.
Funding
This research was funded by the Federal Ministry for Economic Affairs and Energy, Germany within the project LImeSI, grant number 03ETE019A. The APC was funded by the Technical University of Munich (TUM) in the framework of the Open Access Publishing Program.
Acknowledgments
The authors would like to thank Bettina Peth of Dassault Systemes Deutschland GmbH, Germany, and Milan Prihoda of Dassault Systèmes, Czechia for fruitful discussions and support on 3-D EM simulations using CST Studio Suite®. They also thank Federico Passerini of Infineon Technologies Austria AG for helpful discussions and proof-reading during the completion of this work.
Conflicts of Interest
The authors declare no conflict of interest. The funders had no role in the design of the study; in the collection, analyses, or interpretation of data; in the writing of the manuscript, or in the decision to publish the results.
Abbreviations
| 2-ASK | Binary amplitude shift keying | |
| 2-PSK | Binary phase shift keying | |
| 2-FSK | Binary frequency shift keying | |
| 3-D | Three-dimensional | |
| ADC | Analog-to-digital converter | |
| AC | Alternating current | |
| ASIL | Automotive safety integrity level | |
| AWGN | Additive white Gaussian noise | |
| BER | Bit error rate | |
| BEV | Battery electric vehicle | |
| BMS | Battery management system | |
| BMU | Battery management unit | |
| CAN | Control area network | |
| CID | Current interrupt device | |
| CISPR | Comité International Spécial des Perturbations Radioélectriques | |
| CMC | Cell monitoring circuit | |
| CRC | Cyclic redundancy check | |
| CT | Computed tomography | |
| DC | Direct current | |
| DFT | Discrete Fourier transform | |
| EEC | Equivalent electrical circuit | |
| EIS | Electrochemical impedance spectroscopy | |
| EM | Electromagnetic | |
| EMC | Electromagnetic compatibility | |
| EMI | Electromagnetic interference | |
| EV | Electric vehicle | |
| FFT | Fast Fourier transform | |
| GND | Ground | |
| HEV | Hybrid electric vehicle | |
| HF | High frequency | |
| HV | High voltage | |
| IC | Integrated circuit | |
| Li-ion | Lithium-ion | |
| LV | Low voltage | |
| NFRA | Nonlinear frequency response analysis | |
| OOK | On-off keying | |
| PCB | Printed circuit board | |
| PLC | Power line communications | |
| PRBS | Pseudo-random bit sequence | |
| RMSE | Root mean square error | |
| RX | Receiver | |
| SOC | State of charge | |
| SOH | State of health | |
| TX | Transmitter | |
| VNA | Vector network analyzer | |
| Nomenclature | ||
| Symbols | Unit | Description |
| ° | Phase shift between voltage and current signals | |
| 8.854 ⋅ 1012 F/m | Vacuum permittivity | |
| Relative permittivity | ||
| ° | Phase of complex impedance | |
| Reflection coefficient | ||
| 4π · 10−7 H/m | Vacuum permeability | |
| ϑ | °C | Temperature |
| F | Power line coupling capacitor | |
| F | Cell-to-cell coupling capacitance | |
| F | DC-link capacitor | |
| 0.018 m | Cell diameter | |
| m | Distance between cells | |
| Hz | Carrier frequency | |
| Hz | EIS measurement frequency | |
| Hz | DFT frequency point | |
| , | dB | Downlink and uplink PLC transfer function |
| A | Current amplitude | |
| 0.065 m | Cell length | |
| H | Cell connector inductance | |
| H | External cell inductance due to the cell’s length, tabs and bonding wires | |
| H | Internal cell inductance due to skin effect | |
| H | Loop inductance | |
| H | Self-inductance | |
| H | Jelly roll winding inductance of the cell | |
| H | Mutual inductance | |
| frequency harmonic | ||
| Ω | Cell connector resistance | |
| Ω | Electrolyte, contact, and CID resistances of the cell | |
| Ω | Internal/ surface cell resistance due to skin effect | |
| Ω | Ionic resistance of stacked electrode cell layers and electrolyte | |
| Ω | Electrical resistance of cell collector windings | |
| s | Signal period | |
| V | Voltage amplitude | |
| V + jV | EIS voltage DFT vector | |
| V | PLC voltage across master modem | |
| V + jV | PLC voltage DFT error vector | |
| V + jV | Overall DFT vector | |
| V | PLC voltage across slave cell | |
| Ω | Inductive reactance | |
| Ω | Characteristic impedance | |
| Ω + jΩ | Complex cell impedance | |
| Ω + jΩ | Complex impedance error at | |
| , | Ω + jΩ | Master, slave transceiver impedance |
| Ω + jΩ | Battery pack impedance | |
| Ω + jΩ | True complex impedance at | |
| Ω + jΩ | Overall complex impedance at | |
References
- Blomgren, G.E. The Development and Future of Lithium Ion Batteries. J. Electrochem. Soc. 2017, 164, A5019–A5025. [Google Scholar] [CrossRef]
- Rao, Z.; Wang, S.; Zhang, G. Simulation and experiment of thermal energy management with phase change material for ageing LiFePO4 power battery. Energy Convers. Manag. 2011, 52, 3408–3414. [Google Scholar] [CrossRef]
- Balasingam, B.; Ahmed, M.; Pattipati, K. Battery Management Systems—Challenges and Some Solutions. Energies 2020, 13, 2825. [Google Scholar] [CrossRef]
- Hannan, M.A.; Lipu, M.S.H.; Hussain, A.; Mohamed, A. A review of lithium-ion battery state of charge estimation and management system in electric vehicle applications: Challenges and recommendations. Renew. Sustain. Energy Rev. 2017, 78, 834–854. [Google Scholar] [CrossRef]
- Weicker, P. A Systems Approach to Lithiumion Battery Management; Artech House: Norwood, MA, USA, 2014; ISBN 1608076598. [Google Scholar]
- Wei, Z.; Zhao, J.; He, H.; Ding, G.; Cui, H.; Liu, L. Future smart battery and management: Advanced sensing from external to embedded multi-dimensional measurement. J. Power Sources 2021, 489, 229462. [Google Scholar] [CrossRef]
- Din, E.; Schaef, C.; Moffat, K.; Stauth, J.T. A Scalable Active Battery Management System with Embedded Real-Time Electrochemical Impedance Spectroscopy. IEEE Trans. Power Electron. 2017, 32, 5688–5698. [Google Scholar] [CrossRef]
- Koch, R.; Jossen, A. Impedance spectroscopy for battery monitoring with switched mode amplifiers. In Proceedings of the 2014 16th International Power Electronics and Motion Control Conference and Exposition, Antalya, Turkey, 21–24 September 2014; pp. 496–501, ISBN 978-1-4799-2060-0. [Google Scholar]
- Abedi Varnosfaderani, M.; Strickland, D. A Comparison of Online Electrochemical Spectroscopy Impedance Estimation of Batteries. IEEE Access 2018, 6, 23668–23677. [Google Scholar] [CrossRef]
- Crescentini, M.; de Angelis, A.; Ramilli, R.; Angelis, G.; de Tartagni, M.; Moschitta, A.; Traverso, P.A.; Carbone, P. Online EIS and Diagnostics on Lithium-Ion Batteries by Means of Low-Power Integrated Sensing and Parametric Modeling. IEEE Trans. Instrum. Meas. 2021, 70, 1–11. [Google Scholar] [CrossRef]
- Barsoukov, E.; Macdonald, J.R. Impedance Spectroscopy; John Wiley & Sons, Inc.: Hoboken, NJ, USA, 2018; ISBN 9781119381860. [Google Scholar]
- Andre, D.; Meiler, M.; Steiner, K.; Wimmer, C.; Soczka-Guth, T.; Sauer, D.U. Characterization of high-power lithium-ion batteries by electrochemical impedance spectroscopy. I. Experimental investigation. J. Power Sources 2011, 196, 5334–5341. [Google Scholar] [CrossRef]
- Waag, W.; Käbitz, S.; Sauer, D.U. Experimental investigation of the lithium-ion battery impedance characteristic at various conditions and aging states and its influence on the application. Appl. Energy 2013, 102, 885–897. [Google Scholar] [CrossRef]
- Mingant, R.; Bernard, J.; Sauvant Moynot, V.; Delaille, A.; Mailley, S.; Hognon, J.-L.; Huet, F. EIS Measurements for Determining the SoC and SoH of Li-Ion Batteries. ECS Trans. 2010, 33, 41–53. [Google Scholar] [CrossRef]
- Love, C.T.; Virji, M.B.V.; Rocheleau, R.E.; Swider-Lyons, K.E. State-of-health monitoring of 18650 4S packs with a single-point impedance diagnostic. J. Power Sources 2014, 266, 512–519. [Google Scholar] [CrossRef]
- Schmidt, J.P.; Arnold, S.; Loges, A.; Werner, D.; Wetzel, T.; Ivers-Tiffée, E. Measurement of the internal cell temperature via impedance: Evaluation and application of a new method. J. Power Sources 2013, 243, 110–117. [Google Scholar] [CrossRef]
- Raijmakers, L.H.J.; Danilov, D.L.; van Lammeren, J.P.M.; Lammers, M.J.G.; Notten, P.H.L. Sensorless battery temperature measurements based on electrochemical impedance spectroscopy. J. Power Sources 2014, 247, 539–544. [Google Scholar] [CrossRef]
- Meddings, N.; Heinrich, M.; Overney, F.; Lee, J.-S.; Ruiz, V.; Napolitano, E.; Seitz, S.; Hinds, G.; Raccichini, R.; Gaberšček, M.; et al. Application of electrochemical impedance spectroscopy to commercial Li-ion cells: A review. J. Power Sources 2020, 480, 228742. [Google Scholar] [CrossRef]
- Hong, H.J.; Sevillano, J.R.; Kain, C.; Hofer, G.; Felber, K.; Chan, W.K. Alternatives in Battery Communication Protocols. In Proceedings of the SAE Technical Paper Series. WCX™ 17: SAE World Congress Experience, Detroit, MI, USA, 4 April 2017. [Google Scholar]
- Maryanka, Y. Wiring reduction by battery power line communication. In Proceedings of the IEE Seminar on Passenger Car Electrical Architecture; IEE Seminar on Passenger Car Electrical Architecture: Birmingham, UK, 2000; p. 8. [Google Scholar]
- Ouannes, I.; Nickel, P.; Dostert, K. Cell-wise monitoring of Lithium-ion batteries for automotive traction applications by using power line communication: Battery modeling and channel characterization. In Proceedings of the 2014 18th IEEE International Symposium on Power Line Communications and Its Applications (ISPLC), Glasgow, UK, 30 March–2 April 2014; pp. 24–29, ISBN 978-1-4799-4980-9. [Google Scholar]
- Bolsinger, C.; Brix, J.; Dragan, M.; Birke, K.P. Investigating and modeling the transmission channel of a prismatic lithium-ion cell and module for powerline communication. J. Energy Storage 2017, 10, 11–19. [Google Scholar] [CrossRef]
- Talie, A.P.; Pribyl, W.A.; Hofer, G. Electric Vehicle Battery Management System Using Power Line Communication Technique. In Proceedings of the 2018 14th Conference on Ph.D. Research in Microelectronics and Electronics (PRIME), Prague, Czech Republic, 2–5 July 2018; pp. 225–228, ISBN 978-1-5386-5387-6. [Google Scholar]
- Opalko, O.; Alonso, D.; Dostert, K. Modeling of the power-line channel in automotive Li-ion batteries with Rogowski coils as coupling elements. In Proceedings of the 2016 International Symposium on Power Line Communications and its Applications (ISPLC), Bottrop, Germany, 20–23 March 2016; pp. 224–229, ISBN 978-1-4673-6643-4. [Google Scholar]
- Tonello, A.M.; Lampe, L.; Swart, T.G. Power Line Communications: Principles, Standards and Applications from Multimedia to Smart Grid, 2nd ed.; John Wiley & Sons: Hoboken, NJ, USA, 2016; ISBN 978-1-118-67671-4. [Google Scholar]
- Pittolo, A.; de Piante, M.; Versolatto, F.; Tonello, A.M. In-Vehicle Power Line Communication: Differences and Similarities Among the In-Car and the In-Ship Scenarios. IEEE Veh. Technol. Mag. 2016, 11, 43–51. [Google Scholar] [CrossRef]
- Miller, B.P. Automotive Lithium-Ion Batteries. Johns. Matthey Technol. Rev. 2015, 59, 4–13. [Google Scholar] [CrossRef]
- Landinger, T.F.; Schwarzberger, G.; Jossen, A. A Novel Method for High Frequency Battery Impedance Measurements. In Proceedings of the 2019 IEEE International Symposium on Electromagnetic Compatibility, Signal & Power Integrity (EMC+SIPI), New Orleans, LA, USA, 22–26 July 2019; pp. 106–110, ISBN 978-1-5386-9199-1. [Google Scholar]
- Sendin, A.; Peña, I.; Angueira, P. Strategies for Power Line Communications Smart Metering Network Deployment. Energies 2014, 7, 2377–2420. [Google Scholar] [CrossRef]
- Degauque, P.; Stievano, I.; Pignari, S.; Degardin, V.; Canavero, F.; Grassi, F.; Canete, F.J. Power-Line Communication: Channel Characterization and Modeling for Transportation Systems. IEEE Veh. Technol. Mag. 2015, 10, 28–37. [Google Scholar] [CrossRef]
- Taherinejad, N.; Rosales, R.; Lampe, L.; Mirabbasi, S. Channel characterization for power line communication in a hybrid electric vehicle. In Proceedings of the 2012 IEEE International Symposium on Power Line Communications and Its Applications, Beijing, China, 27–30 March 2012; pp. 328–333, ISBN 978-1-4673-0361-3. [Google Scholar]
- Landinger, T.F.; Schwarzberger, G.; Rose, M.; Dollhaeubl, S.; Hofer, G.; Talei, A.P.; Jossen, A. Power Line Communications in Automotive Traction Batteries: A Proof of Concept. In Proceedings of the 2020 IEEE International Symposium on Power Line Communications and its Applications (ISPLC), Málaga, Spain, 11–13 May 2020; pp. 1–5, ISBN 978-1-7281-4816-8. [Google Scholar]
- Takanashi, M.; Harada, T.; Takahashi, A.; Tanaka, H.; Hayashi, H.; Hattori, Y. High-voltage power line communication system for hybrid vehicle. In Proceedings of the 2015 IEEE International Symposium on Power Line Communications and Its Applications (ISPLC), Austin, TX, USA, 29 March–1 April 2015; pp. 222–227, ISBN 978-1-4799-8413-8. [Google Scholar]
- Ouannes, I.; Nickel, P.; Bernius, J.; Dostert, K. Physical Layer Performance Analysis of Power Line Communication (PLC) applied for Cell-Wise Monitoring of Automotive Lithium-Ion Batteries. In Proceedings of the 18th International OFDM Workshop 2014 (InOWo’14), Essen, Germany, 27–28 August 2014; pp. 1–8. [Google Scholar]
- Opalko, O.; Simon, B.; Alonso, D.; Dostert, K. Physical layer and multi-carrier analysis for power line communication networks in Li-ion batteries for electric and hybrid vehicles. In Proceedings of the 2015 IEEE Vehicular Networking Conference (VNC), Kyoto, Japan, 16–18 December 2015; pp. 243–250, ISBN 978-1-4673-9411-6. [Google Scholar]
- Vincent, T.A.; Marco, J. Development of Smart Battery Cell Monitoring System and Characterization on a Small-Module Through In-Vehicle Power Line Communication. IEEE Access 2020, 8, 220658–220671. [Google Scholar] [CrossRef]
- Taherinejad, N.; Rosales, R.; Mirabbasi, S.; Lampe, L. A study on access impedance for vehicular power line communications. In Proceedings of the 2011 IEEE International Symposium on Power Line Communications and Its Applications, Udine, Italy, 3–6 April 2011; pp. 440–445, ISBN 978-1-4244-7751-7. [Google Scholar]
- Osswald, P.J.; Erhard, S.V.; Noel, A.; Keil, P.; Kindermann, F.M.; Hoster, H.; Jossen, A. Current density distribution in cylindrical Li-Ion cells during impedance measurements. J. Power Sources 2016, 314, 93–101. [Google Scholar] [CrossRef]
- Iglesias, M.; Echeverria, I.; Arteche, F.; Piedrafita, J.; Pradas, A.; de Clercq, J. EMC mapping of a power train for fully electric 4-wheel drive vehicle. In Proceedings of the 2014 International Symposium on Electromagnetic Compatibility, Gothenburg, Sweden, 1–4 September 2014; pp. 414–419, ISBN 978-1-4799-3226-9. [Google Scholar]
- CISPR 25. Radio Disturbance Characteristics for the Protection of Receivers Used on Board Vehicles, Boats and on Devices—Limits and Methods of Measurement; IEC/DIN-EN 55025 Brussels, Belgium; IEC: Geneva, Switzerland, 2008. [Google Scholar]
- Saw, L.H.; Ye, Y.; Tay, A.A.O. Integration issues of lithium-ion battery into electric vehicles battery pack. J. Clean. Prod. 2016, 113, 1032–1045. [Google Scholar] [CrossRef]
- Reuter, M.; Tenbohlen, S.; Kohler, W. The Influence of Network Impedance on Conducted Disturbances Within the High-Voltage Traction Harness of Electric Vehicles. IEEE Trans. Electromagn. Compat. 2014, 56, 35–43. [Google Scholar] [CrossRef]
- Korth Pereira Ferraz, P.; Schmidt, R.; Kober, D.; Kowal, J. A high frequency model for predicting the behavior of lithium-ion batteries connected to fast switching power electronics. J. Energy Storage 2018, 18, 40–49. [Google Scholar] [CrossRef]
- Hoene, E.; Guttowski, S.; Saikly, R.; John, W.; Reichl, H. Rf-properties of automotive traction batteries. In Proceedings of the 2003 IEEE International Symposium on Electromagnetic Compatibility, 2003. EMC ′03, Istanbul, Turkey, 16 May 2003; Volume 1, pp. 425–428, ISBN 0-7803-7779-6. [Google Scholar]
- Landinger, T.F.; Schwarzberger, G.; Jossen, A. A Physical-Based High-Frequency Model of Cylindrical Lithium-Ion Batteries for Time Domain Simulation. IEEE Trans. Electromagn. Compat. 2020, 62, 1524–1533. [Google Scholar] [CrossRef]
- Wu, Y.; Saxena, S.; Xing, Y.; Wang, Y.; Li, C.; Yung, W.; Pecht, M. Analysis of Manufacturing-Induced Defects and Structural Deformations in Lithium-Ion Batteries Using Computed Tomography. Energies 2018, 11, 925. [Google Scholar] [CrossRef]
- Yao, X.-Y.; Pecht, M.G. Tab Design and Failures in Cylindrical Li-ion Batteries. IEEE Access 2019, 7, 24082–24095. [Google Scholar] [CrossRef]
- Agilent Technologies, Inc. Application Note 5989-5935EN: Ultra-Low Impedance Measurements Using 2-Port Measurements; Agilent Technologies, Inc.: Santa Clara, CA, USA, 2007. [Google Scholar]
- Pake Talei, A.; Pribyl, W.A.; Hofer, G. Considerations for a power line communication system for traction batteries. Elektrotech. Inftech. 2021, 10, 24. [Google Scholar] [CrossRef]
- Teo, Y.X.; Chen, J.; Ruddle, A.R. Predicting the RF Impedance of Cells in Parallel for Automotive Traction Battery Applications. In Proceedings of the 2019 International Symposium on Electromagnetic Compatibility—EMC EUROPE, Barcelona, Spain, 2–6 September 2019; pp. 438–443, ISBN 978-1-7281-0594-9. [Google Scholar]
- Terman, F.E. Radio Engineers′ Handbook, 1st ed.; MacGraw-Hill: New York, NY, USA, 1943. [Google Scholar]
- SIMULIA. CST Studio Suite 2021; Dassault Systemes Deutschland GmbH: Stuttgart, Germany, 2021. [Google Scholar]
- Manas, D.; Mizera, A.; Navratil, M.; Manas, M.; Ovsik, M.; Sehnalek, S.; Stoklasek, P. The Electrical, Mechanical and Surface Properties of Thermoplastic Polyester Elastomer Modified by Electron Beta Radiation. Polymers 2018, 10, 1057. [Google Scholar] [CrossRef]
- Leferink, F.B.J.; van Doom, M.J.C.M. Inductance of printed circuit board ground planes. In Proceedings of the 1993 International Symposium on Electromagnetic Compatibility, Dallas, TX, USA, 9–13 August 1993; pp. 327–329, ISBN 0-7803-1304-6. [Google Scholar]
- Grover, F.W. Inductance Calculations; Dover Publications, Inc.: Mineola, NY, USA, 2013; ISBN 9780486318356. [Google Scholar]
- Guo, M.; White, R.E. Mathematical model for a spirally-wound lithium-ion cell. J. Power Sources 2014, 250, 220–235. [Google Scholar] [CrossRef]
- Schindler, S.; Danzer, M.A. Influence of cell design on impedance characteristics of cylindrical lithium-ion cells: A model-based assessment from electrode to cell level. J. Energy Storage 2017, 12, 157–166. [Google Scholar] [CrossRef]
- Landinger, T.F.; Schwarzberger, G.; Jossen, A. High frequency impedance characteristics of cylindrical lithium-ion cells: Physical-based modeling of cell state and cell design dependencies. J. Power Sources 2021, 488, 229463. [Google Scholar] [CrossRef]
- Ruddle, A.R.; Chen, J.; Teo, Y.X. Measurement of RF impedance for automotive 18650 cylindrical lithium ion cells. In Proceedings of the 2017 International Symposium on Electromagnetic Compatibility—EMC EUROPE, Angers, France, 4–7 September 2017; pp. 1–6, ISBN 978-1-5386-0689-6. [Google Scholar]
- Brand, M.J.; Berg, P.; Kolp, E.I.; Bach, T.; Schmidt, P.; Jossen, A. Detachable electrical connection of battery cells by press contacts. J. Energy Storage 2016, 8, 69–77. [Google Scholar] [CrossRef]
- Malucci, R.D. The impact of contact resistance on high speed digital signal transmission. In Proceedings of ther Forty-Eighth IEEE Holm Conference on Electrical Contacts, Orlando, FL, USA, 21–23 October 2002; pp. 212–220, ISBN 0-7803-7433-9. [Google Scholar]
- Passerini, F.; Tonello, A.M. Secure PHY Layer Key Generation in the Asymmetric Power Line Communication Channel. Electronics 2020, 9, 605. [Google Scholar] [CrossRef]
- Galli, S. Exact conditions for the symmetry of a loop. IEEE Commun. Lett. 2000, 4, 307–309. [Google Scholar] [CrossRef]
- Antoniali, M.; Tonello, A.M.; Versolatto, F. A Study on the Optimal Receiver Impedance for SNR Maximization in Broadband PLC. J. Electr. Comput. Eng. 2013, 2013, 635086. [Google Scholar] [CrossRef]
- Illig, J.; Schmidt, J.P.; Weiss, M.; Weber, A.; Ivers-Tiffée, E. Understanding the impedance spectrum of 18650 LiFePO4-cells. J. Power Sources 2013, 239, 670–679. [Google Scholar] [CrossRef]
- Harting, N.; Wolff, N.; Röder, F.; Krewer, U. Nonlinear Frequency Response Analysis (NFRA) of Lithium-Ion Batteries. Electrochim. Acta 2017, 248, 133–139. [Google Scholar] [CrossRef]
- Lelie, M.; Braun, T.; Knips, M.; Nordmann, H.; Ringbeck, F.; Zappen, H.; Sauer, D. Battery Management System Hardware Concepts: An Overview. Appl. Sci. 2018, 8, 534. [Google Scholar] [CrossRef]


Publisher’s Note: MDPI stays neutral with regard to jurisdictional claims in published maps and institutional affiliations. |
© 2021 by the authors. Licensee MDPI, Basel, Switzerland. This article is an open access article distributed under the terms and conditions of the Creative Commons Attribution (CC BY) license (http://creativecommons.org/licenses/by/4.0/).