Article

Improving Power Quality by a Four-Wire Shunt Active Power Filter: A Case Study

Department of Electromechanics Environment and Applied Informatics, Faculty of Electrical Engineering, University of Craiova, 200585 Craiova, Romania
*
Author to whom correspondence should be addressed.
Energies 2021, 14(7), 1951; https://doi.org/10.3390/en14071951
Submission received: 2 March 2021 / Revised: 28 March 2021 / Accepted: 31 March 2021 / Published: 1 April 2021
(This article belongs to the Section F: Electrical Engineering)

Abstract

:
This paper presents the use of a three-phase four-wire shunt active power filter to improve the power quality in the Department of Industrial Electronics of a large enterprise from Romania. The specificity is given by the predominant existence of single-phase consumers (such as personal computers, printers, lighting and AC equipment). In order to identify the power quality indicators and ways to improve them, an A-class analyzer was used to record the electrical quantities and energy parameters in the point of common coupling (PCC) with the nonlinear loads for 27 h. The analysis shows that, in order to improve the power quality in PCC, three goals must be achieved: the compensation of the distortion power, the compensation of the reactive power and the compensation of the load unbalance. By using the conceived three-leg shunt active power filter, controlled through the indirect current control method in an original variant, the power quality at the supply side is very much improved. In the proposed control algorithm, the prescribed active current is obtained as a sum of the loss current provided by the DC voltage and the equivalent active current of the unbalanced load. The performance associated with each objective of the compensation is presented and analyzed. The results show that all the power quality indicators meet the specific standards and regulations and prove the validity of the proposed solution.

1. Introduction

The power quality problems in the low-voltage three-phase four-wire systems have become very important in recent years, due to the growing existence of single-phase nonlinear loads, such as personal computers, lighting, printers and air conditioning installations.
A characteristic of these single-phase nonlinear loads is that in the spectrum of current harmonics there are significantly low-frequency harmonics, and the triplen harmonics, which have a zero rotational sequence, are added up in the common neutral wire which is subjected to currents from all three phases. In addition, the unbalance leads to additional zero rotational sequence currents and thus, the neutral conductor is overloaded [1,2].
The recommended practices for handling excess neutral currents are temporary measures, so really the only solution is to add adequate compensation devices to the system [2,3]. Several types of compensating systems in three-phase four-wire power systems are reported in the literature. These usually consist of passive solutions [1,2], synchronous machines, specially-designed transformers such as zig-zag transformers [4,5] and active solutions such as active power filters (APFs) [1,2,6,7,8,9,10,11,12].
Therefore, the development of high-performance filtering systems for three-phase four-wire networks to reduce the impact of non-linear unbalanced loads on the power supply system is a topical issue.
The main design features, advantages, and drawbacks of passive, active and hybrid active power filters used to comply with the applicable standards in industrial applications (such as IEEE 519-2014) were recently summarized [6]. Among these, the active power filters are the most attractive topology for low voltage networks, as they are the most flexible and the most cost-effective solution.
In Dovgun at al. [1], a conditioning system consisting of several hybrid filter units which are installed in various nodes of the distribution network is proposed for compensation of excessive neutral currents and voltage distortions. The selective compensation of distorted voltages and currents, by the interdependent control of harmonic components, is approached.
For low-voltage applications, the preferred topology of active power filters in the market is the shunt active power filter (SAPF) based on a two-level voltage source converter (VSC) [6]. Starting from the basic three-wire APF structure, by connecting the fourth wire from the neutral point of the DC-bus to the grid neutral, the cheaper topology of the three-leg APF is obtained. As an alternative, there is the four-leg APF topology in which the fourth wire of the grid is connected to an additional leg of the VSC. The three-leg APF is less costly and less complex compared to the four-leg APF, due to fewer switching legs. On the DC-side of APF, there is the DC-link split capacitor and, on the AC-side, an output coupling filter is used for the connection to the grid in the point of common coupling (PCC) to reduce the current switching harmonics [6,13].
In the control system of a SAPF, there is generally an external control loop for the DC-voltage regulation and an internal control loop for the compensating current regulation [14,15,16].
There are many approaches in the DC-voltage control of a shunt APF. The dynamics of the DC-voltage is an indirect measure of the APF’s performance. Commonly, a PI controller ensures voltage control with good performance [7,8,16,17,18,19]. In Xiuyun et al. [20], a hybrid fuzzy PI control strategy combining traditional PI control and fuzzy control is adopted to optimize power loss and compensation performance. The Artificial Neural network (ANN)-tuned adaptive PI controller proposed in Bhattacharya et al. [21] ensures both faster reference generation and better control of the DC voltage.
To generate the prescribed compensating current, the use of the so-called instantaneous powers technique, or p-q theory, is the most common choice as it ensures a good compromise between accuracy and computational complexity [8,10,17,18,22,23,24,25,26]. Besides this, the instantaneous active and reactive current (id-iq) method leads to a good result under unbalanced and non-sinusoidal voltage conditions [8,11]. The synchronous reference frame method is also a technique frequently adopted to calculate the reference current [13,17,22,27,28] using the sensed load current and voltage in PCC.
The current controller is a very important component of the APF system. There are linear controllers, such as simple proportional current controllers [29,30], complex proportional multi-resonant controllers for selective harmonic compensation [27,29], or quasi-proportional-resonant controllers [29,31]. It must be mentioned that it is difficult to achieve simultaneously small steady-state error and fast dynamic responses by using linear controllers [29]. As an alternative, the use of nonlinear controllers can lead to good performance in steady-state regimes and fast dynamic responses [23,32,33]. The hysteresis current controller provides a very fast response and acceptable steady-state performance [7,10,11,12,14,15,19,24,25,26,29,30,34]. The simple implementation, robustness under load parameters variation and enhanced system stability are other advantages of the hysteresis control method. Therefore, the hysteresis control method is widely used in practical applications. However, by using the hysteresis band control method, variable switching frequency results and, therefore, high-frequency current harmonics can be injected into the power supply. Nevertheless, by choosing a proper hysteresis band and by its correlation with the inductivities in the circuit, the switching frequency of the transistors can be kept below their capability [12,16,26,34].
Low steady-state error, fast transient response, fixed switching frequency, good robustness and grid disturbance rejection capability are the main advantages of the second-order sliding-mode control, which is a more complex control proposed in Gong et al. [29].
A vector proportional-integral current controller is proposed in Gong et al. [18] for a three-leg APF. This controller ensures good performance even under minimum DC-link voltage conditions and provides ideally zero steady-state current tracking error at selected harmonic frequencies and optimizes transient response.
The authors of Orts-Grau et al. [35] propose a novel, one-cycle digital current controller based on the minimization of the integral error of the current for the control of a three-leg four-wire shunt active power filter. The method is complex, as the optimal ON time is obtained for every switching period.
In Pandove et al. [19], the authors proposed a discrete repetitive control technique for three-phase four-wire shunt APF, where the regular repetitive control is modified by squaring its sensitivity function, in order to improve the stability.
To control the current provided by APF, two current control methods can be adopted: the direct current control (DCC) [10,11,13,14,16,18,23,24,26,29,32,36] and the indirect current control (ICC) [19,34,37,38,39,40,41]. As the name suggests, in the case of DCC, the non-sinusoidal current at the inverter output is directly controlled after comparing its measured value with the prescribed value. The prescribed compensating current is generated based on the measured load current. Unlike DCC, in the case of ICC, the inverter output current is controlled indirectly, by means of the supply current control. For this, a sinusoidal prescribed current at the supply side is generated for the purpose of total compensation, and its value is compared with the measured supply current. By regulating the almost sinusoidal supply current, the control of the non-sinusoidal current provided by APF is ensured.
In recent years, ICC is preferred over DCC as it uses a simpler control scheme, the related calculation is simpler and leads to better performance [19,34,37,38,39,40,41]. Specifically, the compensated supply current is closer to a sinusoid than in the case of DCC [38,41].
In the case study presented in this paper, a four-wire three-leg shunt active power filter is the adopted solution to improve the power quality in a concrete application. The rest of the paper is organized as follows. After presenting the main power quality indicators before compensation in Section 2, Section 3 introduces the experimental setup. The next section is devoted to the control of the four-wire three-leg shunt active power filter. The performance of the active filtering system is presented in Section 5 and, finally, some concluding remarks are drawn.
The main contributions of the paper are as follows:
-
performing a complex energetic analysis based on measurements performed in a real industrial environment;
-
experimental validation of the indirect current control variant, proposed by the authors;
-
defining a new indicator for assessing the energy performance of the active power filter, respectively the percentage of reduction of losses upstream of the CCP;
-
experimental validation of the solution for improving the power quality and compliance with existing harmonic pollution norms.

2. Case Study and Power Quality Indicators in PCC

The power quality improvement has been achieved for the specific case of the department of Industrial Electronics Design of a large enterprise in Romania. The nonlinear loads to be compensated are predominant single-phase consumers (multiple personal computers (PCs), printers, lighting and AC equipment).
The electrical quantities and energy parameters in the point of common coupling with the nonlinear loads were recorded by using a Fluke 435 analyzer (Fluke Corporation, Everett, WA, USA) for 27 h, between 9 January 2020, 09:58–10 January 2020, 13:09. The sampling period was 60 s, and 1632 recordings were made.
As the Industrial Electronics department works in the 07:30–16:00 time range, the analysis of the results was performed on two time periods, which correspond to the working periods of two consecutive days as follows:
-
Period I: 9 January 2020; 10:00–16:00; 6 h;
-
Period II: 10 January 2020; 07:30–13:00; 5.5 h.
In addition to the recorded data, the following are highlighted:
A. The total apparent power is expressed by the known relationship specific to the operation in a non-sinusoidal regime [42,43]:
S t = ( U A 2 + U B 2 + U C 2 ) ( I A 2 + I B 2 + I C 2 ) ,
where UA, UB, UC and IA, IB, IC are the RMS values of the phase voltages and currents.
B. The total non-active power (Scompt), which is the power to be compensated, is expressed by:
S c o m p t = S t 2 P t 2 ,
where Pt is the total active power.
Following the analysis of the recorded data, the overall picture of power quality aspects resulted in the following:
1.
The voltages are sinusoidal and symmetrical, and thus the associated power quality indicators are in accordance with the existing regulations;
2.
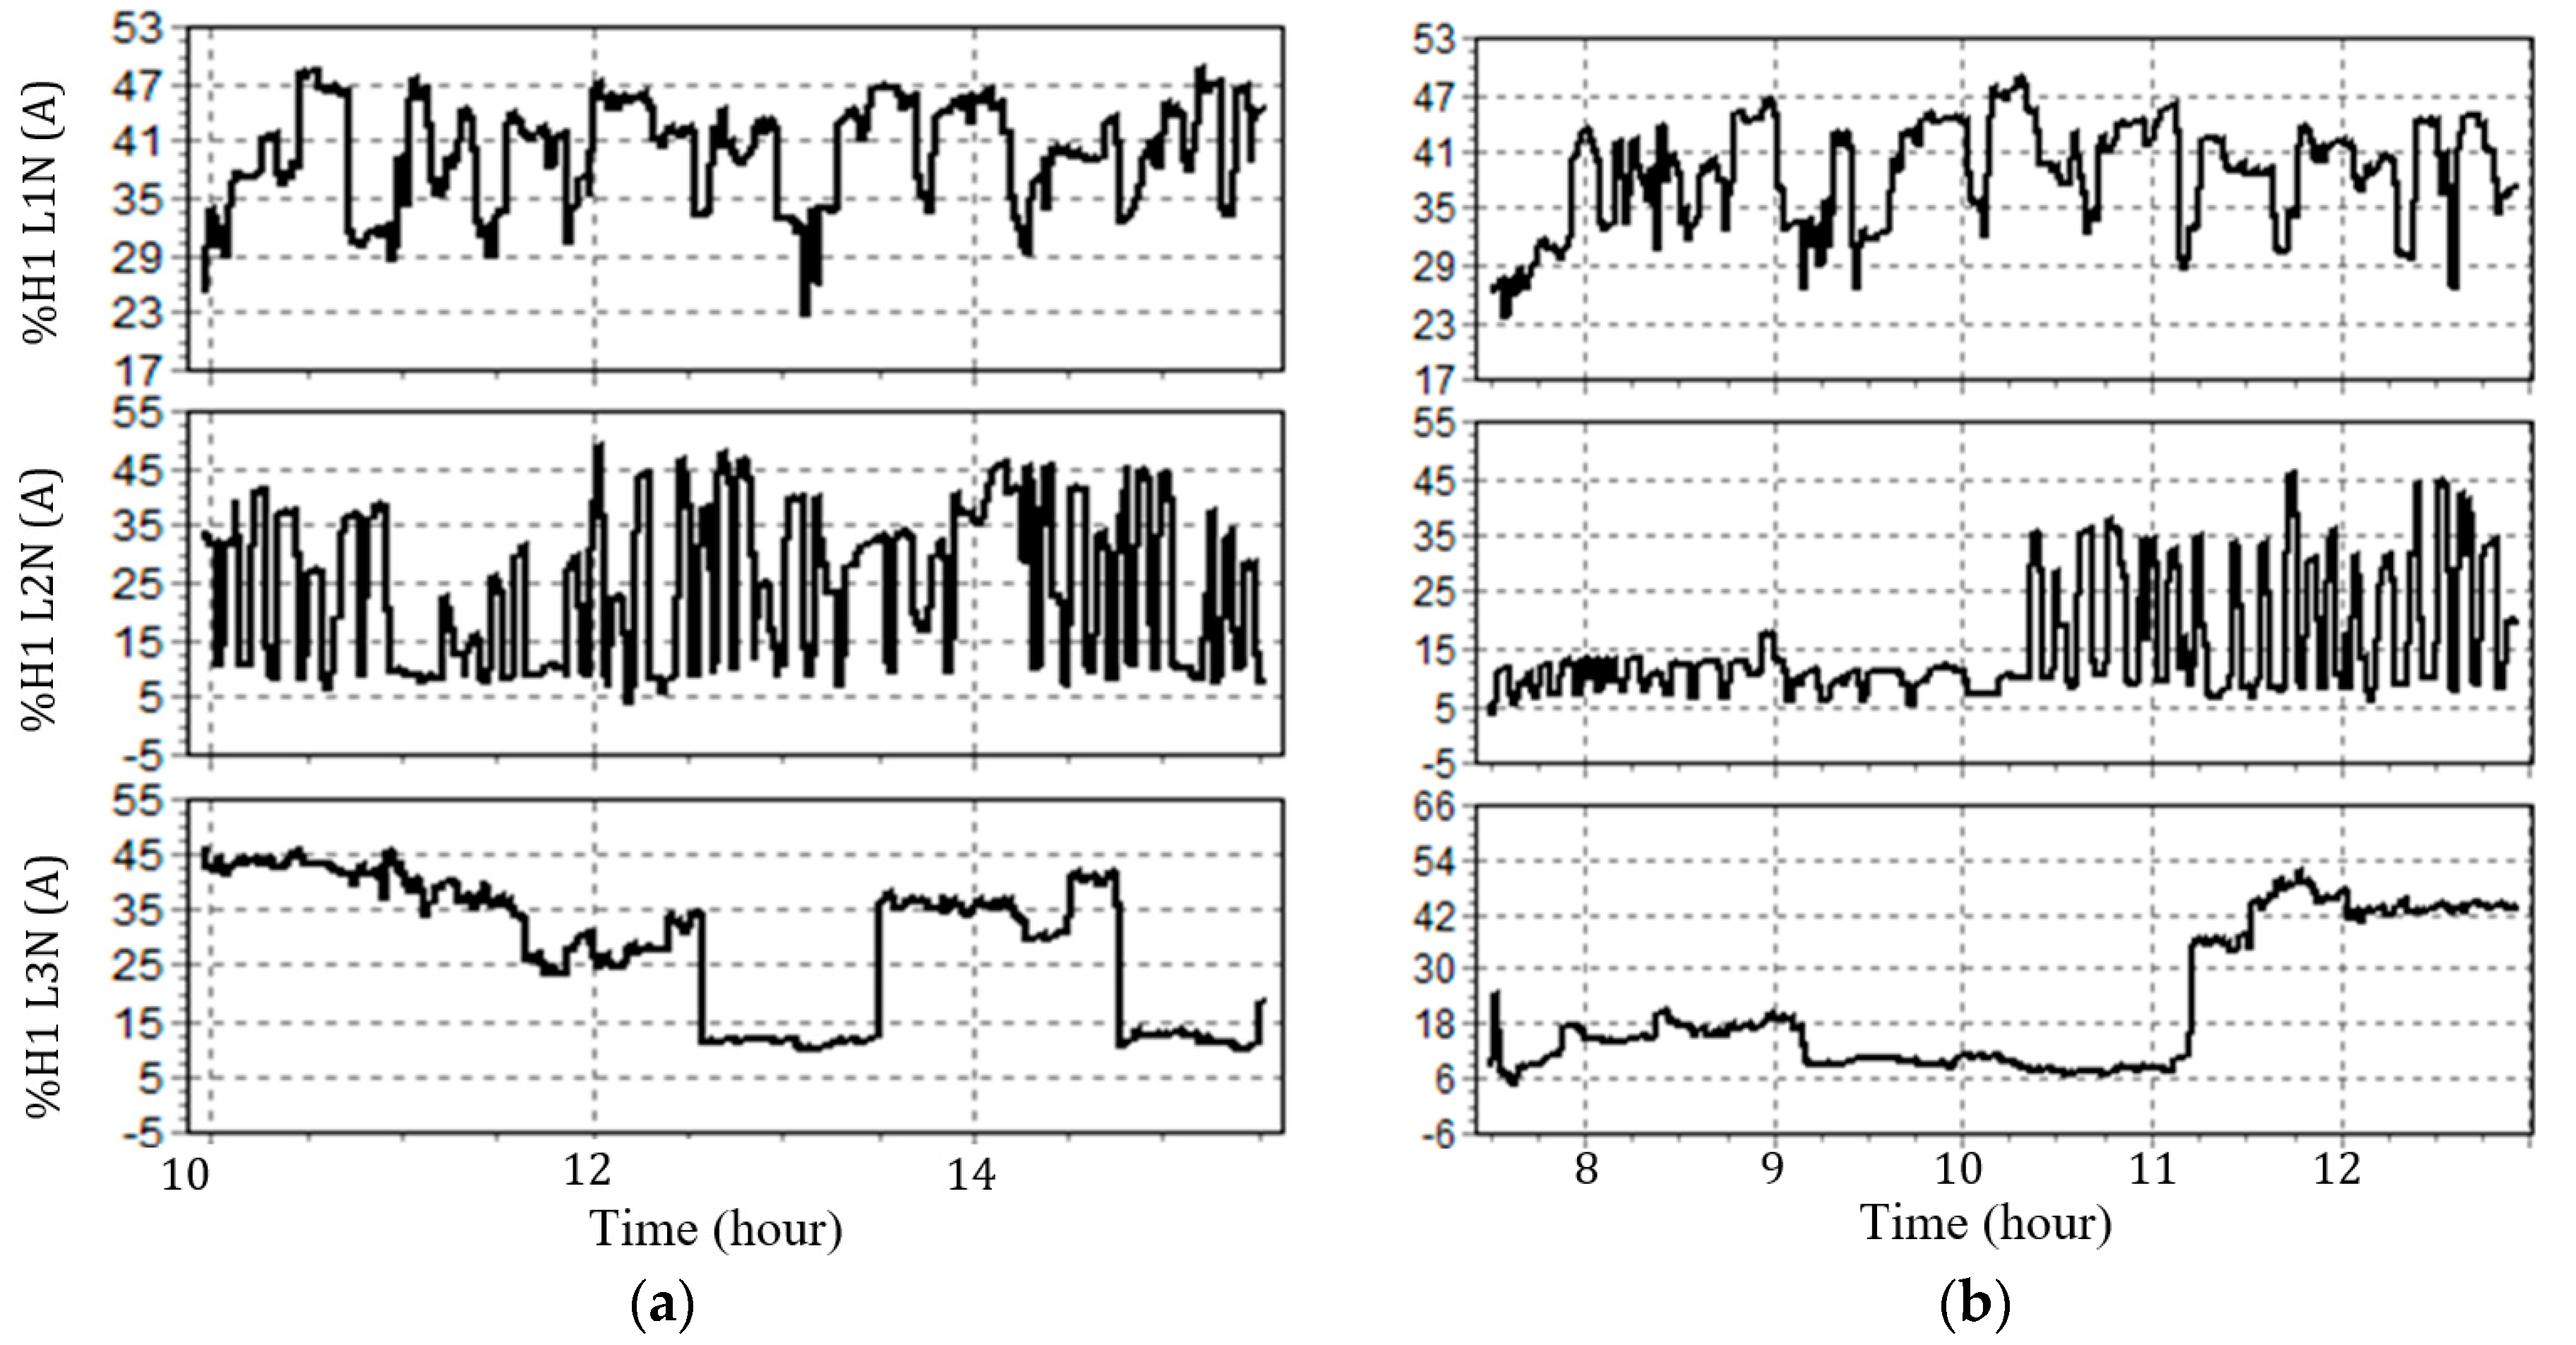
The waveforms of the fundamental currents (Figure 1) were synthesized based on the values recorded for the weight of the current harmonics, on each phase. The total phase currents are distorted and unbalanced (Figure 2);
3.
The total power factor is affected by the unbalanced and distorting regime (Figure 3);
4.
The maximum values of the power to be compensated (ScompM) were identified, in the two time periods analyzed. Thus:
A.
For the first period: ScompM = 4518 VA, recorded on 9 January 2020, 12:11:34;
B.
For the second period: ScompM = 4565 VA, recorded on 10 January 2020, 12:00:34.
5.
It is found that the most unfavorable situation in terms of compensated power was registered in period II (recorded on 10 January 2020, 12:00:34) and it corresponds to a distorting and strongly unbalanced regime, respectively:
-
The current total harmonic distortion factors (THD) on the three phases have the values 41.74%, 17.77% and 46.56% (Figure 4);
-
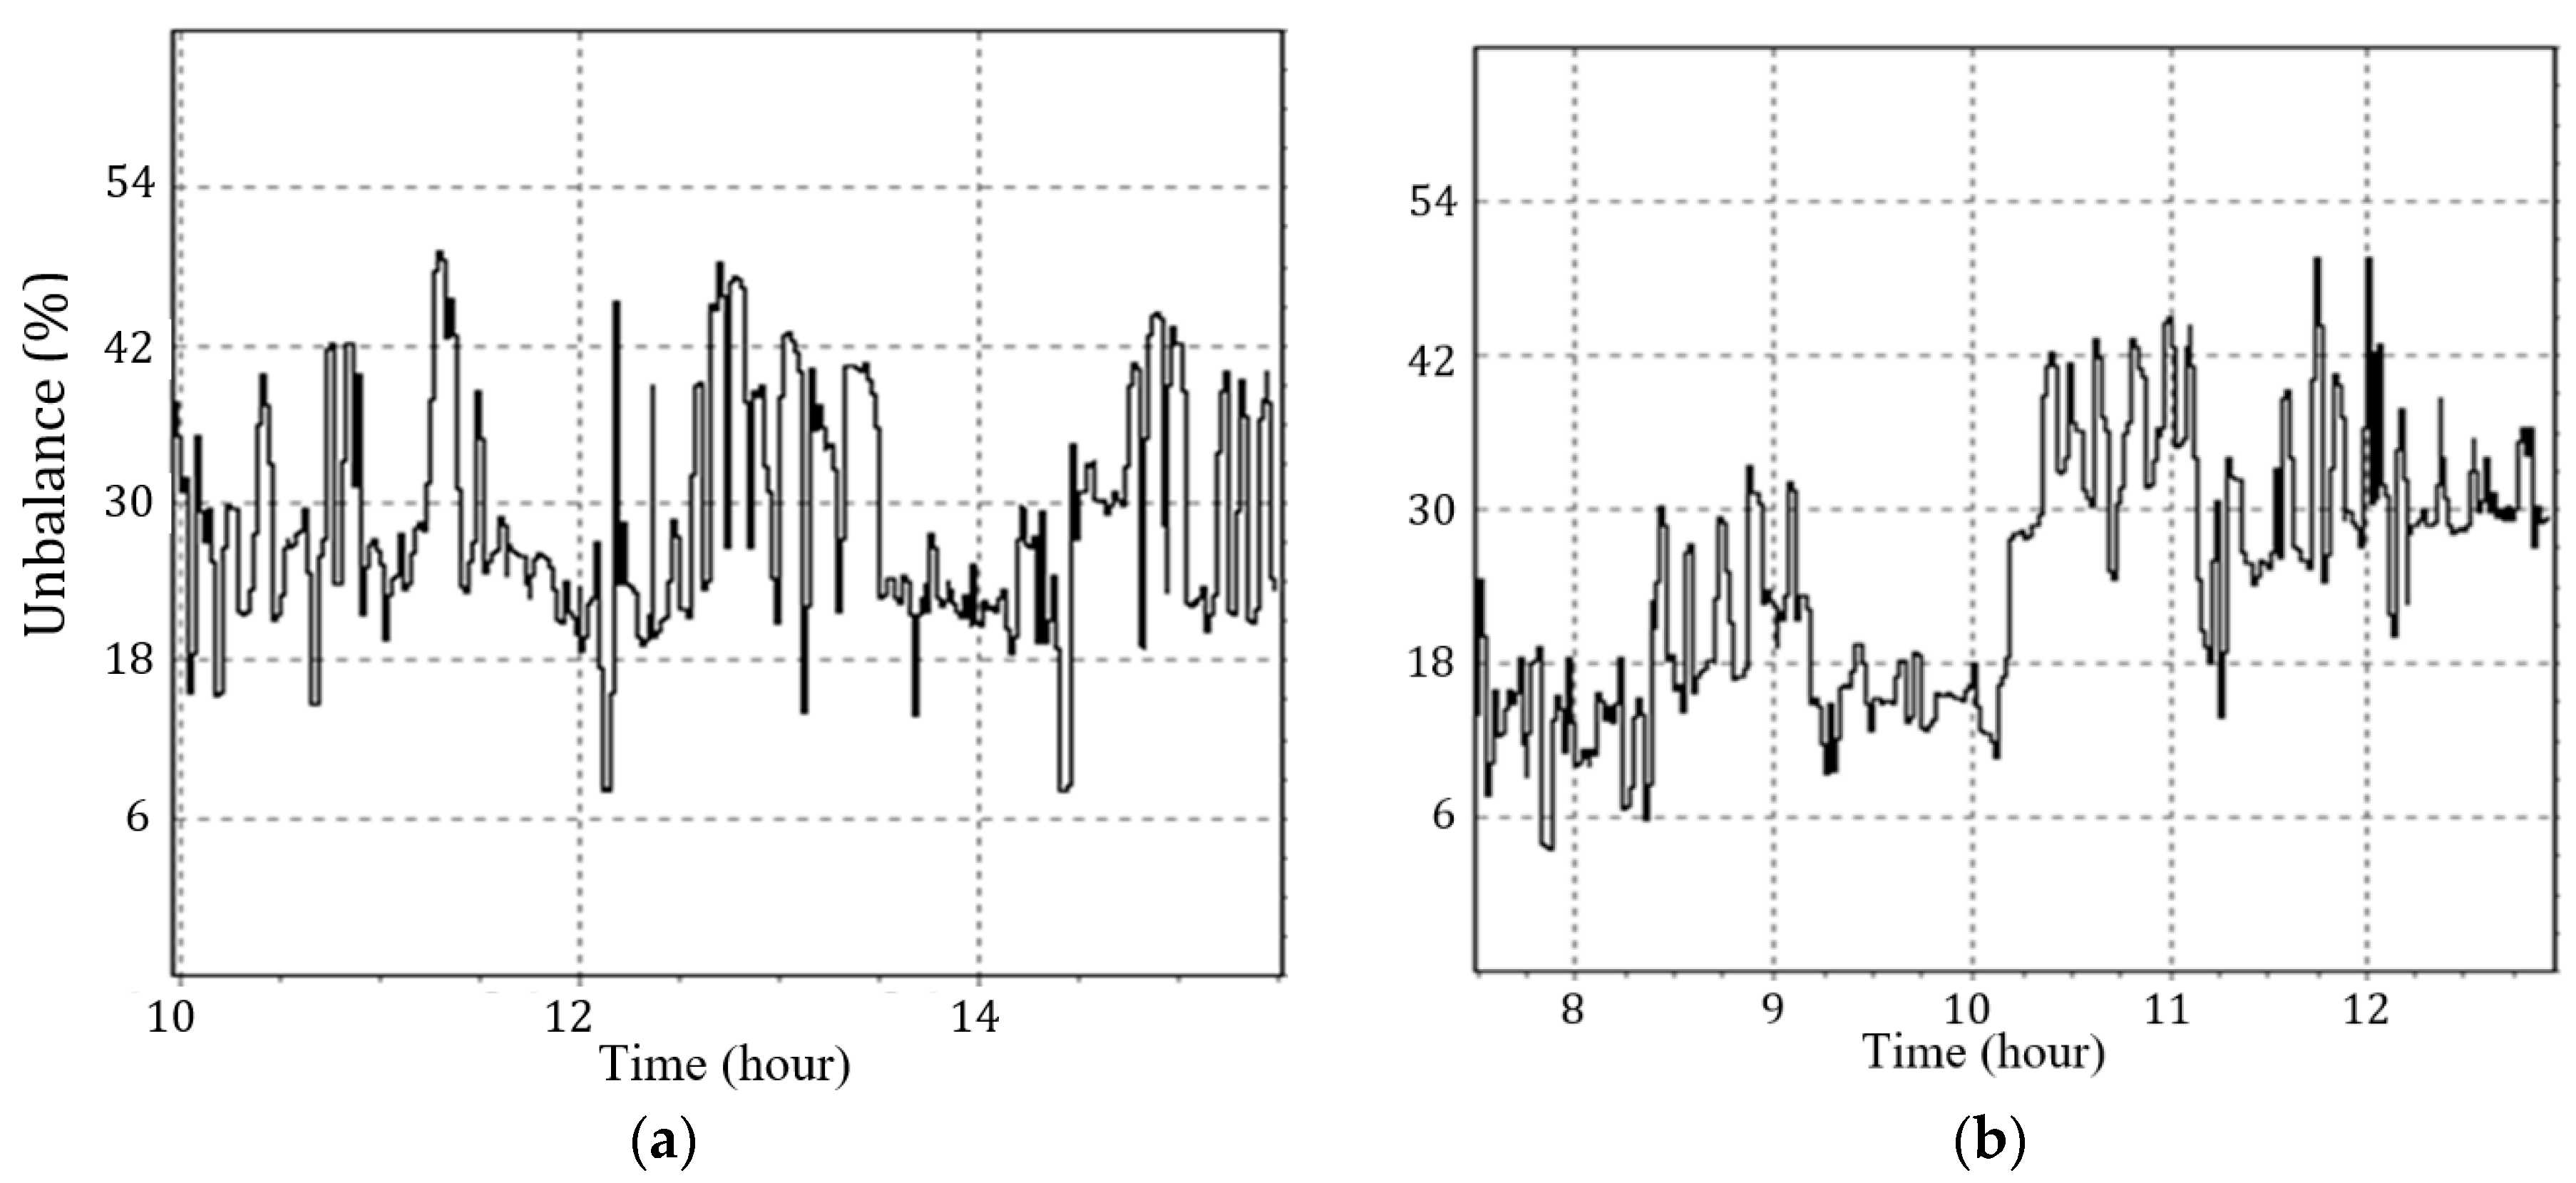
The unbalance factor is 46.66% (Figure 5).
6.
The currents on phases A and C (Figure 2) have the typical waveforms of the current absorbed by the uncontrolled rectifiers in an uninterrupted current regime and correspond to the switching sources of the PCs.
7.
The current on phase B is less distorted (THD ≈ 18%).
8.
It is emphasized the unbalance introduced by phase B (the current is more than twice as high as that of phases A and C).

3. Experimental Setup

The analysis shows that in order to improve the power quality in PCC, three goals must be achieved: compensation of the distortion power, compensation of the reactive power and compensation of the load unbalance. To achieve them, a four-wire three-leg shunt active power filter was designed, the connection with the transformer neutral point being obtained by dividing the compensation capacity.
The main parameters of the power system are included in Table 1.
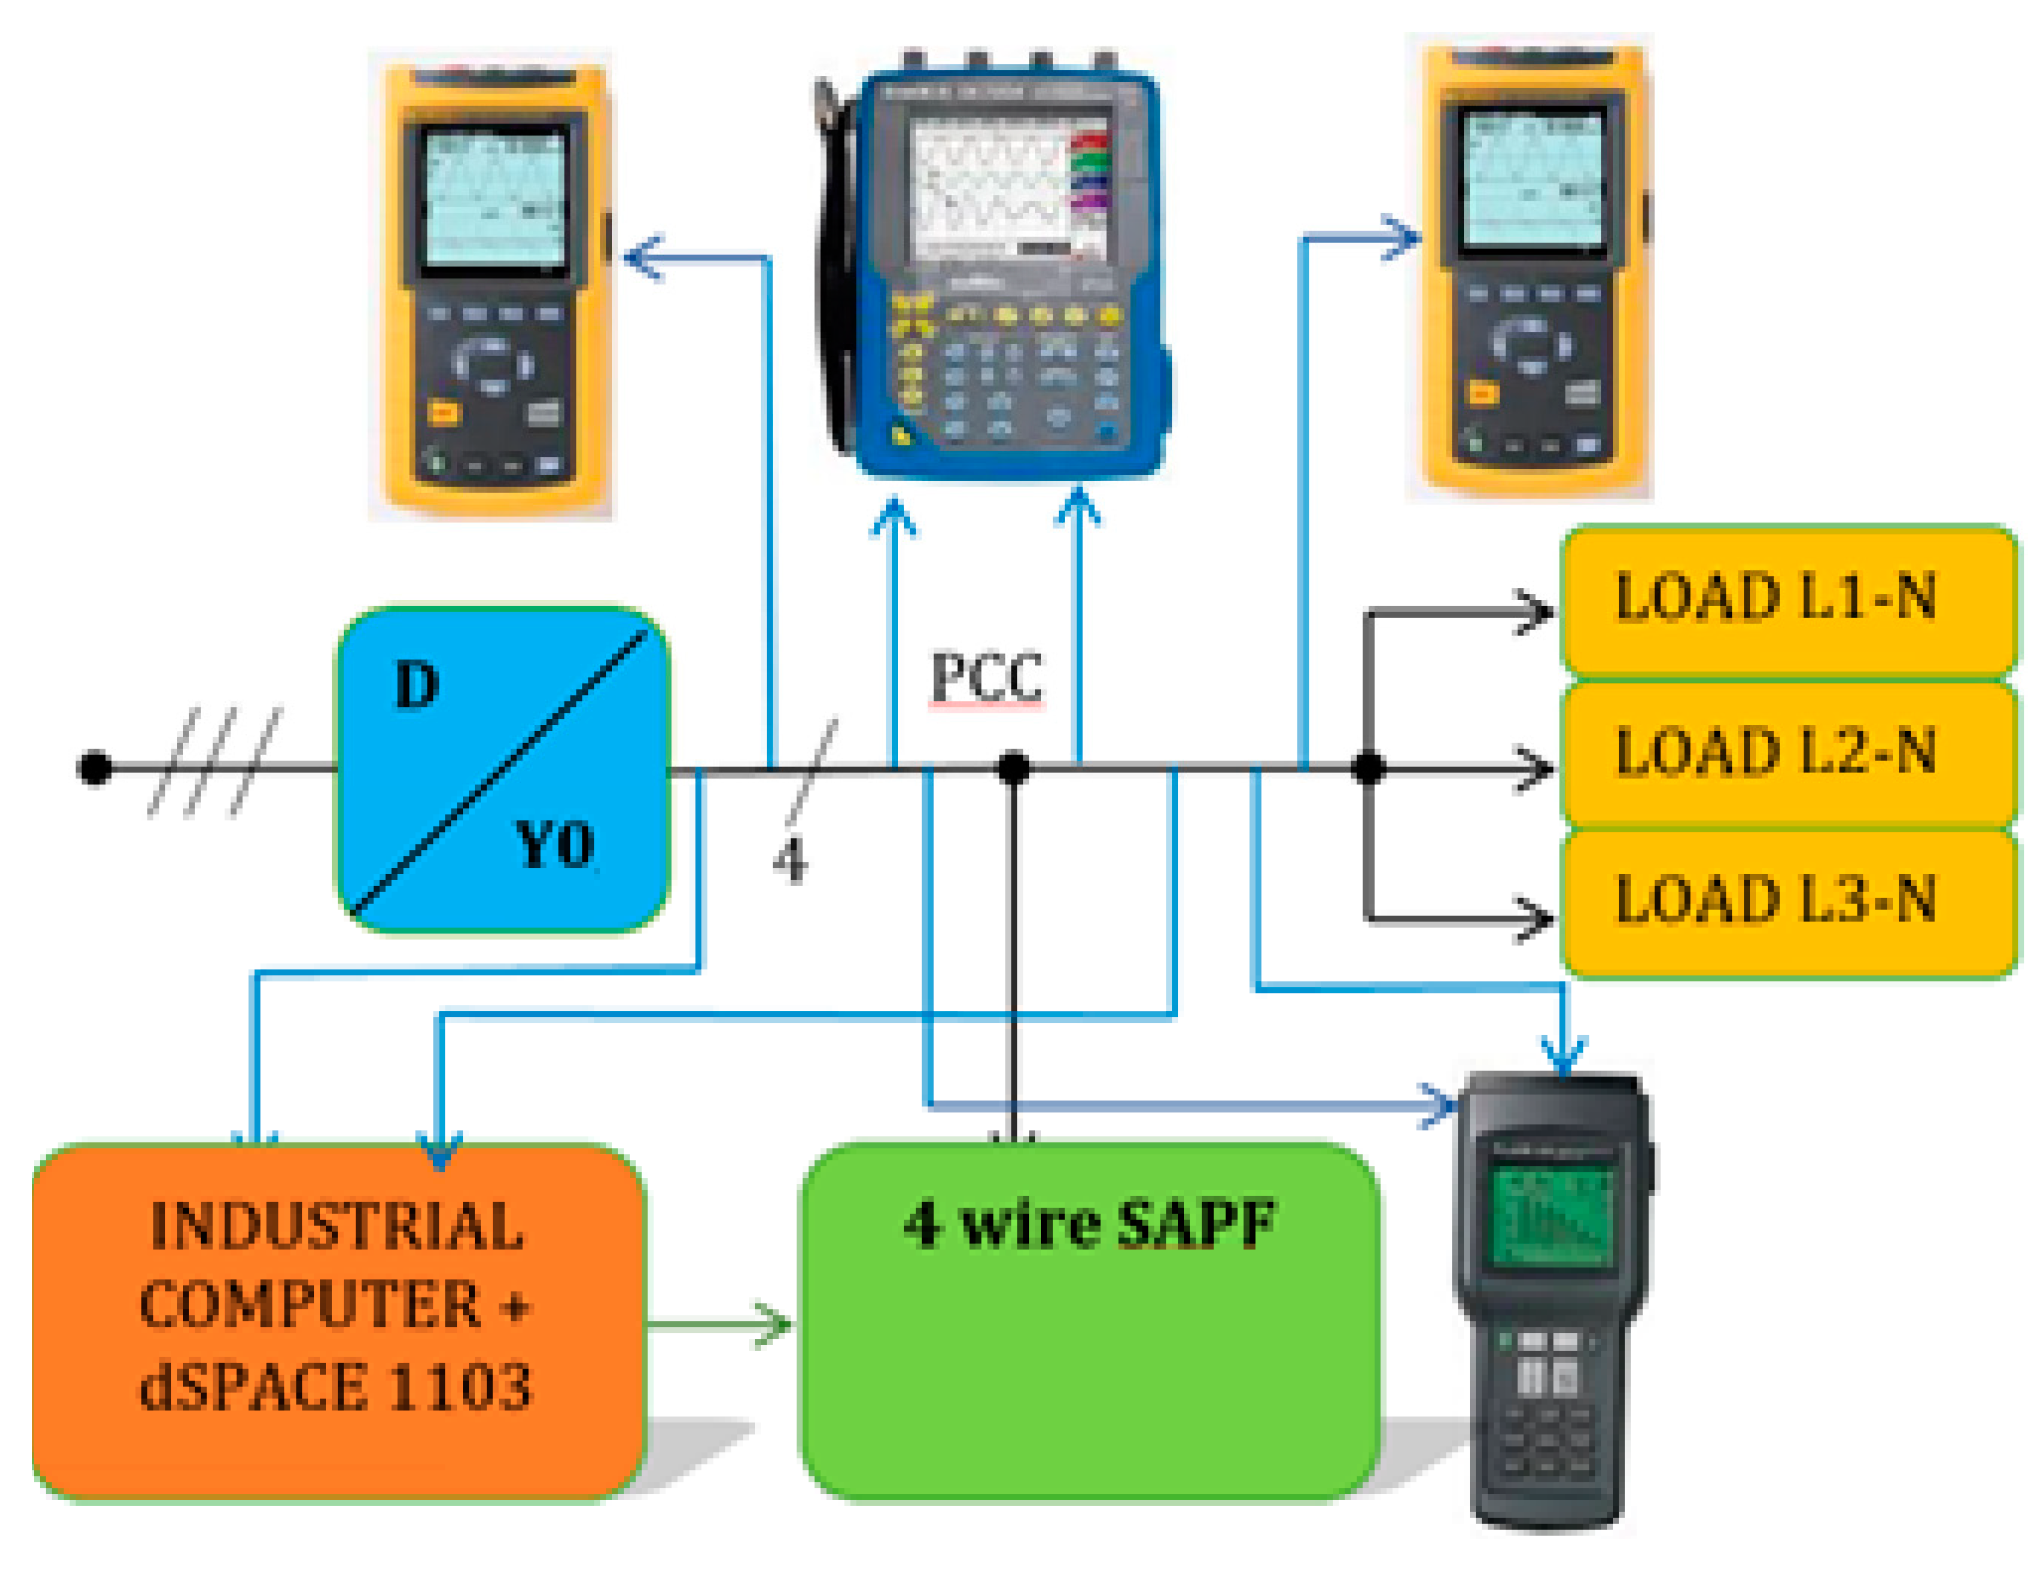
To determine the efficiency of the proposed solution, the experimental structure shown in Figure 6 has been conceived. It includes:
  • The active power filter, which is being developed as a prototype;
  • An industrial computer (IC), which ensures the proper SAPF control through the dSPACE 1103 prototyping board (dSPACE GmbH, Paderborn, Germany);
  • Two Fluke 435 power quality analyzers connected upstream and downstream of the PCC;
  • A METRIX OX 7042 oscilloscope (Chauvin Arnoux Group, Paris, France) to record the waveforms of the quantities of interest;
  • A Fluke 41B analyzer (Fluke Corporation, Everett, WA, USA) to record the waveforms and power quality indicators at the time of measurement.
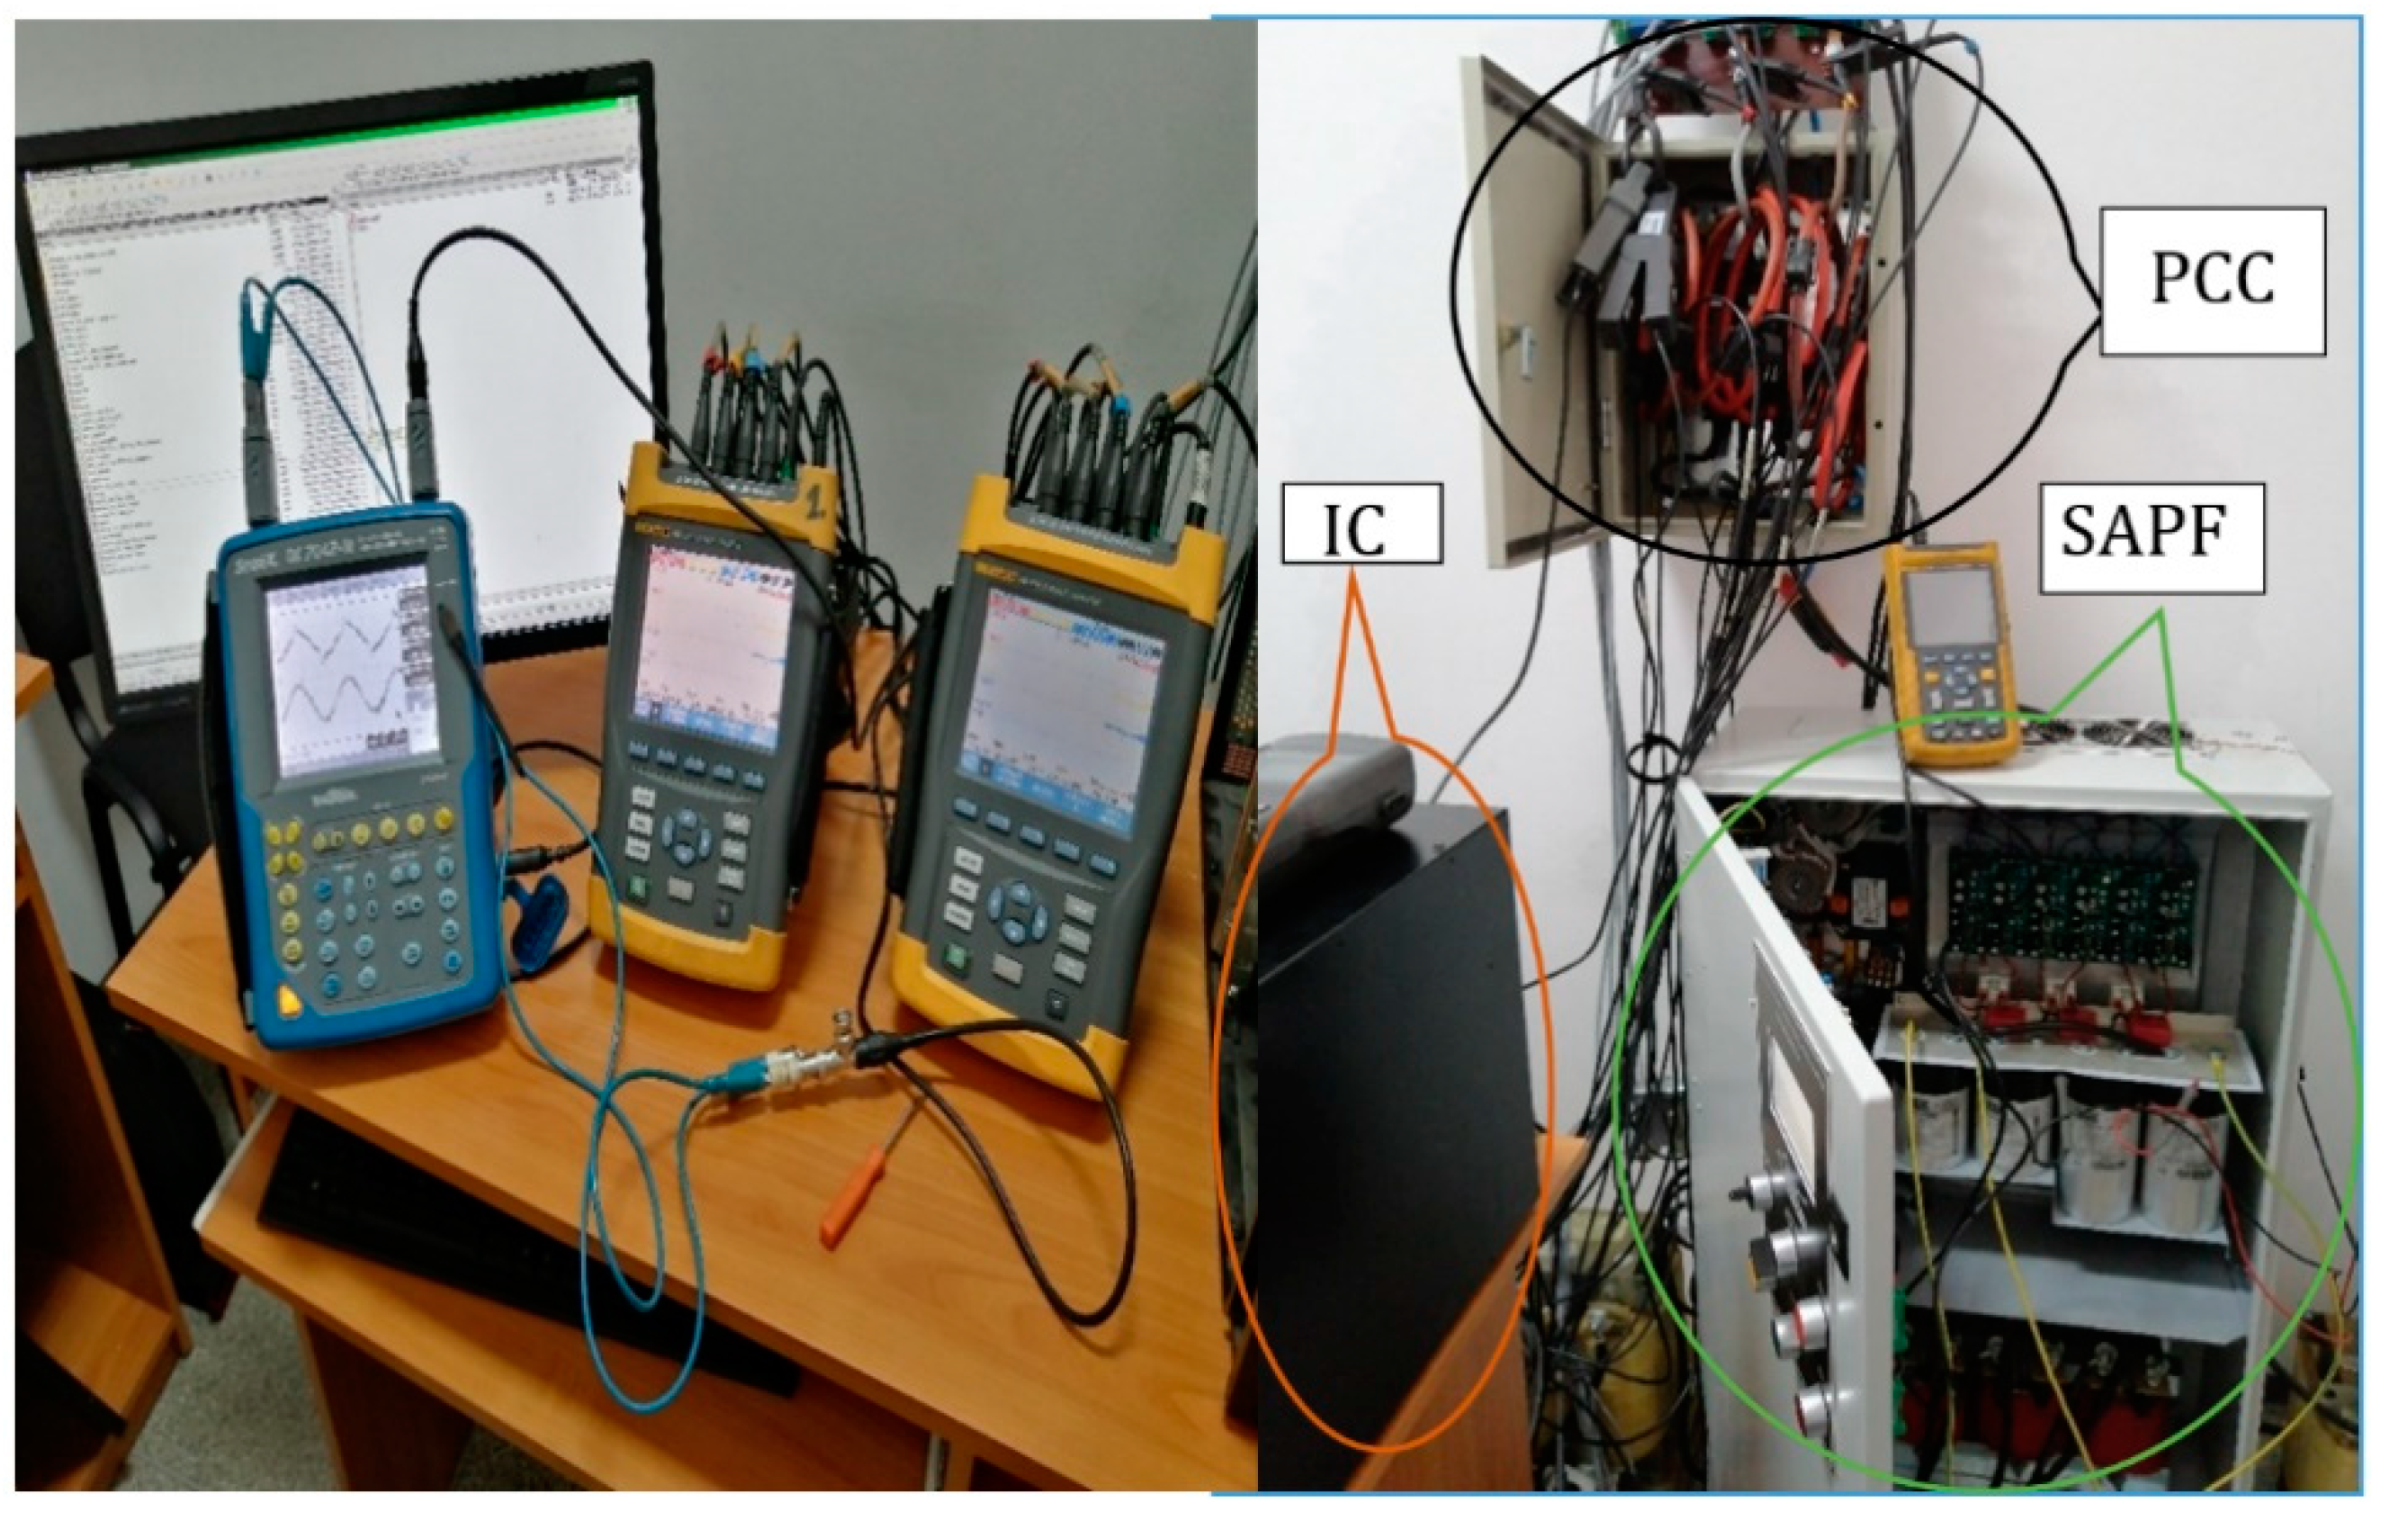
A picture of the experimental stand is given in Figure 7, which highlights the connection of the transducers in PCC, the cabinet in which the SAPF components are mounted, the industrial computer and the devices used.

4. Four-Wire Three-Leg SAPF and the Control System

The four-wire SAPF with split compensation capacitor has a known structure and is made with IGBT transistors (Figure 8 and Figure 9).
The SAPF is controlled by implementing the indirect current control method in an original variant. Thus, the active prescribed current is obtained as a sum of the loss current provided by the DC voltage controller and the equivalent active current of the unbalanced load.
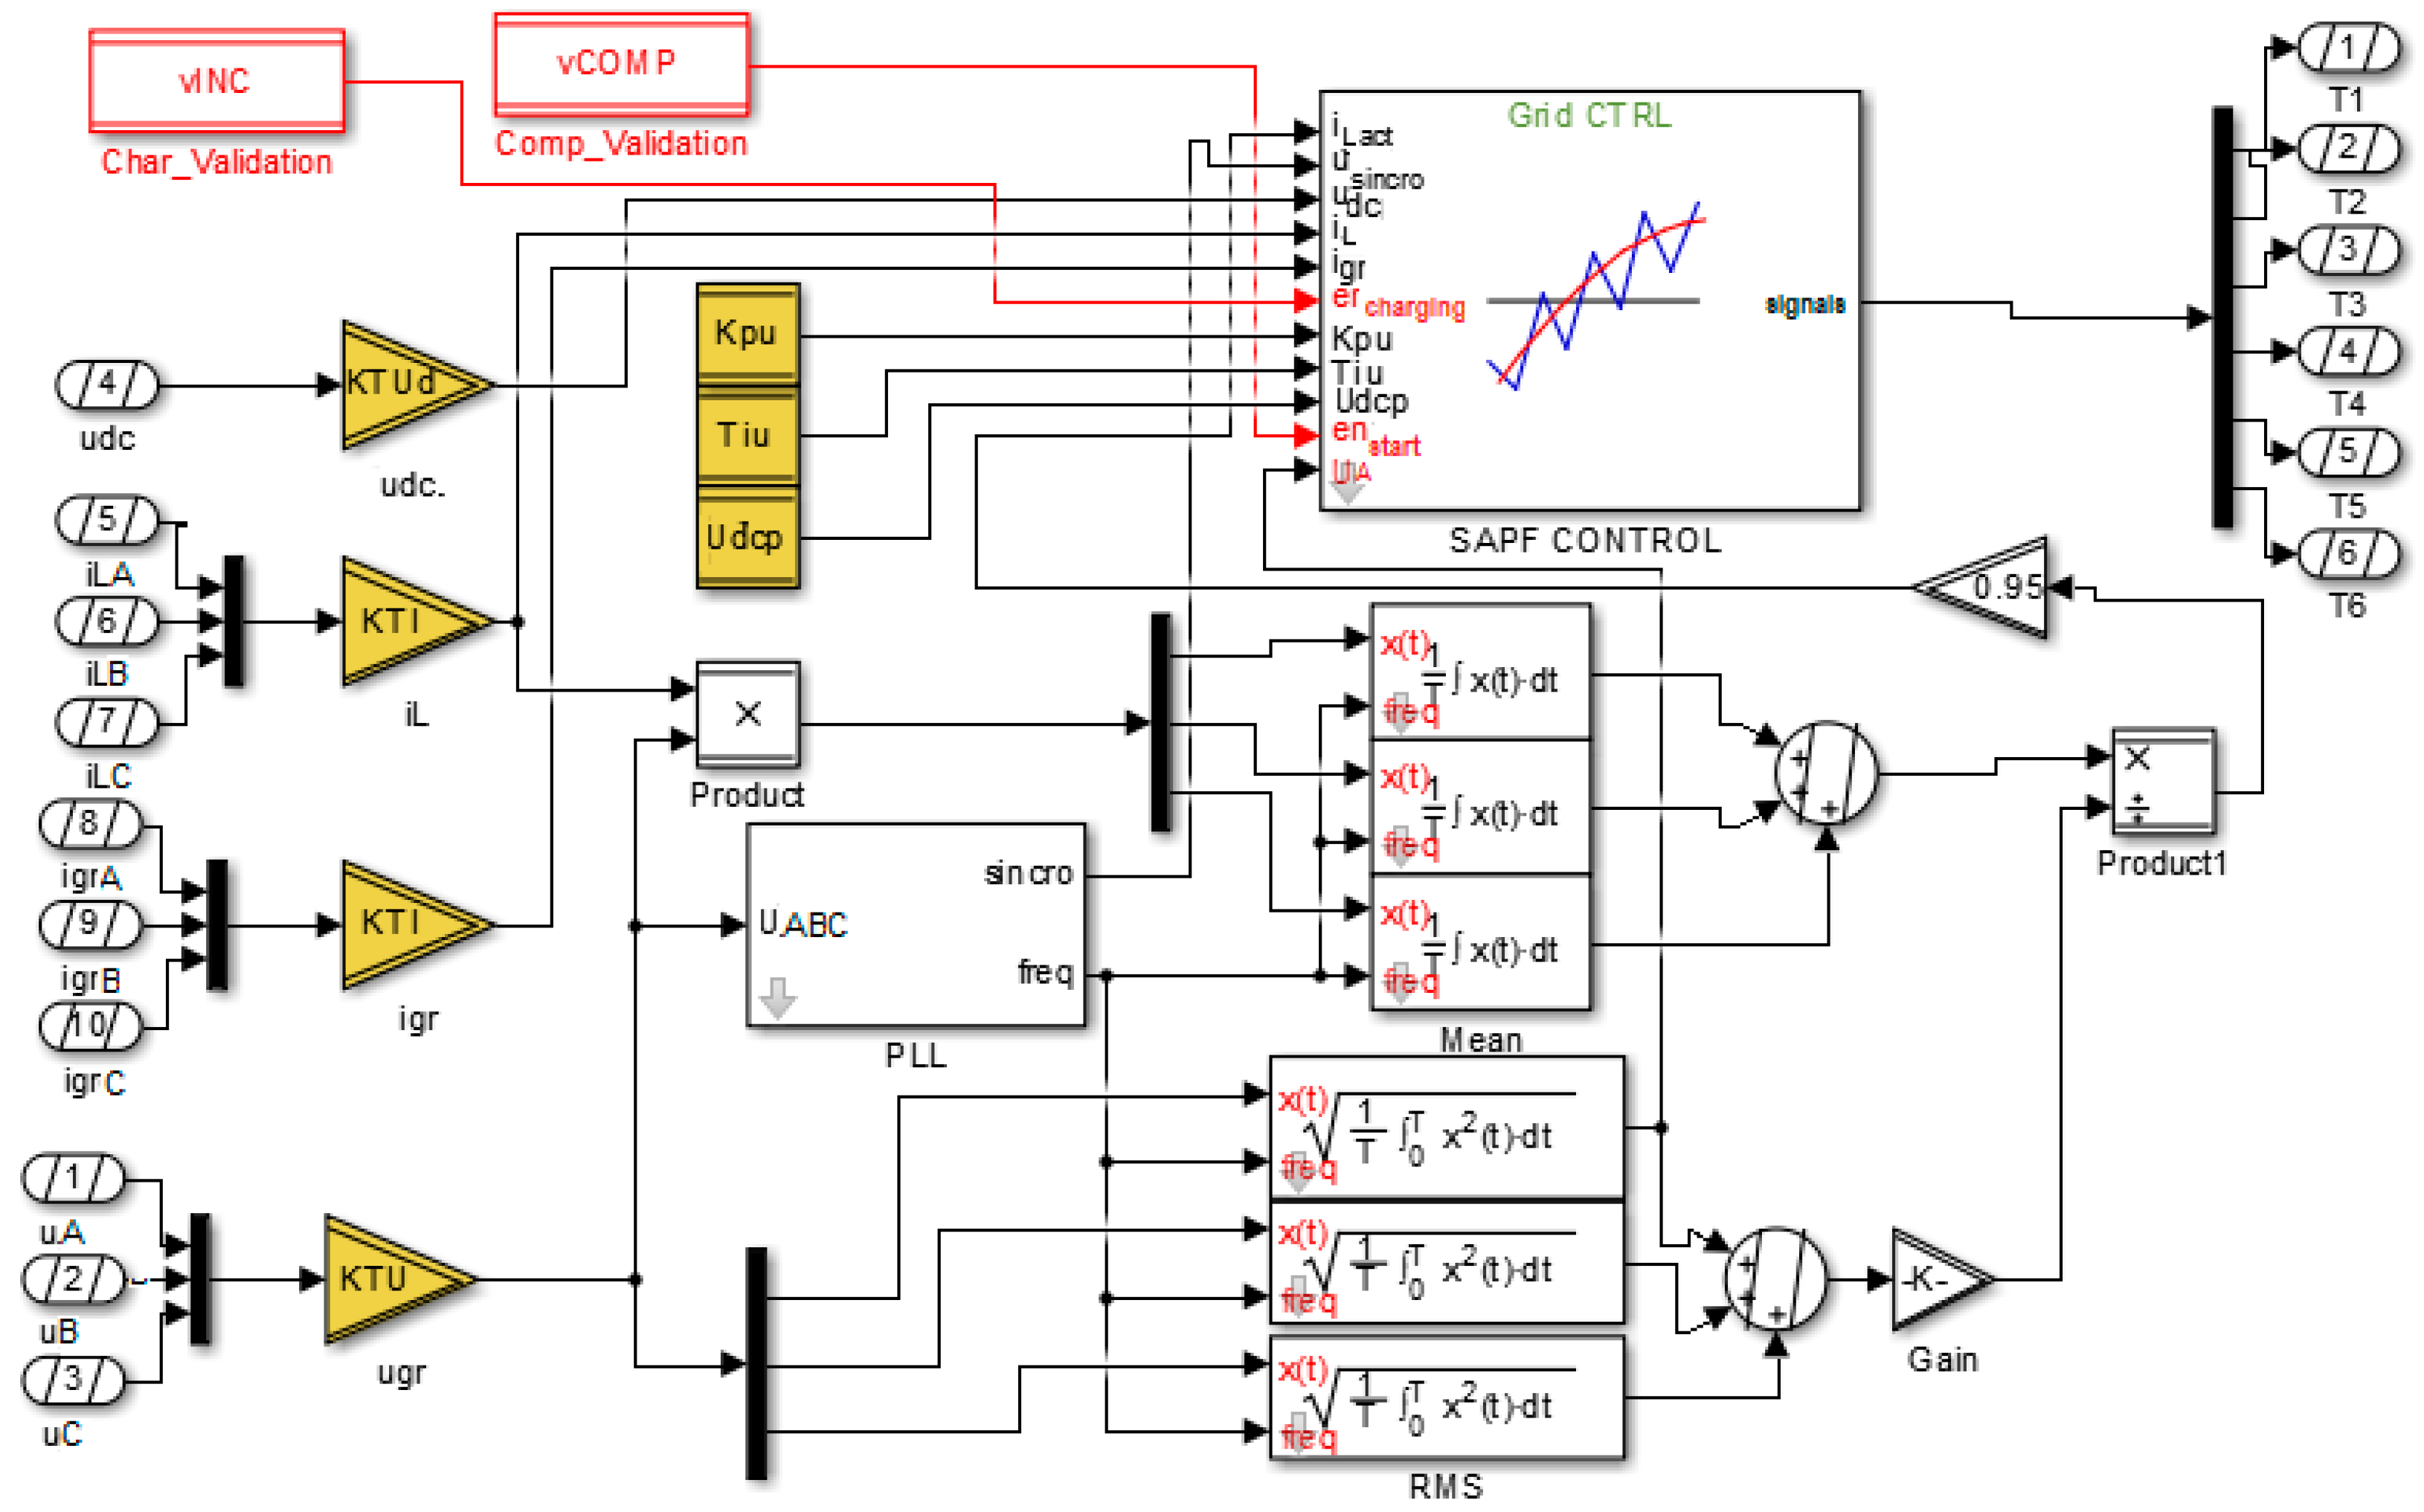
All the control algorithms were created in Matlab/Simulink (R2014a, MathWorks, Natick, MA, USA) and implemented on the DS1103 PPC Controller Board for rapid control prototyping. (Figure 10).
The quantities required to implement the control algorithm are as follows: the voltage on the compensation capacitor (udc), load currents (iLA, iLB, iLC), mains currents (igrA, igrB, igrC) and phase voltages in PCC (ugrA, ugrB, ugrC).
These are acquired through analog to digital converters (ADCs) and appropriate scaling factors that multiply the ADCs’ outputs (KTUd, KTI, KTU) are required to obtain quantities in absolute units.
A phase-locked loop (PLL) circuit [16] provides three sinusoidal signals of unity magnitude in phase with the fundamentals of phase voltages (the signal “sincro”) and having their frequency (freq).
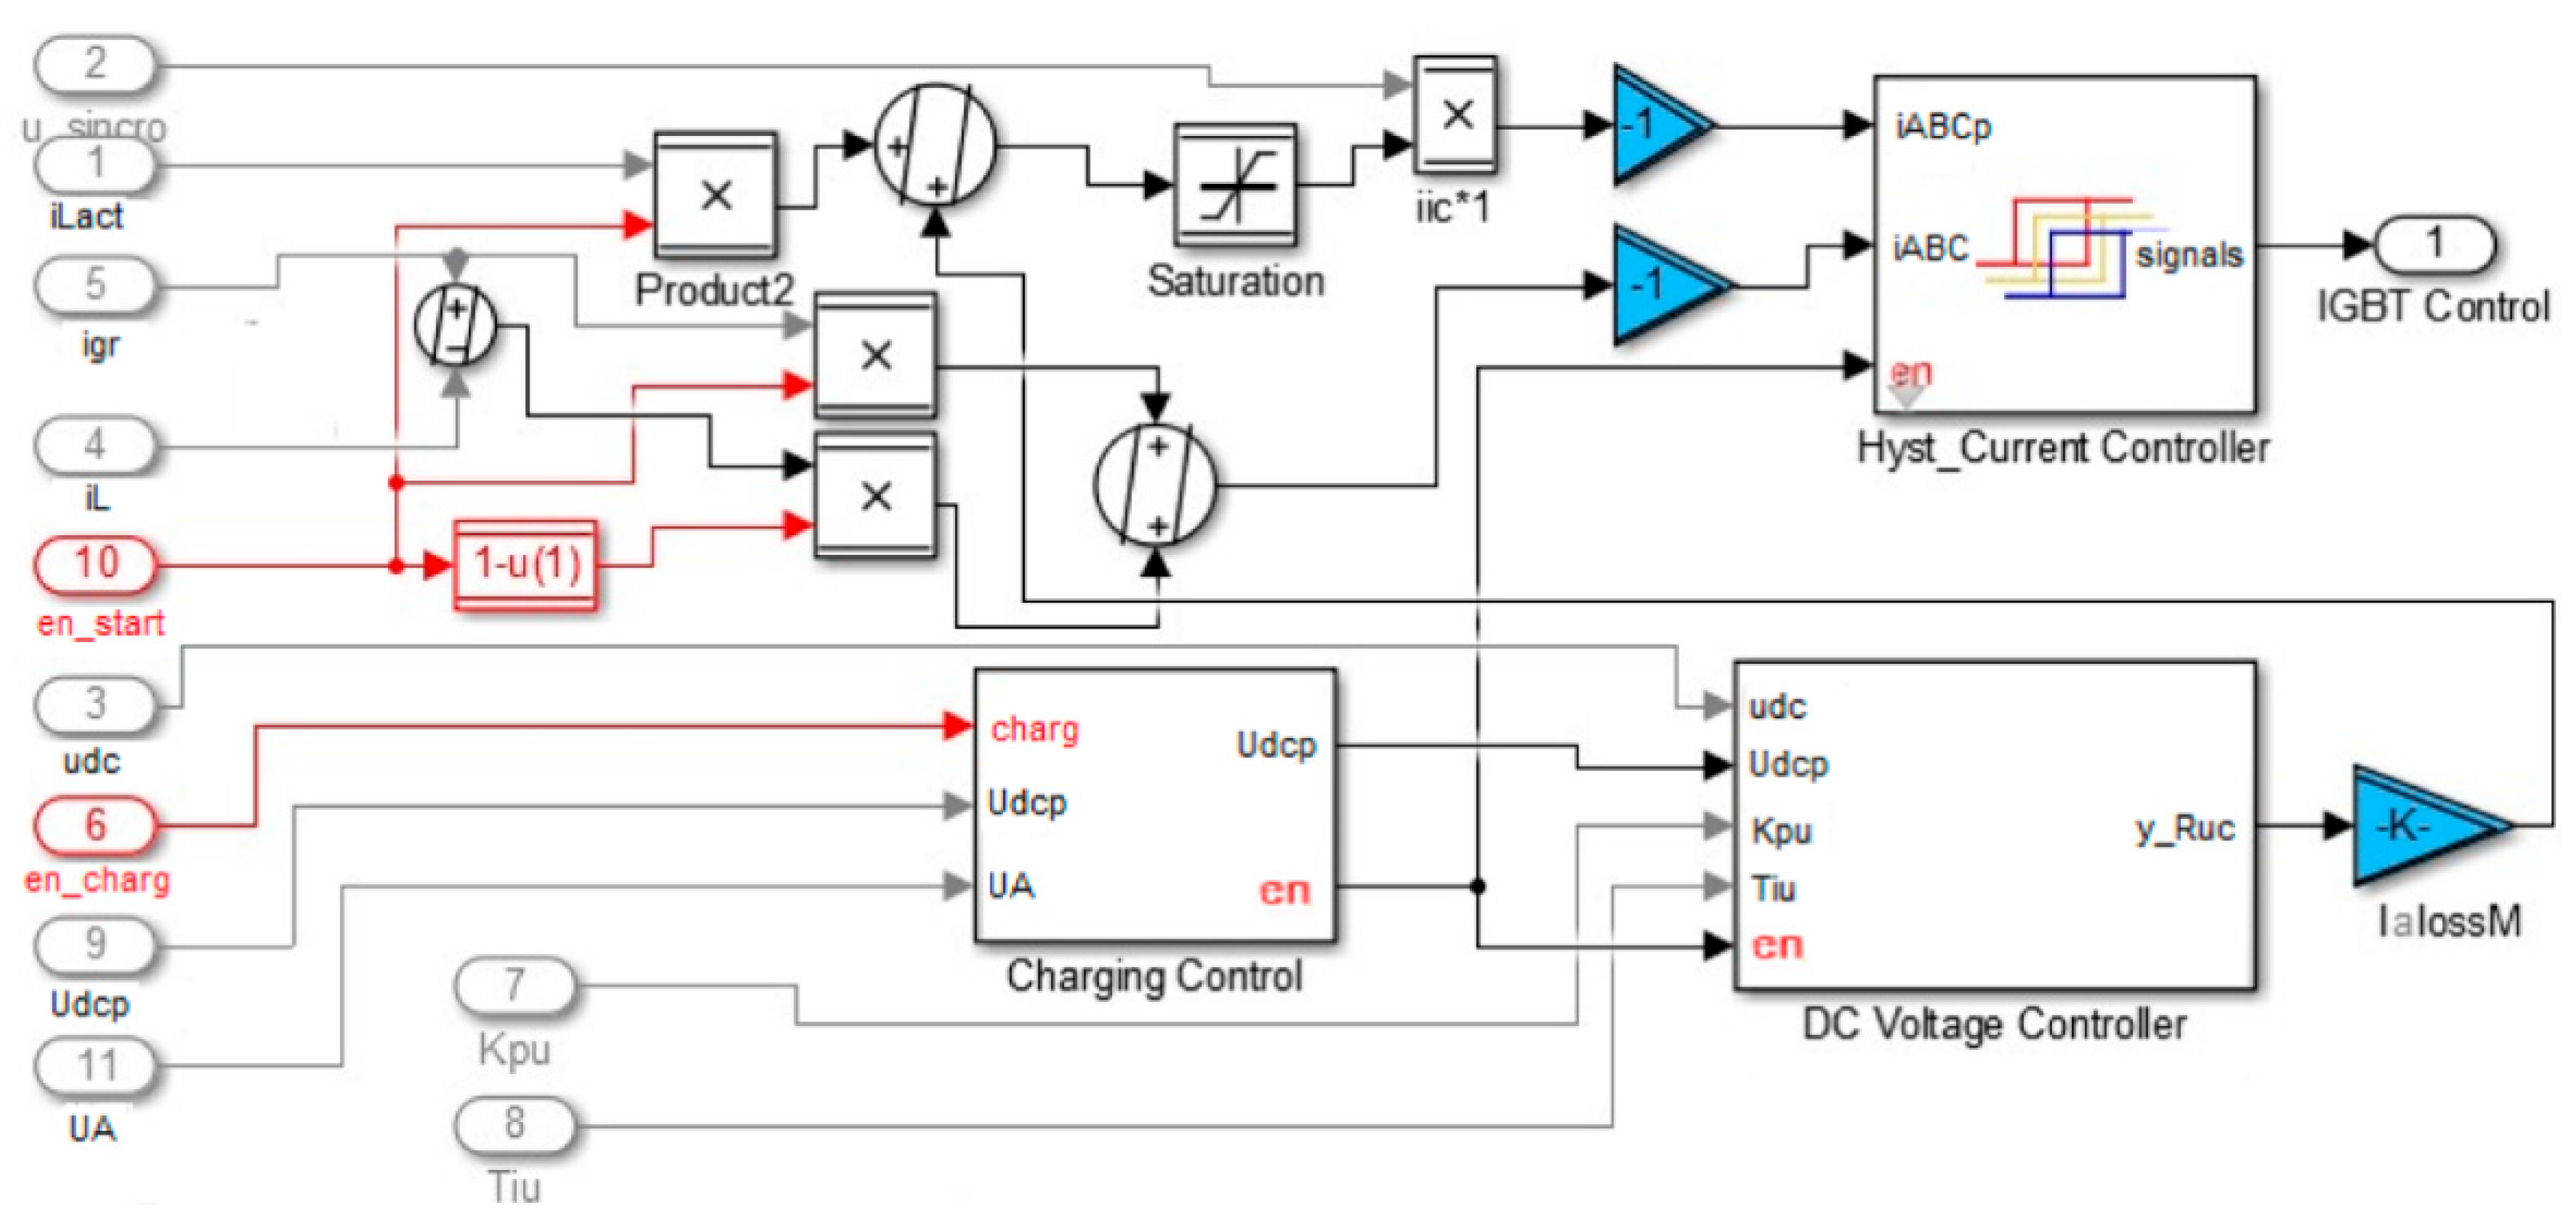
The original method adopted for the indirect current control involves the control of the grid current by prescribing the total active current ( i g r * ), which is obtained as the sum of two components (the current corresponding to the losses in SAPF (ialoss) and the load-balanced active current (iaL).
i g r * = i a l o s s + i a L .
The two components of the current, on each phase, are obtained by multiplying the corresponding magnitudes with the “sincro” signal. The magnitude of the current related to losses (IalossM) is obtained from the output of the capacitor voltage controller (y_Ruc), transformed into amps (Figure 11). A detailed description of the blocks in Figure 11 can be found in [44].
The magnitude of the balanced active current of the load (IaLM) is calculated in provided at the output of the multiplication block Product1 (Figure 10) and supposes the completion of the following stages:
(a) Calculate the active power on each phase of the load in the “Mean” blocks (Figure 10),
P A , B , C = f t 1 / f t u A , B , C i L A , B , C d t ;
(b) Calculate the RMS value of the phase voltages in the “RMS” blocks (Figure 10),
U A , B , C = f t 1 / f t u A , B , C 2 d t ;
(c) Calculate the magnitude of the balanced active current of the load,
I a L M = 2 ( P A + P B + P C ) U A + U B + U C .
Thus, the total active current prescribed to the current controller is obtained by multiplying the total magnitude with the “sincro” signal (Figure 11),
i g r * = ( I a l o s s M + I a L M ) s i n c r o .
It must be specified that:
-
the variables vINC and vCOMP (Figure 10) validate the control of active charging of the compensation capacitor and the control of compensation, respectively;
-
the voltage controller is of PI type and was designed based on the modulus criterion in Kessler variant [45], and its parameters (Kpu and Tiu) but also the prescribed DC-voltage Udcp (Figure 10) can be modified by means of a conceived graphical interface which was created with dSPACE’s ControlDesk (R2016-B, dSPACE GmbH, Paderborn, Germany) (Figure 12) that allows the system monitoring and acquisition of the required quantities for further processing;
-
the current controllers on each phase are of the hysteresis type.

5. Active Filtering System Performance

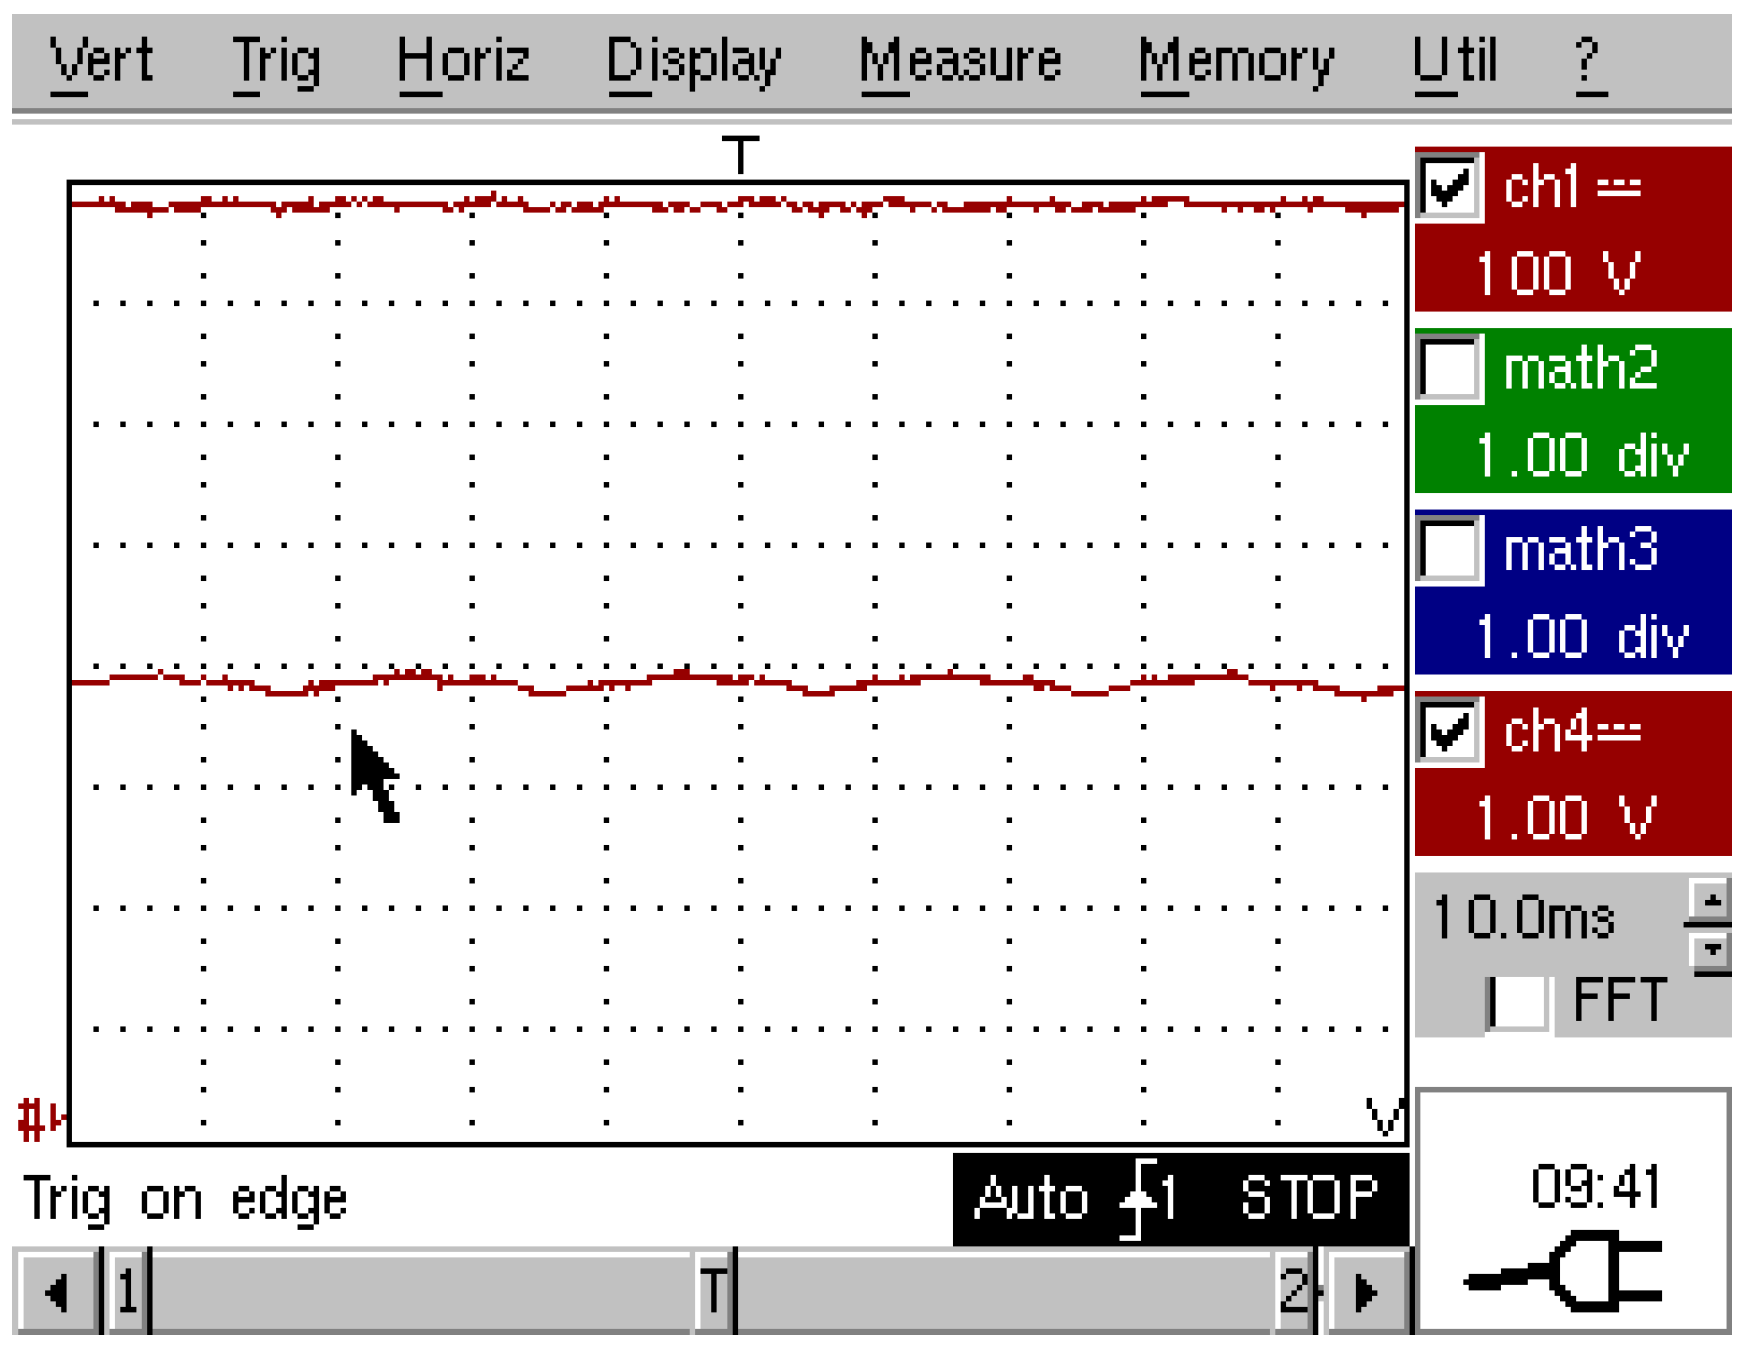
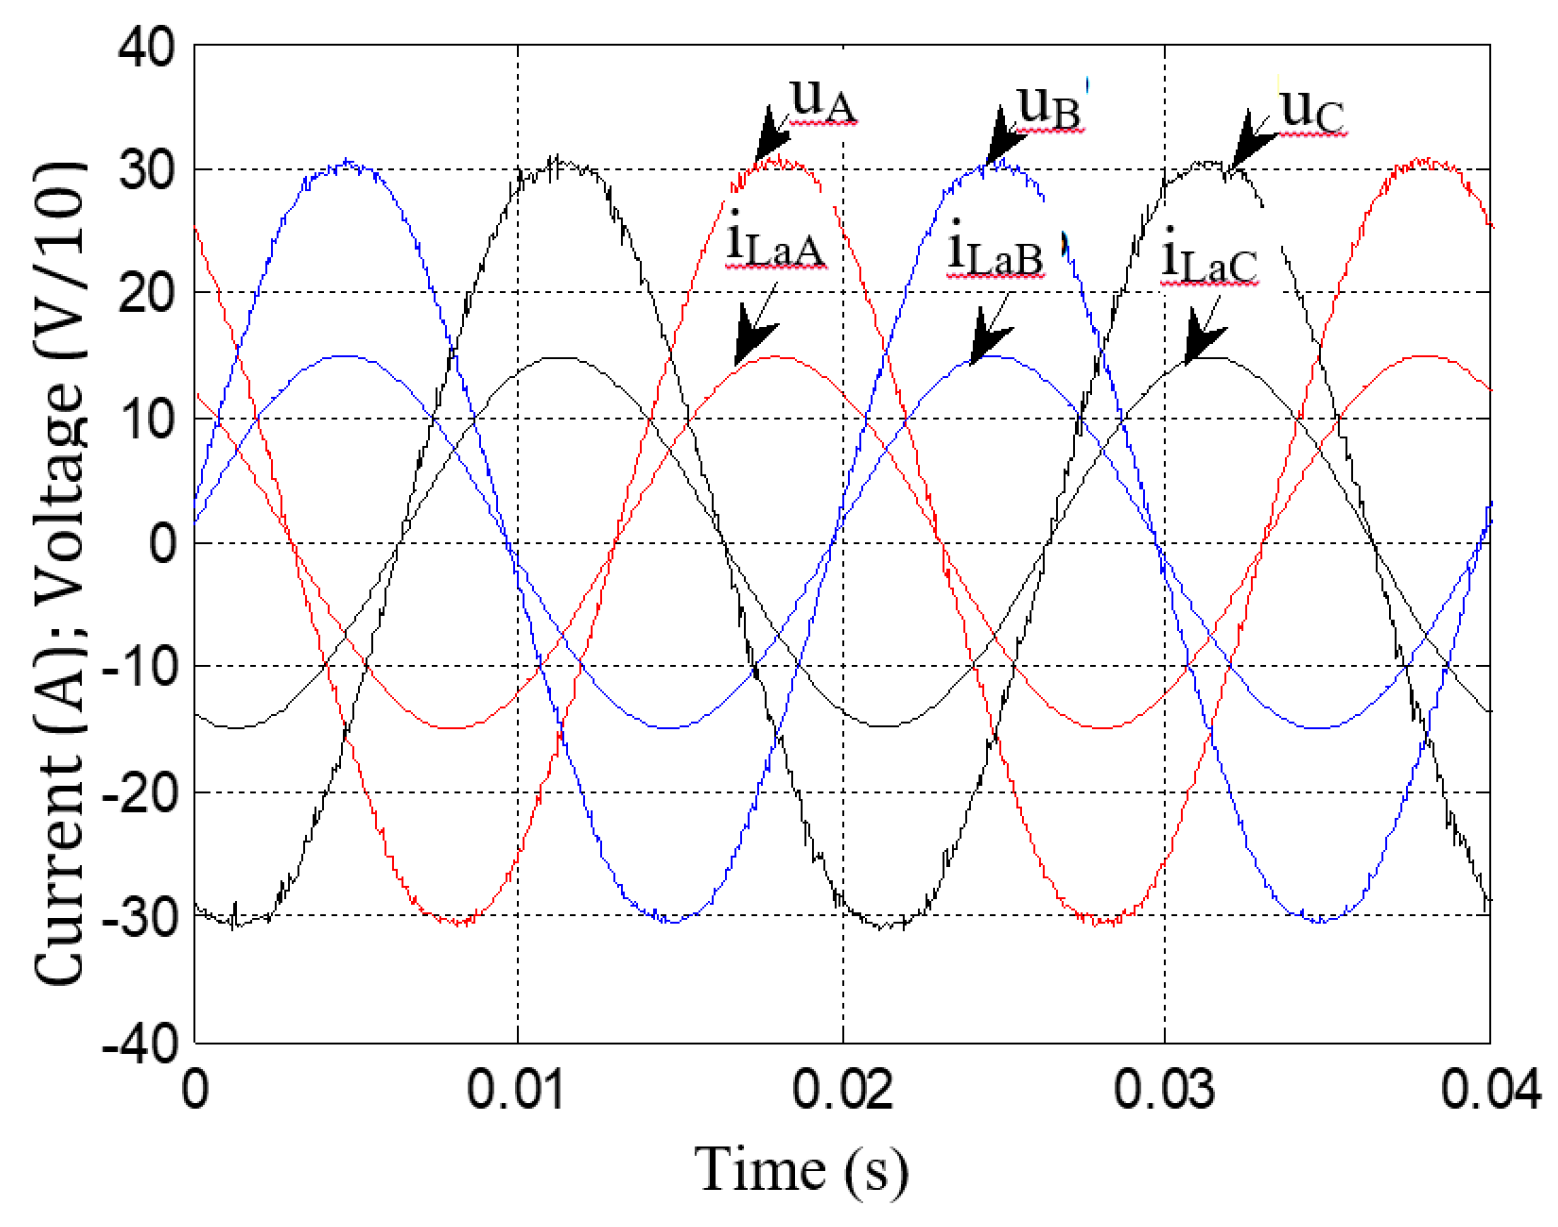
The adopted control method has the advantage that, the influence of the voltage controller output oscillations on the waveform of the prescribed grid current is practically eliminated. It is known that the voltage on the compensation capacitor has oscillations of a frequency multiple of the grid voltage frequency, and these oscillations are inherently reflected in the output of the voltage controller, which, in addition, has a specific noise due to converter switching (Figure 13). Through the adopted control method, only the current related to losses is affected by the output of the voltage controller. As it represents only 1–3% of the total current, the prescribed current has a practically sinusoidal shape (Figure 14).
After the commissioning of SAPF, the waveforms of currents and voltages were oscillographed and recorded over short time intervals. The power quality indicators were recorded over one time period with a Fluke 41B analyzer and with two Fluke 435 analyzers for 165 min.
The objective of multiple registrations was to verify and demonstrate the effectiveness of the proposed solution in several ways.
Due to the limitation of the number of measuring devices’ input channels, the results presented in the different figures do not correspond to the same time interval, without affecting the proposed goal.

5.1. Compensation of the Distortion Power

The compensation of the distortion power is illustrated by the waveforms of the load phase currents and grid phase currents (Figure 15).
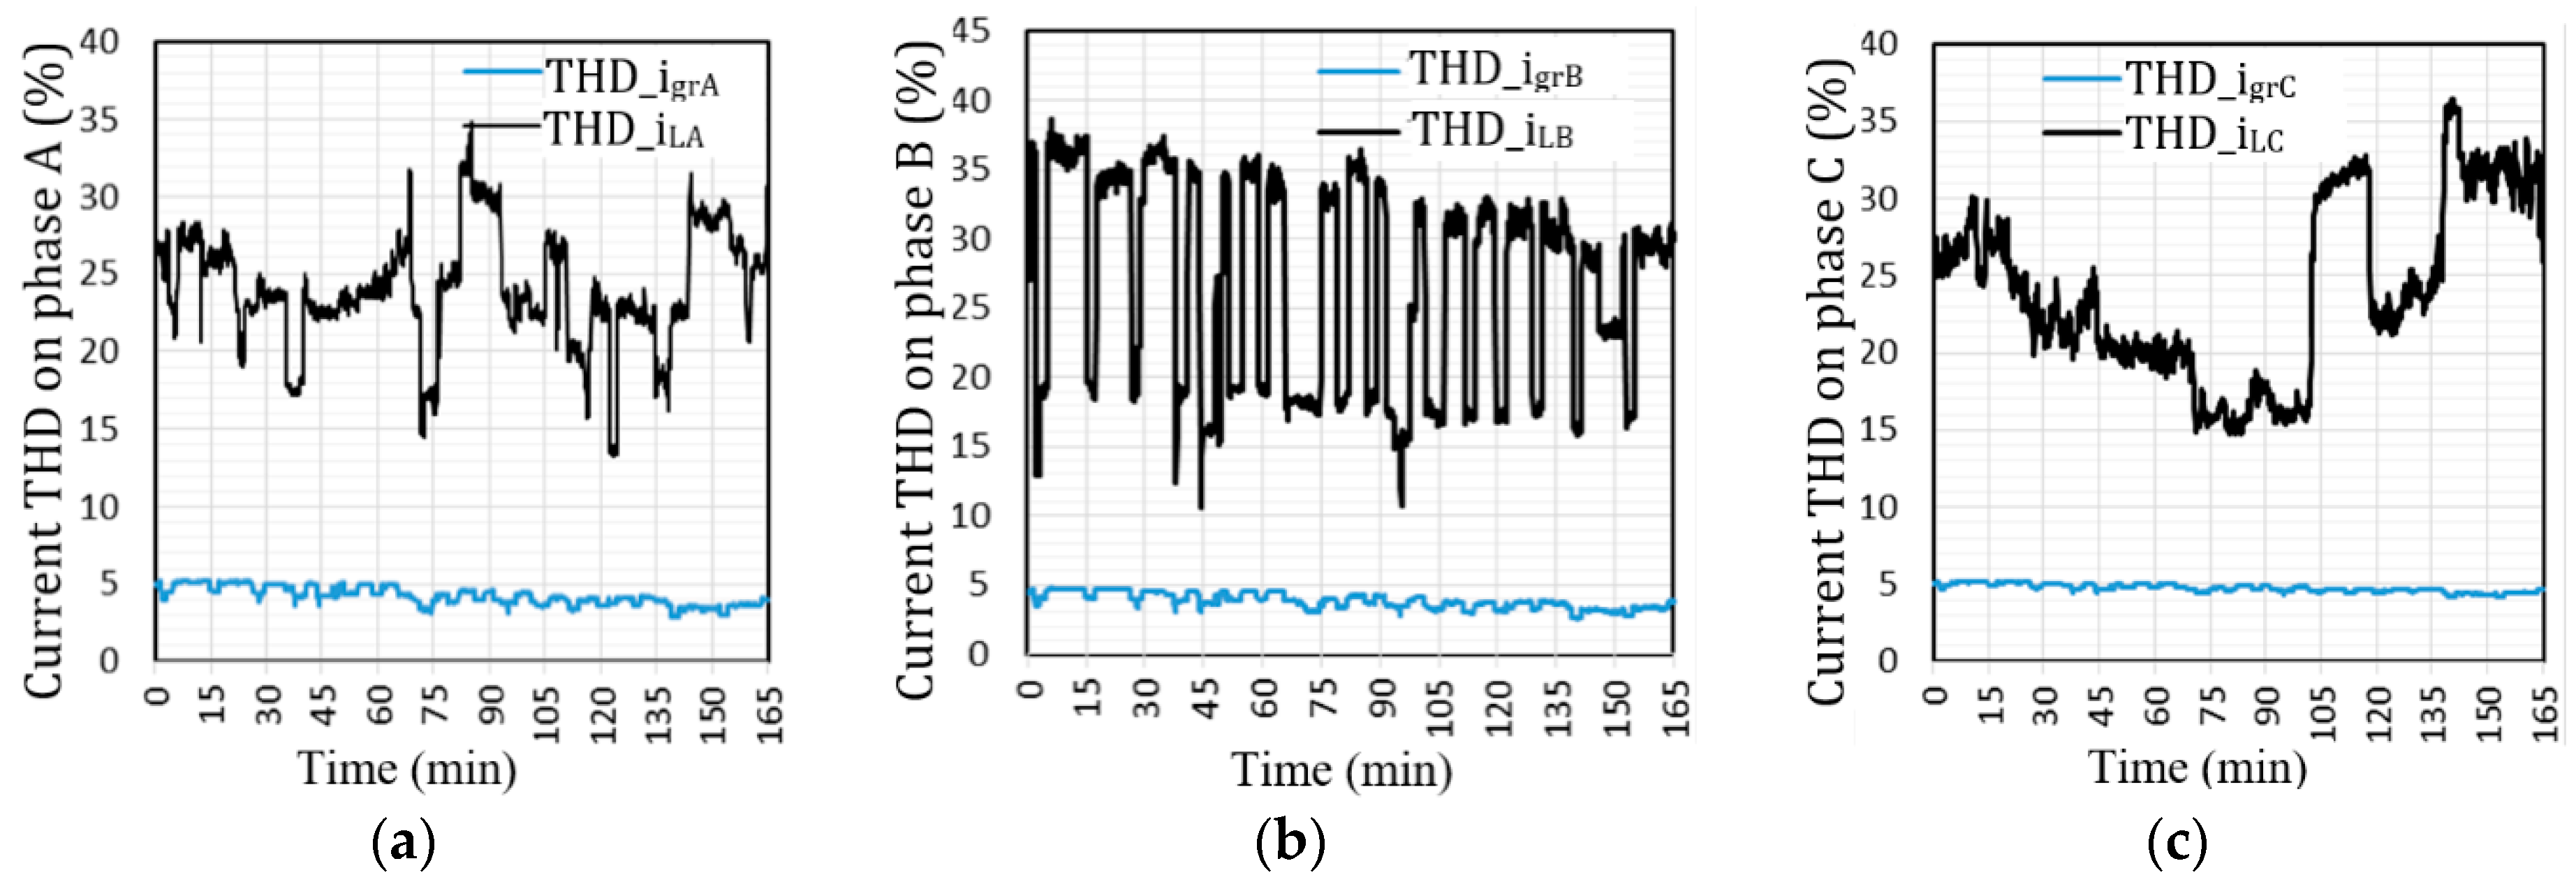
The distortion of the load currents is different in the three phases, respectively THD is of 10–40% (Figure 16, Figure 17, Figure 18 and Figure 19). After the harmonic compensation, THD is reduced to 3.5–5% (Figure 16, Figure 17 and Figure 18).
Correlating the values recorded at the same time points (Figure 19), the filtering efficiency on each phase has the values: on phase A, between 3.25 and 7.7; on phase B, between 4 and 9; on phase C, between 3.12 and 9.1. The filtering efficiency is calculated as the ratio of THD factors before and after harmonic compensation.

5.2. Reactive Power Compensation

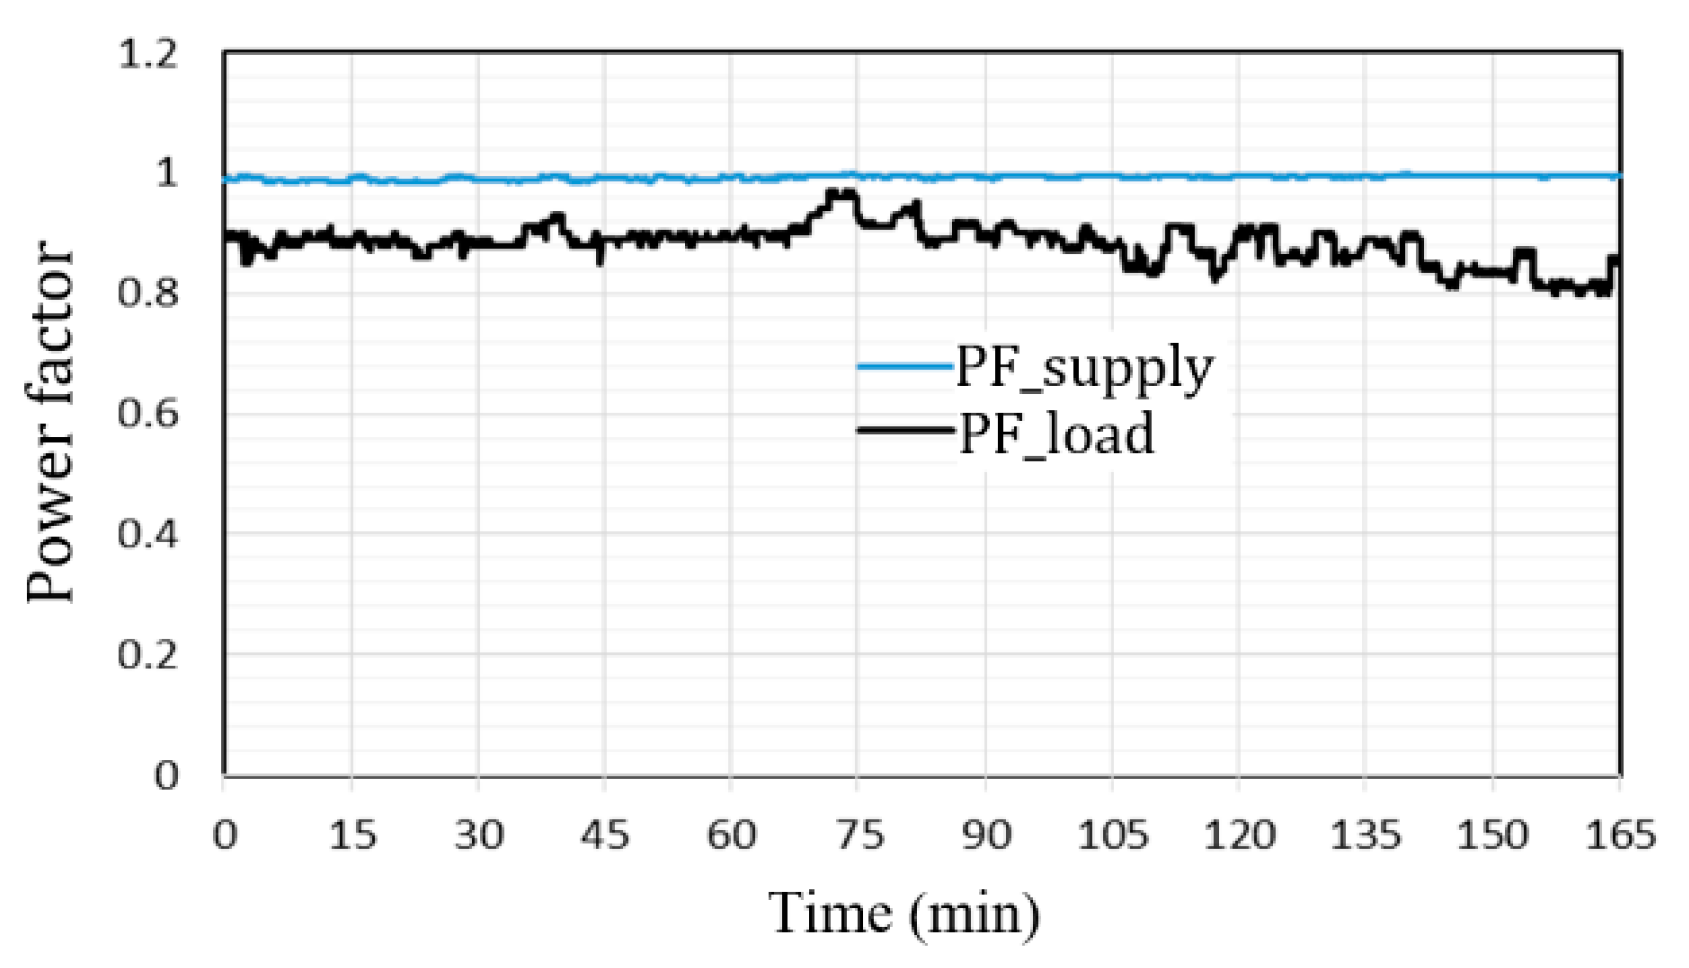
The reactive power compensation is illustrated through waveforms of the phase voltages and currents at the grid side (Figure 20 and Figure 21), which show that their phases coincide. It is also shown that the power factors on each phase, measured with the Fluke 41B analyzer, are unitary (Figure 21). The evolution of the total power factor during the recordings upstream and downstream of the PCC shows very good performance, both in compensating the distortion power and in compensating the reactive power (Figure 22). Thus, the power factor at the load side (downstream of the PCC), for most of the interval, has values between 0.8 and 0.9, and, after compensation, upstream of the PCC, the values become practically unitary.

5.3. Unbalance Compensation

As stated, the load is strongly unbalanced, and a measure of the unbalance is given by the ratio of the RMS current through the neutral wire and the sum of the RMS values of the currents in phases,
ε n L = f t 1 / f t ( i L A + i L B + i L C ) 2 d t I L A + I L B + I L C .
During the recordings, the load current unbalance changes between 13% and 58%, with rapid changes (Figure 23). Regarding the grid currents, zero value was recorded for the current in the neutral wire, although the rms values of the phase currents are slightly different.
To characterize the remaining unbalance after compensation, the deviation of the RMS value of the phase current from the average value of current on phases (Iav) was used. In addition, the indicator defined as the ratio of the maximum deviation and the sum of the RMS values of the phase currents was introduced, as follows:
ε n g r = M a x A , B , C | I A , B , C I a v | I A + I B + I C .
The values of this indicator are in the range 0–2.15% and show that the grid current unbalance is negligible.
By processing the records, the electrical losses saved upstream of the PCC were estimated, which highlights the positive effects of connecting the active filtering system. For this, the compensated unbalance active power and the compensated apparent power were calculated.

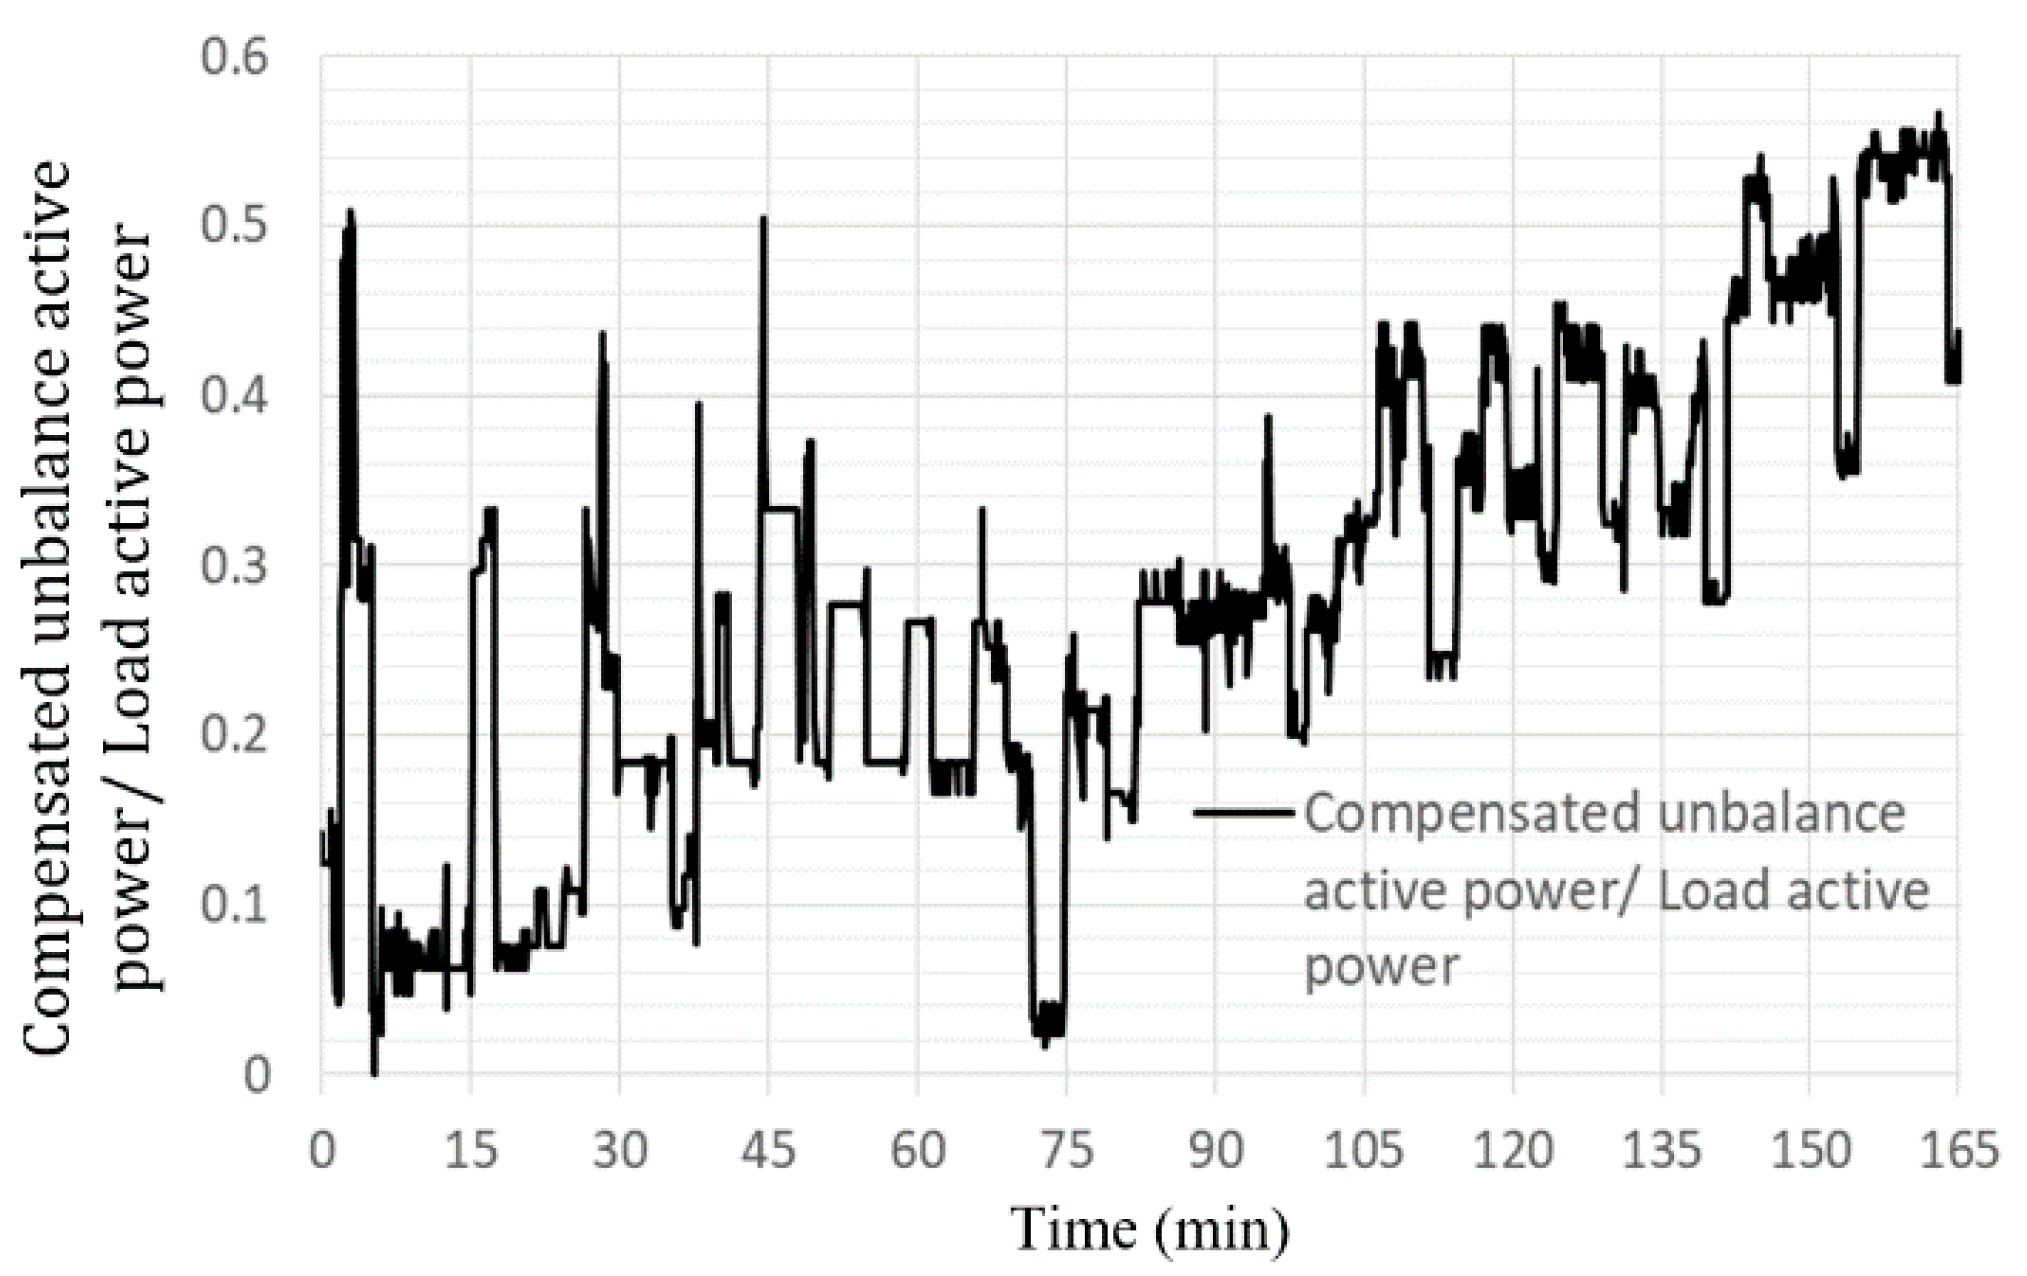
5.4. Compensated Unbalance Active Power

Given that the load unbalance is fully compensated, the compensated unbalance active power was calculated by the expression:
P t u n b ( p . u . ) = 1 P L t A , B , C | P L A , B , C P L t / 3 | ,
where PLA,B,C are the active powers on each phase of the load, and PLt is the total active power taken over by the load (the sum of the active powers per phase). Its evolution shows rapid and frequent variations, the minimum value being 0% and the maximum value about 57% (Figure 24).

5.5. Compensated Apparent Power

The compensated apparent power was calculated by the expression:
S c o m p ( p . u . ) = S L t 2 P L t 2 S L t .
It has a minimum value of 24% and a maximum value of 60% (Figure 25). It is significant that, during the recordings, in the longest period, the values are in the range of 40–50%.

5.6. Saved Electrical Losses Upstream of the SAPF Connection Point

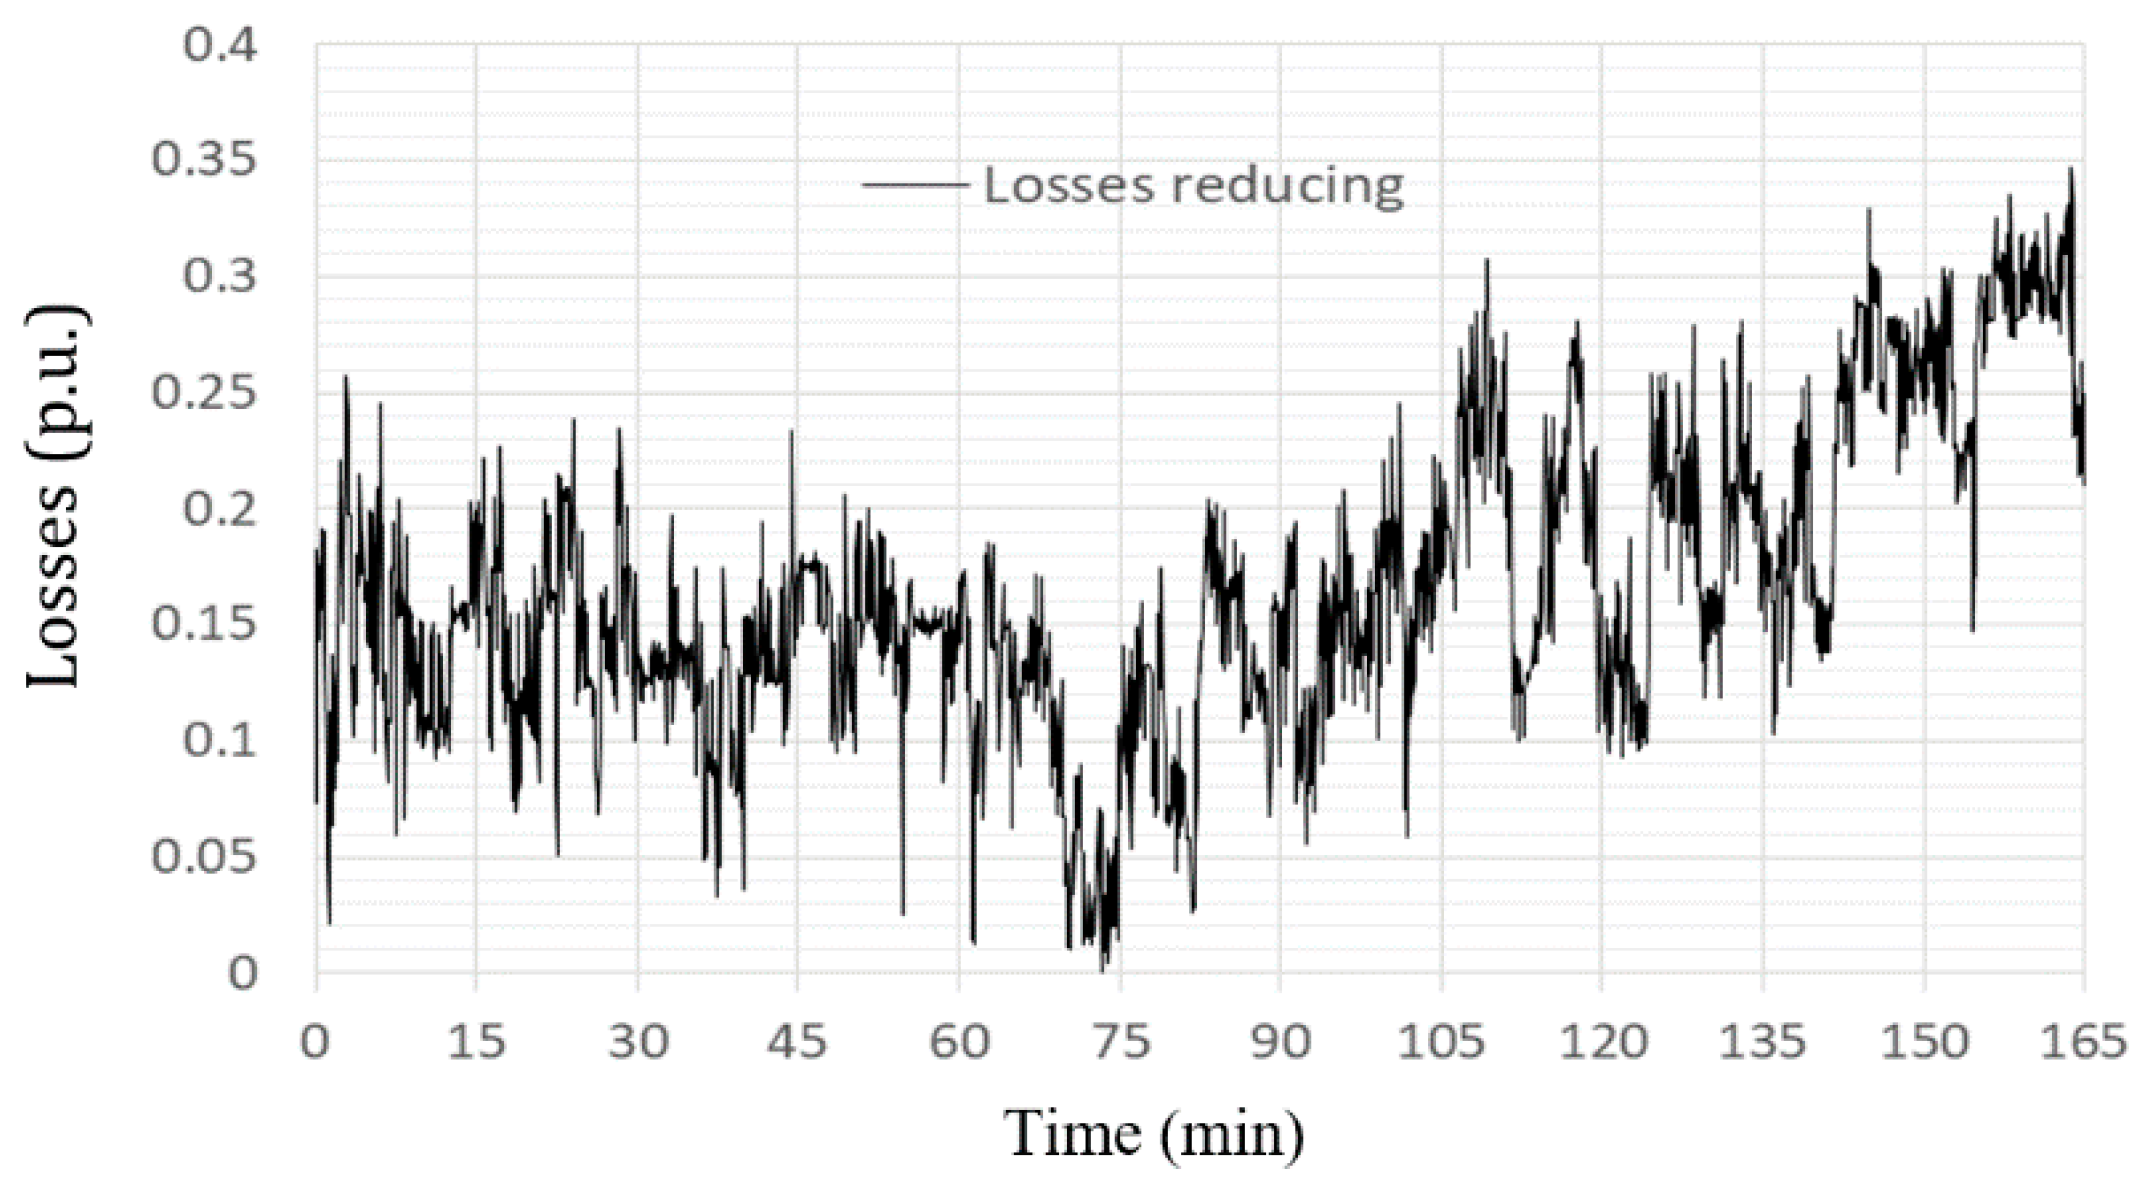
In assessing the relative decrease in electrical losses upstream of the SAPF connection point the Joule effect losses were taken into account, which are proportional to the square of the rms value of the current.
Thus, the equivalent grid current in the absence of SAPF (Ie1) and the equivalent grid current in the presence of SAPF (Ie2) were calculated as follows:
I e 1 = S L t U A 2 + U B 2 + U C 2 ; I e 2 = S g r t U A 2 + U B 2 + U C 2 ,
where Sgrt is the total apparent power at the grid side after compensation.
Further, if the equivalent resistance downstream of the PCC is considered to be constant, the saved electrical losses can be expressed as:
δ P s a v e ( p . u . ) = I e 1 2 I e 2 2 I e 1 2 .
The evolution of the relative decrease of the electrical losses upstream of the connection point of the SAPF changes between 0% and 35%, with an average value of about 20% (Figure 26). It is appreciated that this result also supports the efficiency of the active filtering system.

6. Synthesis of the Results

  • The energetic analysis performed by the recordings with the Fluke 435 analyzer in the PCC of the Industrial electronic department of a large enterprise showed that the regime is strongly distorted and unbalanced.
  • In order to improve the power quality, a four-wire three-leg SAPF with compensation split-capacitor, which was connected in the PCC, was designed and achieved, as a prototype.
  • The control algorithm based on an original indirect current control by using the active component of the load current was implemented on the DSP prototyping system dSPACE 1103.
  • Experimental tests and data collection were performed by four means:
    -
    DSP board dSPACE 1103 through the graphical interface created for this purpose;
    -
    The two-channel oscilloscope METRIX OX 7042;
    -
    Fluke 41B Analyzer;
    -
    Fluke 435 Analyzer (two devices).
  • The energy parameters were recorded simultaneously, upstream and downstream of the SAPF connection point, for about 3 h (165 min).
  • The recorded waveforms at different time points (using the oscilloscope and Fluke 41B analyzer), correlated with the processing of data recorded with Fluke 435 analyzers, highlight the very good performance obtained by active filtering, respectively:
    -
    The total harmonic distortion factors of the phase grid currents have values between 3.5% and 5% and fall within the imposed limits. After correlation with the values recorded at the same time, points for load currents, a filtering efficiency between 3.12 and 9.1, is obtained;
    -
    Both the compensation of the distortion power and the compensation of the reactive power are obtained, which makes the supply power factor, after the compensation, to be almost unitary;
    -
    The load current unbalance varies between 13% and 58%, whereas, at the grid side, it is negligible (maximum 2.15%);
    -
    It was estimated that, through the proposed solution, a decrease of electrical losses is obtained upstream of the SAPF connection point of up to 35%, with an average value of about 20%.

7. Conclusions

It has been proven experimentally that the proposed solution (three-phase four-wire SAPF with split-capacitor and the control algorithm) for solving the problems of power quality in the considered case study is appropriate in order to achieve total compensation (distortion power, reactive power and unbalance power).
The research presented in the paper contains at least two novelty elements:
-
it proposes the use of a new indirect current control method;
-
it defines a new indicator for assessing the energy losses before PPC, as an effect of the active filtering solution.
-
The proposed solution consisting of a three-phase four-wire SAPF with split-capacitor and the control algorithm has two major advantages:
-
it determines the achievement of the total compensation objective (distortion power, reactive power and unbalance power) and compliance with the power quality norms;
-
after the analysis made by a potential manufacturer, it can be built and sold at a lower price than the existing systems on the market.
At the same time, the system needs a CEM filter on the PCC side.
Given that the analysis performed showed that the pollutant load has a pronounced and variable unbalance, and that the power to be compensated has large and frequent variations, further developments will be focused on implementing an adaptive algorithm that takes into account these variations.

Author Contributions

Conceptualization. M.P., A.B.; Methodology. M.P., A.B., M.L.; Investigation. M.P., A.B., C.V.S.; Resources. M.L., C.V.S.; Writing—Review & Editing. M.P., A.B.; Supervision. M.P., A.B. All the authors actively participated in the conception and writing of the paper. All authors have read and agreed to the published version of the manuscript.

Funding

This research received no external funding.

Institutional Review Board Statement

Not applicable.

Informed Consent Statement

Informed consent was obtained from all subjects involved in the study.

Data Availability Statement

Not applicable.

Conflicts of Interest

The authors declare no conflict of interest.

References

  1. Dovgun, V.; Temerbaev, S.; Chernyshov, M.; Novikov, V.; Boyarskaya, N.; Gracheva, E. Distributed power quality conditioning system for three-phase four-wire low voltage networks. Energies 2020, 13, 4915. [Google Scholar] [CrossRef]
  2. Sreenivasarao, D.; Agarwal, P.; Das, B. Neutral current compensation in three-phase, four-wire systems: A review. Electr. Power Syst. Res. 2012, 86, 170–180. [Google Scholar] [CrossRef]
  3. Alonso, A.M.S.; Brandao, D.I.; Tedeschi, E.; Marafão, F.P. Distributed selective harmonic mitigation and decoupled unbalance compensation by coordinated inverters in three-phase four-wire low-voltage networks. Electr. Power Syst. Res. 2020, 186, 106407. [Google Scholar] [CrossRef]
  4. Kumar, S.R.; Surendhar, S.; Negi, A.; Raja, P. Zig Zag transformer performance analysis on harmonic reduction in distribution load. In Proceedings of the International Conference on Electrical, Control and Computer Engineering (InECCE), Kuantan, Malaysia, 21–22 June 2011; pp. 107–112. [Google Scholar] [CrossRef]
  5. Jou, H.-L.; Wu, J.-C.; Wu, K.-D.; Chiang, W.-J.; Chen, Y.-H. Analysis of zig-zag transformer applying in the three-phase four-wire distribution power system. IEEE Trans. Power Deliv. 2005, 20, 1168–1173. [Google Scholar] [CrossRef]
  6. Lumbreras, D.; Gálvez, E.; Collado, A.; Zaragoza, J. Trends in power quality, harmonic mitigation and standards for light and heavy industries: A review. Energies 2020, 13, 5792. [Google Scholar] [CrossRef]
  7. Wu, J.; Jou, H.; Hsaio, H.; Xiao, S. A new hybrid power conditioner for suppressing harmonics and neutral-line current in three-phase four-wire distribution power systems. IEEE Trans. Power Deliv. 2014, 29, 1525–1532. [Google Scholar] [CrossRef]
  8. Montero, V.; Cadaval, E.; González, G. Comparison of control strategies for shunt active power filters in three-phase four-wire systems. IEEE Trans. Power Electron. 2007, 22, 229–236. [Google Scholar] [CrossRef]
  9. Dovgun, V.; Chernyshov, M.; Temerbaev, S.; Shakurova, Z. Hybrid power quality conditioner for three-phase four-wire power systems. Proc. E3S Web Conf. 2020, 178, 1–6. [Google Scholar] [CrossRef]
  10. Maciel, L.F.A.; Morales, J.L.M.; Gaona, D.C.; Pimentel, J.G.M. A study of a three-phase four-wire shunt active power filter for harmonics mitigation. In Proceedings of the 2018 IEEE International Autumn Meeting on Power, Electronics and Computing (ROPEC), Ixtapa, Mexico, 7–9 November 2018; 1–6. [Google Scholar] [CrossRef]
  11. Suresh, M.; Patnaik, S.S.; Suresh, Y.; Panda, A.K. Comparison of two compensation control strategies for shunt active power filter in three-phase four-wire system. In Proceedings of the ISGT 2011, Anaheim, CA, USA, 17–19 January 2011; pp. 1–6. [Google Scholar] [CrossRef]
  12. Salmeron, P.; Litran, S.P. A control strategy for hybrid power filter to compensate four-wires three-phase system. IEEE Trans. Power Electron. 2010, 25, 1923–1931. [Google Scholar] [CrossRef]
  13. Pittorino, L.A.; du Toit, J.A.; Enslin, J.H.R. Evaluation of converter topologies and controllers for power quality compensators under unbalanced conditions. In Proceedings of the PESC Record—IEEE Annual Power Electronics Specialists Conference, Saint Louis, MO, USA, 27 June 1997; Volume 2, pp. 1127–1133. [Google Scholar] [CrossRef]
  14. Lee, T.L.; Wang, Y.C.; Li, J.C.; Guerrero, J.M. Hybrid active filter with variable conductance for harmonic resonance suppression in industrial power systems. IEEE Trans. Ind. Electron. 2015, 62, 746–756. [Google Scholar] [CrossRef] [Green Version]
  15. Popescu, M.; Bitoleanu, A. A review of the energy efficiency improvement in DC railway systems. Energies 2019, 12, 1092. [Google Scholar] [CrossRef] [Green Version]
  16. Popescu, M.; Bitoleanu, A.; Suru, V. A DSP-based implementation of the p-q theory in active power filtering under nonideal voltage conditions. IEEE Trans. Ind. Inf. 2013, 9, 880–889. [Google Scholar] [CrossRef]
  17. Barva, A.V.; Bhavsar, P.R. Design and simulation of split-capacitor based three-phase four-wire shunt active power filter. In Proceedings of the 2017 2nd IEEE International Conference on Recent Trends in Electronics, Information & Communication Technology (RTEICT), Bangalore, India, 19–20 May 2017; pp. 1106–1110. [Google Scholar] [CrossRef]
  18. Gong, C.; Sou, W.-K.; Lam, C.-S. Design and analysis of vector proportional-integral current controller for LC-coupling hybrid active power filter with minimum DC-link voltage. IEEE Trans. Power Electron. 2021. [Google Scholar] [CrossRef]
  19. Pandove, G.; Singh, M. Robust repetitive control design for a three-phase four wire shunt active power filter. IEEE Trans. Ind. Informat. 2019, 15, 2810–2818. [Google Scholar] [CrossRef]
  20. Xiuyun, Z.; Huacai, L.; Lisheng, W.; Shoujun, B. Double PI control of DC link voltage for three-phase four-wire shunt active power filter. In Proceedings of the IEEE 2nd International Conference on Electronics and Communication Engineering (ICECE), Xi’an, China, 9–11 December 2019; pp. 261–264. [Google Scholar] [CrossRef]
  21. Bhattacharya, A.; Chakraborty, C. A shunt active power filter with enhanced performance using ANN-based predictive and adaptive controllers. IEEE Trans. Ind. Electron. 2011, 58, 421–428. [Google Scholar] [CrossRef]
  22. Benhabib, M.C.; Saadate, S. New control approach for four-wire active power filter based on the use of synchronous reference frame. Electr. Power Syst. Res. 2005, 73, 353–362. [Google Scholar] [CrossRef]
  23. Ait Chihab, A.; Ouadi, H.; Giri, F.; Ahmed-Ali, T. Adaptive non-linear control of three-phase four-wire Shunt active power filters for unbalanced and nonlinear loads. IFAC Proc. Vol. 2014, 47, 5061–5066. [Google Scholar] [CrossRef]
  24. Wang, L.; Wong, M.-C.; Lam, C.-S.; Dai, N.-Y.; Lao, K.-W.; Wong, C.-K. Non-linear adaptive hysteresis band pulse-width modulation control for hybrid active power filters to reduce switching loss. IET Power Electron. 2015, 8, 2156–2167. [Google Scholar] [CrossRef] [Green Version]
  25. Lam, C.-S.; Wong, M.-C.; Han, Y.-D. Hysteresis current control of hybrid active power filters. IET Power Electron. 2012, 5, 1175–1187. [Google Scholar] [CrossRef] [Green Version]
  26. Vahedi, H.; Sheikholeslami, A.; Bina, M.T. Review and simulation of fixed and adaptive hysteresis current control considering switching losses and high-frequency harmonics. Adv. Power Electron. 2011, 1–12. [Google Scholar] [CrossRef] [Green Version]
  27. Tan, A.; Bayındır, K.Ç.; Cuma, M.U.; Tümay, M. Multiple harmonic elimination-based feedback controller for shunt hybrid active power filter. IET Power Electron. 2017, 10, 945–956. [Google Scholar] [CrossRef]
  28. Singh, B.; Jayaprakash, P.; Kothari, D.P. New control approach for capacitor supported DSTATCOM in three-phase four wire distribution system under non-ideal supply voltage conditions based on synchronous reference frame theory. Int. J. Electr. Power Energy Syst. 2011, 33, 1109–1117. [Google Scholar] [CrossRef]
  29. Gong, C.; Sou, W.-K.; Lam, C.-S. Second-order sliding-mode current controller for LC-coupling hybrid active power filter. IEEE Trans. Ind. Electron. 2021, 68, 1883–1894. [Google Scholar] [CrossRef]
  30. Srianthumrong, S.; Akagi, H. A medium-voltage transformerless AC/DC power conversion system consisting of a diode rectifier and a shunt hybrid filter. IEEE Trans. Ind. Appl. 2003, 39, 874–882. [Google Scholar] [CrossRef]
  31. Ye, T.; Dai, N.; Lao, K.W.; Lam, C.-S.; Wong, M.-C. Low DC voltage PV generation system with power factor correction and harmonic suppression capability in a distribution network. IET Gener. Trans. Distrib. 2019, 13, 1049–1056. [Google Scholar] [CrossRef]
  32. Hamoudi, F.; Aziz Chaghi, A.; Amimeur, H.; Merabet, E.K. Sliding mode control with fixed switching frequency for four-wire shunt active filter. J. Electr. Eng. Technol. 2011, 6, 647–657. [Google Scholar] [CrossRef] [Green Version]
  33. Mansour, B.; Abselkader, B.; Said, B. Sliding mode Control using 3D-SVM for three-phase four-leg shunt active filter. Int. J. Power Electron. Drive Syst. (IJPEDS) 2013, 3, 147–154. [Google Scholar] [CrossRef]
  34. Bitoleanu, A.; Popescu, M.; Suru, V. Theoretical and experimental evaluation of the indirect current control in active filtering and regeneration systems. In Proceedings of the 2017 International Conference on Optimization of Electrical and Electronic Equipment, Brasov, Romania, 25–27 May 2017. [Google Scholar] [CrossRef]
  35. Orts-Grau, S.; Balaguer-Herrero, P.; Alfonso-Gil, J.C.; Martínez-Márquez, C.I.; Gimeno-Sales, F.J.; Seguí-Chilet, S. One-cycle zero-integral-error current control for shunt active power filters. Electronics 2020, 9, 2008. [Google Scholar] [CrossRef]
  36. Wu, D.; Che, Y.; Cheng, K.W.E. Design and performance of a shunt active power filter for three-phase four-wire system. In Proceedings of the 2009 3rd International Conference on Power Electronics Systems and Applications (PESA), Hong Kong, China, 20–22 May 2009; pp. 1–4. [Google Scholar]
  37. Chen, Y.; Meng, R.; Wang, L.; Yang, Y.; Liu, Y.; Han, X. An improved control strategy for three-phase four-wire active power filter based on vector-resonant control. In Proceedings of the 2016 IEEE 11th Conference on Industrial Electronics and Applications (ICIEA), Hefei, China, 5–7 June 2016; pp. 1440–1445. [Google Scholar] [CrossRef]
  38. Hoon, Y.; Radzi, M.A.M.; Hassan, M.K.; Mailah, N.F. Control algorithms of shunt active power filter for harmonics mitigation: A review. Energies 2017, 10, 2038. [Google Scholar] [CrossRef] [Green Version]
  39. Patjoshi, R.K.; Mahapatra, K.K. Performance comparison of direct and indirect current control techniques applied to a sliding mode based shunt active power filter. In Proceedings of the 2013 Annual IEEE India Conference (INDICON), Mumbai, India, 13–15 December 2013; pp. 1–5. [Google Scholar] [CrossRef]
  40. Popescu, M.; Bitoleanu, A.; Suru, C.V.; Linca, M.; Subtirelu, G.E. Adaptive control of DC voltage in three-phase three-wire shunt active power filters systems. Energies 2020, 13, 3147. [Google Scholar] [CrossRef]
  41. Adel, M.; Zaid, S.; Mahgoub, O. Improved active power filter performance based on an indirect current control technique. J. Power Electron. 2011, 11, 931–937. [Google Scholar] [CrossRef] [Green Version]
  42. Arseneau, R.; Baghzouz, Y.; Belanger, J.; Bowes, K.; Braun, A.; Chiaravallo, A.; Cox, M.; Crampton, S.; Emanuel, A.; Filipski, P.; et al. Practical definitions for powers in systems with nonsinusoidal waveforms and unbalanced loads: A discussion. IEEE Trans. Power Deliv. 1996, 11, 79–101. [Google Scholar] [CrossRef]
  43. Emanuel, A.E. On the definition of power factor and apparent power in unbalanced polyphase circuits with sinusoidal voltage and currents. IEEE Trans. Power Deliv. 1993, 8, 841–852. [Google Scholar] [CrossRef]
  44. Linca, M.; Suru, C.V.; Preda, C.A. indirect current control algorithm implementation for an active filtering system using constant switching frequency hysteresis controllers. In Proceedings of the 2018 International Conference on Applied and Theoretical Electricity (ICATE), Craiova, Romania, 4–6 October 2018; pp. 1–6. [Google Scholar] [CrossRef]
  45. Cîrtoaje, V.; Baiesu, A.S.; Mihalache, S.F. Two controller design procedures using closed-loop pole placement technique. J. Control Eng. Appl. Inform. 2009, 11, 34–42. [Google Scholar]
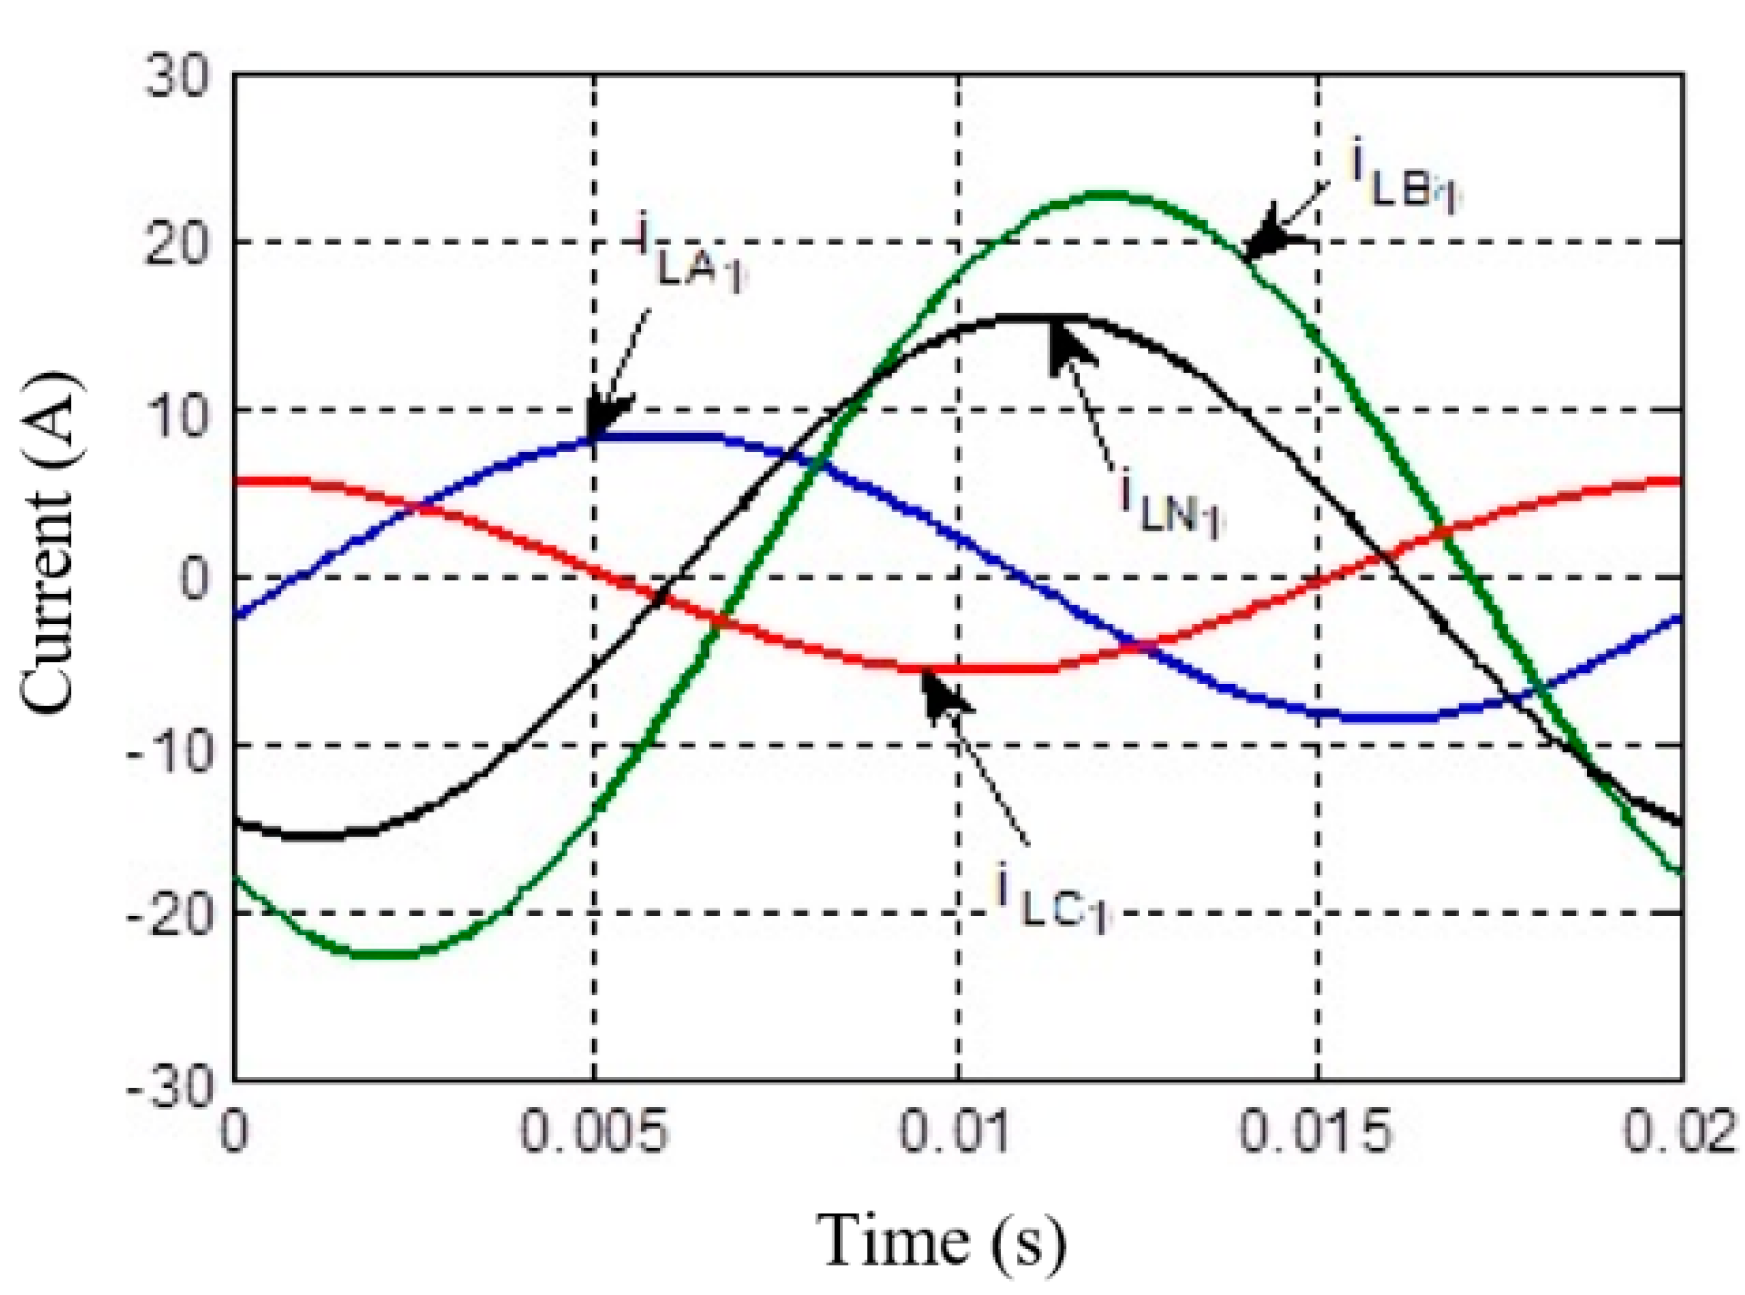
Figure 1. The fundamental components of the load phase currents in the most unfavorable case.
Energies 14 01951 g001
Figure 2. The load phase currents in the most unfavorable case.
Energies 14 01951 g002
Figure 3. The power factor for each phase: (a) during the first period (9 January 2020); (b) during the second period (10 January 2020).
Energies 14 01951 g003
Figure 4. Total current THD for each phase: (a) during the first period (9 January 2020); (b) during the second period (10 January 2020).
Energies 14 01951 g004
Figure 5. The load unbalance reflected by the neutral wire current: (a) during the first period (9 January 2020); (b) during the second period (10 January 2020).
Energies 14 01951 g005
Figure 6. The structure of the experimental setup.
Energies 14 01951 g006
Figure 7. Picture of the experimental setup.
Energies 14 01951 g007
Figure 8. The power structure of SAPF.
Energies 14 01951 g008
Figure 9. Picture of the shunt active power filter.
Energies 14 01951 g009
Figure 10. The scheme of the control algorithm implemented on the DS1103 PPC Controller Board.
Energies 14 01951 g010
Figure 11. The structure of the SAPF control.
Energies 14 01951 g011
Figure 12. The conceived graphic interface.
Energies 14 01951 g012
Figure 13. Oscillograms of voltages across the compensation capacitor (V+V– and V+N).
Energies 14 01951 g013
Figure 14. Balanced active voltages and currents (prescribed) on the load phases (provided by the graphical interface).
Energies 14 01951 g014
Figure 15. Oscillograms of currents on phases A (a) and B (b), downstream (top) and upstream (bottom) of the PCC.
Energies 14 01951 g015
Figure 16. Harmonic spectra of currents on phases A (a) and C (b): downstream of the PCC (in black); upstream of the PCC (in red).
Energies 14 01951 g016
Figure 17. Waveform, harmonic spectrum and THD of the current on phase A: downstream of the PCC (ac); upstream of the PCC (df).
Energies 14 01951 g017
Figure 18. Waveform, harmonic spectrum and THD of the current on phase B: downstream of the PCC (ac); upstream of the PCC (df).
Energies 14 01951 g018
Figure 19. Evolutions of current distortion factors on phase A (a), phase B (b) and phase C (c): downstream of PCC (in black); upstream of the PCC (in blue).
Energies 14 01951 g019
Figure 20. Oscillograms of voltages and currents on phase A (a) and phase B (b), upstream of the PCC.
Energies 14 01951 g020
Figure 21. Powers and power factors in phases upstream of the PCC, measured at three moments of time: (ac).
Energies 14 01951 g021
Figure 22. Evolution of the total power factor during recordings.
Energies 14 01951 g022
Figure 23. Evolution of load current unbalance (in black) and grid current unbalance (in blue) during recordings (%).
Energies 14 01951 g023
Figure 24. Evolution of the compensated unbalance active power during the recordings (p.u.).
Energies 14 01951 g024
Figure 25. Evolution of the compensated apparent power during the recordings (p.u.).
Energies 14 01951 g025
Figure 26. Evolution of the relative decrease of electrical losses upstream of the connection point, during the recordings (p.u.).
Energies 14 01951 g026
Table 1. The main parameters of the system.
ItemsValues
Supply TransformerConnection D/y0, 6/0.4 V, SN = 1000 kVA
SAPF transistorsIGBTs, SKM100GB12T4, VCE = 1200 V, IC = 100 A
Interface filterLfi = 4 mH
DC-capacitorCc = 1200 µF
Voltage controllerPI type, Kpu = 2; Tiu = 20 ms
Hysteresis band0.5 A
Publisher’s Note: MDPI stays neutral with regard to jurisdictional claims in published maps and institutional affiliations.