Article

Optimization and Influence of Micro-Chamfering on Oil Film Lubrication Characteristics of Slipper/Swashplate Interface within Axial Piston Pump

Harbin Institute of Technology, Harbin 150001, China
*
Author to whom correspondence should be addressed.
Energies 2021, 14(7), 1961; https://doi.org/10.3390/en14071961
Submission received: 21 February 2021 / Revised: 27 March 2021 / Accepted: 30 March 2021 / Published: 1 April 2021

Abstract

:
The overturning and eccentric abrasion of the slipper worsens the lubrication characteristics and increases the friction power loss and kinetic energy consumption of the slipper/swashplate interface to reduce the axial piston pump efficiency. A coupling lubrication numerical model and algorithm and a micro-chamfering structure are developed and proposed to predict more precisely and improve the lubrication characteristics of the slipper/swashplate interface. The simulation results reveal that the slipper without micro-chamfering overturns and contacts with the swashplate, while the one with micro-chamfering forms a certain oil film thickness to prevent this contact effectively. The minimum total power loss of the slipper/swashplate interface has to be effectively ensured under the worst working conditions, such as the high pressure, the low speed, the maximum swashplate inclination angle and the minimum house pressure. The optimal micro-chamfering width and depth are 1.2 mm and 3.5 μm or C1.2-3.5, the simulation average oil film thickness of which is approximately equal to the optimal analytical value. The experimental friction power loss of the slipper/swashplate interface is basically consistent with the simulation one, confirming the correctness and effectiveness of the coupling lubrication numerical model, and the optimization method and providing the further design direction of axial piston pumps.

1. Introduction

The function of the hydraulic pumps is to transform mechanical energy into hydraulic energy, so minimizing energy loss in the sliding interfaces is important to keep the high whole pump efficiency. Axial piston pumps are the common hydraulic ones extensively used in various engineering fields, such as aviation, automobiles, construction machinery, and energy saving machinery, etc. [1,2,3,4]. The slipper/swashplate interface is one of three key friction interfaces in axial piston pump, such as cylinder/valve plate pair, slipper/swashplate pair and cylinder/piston pair [5,6,7]. Under the alternating loads from displacement chamber and torques, the slipper is easy to overturn and even wear out eccentrically [8,9]. Pictures of the slipper eccentric abrasion are shown in Figure 1. With the high speed and high pressure development of the axial piston pumps, the loads and torques magnify to lead the slipper more prone to overturn. The slipper/swashplate interface is required to have the higher lubrication performance for the long lasting working life and reliability and simultaneously to meet the sealing function, which is a research hot of scholars at home and abroad in recent years [10,11,12,13,14].
Wieczorek and Ivantysynova [15] constructed a simulation tool CASPAR for calculating the oil film of friction interfaces in swashplate axial piston pumps. Shang and Ivantysynova [16], Schenk and Ivantysynova [17] both studied the fluid-structure-thermal interaction lubrication models of the slipper/swashplate interface. Złoto and Kowalski [18] discussed the influence of working conditions and design parameters on the slipper load. Xu et al. [19,20,21] investigated the wedge oil film formed by the overturning moment on the slipper/swashplate interface. Qun et al. [22] built the experimental platform to measure the oil film thickness in the slipper bearing. Tang et al. [23,24] researched the impact of the inner–outer diameter ratio of the sealing land and the length–diameter ratio of the fixed damping hole on the leakage, friction torque, and power loss of the slipper pair. Nie et al. [25] proposed a slipper structure with annular damping groove and studied its effect on the friction coefficient between slipper and swashplate in water pumps. Ma et al. [26] analyzed the oil film of the slipper/swashplate interface based on CFD. Chen et al. [27] investigated the influence of the slipper groove structure on the oil film lubrication performance and its optimization in aviation piston pumps. Borghi et al. [28] studied the influence of some different convex profiles on the dynamic behavior of a slipper bearing of an axial piston machine. Hooke et al. [29,30] examined the relationship between such a slipper non-flatness and the minimum film thickness of the slipper bearing under steady operating conditions in axial piston pumps. Manring et al. [31] investigated experimentally the performance characteristics of similar slipper bearings using different socket geometries based on a linear bearing deformation assumption. Sun et al. [32] researched the influence of working conditions on the oil film lubrication performance for the slipper/swashplate interface designed by the residual pressing force coefficient. Wang et al. [33] discussed the influence of micro-chamfering on the micro motion of piston/cylinder interface. Sharma and Yadav [34] studied the impact of dimple geometry on fully textured hybrid thrust pad bearing. In summary, some researches have been done to reveal the mathematical models and lubrication characteristics of the slipper/swashplate interface. Micro structures and non-flatness have been successfully introduced in the piston/cylinder interface and the thrust or slipper bearing to improve their lubrication performance. However, based on the coupling lubrication numerical model, the parameter optimization of the micro-chamfering structure, and the friction power loss measured separately in the testing platform have yet to be published focusing on the slipper/swashplate interface.
Based on the developed coupling lubrication numerical model and algorithm in this paper, the reasons of slipper overturning are analyzed and the micro-chamfering structure is proposed. Then, the oil film lubrication characteristics is profoundly researched on the slipper/swashplate interface and the structural parameters of micro-chamfering are optimized. Finally, the friction power loss of the slipper/swashplate interface is measured by experiments.

2. Lubrication Model and Coupling Algorithm

2.1. Axial Piston Pump Structure

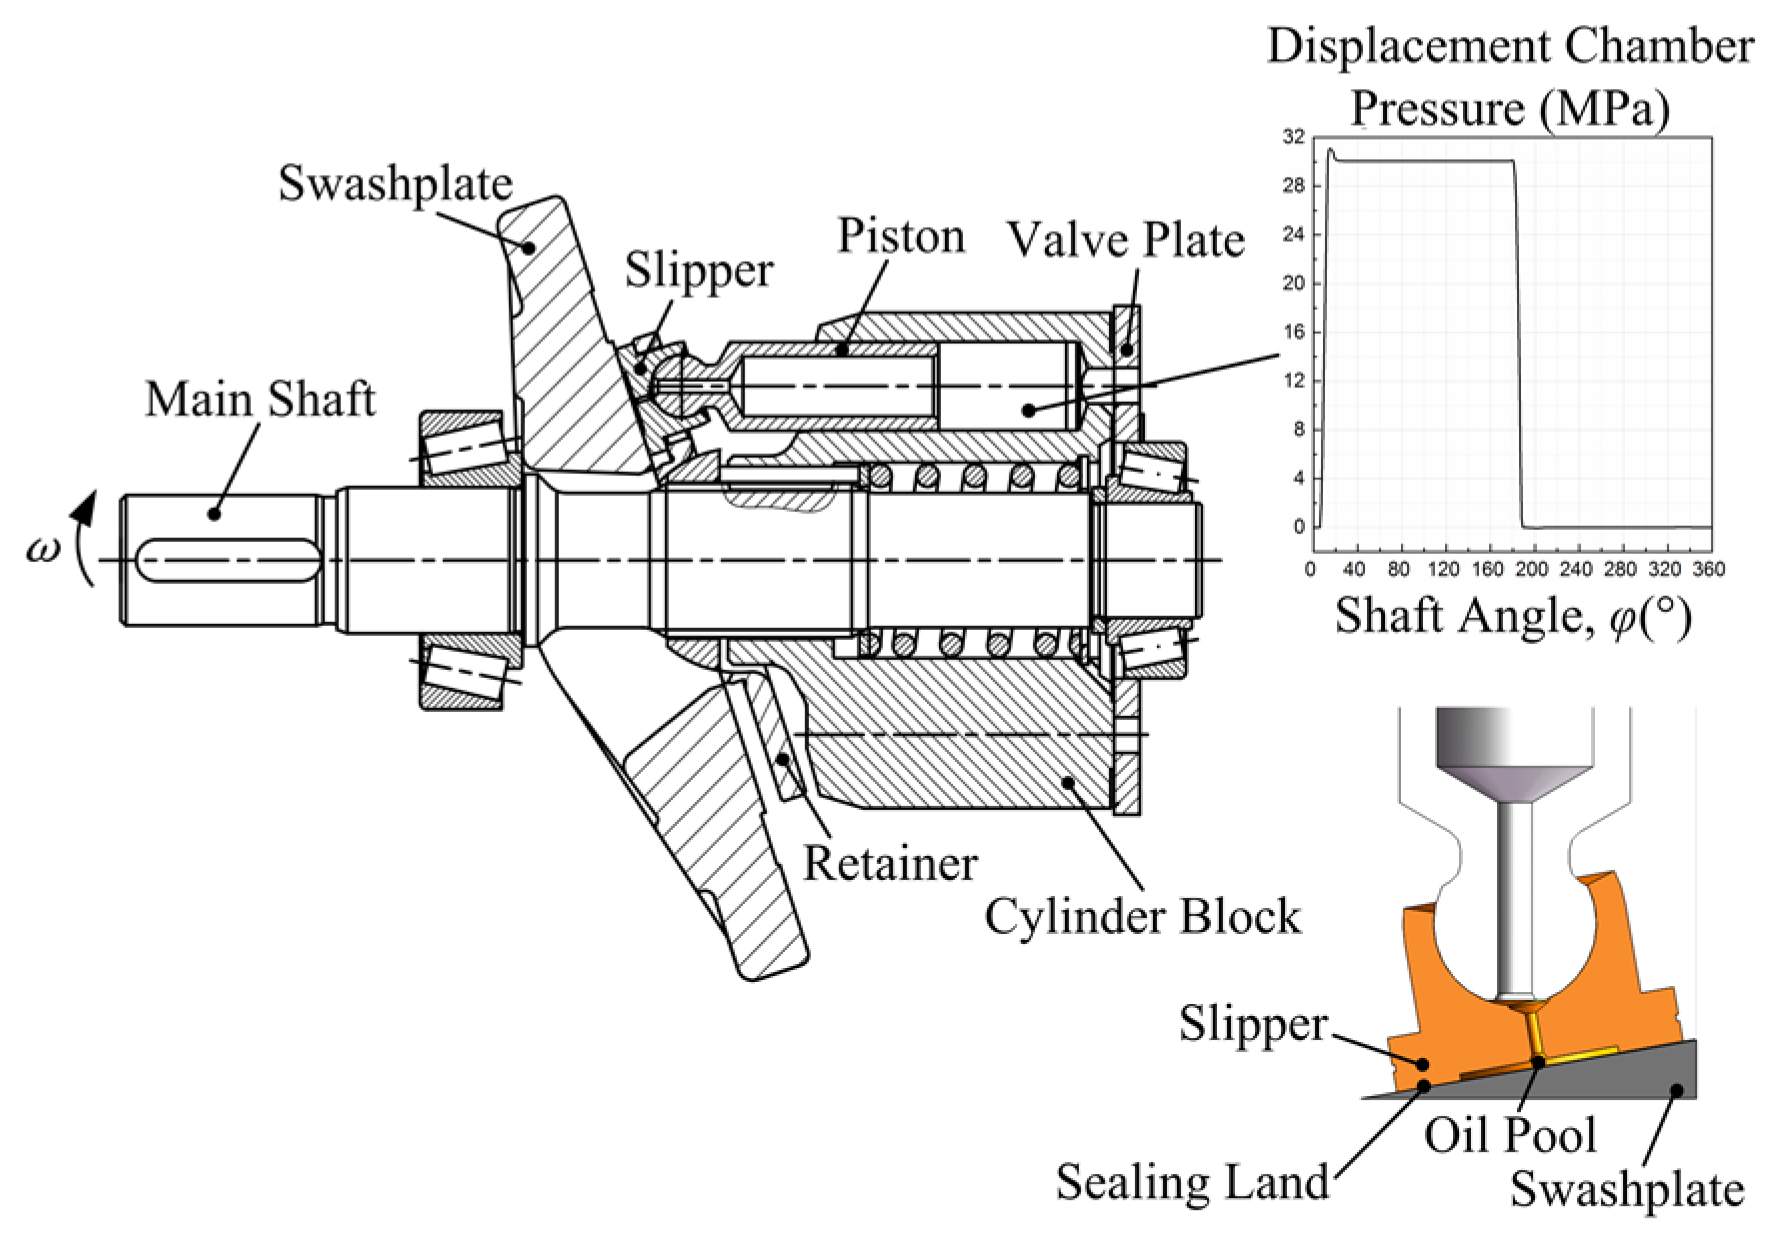
Figure 2 is the structural diagram of the axial piston pumps. The main shaft, connected with the cylinder block by a spline, is driven by a motor or an engine to bring the piston-slipper assembly a reciprocating linear motion in the displacement chamber. The high and low pressure ports are isolated by the valve plate to realize the oil suction and discharge function of the axial piston pumps. The slipper is pressed on the swashplate plane under the spring or retainer to form a plane motion low pair. The pressure load in the displacement chamber is transferred to the swashplate plane through the slipper and oil film.

2.2. Kinetic and Force Analysis of Slipper

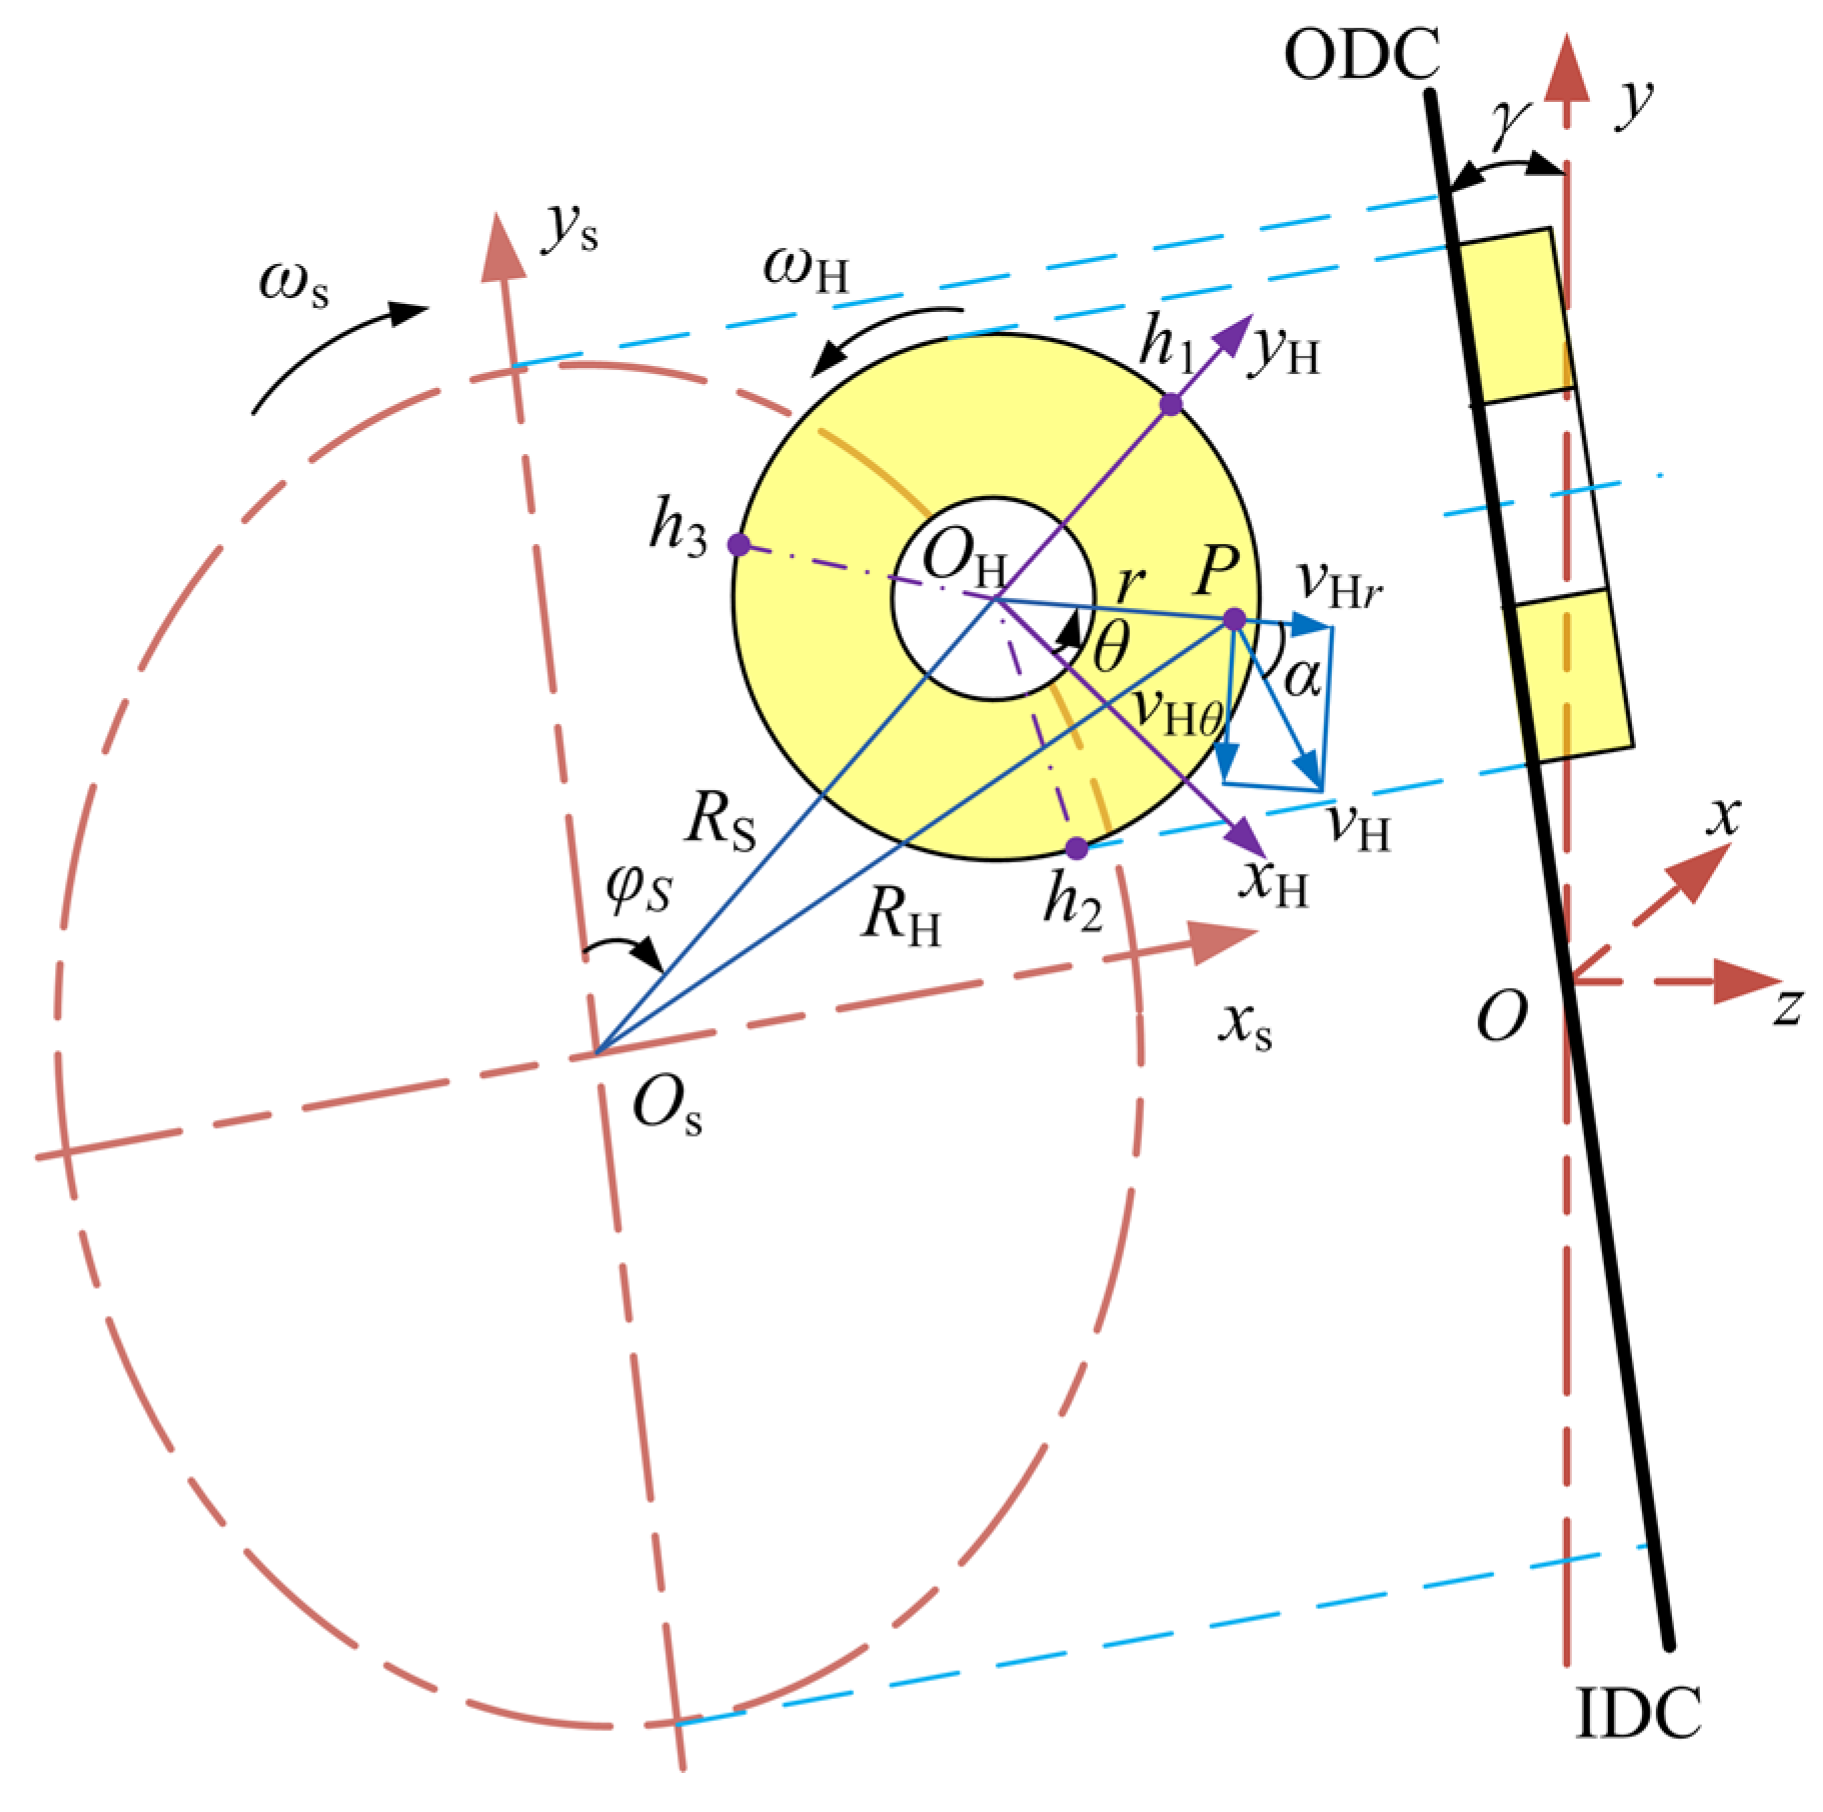
The kinetic analysis diagram of the slipper is shown in Figure 3.
The slipper, which is connected with the piston through the ball hinge, has three macro motion directions in the cylinder coordinate system Oxyz, such as the linear motion along the piston axis, the rotational motions around the main shaft and its own axis. The slipper is pressed on the swashplate plane under the spring or retainer, so the slipper motion can be transformed into the coordinate system OSxSyS located on the swashplate plane. This motion follows an elliptical trajectory, expressed as,
x S 2 R f 2 + y S 2 ( R f / c o s γ ) 2 = 1
where xS, yS are the coordinate values at any position on the elliptical trajectory; Rf is the pitch circle radius of cylinder bores; γ is the swashplate inclination angle.
According to the kinetic analysis of the slipper, the parameters on the slipper bottom or the oil film upper boundary can be expressed as,
{ R H = r 2 + R f 2 ( 1 + t a n 2 γ c o s 2 φ ) + 2 r R f 1 + t a n 2 γ c o s 2 φ s i n θ v H = R H c o s γ c o s 2 φ + c o s 2 γ s i n 2 φ ω v Hr = v H c o s α v H θ = v H s i n α r ω H
where RH is the distance between one point on the slipper bottom and the main shaft; r is the distance from that point to the slipper center; vH is the linear velocity at one point on the slipper bottom and the vectorial sum of the radial component vHr and the circumferential component vHθ; α is the angle between vH and vHr; φ is the shaft angle; ω is the shaft speed; ωH is the slipper rotational speed around its own axis, which is equal in magnitude and opposite in direction against the shaft speed.
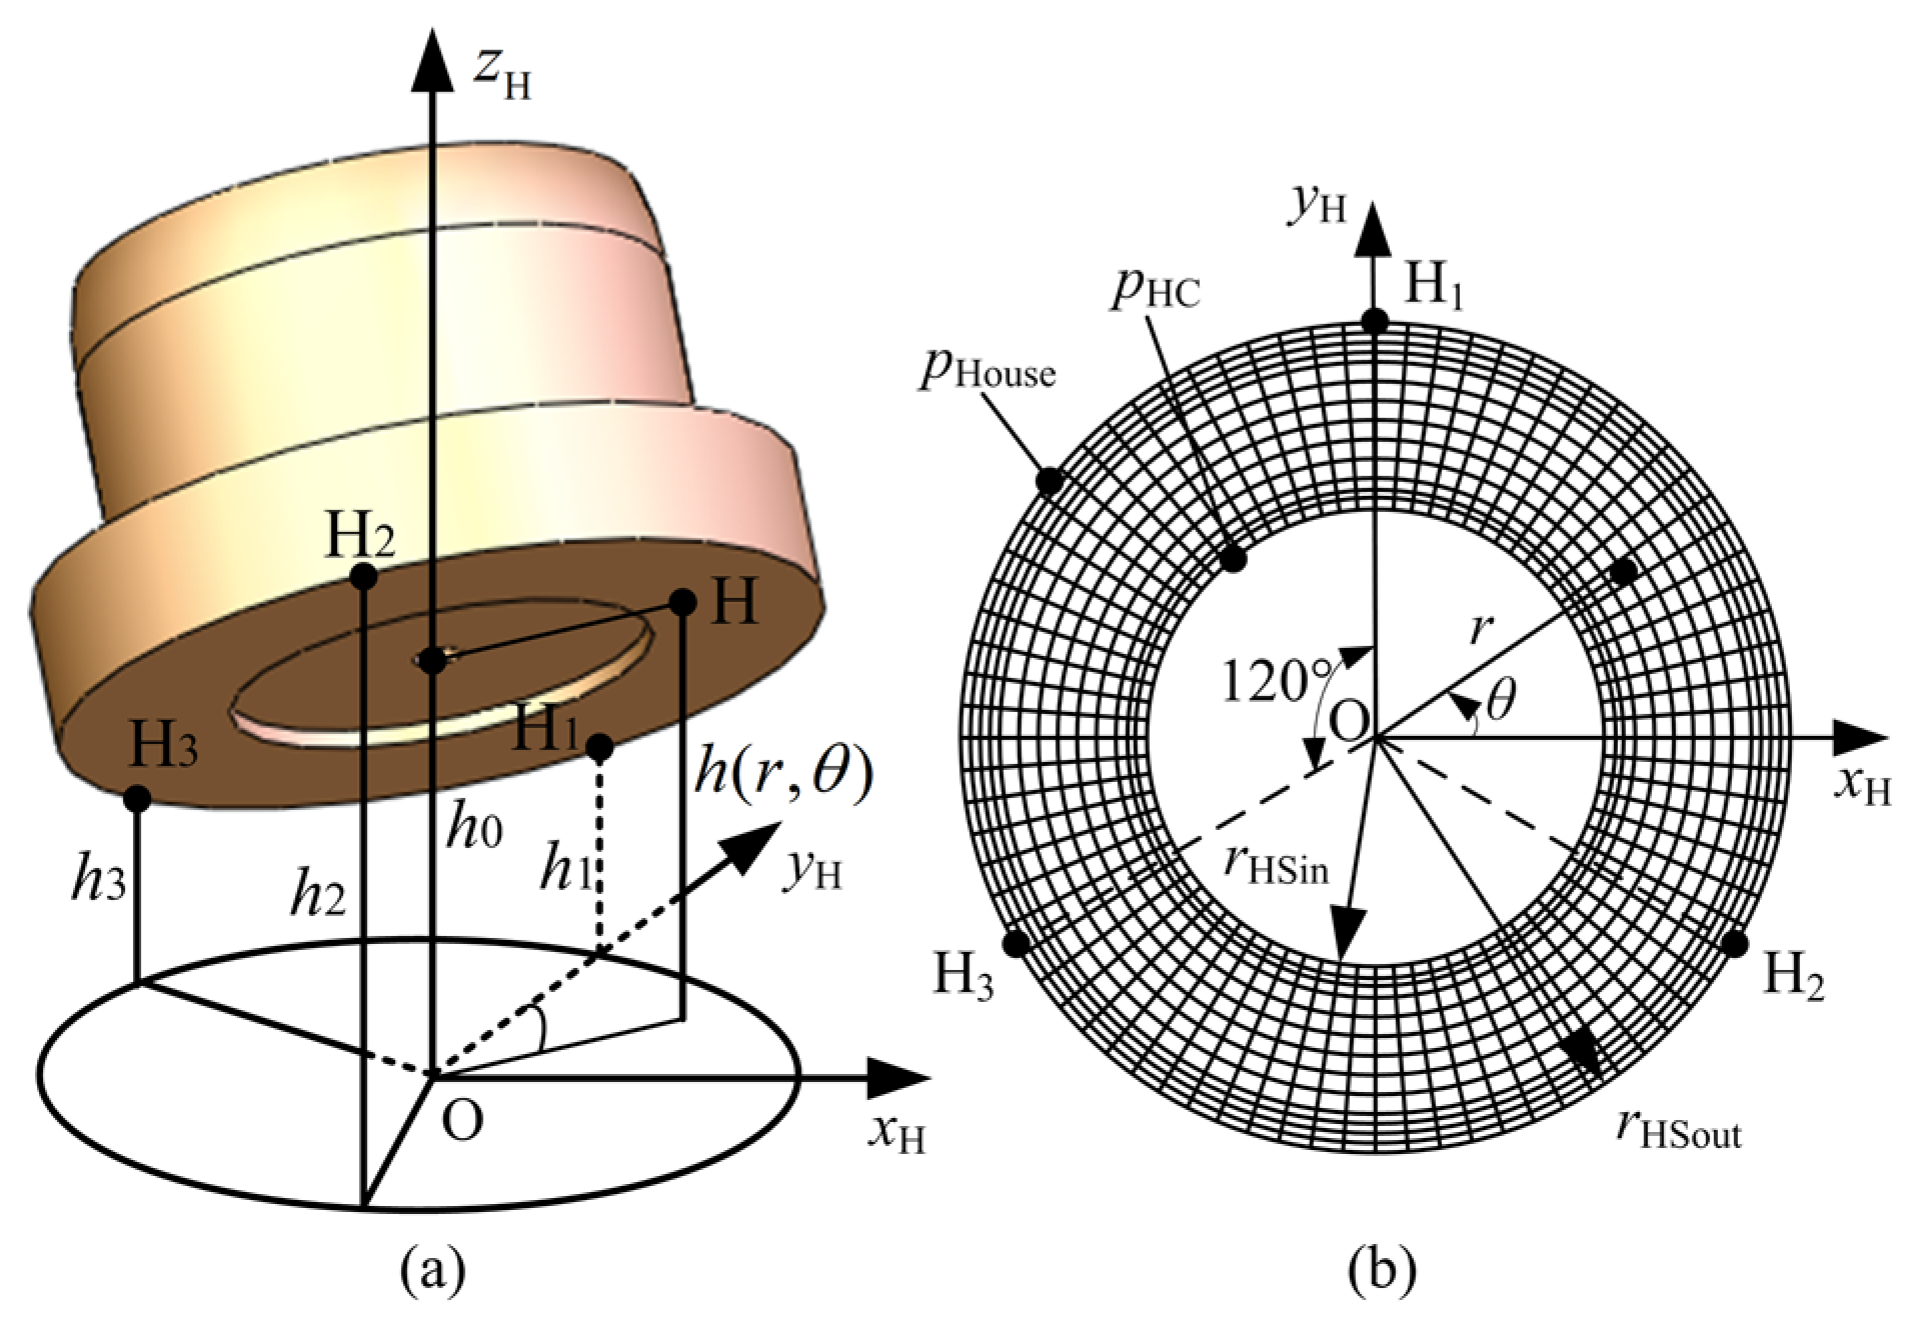
In order to keep balance between the reaction forces and the periodic external loads, the slipper has to do micro motions to modify the oil film thickness and extrusion velocity for adjusting the oil film pressure distribution. The control points definition of the micro motions of the slipper is shown in Figure 4. The three points, H1, H2, and H3, are located on the outer circumference of the slipper with an interval of 120°.
According to the constraints, the slipper has three micro motion directions, such as the translation along the slipper central axis zH, the rotations around xH and yH axes. As seen in Figure 4, the translations of three located points can be used to replace three micro motions. Based on the geometric theory, the oil film thickness at one point on the bottom of the slipper and the central one are expressed as,
h H ( r , θ ) = r s i n θ 3 r HSout ( 2 h 1 h 2 h 3 ) + r c o s θ 3 r HSout ( h 2 h 3 ) + 1 3 ( h 1 + h 2 + h 3 )
h 0 = 1 3 ( h 1 + h 2 + h 3 )
where θ is the angle between one point on the slipper bottom and xH axis; h1, h2, and h3 are the oil film thicknesses at three located points, respectively; h0 is the central oil film thickness; rHSout is the radius of the outer circumference of the slipper.
By deriving Equations (3) and (4) from time, the micro motion velocity at the point on the slipper bottom and the central one are expressed as,
h H ( r , θ ) t = r s i n θ 3 r HSout ( 2 d h 1 d t d h 2 d t d h 3 d t ) + r c o s θ 3   r HSout ( d h 2 d t d h 3 d t ) + 1 3 ( d h 1 d t + d h 2 d t + d h 3 d t )
h 0 t = 1 3 ( d h 1 d t + d h 2 d t + d h 3 d t )
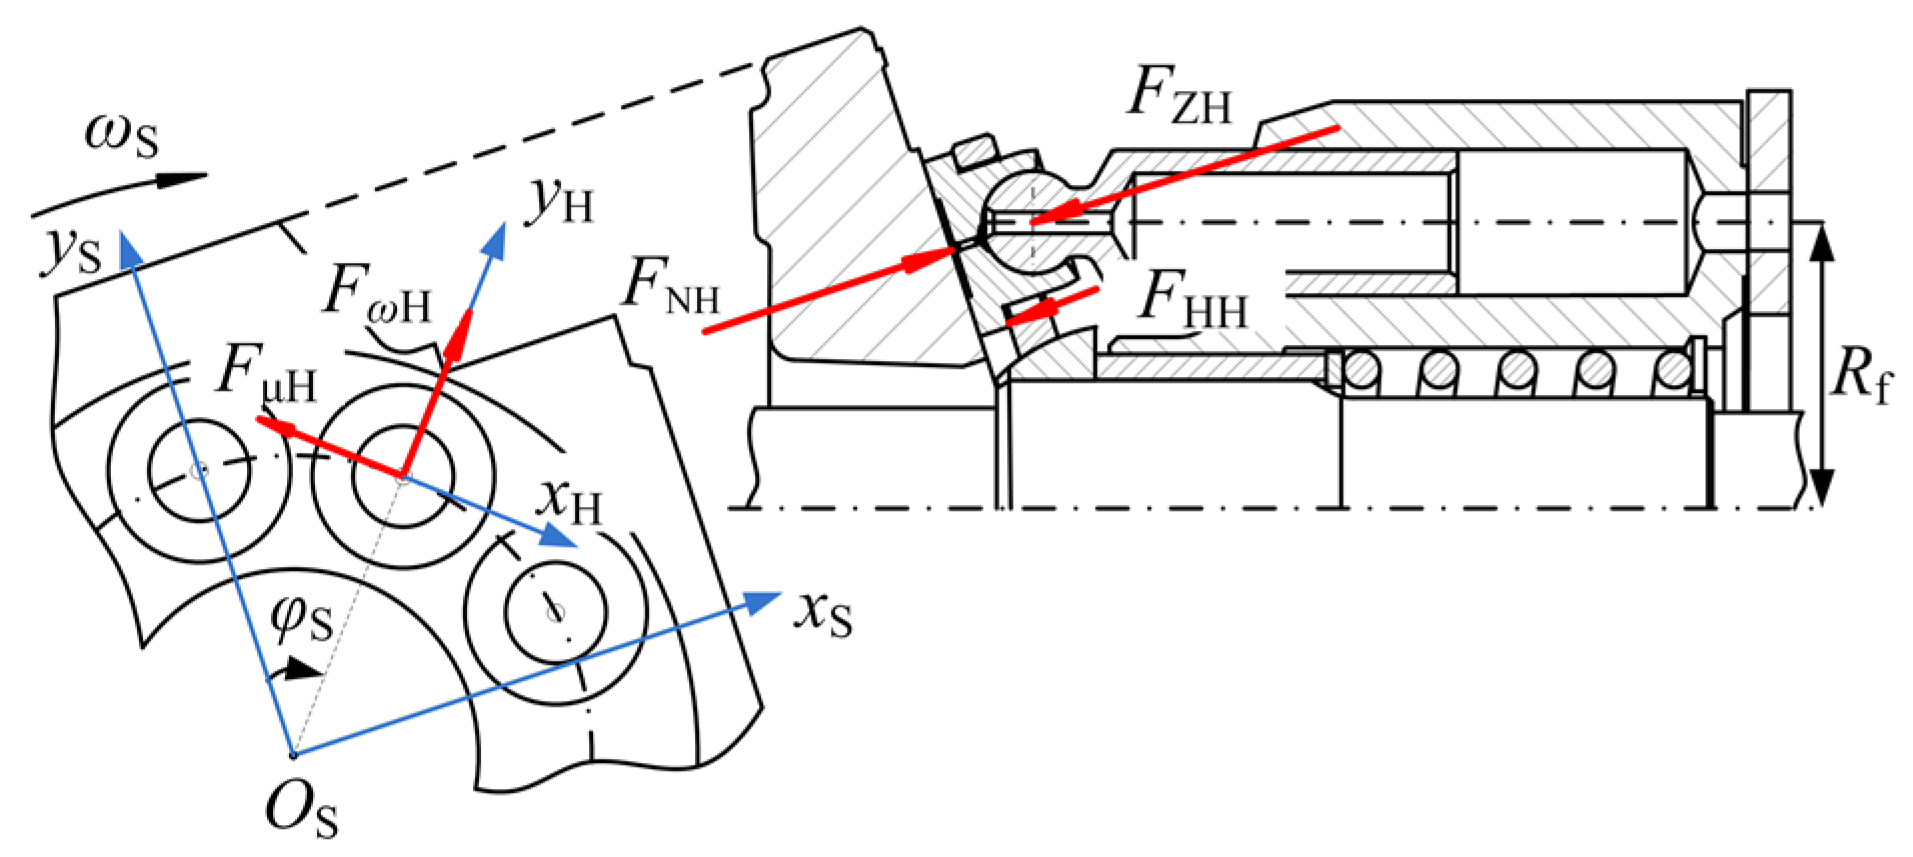
The force analysis of the slipper is shown in Figure 5.
There are five forces and three torques acted on the slipper, such as the pressing force from the piston, the spring or retainer force, the centrifugal force and torque, the friction force and torque, the reaction force and torque. The pressing force from the piston is the main slipper load, which is the resultant force of the displacement chamber pressure, the friction between the cylinder and piston bore and the inertial force of the slipper/piston assembly. Because this force is considered to act through the center of the slipper, a torque about the slipper ball hinge is not produced. The force balance equations of the slipper are written as,
{ F NH F ZH F HH = 0 M p H x H + M ω H = 0 M p H y H + M μ H = 0
where MpHxH and MpHyH are the torques from the reaction force about xH and yH axes, respectively; MωH is the centrifugal torque; MμH is the friction torque.
Because the micro motion of the slipper is regarded to be instantaneous compared with the main shaft speed, the micro motion velocity is not visually shown in the balance equations. However, this velocity determines the oil film extrusion velocity, which generates the extrusion effect to adjust the oil film pressure distribution for a new force balance of the slipper.

2.3. Pressure and Power Loss Models

According to the characteristics of the oil film lubrication of the slipper/swashplate interface, the assumptions are made in the oil film fluid, as follows:
(1)
The fluid in the oil film is the incompressible and Newtonian one;
(2)
The fluid velocity on the boundary is the same as the velocity of the working surface;
(3)
Because the oil film thickness is micron level, the fluid flow can be considered to be the laminar one.
The Reynolds equation of the oil film of the slipper/swashplate interface can be deduced in cylindrical coordinate system, as follows,
1 12 r [ r ( r h 3 μ p r ) + θ ( h 3 μ r p θ ) ] + h 2 v Hr r + v Hr 2 ( h r h r ) + h 2 r v H θ θ v H θ 2 r h θ + h t = 0
where h is the oil film thickness; p is the oil film pressure; μ is the oil dynamic viscosity.
Through the finite volume method, Equation (8) can be solved to get the oil film pressure distribution. The mesh and the pressure boundary conditions are shown in Figure 4b. The mesh density is increased near the inner and outer boundary to capture more precisely the pressure information in the solution process.
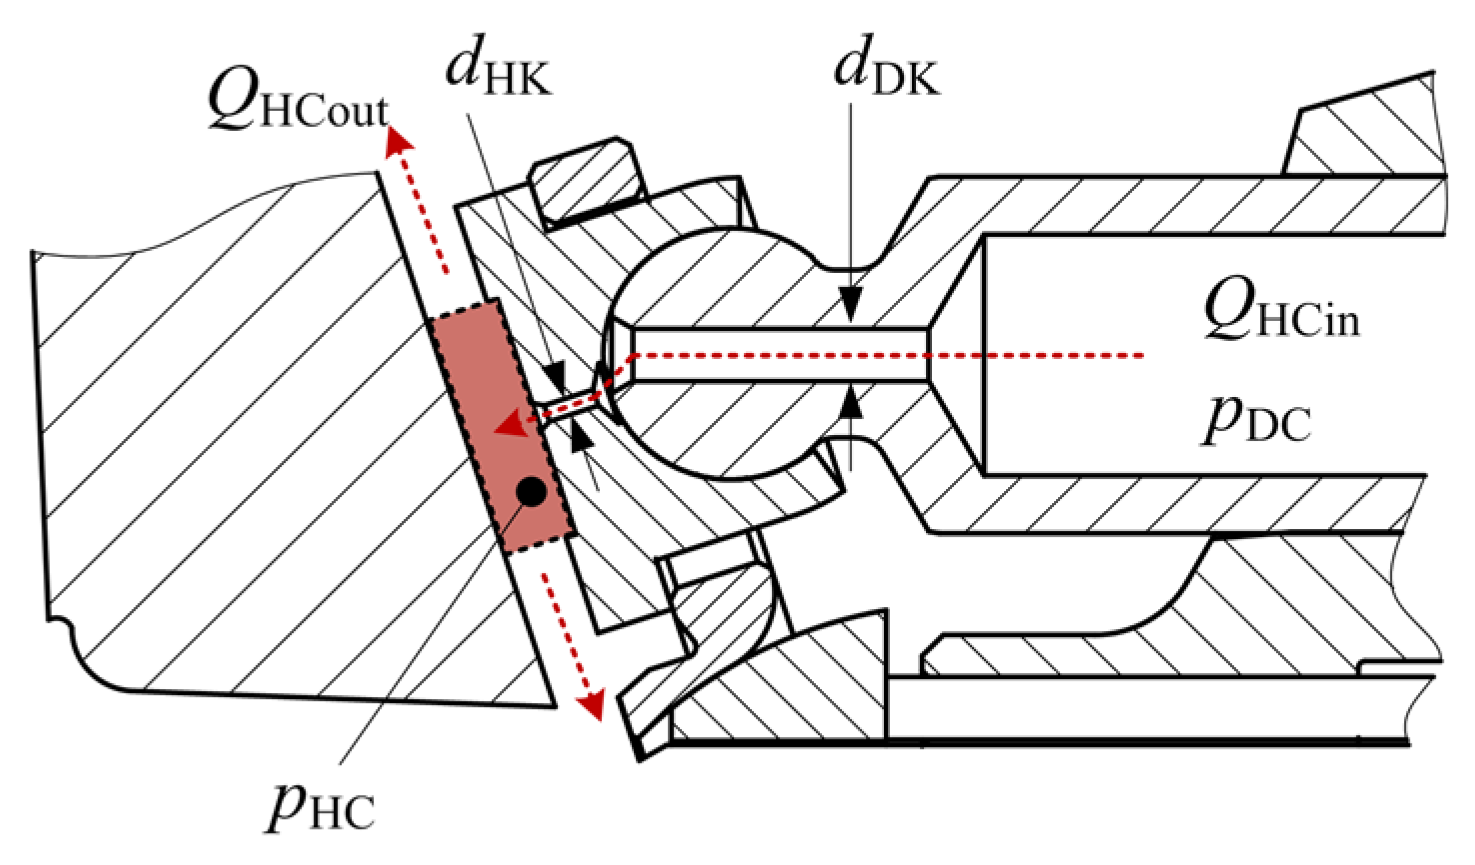
Figure 6 is the control volume diagram of the central oil pool, whose pressure is the boundary condition for solving Equation (8) or Reynolds equation.
Because the depth of the oil pool is always 0.7–1.0 mm, the pressure distribution can be regarded as uniform or the same at the whole pool. Based on the flow continuity theory and the fluid compressibility, its pressure built equation is expressed as,
d p HC d t = K π r HSin 2 l HC ( Q HCin Q HCout π r HSin 2 d h 0 d t )
where pHC is the central oil pool pressure; K is the bulk elastic modulus of the hydraulic fluid; rHSin and lHC are the radius and depth of the central oil pool, respectively; QHCin is the flow through the fixed orifice in the slipper; QHCout is the flow through the gap between the slipper and swashplate.
The ratio of length to diameter of the fixed orifice is always less than 100. The fluid flow can be considered as the laminar one, which is expressed as,
Q HCin = 1 C q π d HK 4 128 μ l HK ( p DC p HC )
where Cq is the flow coefficient; dHK and lHK are the length and diameter of the fixed orifice, respectively; pDC is the displacement chamber pressure.
The flow through the gap between the slipper and swashplate can be solved by integrating the radial fluid velocity in the oil film along the thickness and circumferential directions. This flow is also named as the leakage of the slipper/swashplate interface, which is expressed as,
Q HCout = 0 2 π 0 h v r r d z d θ = 0 2 π [ h 3 12 μ p r + h 2 v Hr ] r HSout d θ
where the first term is the flow caused by the pressure difference between the central oil pool and the pump house; the second term is the flow caused by the fluid shearing movement in the oil film.
The power loss includes the leakage and friction one between the slipper and swashplate. If the oil film lubrication cannot be generated between the slipper and swashplate, the metal friction causes the friction power loss to greatly increase and reduces the mechanical efficiency of the whole pump. However, the oil film lubrication can be effectively formed to decrease the friction power loss to improve the mechanical efficiency. Based on the Newton internal friction law, by integrating the viscous friction stress along the radial and circumferential directions of the slipper, the viscous friction power loss is expressed as,
P F = 0 2 π r HSin r HSout ( ( h 2 p r + μ v H r h ) v H r + ( h 2 p r θ + μ v H θ h ) v H θ ) r d r d θ
According to Equation (11), the leakage and total power loss are written as,
P Q = Q HCout ( p HC p House ) = 0 2 π [ h 3 12 μ p r + h 2 v Hr ] r HSout d θ ( p HC p House )
P T = P F + P Q = 0 2 π r HSin r HSout ( ( h 2 p r + μ v H r h ) v H r + ( h 2 p r θ + μ v H θ h ) v H θ ) r d r d θ + 0 2 π [ h 3 12 μ p r + h 2 v Hr ] r HSout d θ ( p HC p House )
where pHouse is the pump house pressure; rHSout is the radius of the sealing land of the slipper.

2.4. Coupling Algorithm

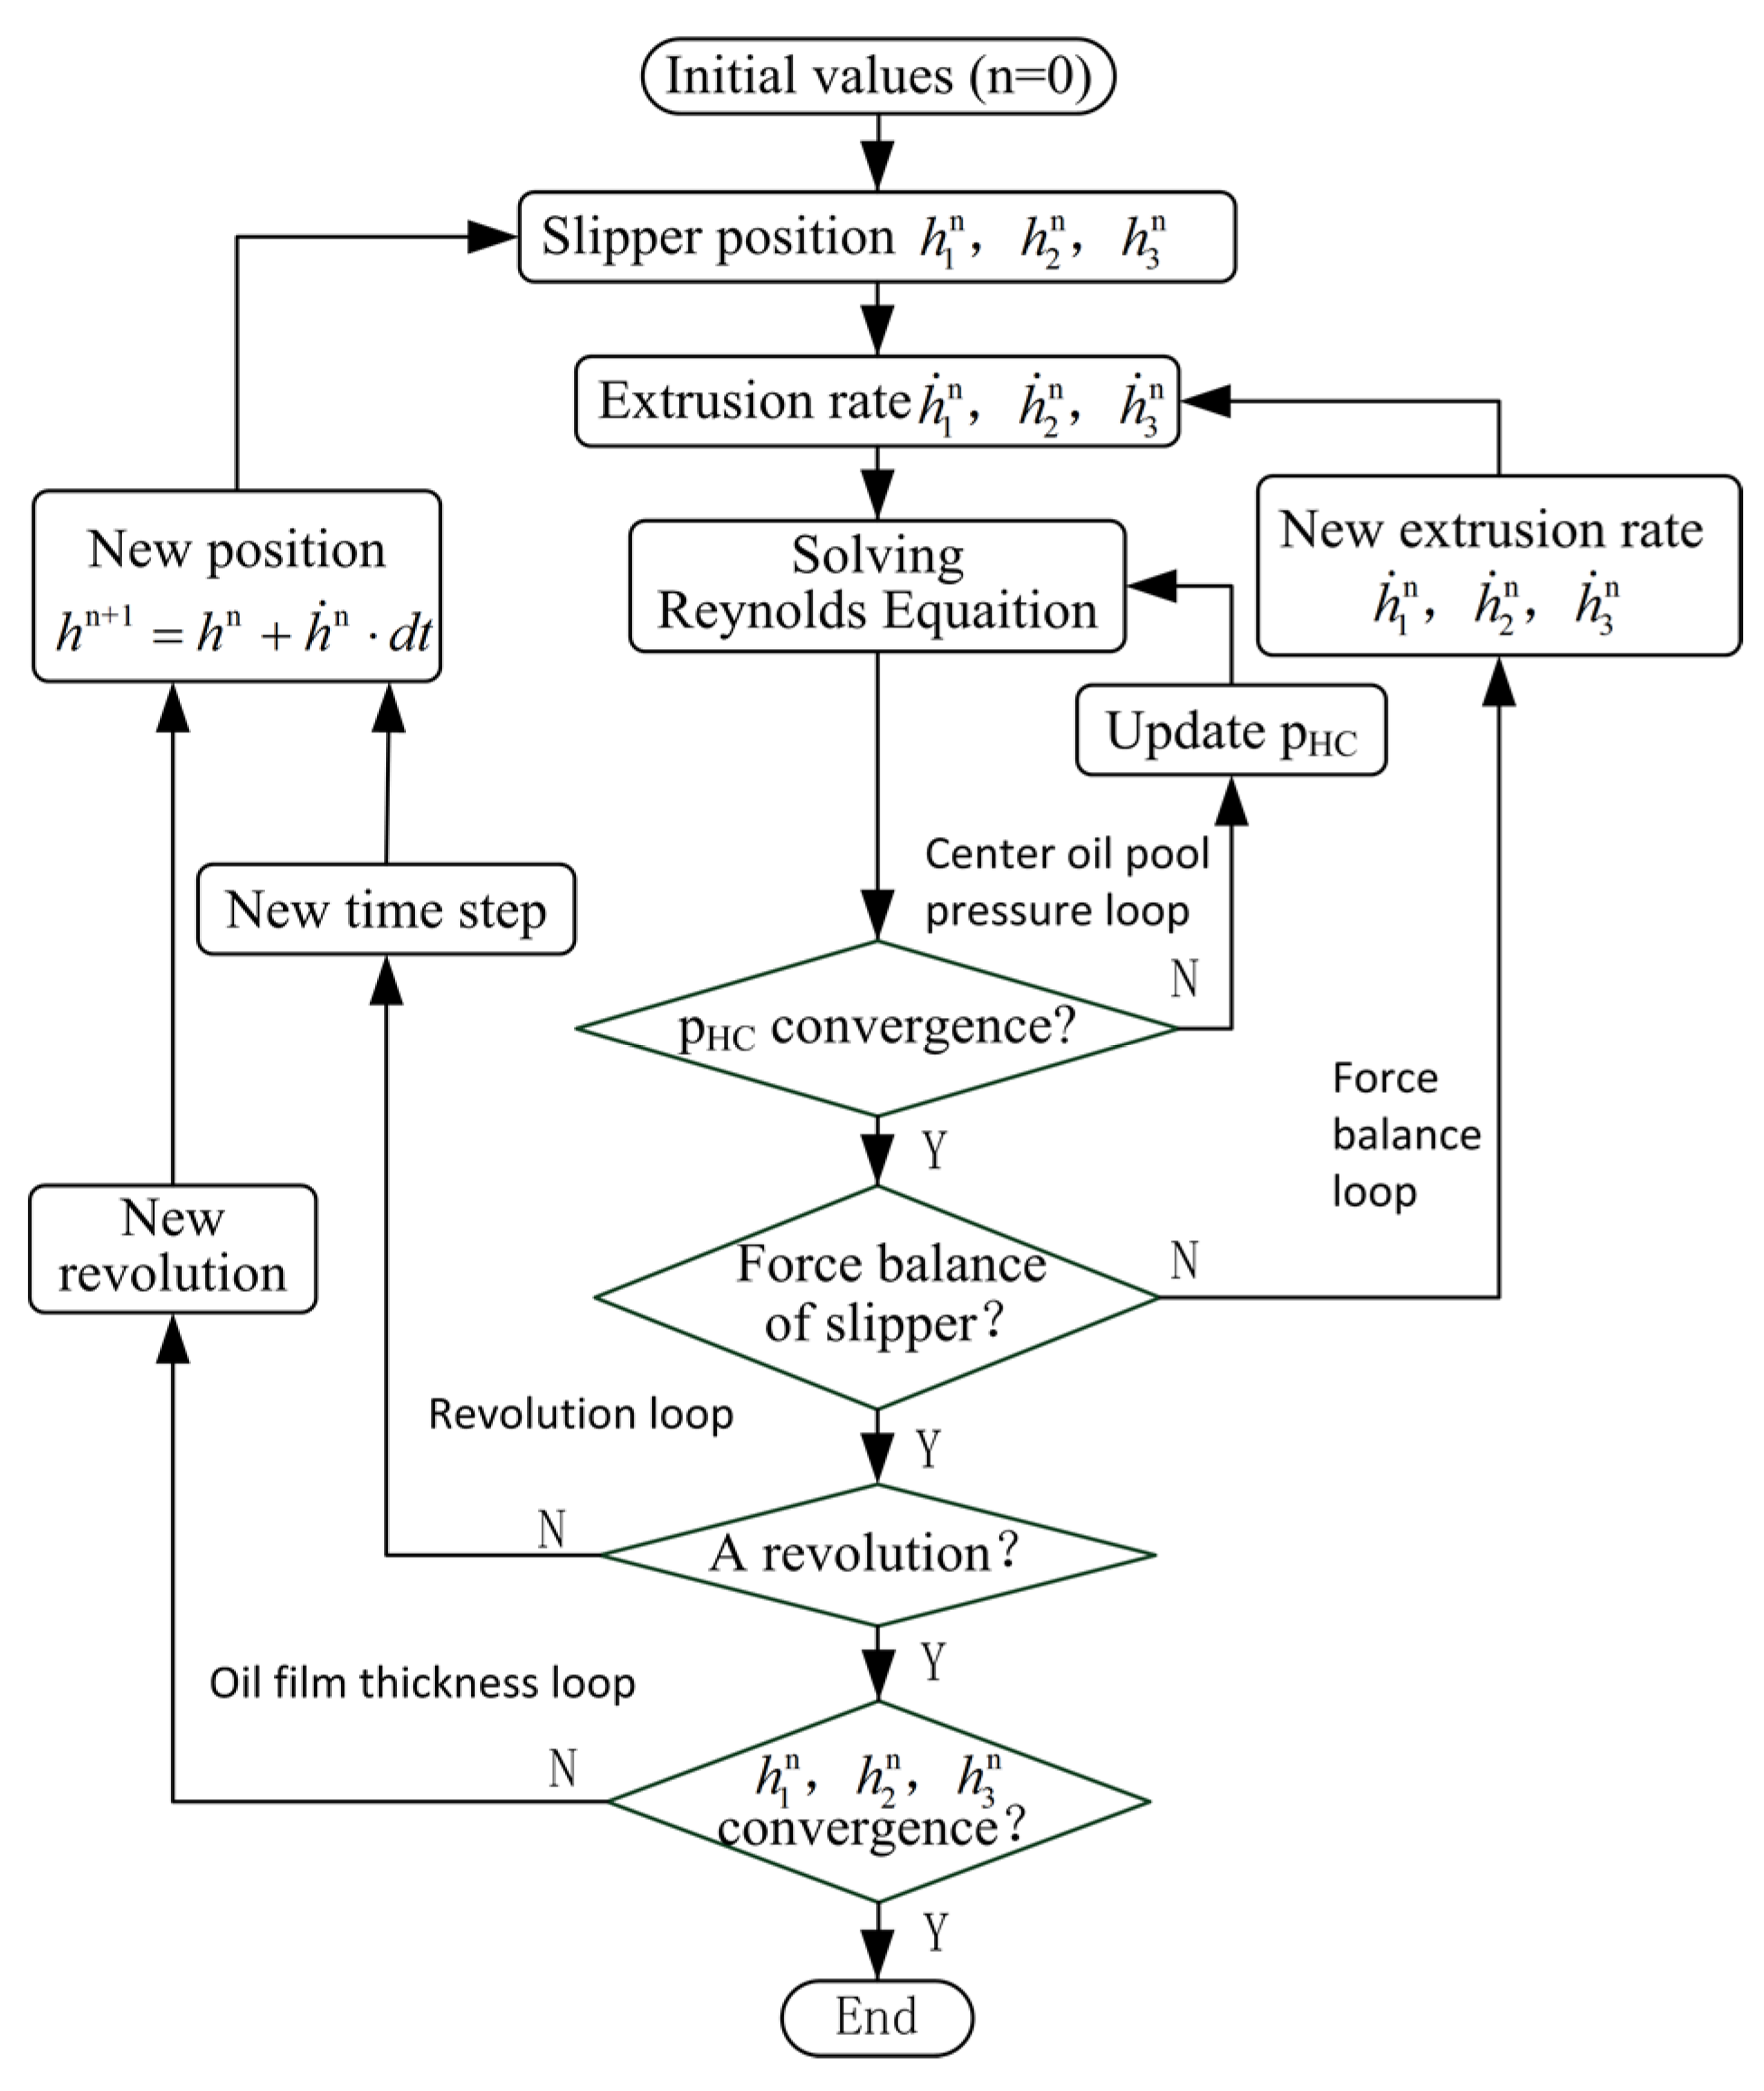
The coupling algorithm block diagram of lubrication model is shown in Figure 7. There is a strong coupling relationship among dynamic balance, oil film pressure distribution, central oil pool pressure, and micro motions. This algorithm is realized using C++ and OpenFOAM tools, where Reynolds equation is solved by the finite volume method; force balance of slipper is computed by the Newton’s method and central oil pool pressure is calculated by the relaxation factor and iterative method.
As seen in Figure 7, the innermost calculating loop firstly works out the central oil pool pressure. Then the program enters the force balance loop to calculate the micro motion velocity by the Newton iteration method. When the time step adds step by step, it arrives in the revolution loop. Finally, all the oil film thickness difference of every revolution are checked to satisfy the convergence error requirements of 1 × 10⁻⁸ m and the program ends.

3. Impact of Micro-Chamfering on Oil Film Lubrication

The slipper structure diagram is shown in Figure 8. The micro-chamfering width and depth are expressed by LC and HC, respectively. The oil film thickness with micro-chamfering is written as,
h H ( r , θ ) = { r s i n θ 3   r HSout ( 2 h 1 h 2 h 3 ) + r c o s θ 3   r HSout ( h 2 h 3 ) + 1 3 ( h 1 + h 2 + h 3 ) + L C h C [ r ( r HSout L C ) ] , r HSout L C r r HSout r s i n θ 3   r HSout ( 2 h 1 h 2 h 3 ) + r c o s θ 3   r HSout ( h 2 h 3 ) + 1 3 ( h 1 + h 2 + h 3 ) , r < r HSout L C
Table 1 shows the parameters used in the lubrication numerical model from the real pump A10VOS45.
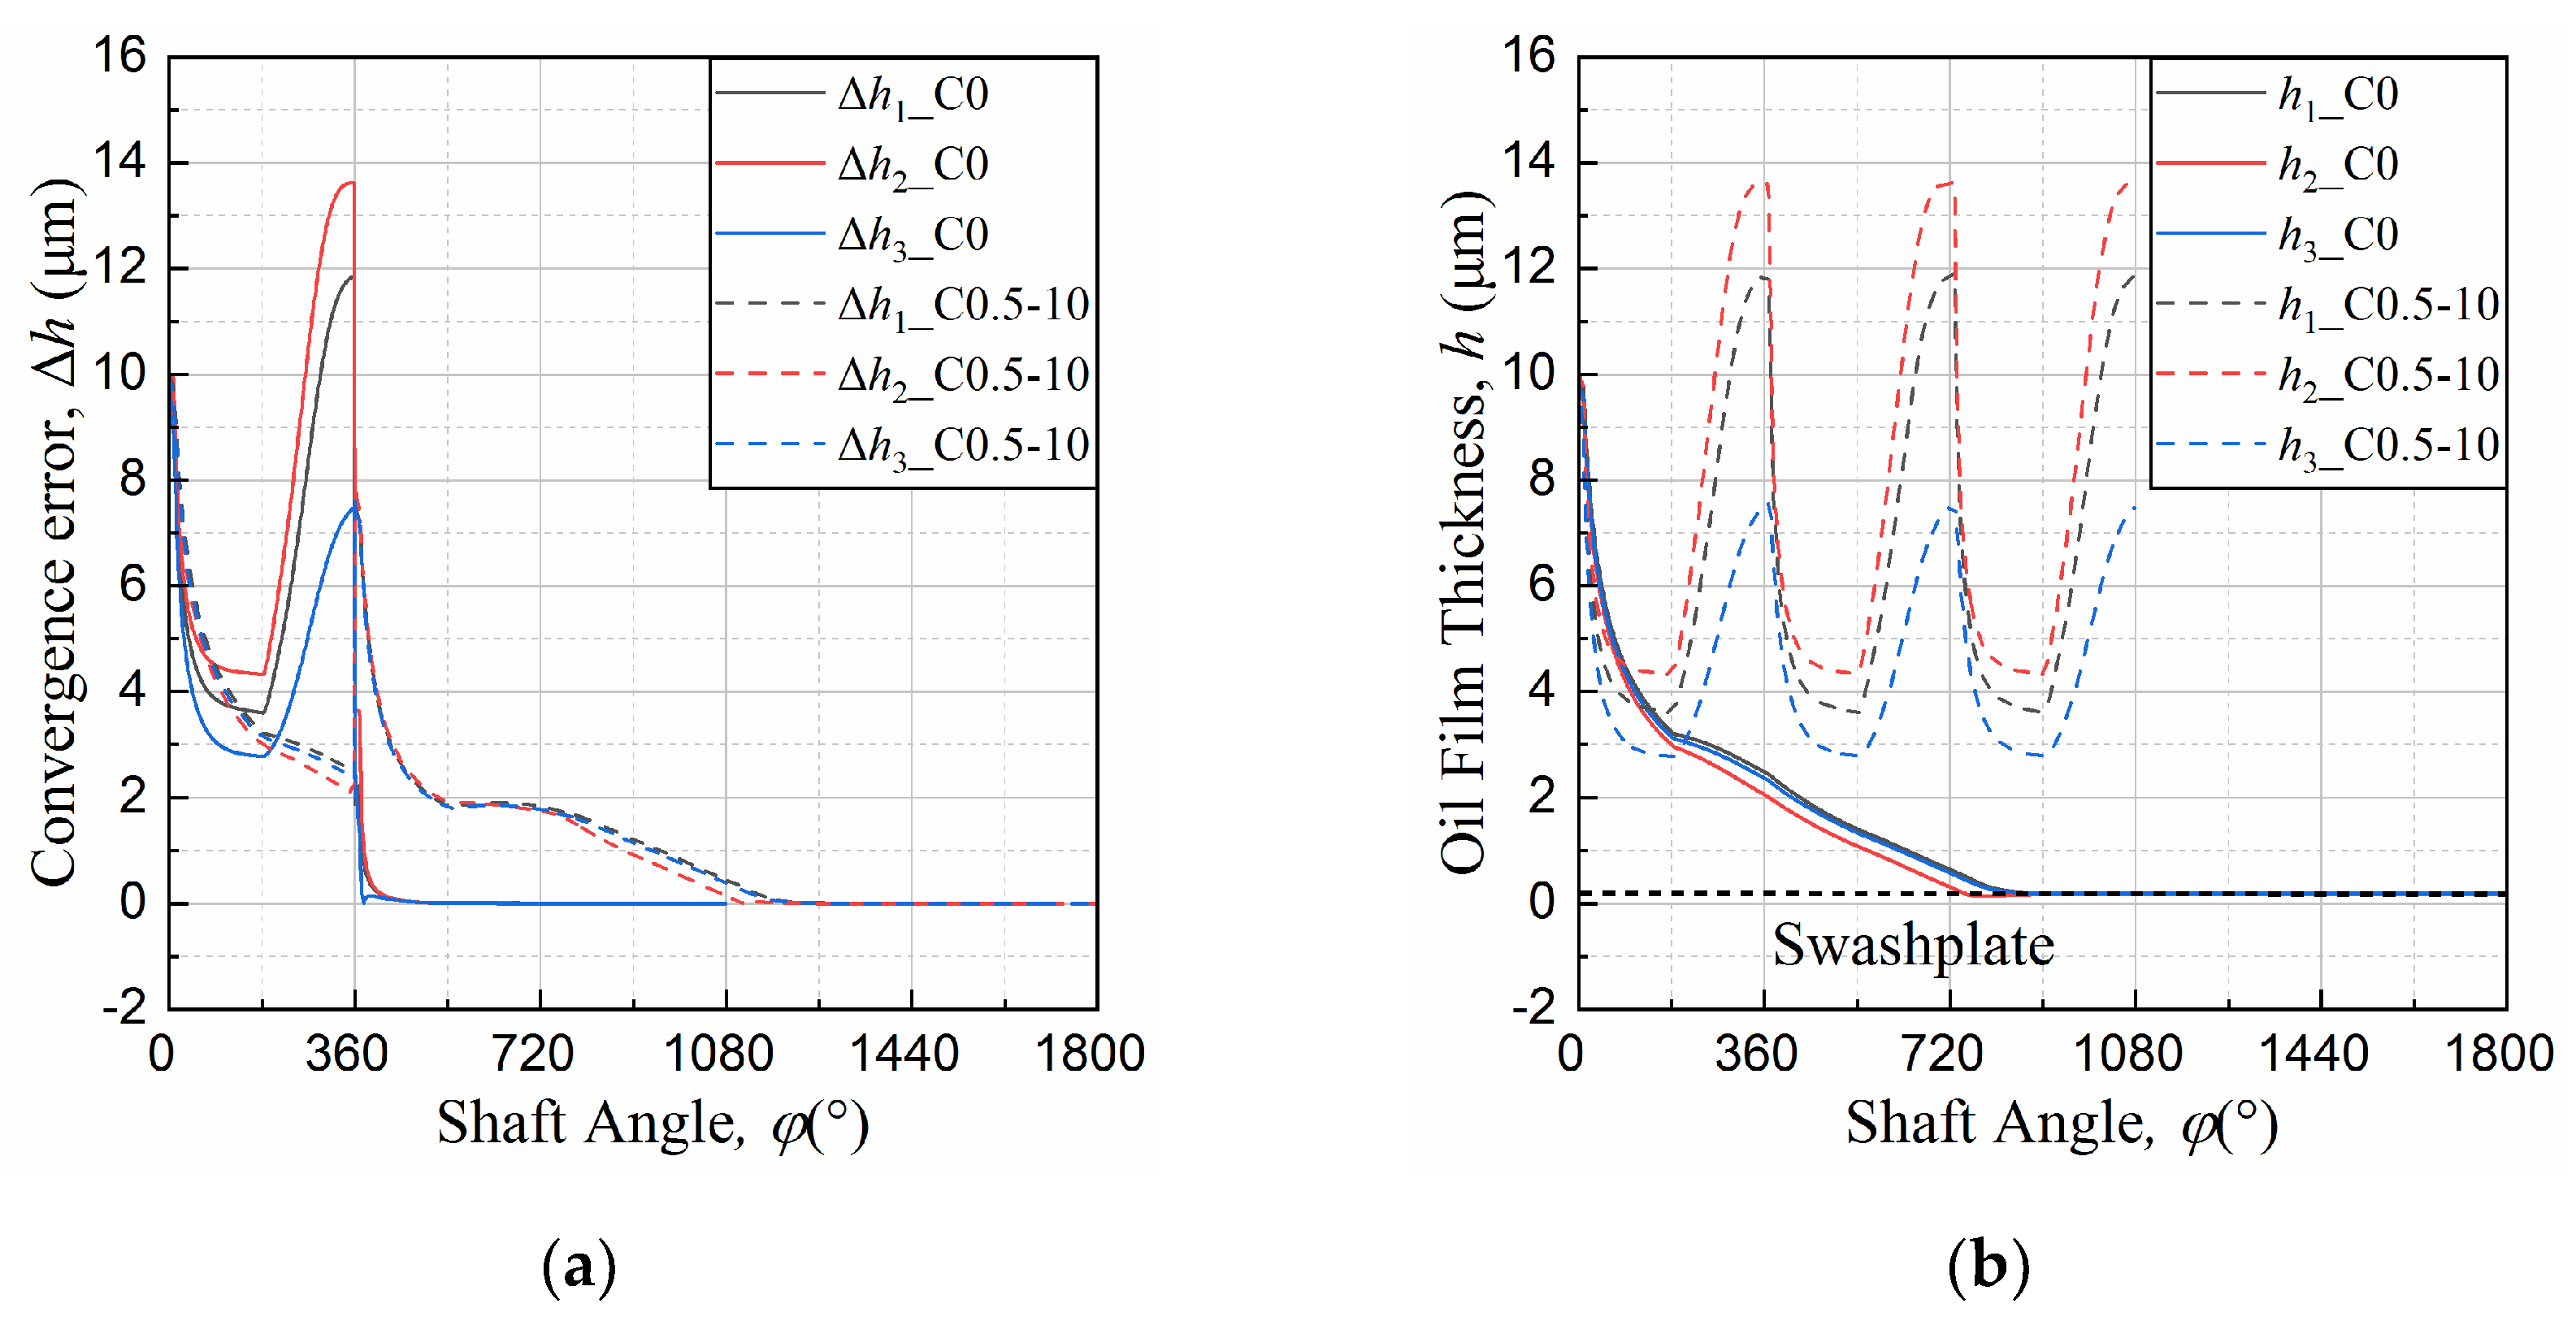
The convergence process of the oil film thickness of the slipper/swashplate interface is shown in Figure 9, where C0 is the slipper without micro-chamfering and C0.5-10 is the one with micro-chamfering of 0.5 mm width and 10 μm depth.
As seen in the solid lines of Figure 9, the oil film thickness of C0 achieves the convergence requirements after five calculation cycles, and finally the slipper is in contact with the swashplate. The reason for this is that the direction of the wedge-shaped oil film generated by the slipper forward tilt movement (h2_C0 < h1_C0 and h3_C0) is opposite to the one of the generating dynamic pressure requirements. However, as seen in the dotted lines of Figure 9, the convergent oil film thickness indicates that the slipper tilts backward, h3_C0.5-10 < h1_C0.5-10 and h2_C0.5-10, and that the wedge-shaped oil film meets the requirement of the dynamic pressure effect. Therefore, the micro-chamfering structure makes the slipper/swashplate interface generate the stable oil film.
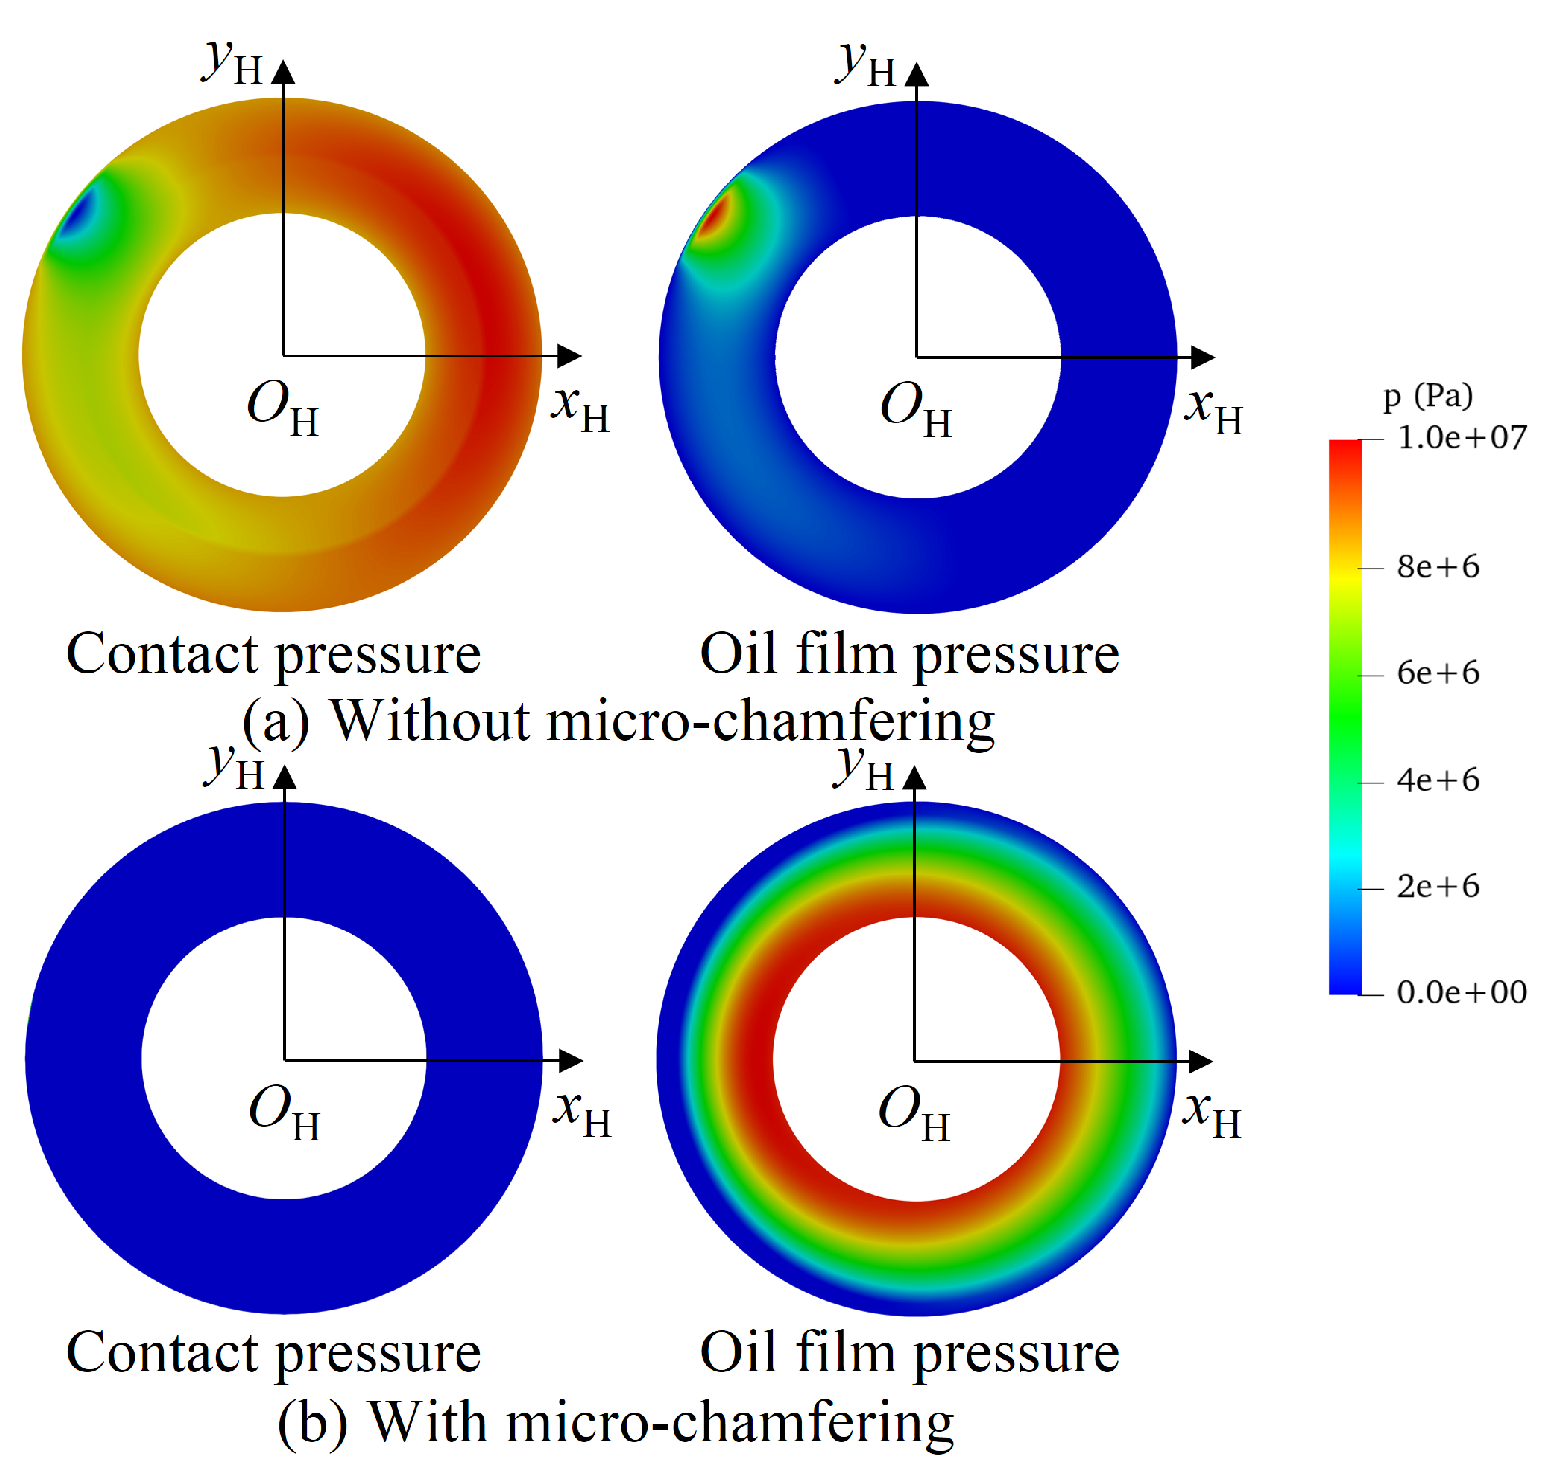
The pressure distribution of the slipper bottom at the main shaft angle of 90° in the oil discharge area is seen in Figure 10. It can be seen in Figure 10 that the slipper without micro-chamfering generates the huge contact pressure. However, the slipper with micro-chamfering is not in touch with the swashplate and forms the stable oil film pressure distribution. From Figure 9 and Figure 10, micro-chamfering is beneficial to form the oil film and to prevent the slipper in contact with the swashplate. It is necessary to optimize its width and depth to acquire the optimal oil film lubrication performance.

4. Optimization of Micro-Chamfering Parameters

According to the above analysis, micro-chamfering is helpful to improve the oil film lubrication performance of the slipper/swashplate interface. It is very necessary to optimize micro-chamfering parameters to obtain the best lubrication performance. Optimization working conditions and objective are firstly analyzed. Then the micro-chamfering parameters is optimized. Finally, the lubrication performance of the slipper/swashplate interface with the optimal micro-chamfering is analyzed.

4.1. Working Conditons Selected of Optimization

Working conditions including shaft speed, working pressure, swashplate inclination and pump house pressure play a decisive role in the lubrication performance of the slipper/swashplate interface. The central oil film thickness of the slipper/swashplate interface under the different working pressure and shaft speed is shown in Figure 11.
As seen in Figure 11, the central oil film thickness of the oil discharge area (0°–180°) is less than that of the oil suction area (180°–360°). The reason for this is that the displacement chamber pressure in the discharge area is more than that in the suction area. It is found in Figure 11a that the oil film thickness decreases with the increase in the working pressure. Because it enhances the slipper load. Figure 11b illustrates that the oil film thickness increases with the increase in the shaft speed. The greater the shaft speed is, the stronger the dynamic pressure effect is.
Figure 12 shows the central oil film thickness under the different swashplate inclination angle and pump house pressure.
As seen in Figure 12a, the oil film thickness decreases with the increase in the swashplate inclination angle. The variation in the discharge area is more obvious than that in the suction area. Because the swashplate inclination angle is a positive correlation with the slipper load which in the discharge area is more than that in the suction area. Figure 12b illustrates that the oil film thickness slightly increases with the increase in the pump house pressure. The variation in the suction area is obvious. The reason for this is that the pressure of the pump house is closer to that of the central oil pool in the suction area, resulting in having a great influence on the oil film pressure distribution.
As long as the oil film lubrication can be generated under the harsh working conditions of high pressure, low shaft speed, maximum swashplate inclination angle, and minimum pump house pressure, the lubrication is also guaranteed under the others. Therefore, the working conditions of optimization can be selected as the shaft speed of 1000 r/min, the working pressure of 30 MPa, the swashplate inclination angle of 18° and the pump house pressure of 0 MPa.

4.2. Optimization Objective

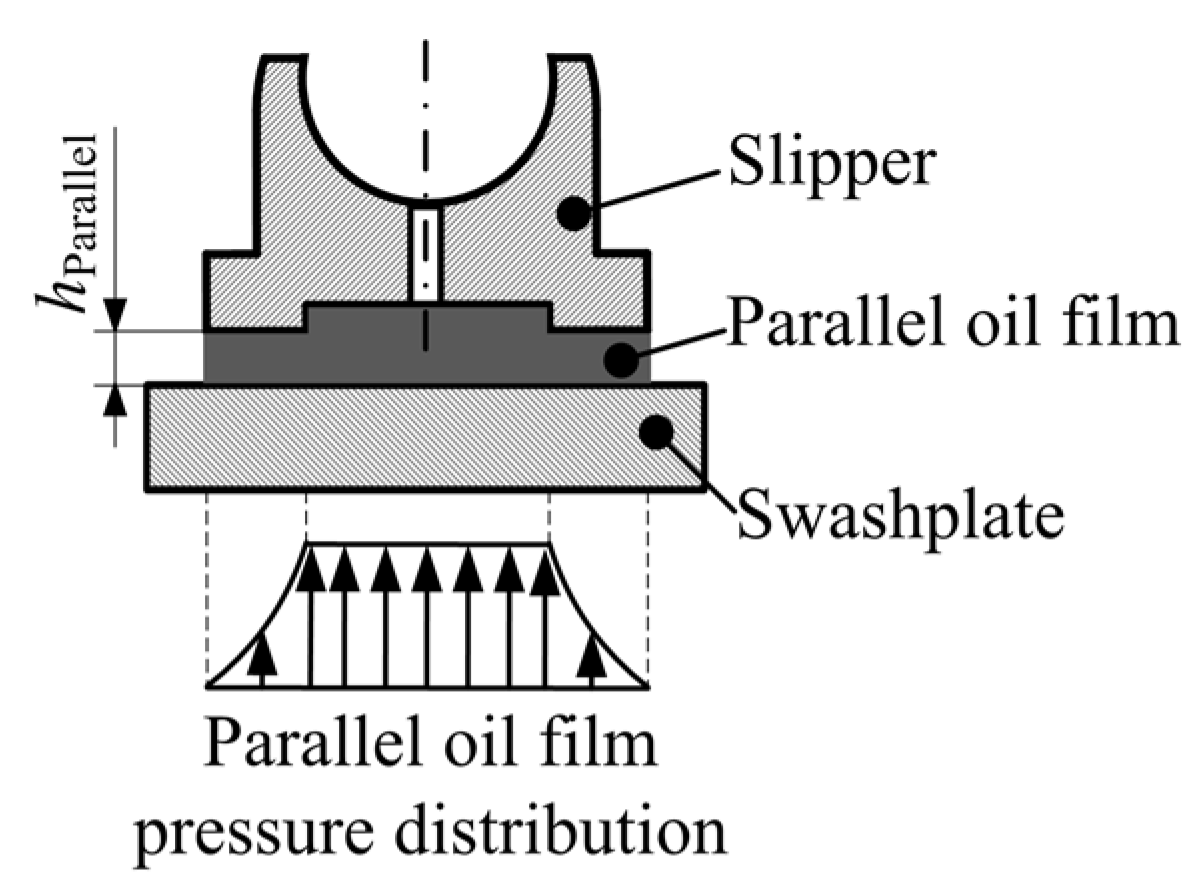
Through the analysis of the parallel oil film of the slipper/swashplate interface, the optimization objective can be found. The diagram of the parallel oil film between the slipper and swashplate is shown in Figure 13. The slipper is assumed to be always parallel to the swashplate during the operation of piston pumps.
According to the slit flow theory between two parallel plates, the parallel oil film pressure distribution, pParallel, of the slipper/swashplate interface is expressed as,
p Parallel = { p HC , 0 r r HSin l n ( r / r HSout ) l n ( r HSin / r HSout ) p HC , r HSin < r < r HSout
The leakage, friction, and total power loss of the slipper/swashplate interface in the parallel oil film lubrication are deduced as,
{ P QParallel = π h Parallel 3 p HC 2 6 μ l n ( r HSout / r HSin ) P FParallel = π μ ω 2 R f 2 h Parallel ( r HSout 2 r HSin 2 ) P TParallel = P QParallel + P FParallel
where hParallel is the parallel oil film thickness; PQParallel, PFParallel, and PTParallel are the leakage, friction and total power loss of the parallel slipper/swashplate interface, respectively.
When the total power loss is the smallest value, or P TParallel / h Parallel = 0 , the optimal parallel oil film thickness value is solved, as follows,
h ParallelOpt = 1 p HC 2 μ 2 ω 2 R f 2 p HC 2 ( r HSout 2 r HSin 2 ) l n ( r HSout / r HSin ) 4
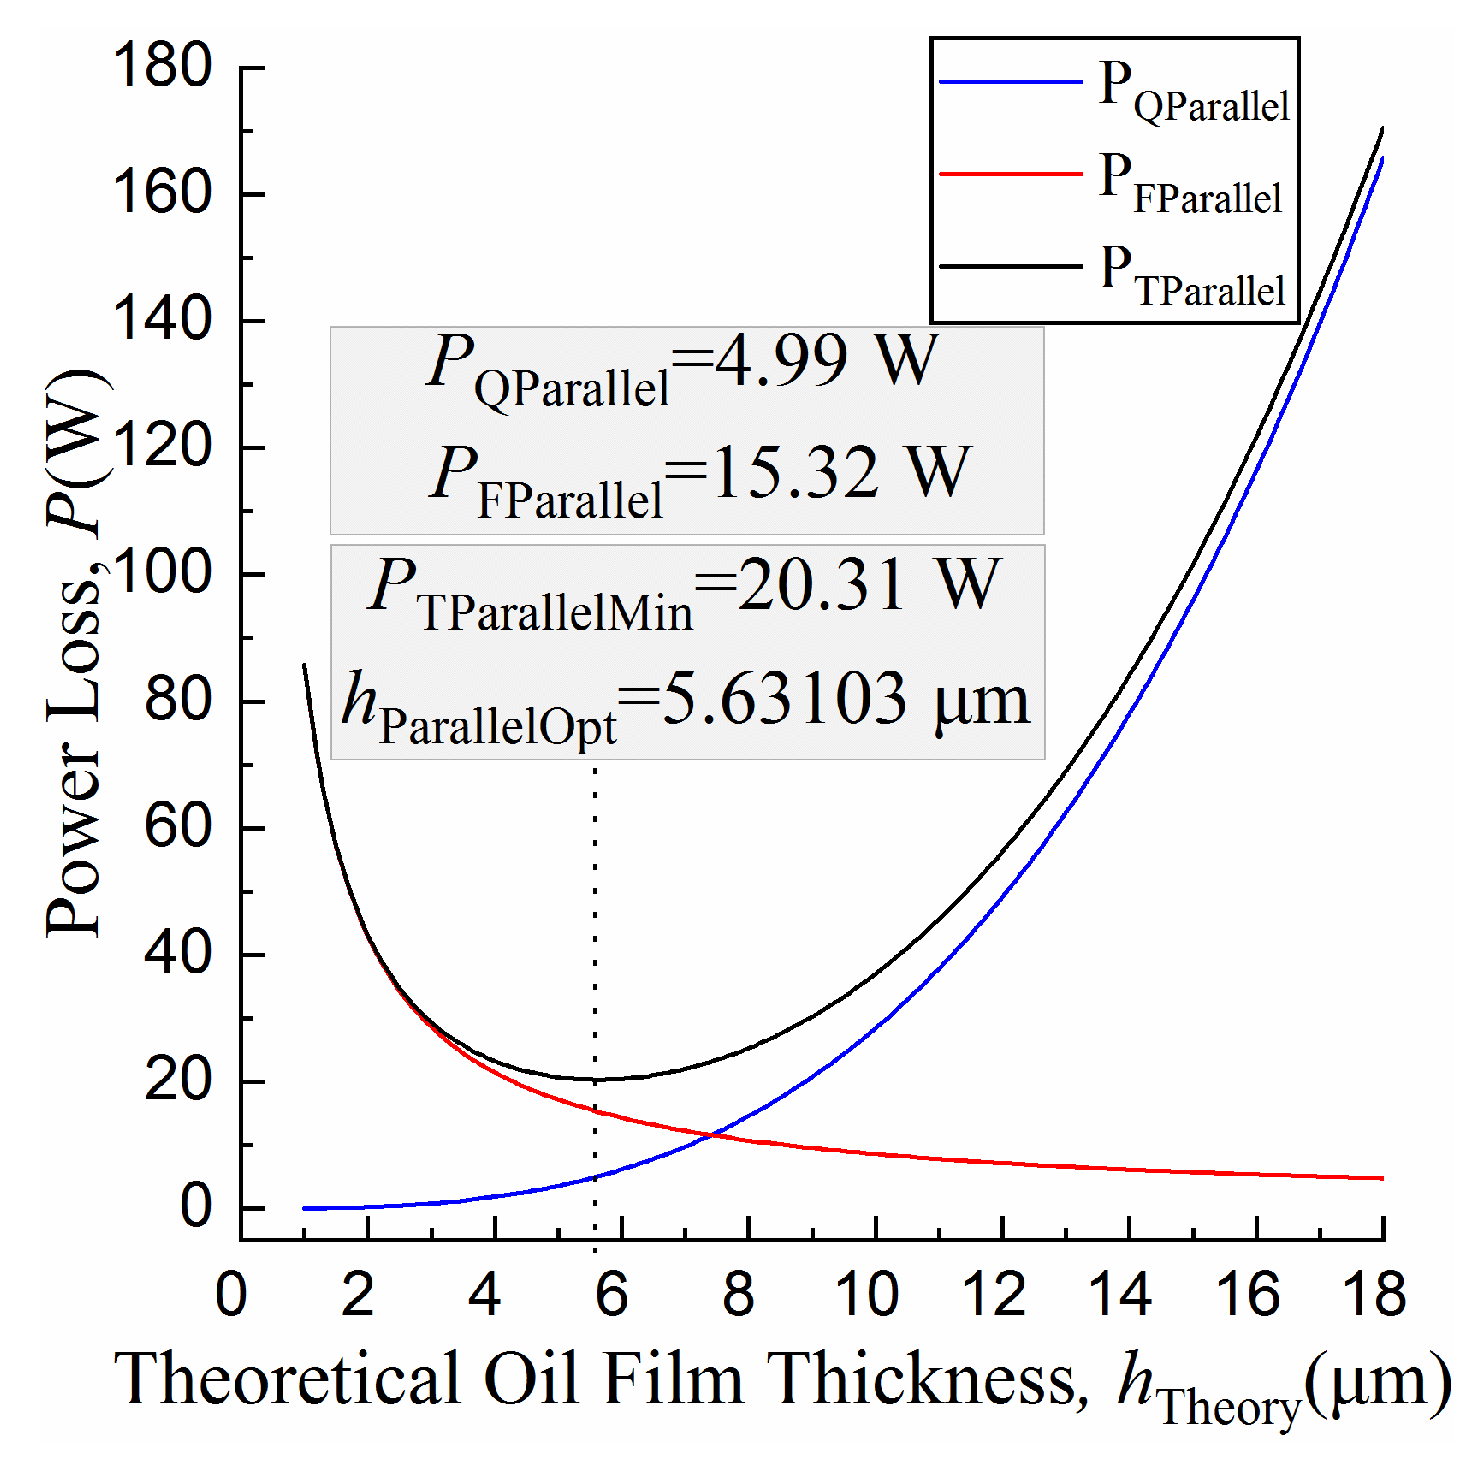
Under the selected working conditions of optimization, Equations (16) and (17) are calculated to obtain the influence of the parallel oil film thickness on the leakage, friction and total power loss and the optimal thickness, as shown in Figure 14.
It is found in Figure 14 that with the increase in the oil film thickness the leakage power loss increases but the friction power loss decreases. Both have a wane and wax relationship. The curve of the total power loss exists an inflection point (as seen in the black line) where the coordinate values are the optimal oil film thickness value of 5.63103 μm and the minimum total power loss of 20.31 W. The leakage and friction power losses are 4.99 and 15.32 W, respectively. The minimum total power loss can be taken as the optimization objective.

4.3. Optimization of Micro-Chamfering

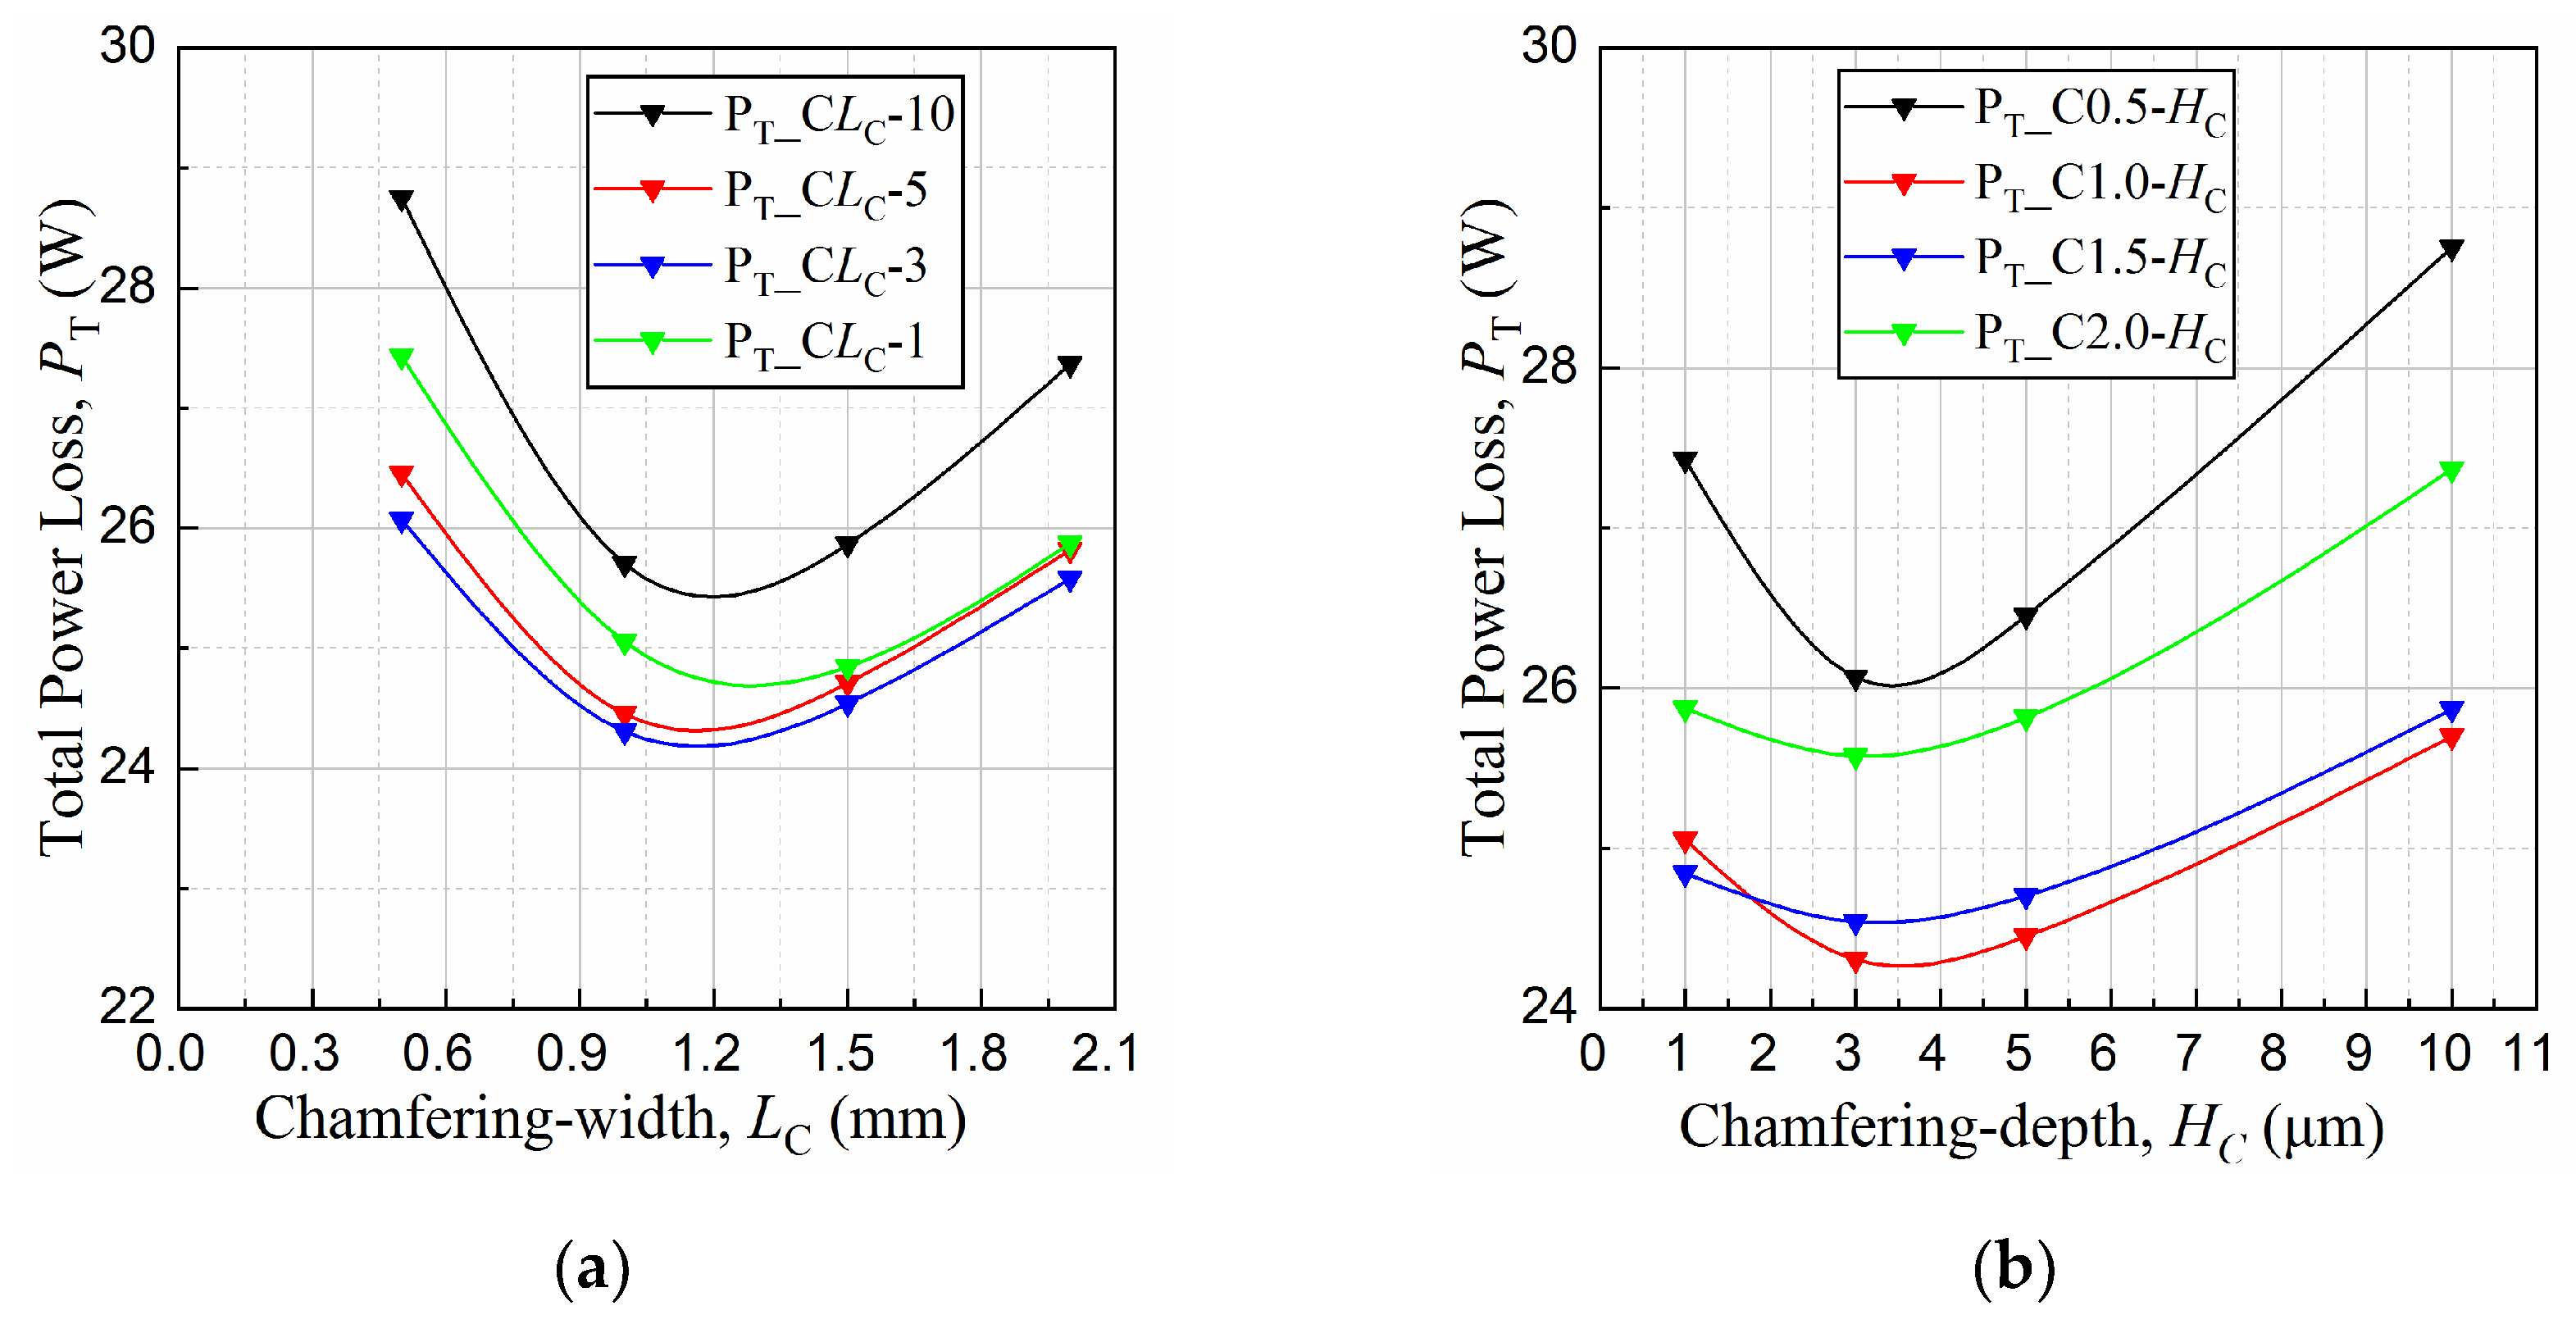
Based on the coupling lubrication numerical model, the total power losses under the selected working conditions of optimization are solved for the micro-chamfering of different parameters. The different micro-chamfering widths and depths are grouped by the orthogonal method, as shown in Table 2.
Figure 15 shows the influence of the micro-chamfering parameters on the total power loss of the slipper/swashplate interface.
For the same micro-chamfering depths, it is seen in Figure 15a that the total power losses all firstly decrease and then increase with the increase in the widths and that the width is about 1.2 mm at the minimum power loss. Similarly, it is found in Figure 15b that the total power losses have the same variable trends and the optimal depth is about 3.5 μm. In order to verify whether the group of C1.2-3.5 is the optimal parameter combination of micro-chamfering, its simulation results have to be further analyzed and compared with the optimal parallel oil film thickness.

4.4. Lubrication Perfomance Analysis with Optimal Micro-Chamfering

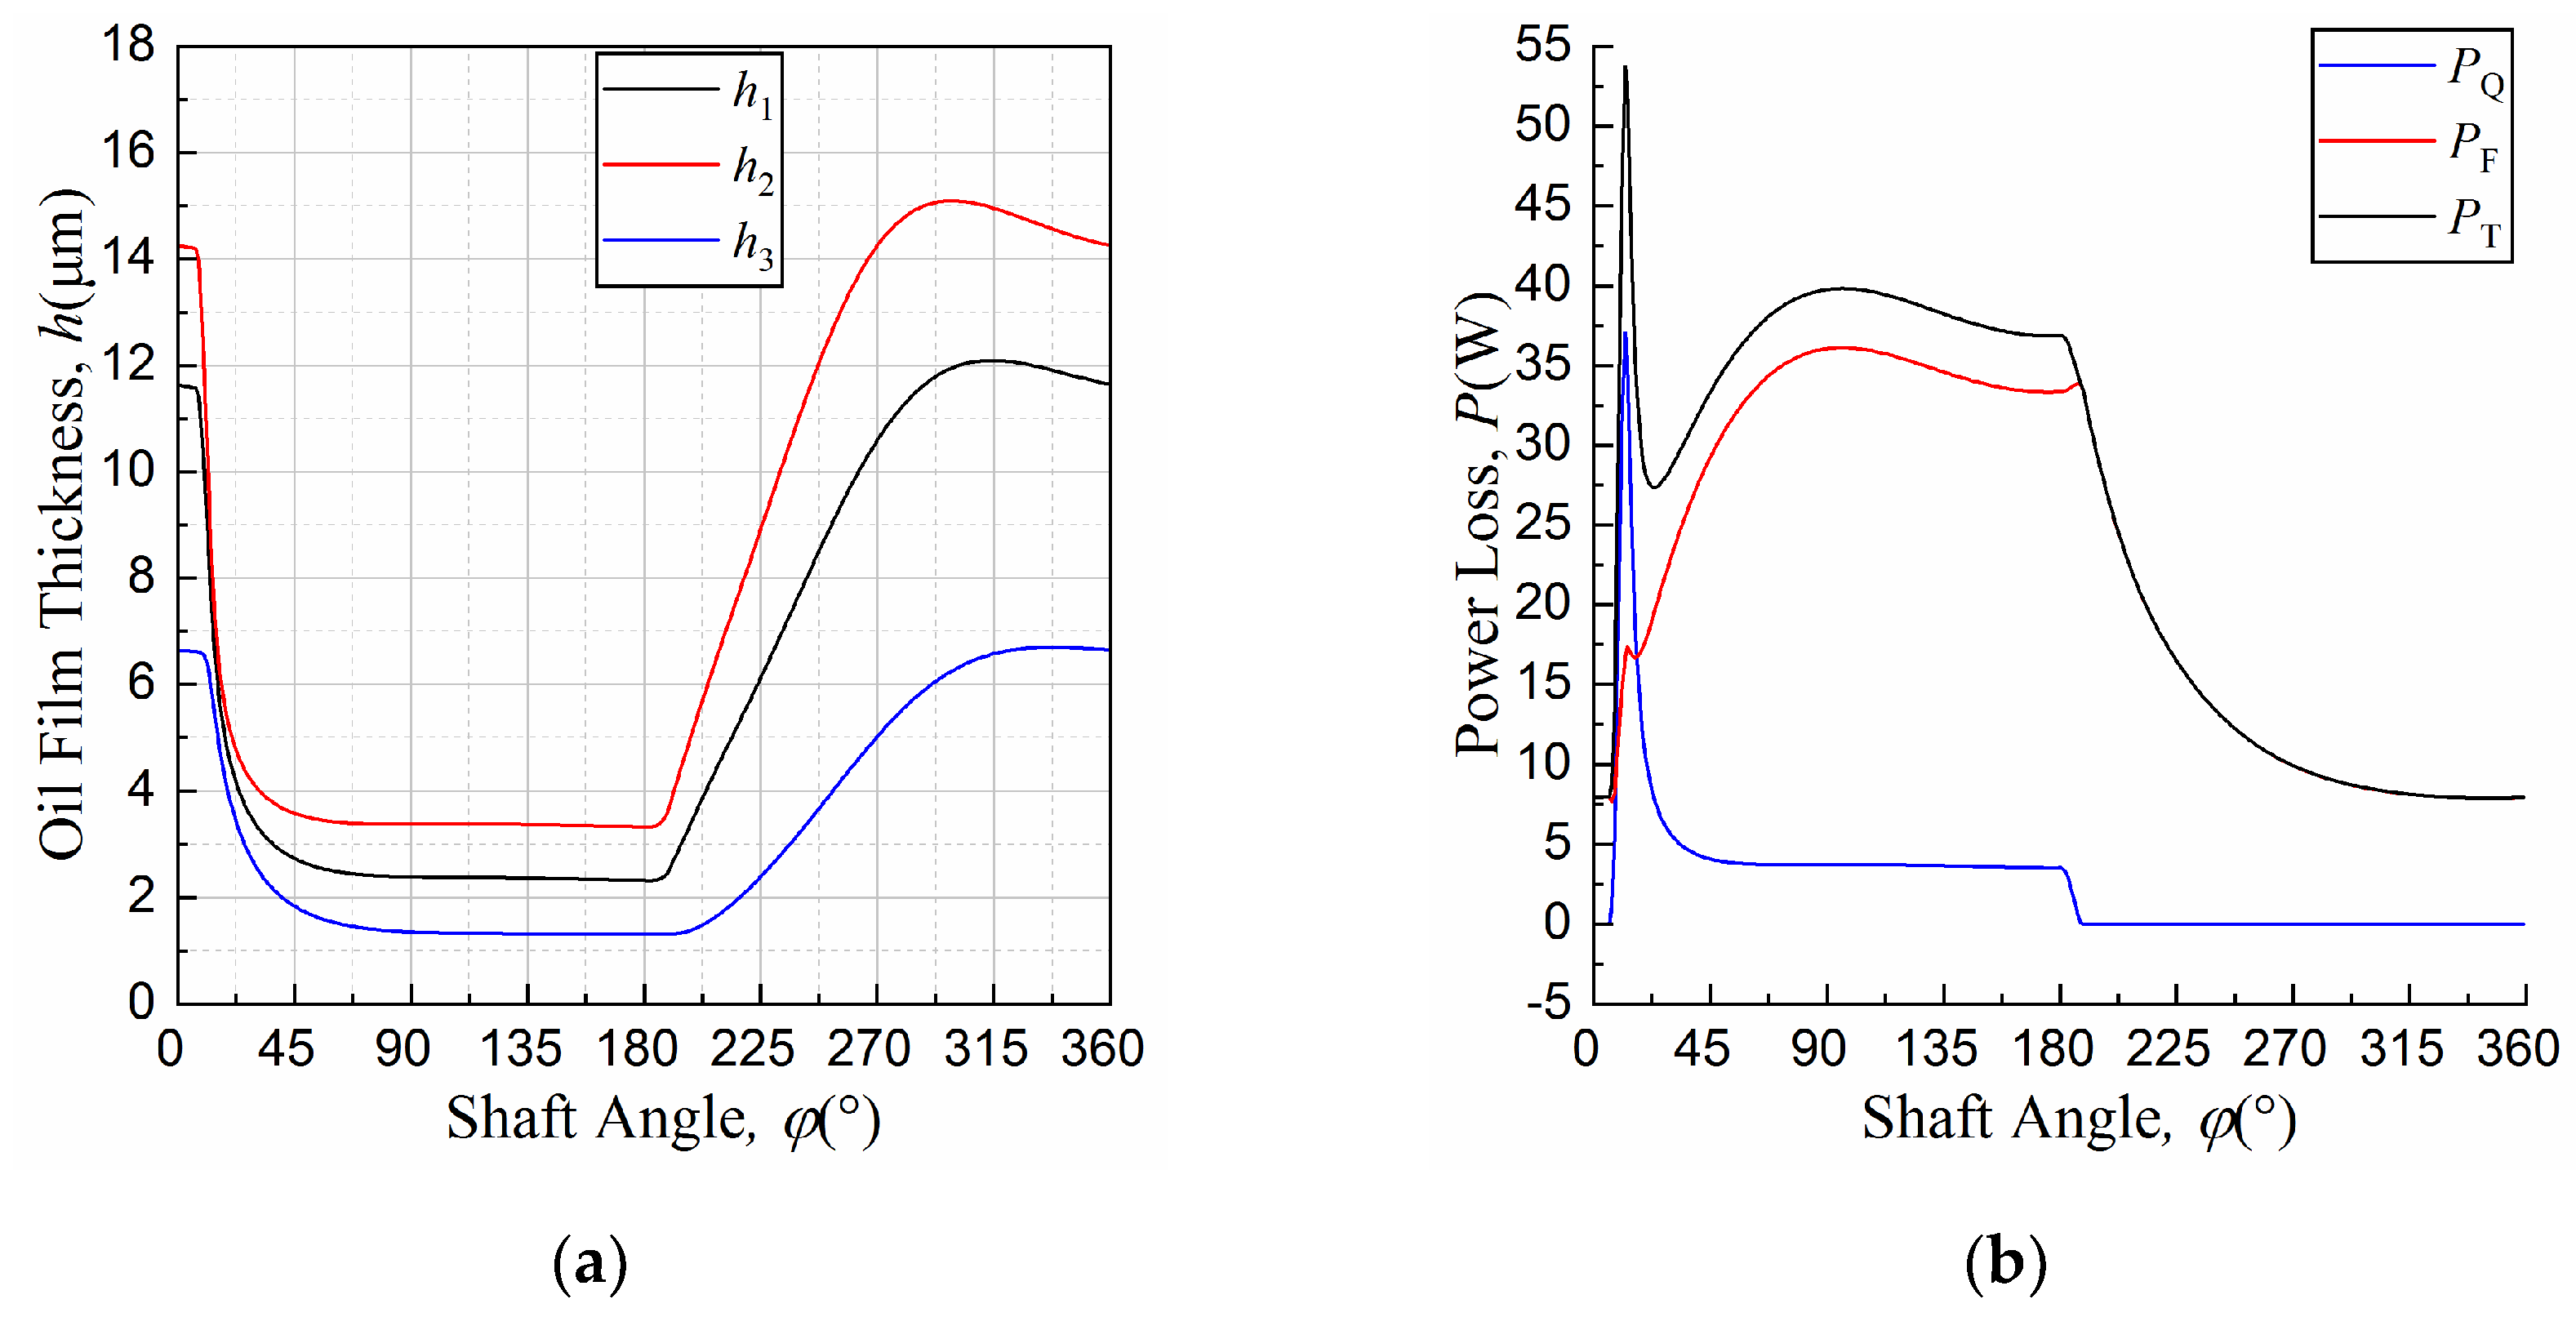
Under the selected working conditions of optimization, the lubrication numerical model of C1.2-3.5 is figured out to get the results, as seen in Figure 16. It is seen in Figure 16a that the micro-chamfering of C1.2-3.5 makes the slipper/swashplate interface generate the stable wedge-shaped oil film satisfying the requirement of the dynamic pressure effect to improve the lubrication characteristics. From Figure 16b, the power loss of the slipper/swashplate interface is mainly from the friction power loss. It in the discharge area (0°–180°) is much more than that in the suction area (180°–360°) and has a positive overshoot at the shaft angle of about 12°. The reason for this is that the slipper load from the displacement chamber in the discharge area is greater than that in the suction area and has a pressure shock at the angle of about 12° within the transition region from low to high pressure.
The average oil film thickness, hav, for one cycle can be regarded to be the average value of the central one which is expressed as,
h av = 1 360 i = 0 359 h 0 _ C 1.2 - 3.5 i = 1 360 i = 0 359 1 3 ( h 1 _ C 1.2 - 3.5 i + h 2 _ C 1.2 - 3.5 i + h 3 _ C 1.2 - 3.5 i )
where h0_C1.2-3.5, h1_C1.2-3.5, h2_C1.2-3.5, and h3_C1.2-3.5 are the central oil film thickness, the ones at three control points of the slipper with the optimal micro-chamfering of C1.2-3.5, respectively.
The average leakage, friction and total power loss for one cycle are expressed as, respectively,
{ P Qav = 1 360 i = 0 359 P Q P Fav = 1 360 i = 0 359 P F P Tav = 1 360 i = 0 359 P T
where PQav, PFav, and PTav are the average leakage, friction and total power loss for one cycle of the slipper/swashplate interface with the optimal micro-chamfering of C1.2-3.5, respectively.
For the lubrication parameters of the slipper/swashplate interface, the simulation results of C1.2-3.5 are compared with the analytical optimization ones, as shown in Table 3.
It is found in Table 3 that the oil film thickness have a good agreement between the analytical and simulation results and that the analytical leakage power loss is more than the simulation one while the friction power loss is less than the simulation one. Because for the same average oil film thickness, the whole oil film in the parallel lubrication analytical model is assumed to be uniform but the oil film in the numerical lubrication model is wedge-shaped.

5. Experiments

Figure 17 shows the experimental platform for the friction power loss of the slipper/swashplate interface, which is mainly composed of a closed oil tank, an experimental pump, a torque-speed sensor, and a motor. The experimental pump is transformed from the real pump (A10VSO45) by the inverse method of the swashplate rotation, which can simulate the relative motion between the slipper and swashplate. With the swashplate’s rotation and the help of the retainer or spring force, the piston makes a reciprocating linear motion resulting in the displacement chamber volume change to realize the function of oil suction and discharge in the experimental pump.
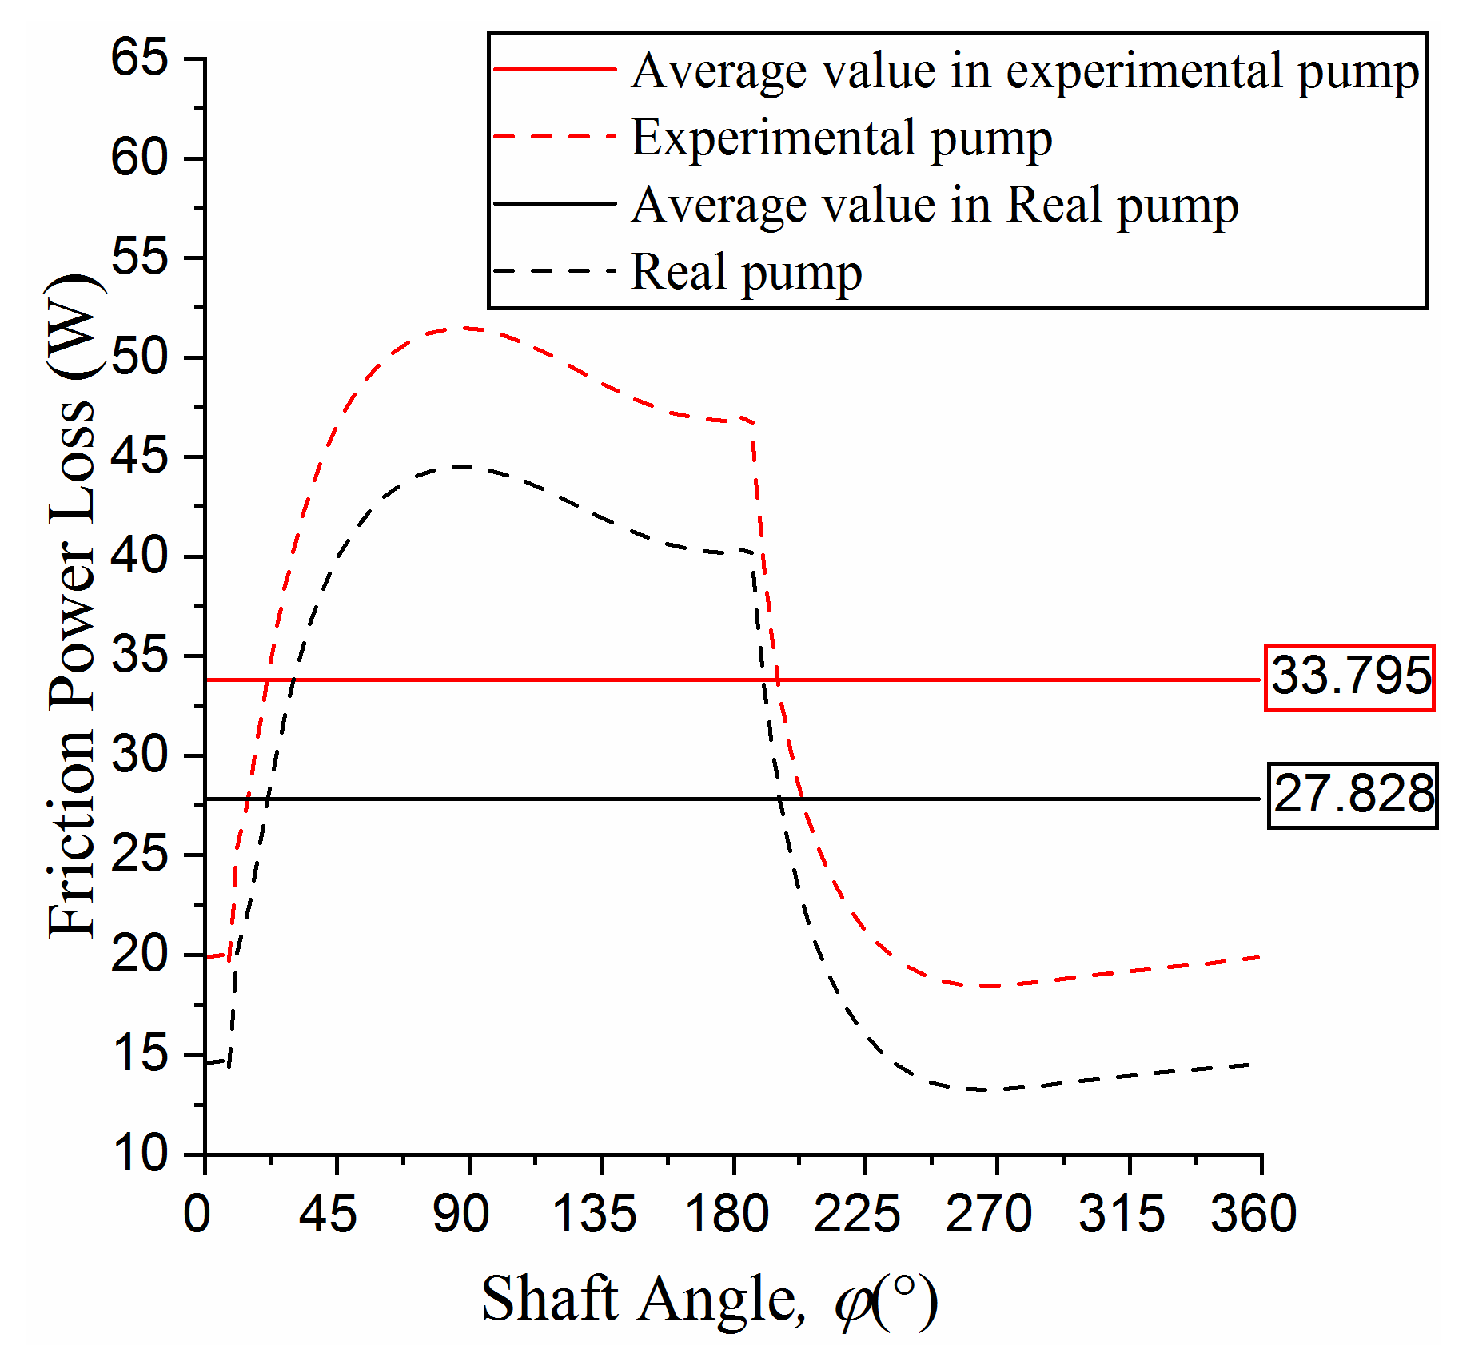
In order to verify the feasibility of the inverse method, the simulation results of the friction power loss of the slipper/swashplate interface firstly need to be compared between the real pump and the experimental pump. According to the proposed the coupling lubrication numerical model, the power loss and average value under the shaft speed of 1500 r/min, the working pressure of 10 MPa, the swashplate inclination angle of 18° and the inlet pressure of 0.1 MPa are shown in Figure 18.
It can be seen from Figure 18 that the friction power loss of the slipper/swashplate interface in the real pump is less than that in the experimental pump and that the difference of the average value is about 6 W. The centrifugal motion and the rotation around the own axis of the slipper in real pump are not simulated in the experimental pump. The centrifugal motion is helpful to generate the wedge-shaped oil film and the rotation can enhance its dynamic pressure effect. The better oil film lubrication is formed to reduce the friction power loss. However, the simulation results show in Figure 18 that the variation tendency of the power loss is basically similar, so the inverse method of the swashplate rotation is feasible in the experimental pump.
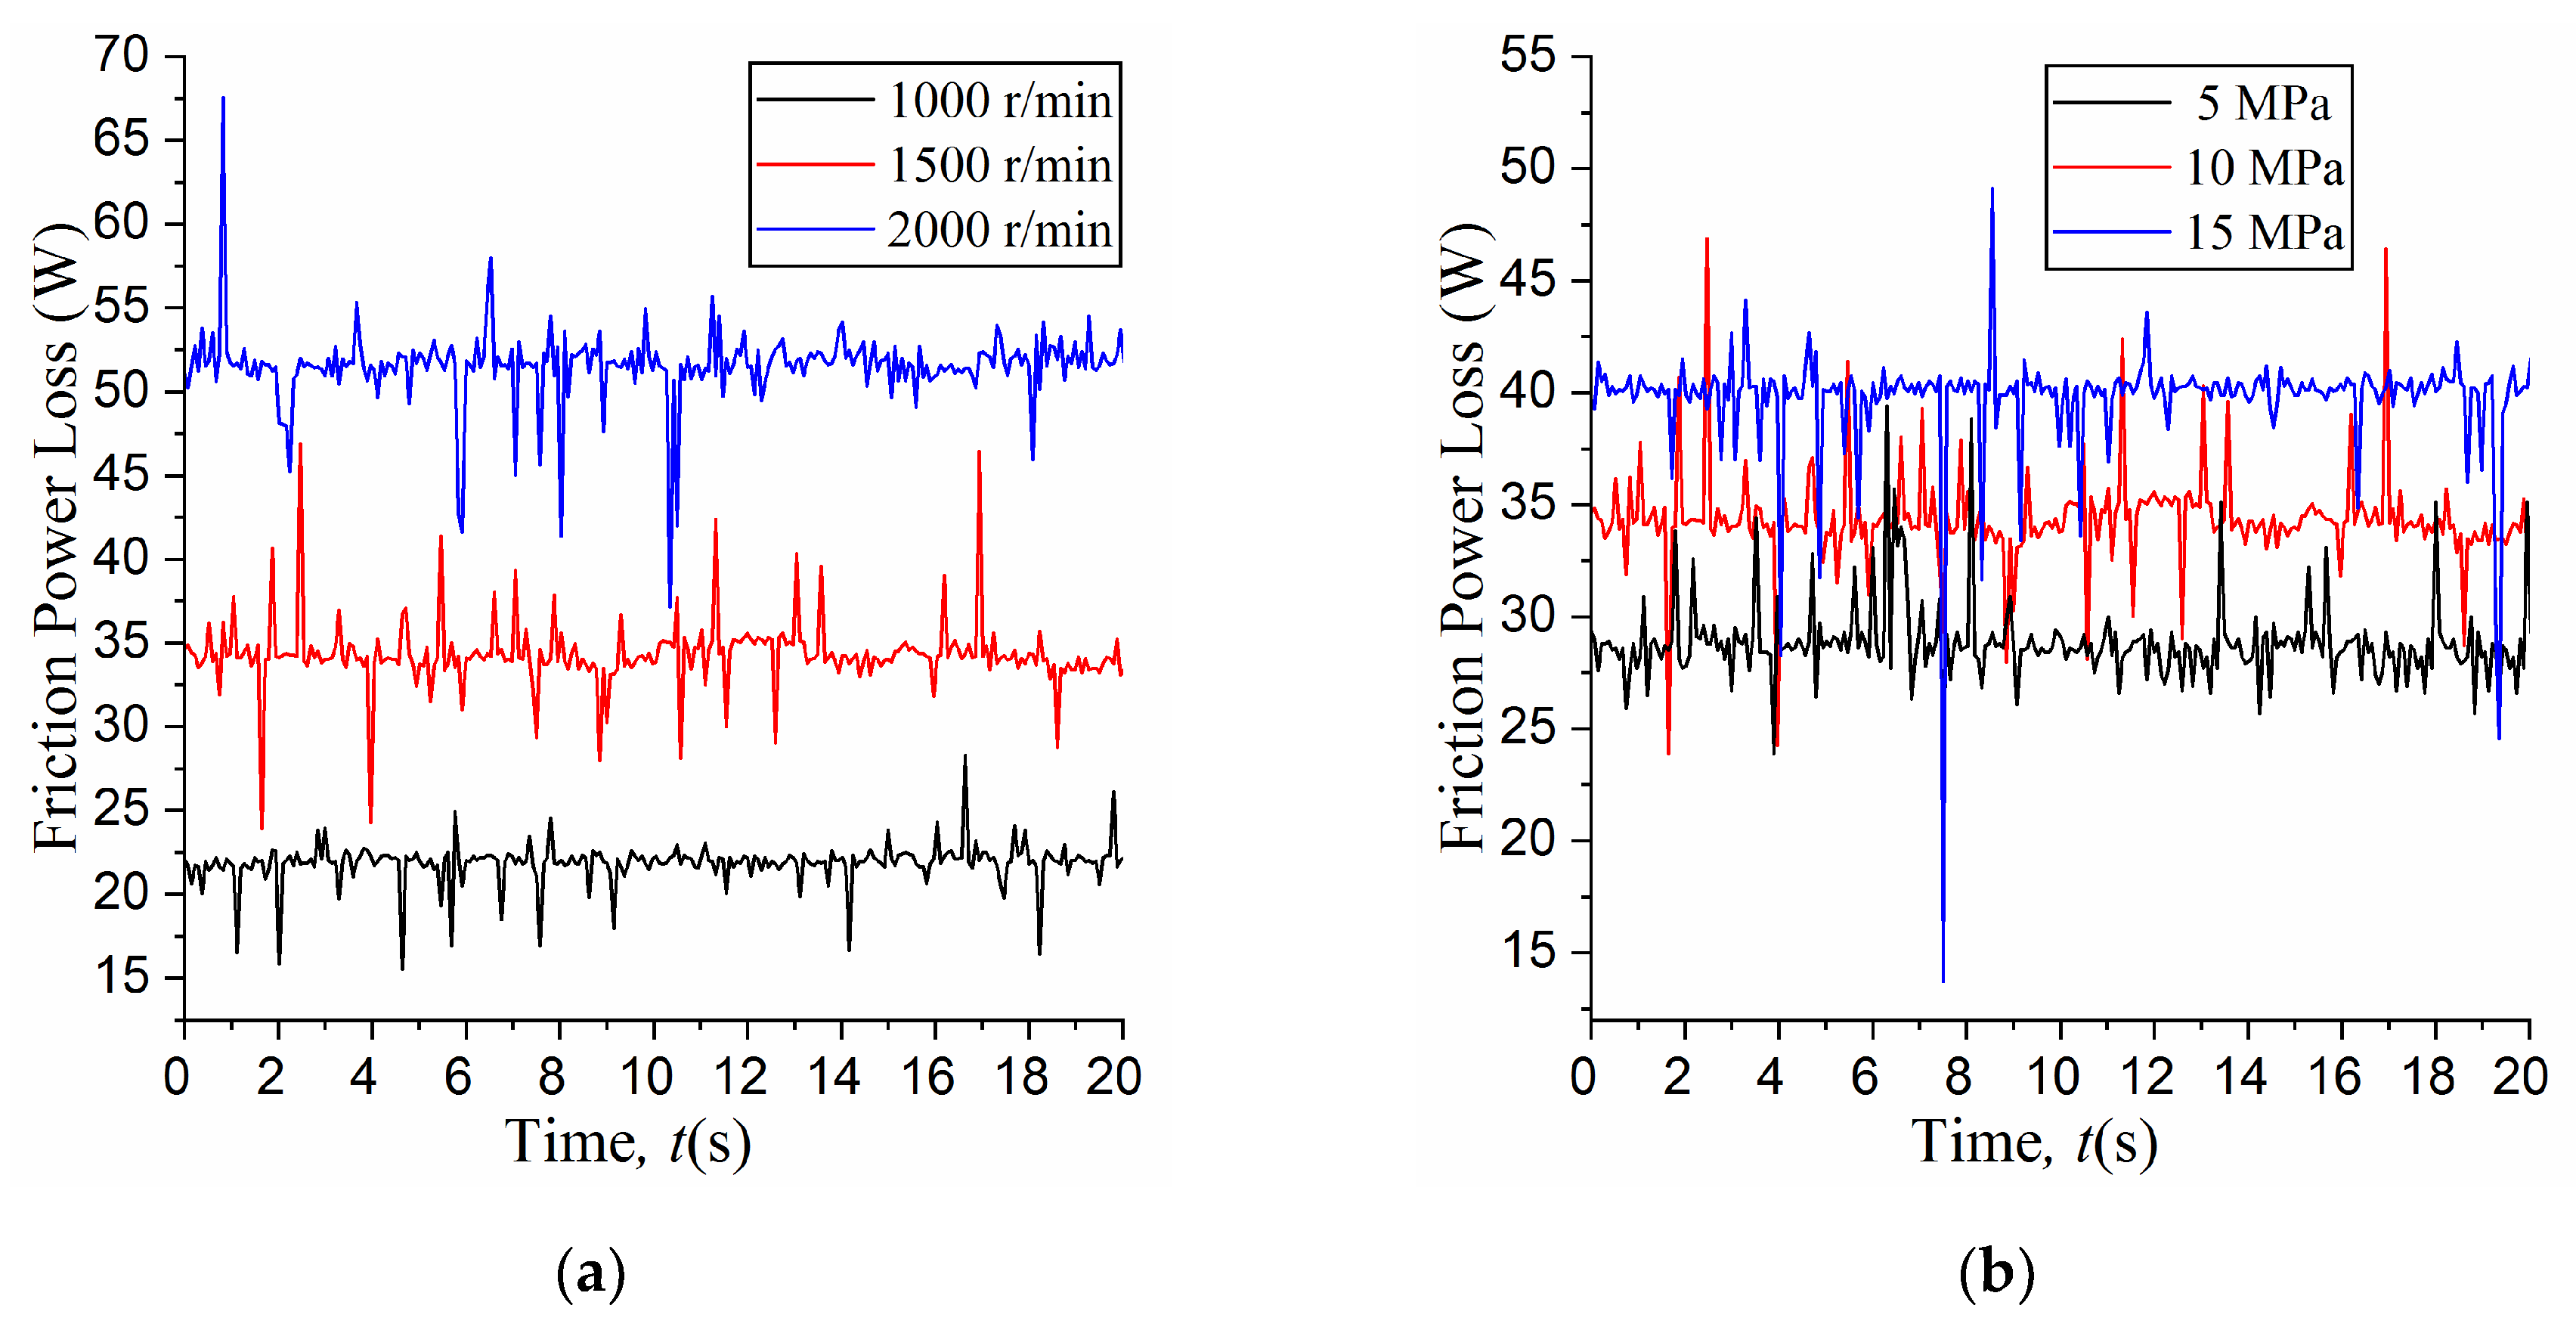
As shown in Figure 17, the cylinder/valve plate interface is eliminated by replacing the valve plate with the check valves. The influence of the piston/cylinder interface can be almost removed through the following experimental steps. Firstly, the experimental pump is not connected to the torque-speed sensor and the no-load power of the motor is measured under the shaft speed of 1000, 1500, 2000 r/min. Secondly, the experimental pump is connected and the swashplate inclination angle is set to 0°. The power of the experimental platform is measured. Thirdly, the inclination angle and the pump outlet pressure are set to 18° and 0 MPa. The power of the experimental platform is measured once more. Finally, above of the former three steps, it is easy to obtain the power loss of the motor with no-load and piston/cylinder interface and to embed it into the data acquisition module of the power loss of the slipper/swashplate interface. Because the friction power loss of the piston/cylinder interface is little affected by the displacement pressure, it is considered to be basically unchanged. Owing to the limitation of the sampling frequency of the torque-speed sensor, the instantaneous value of the power loss of the slipper/swashplate interface cannot be captured and the average value can be measured under the working pressure of 5, 10, 15 MPa, as shown in Figure 19.
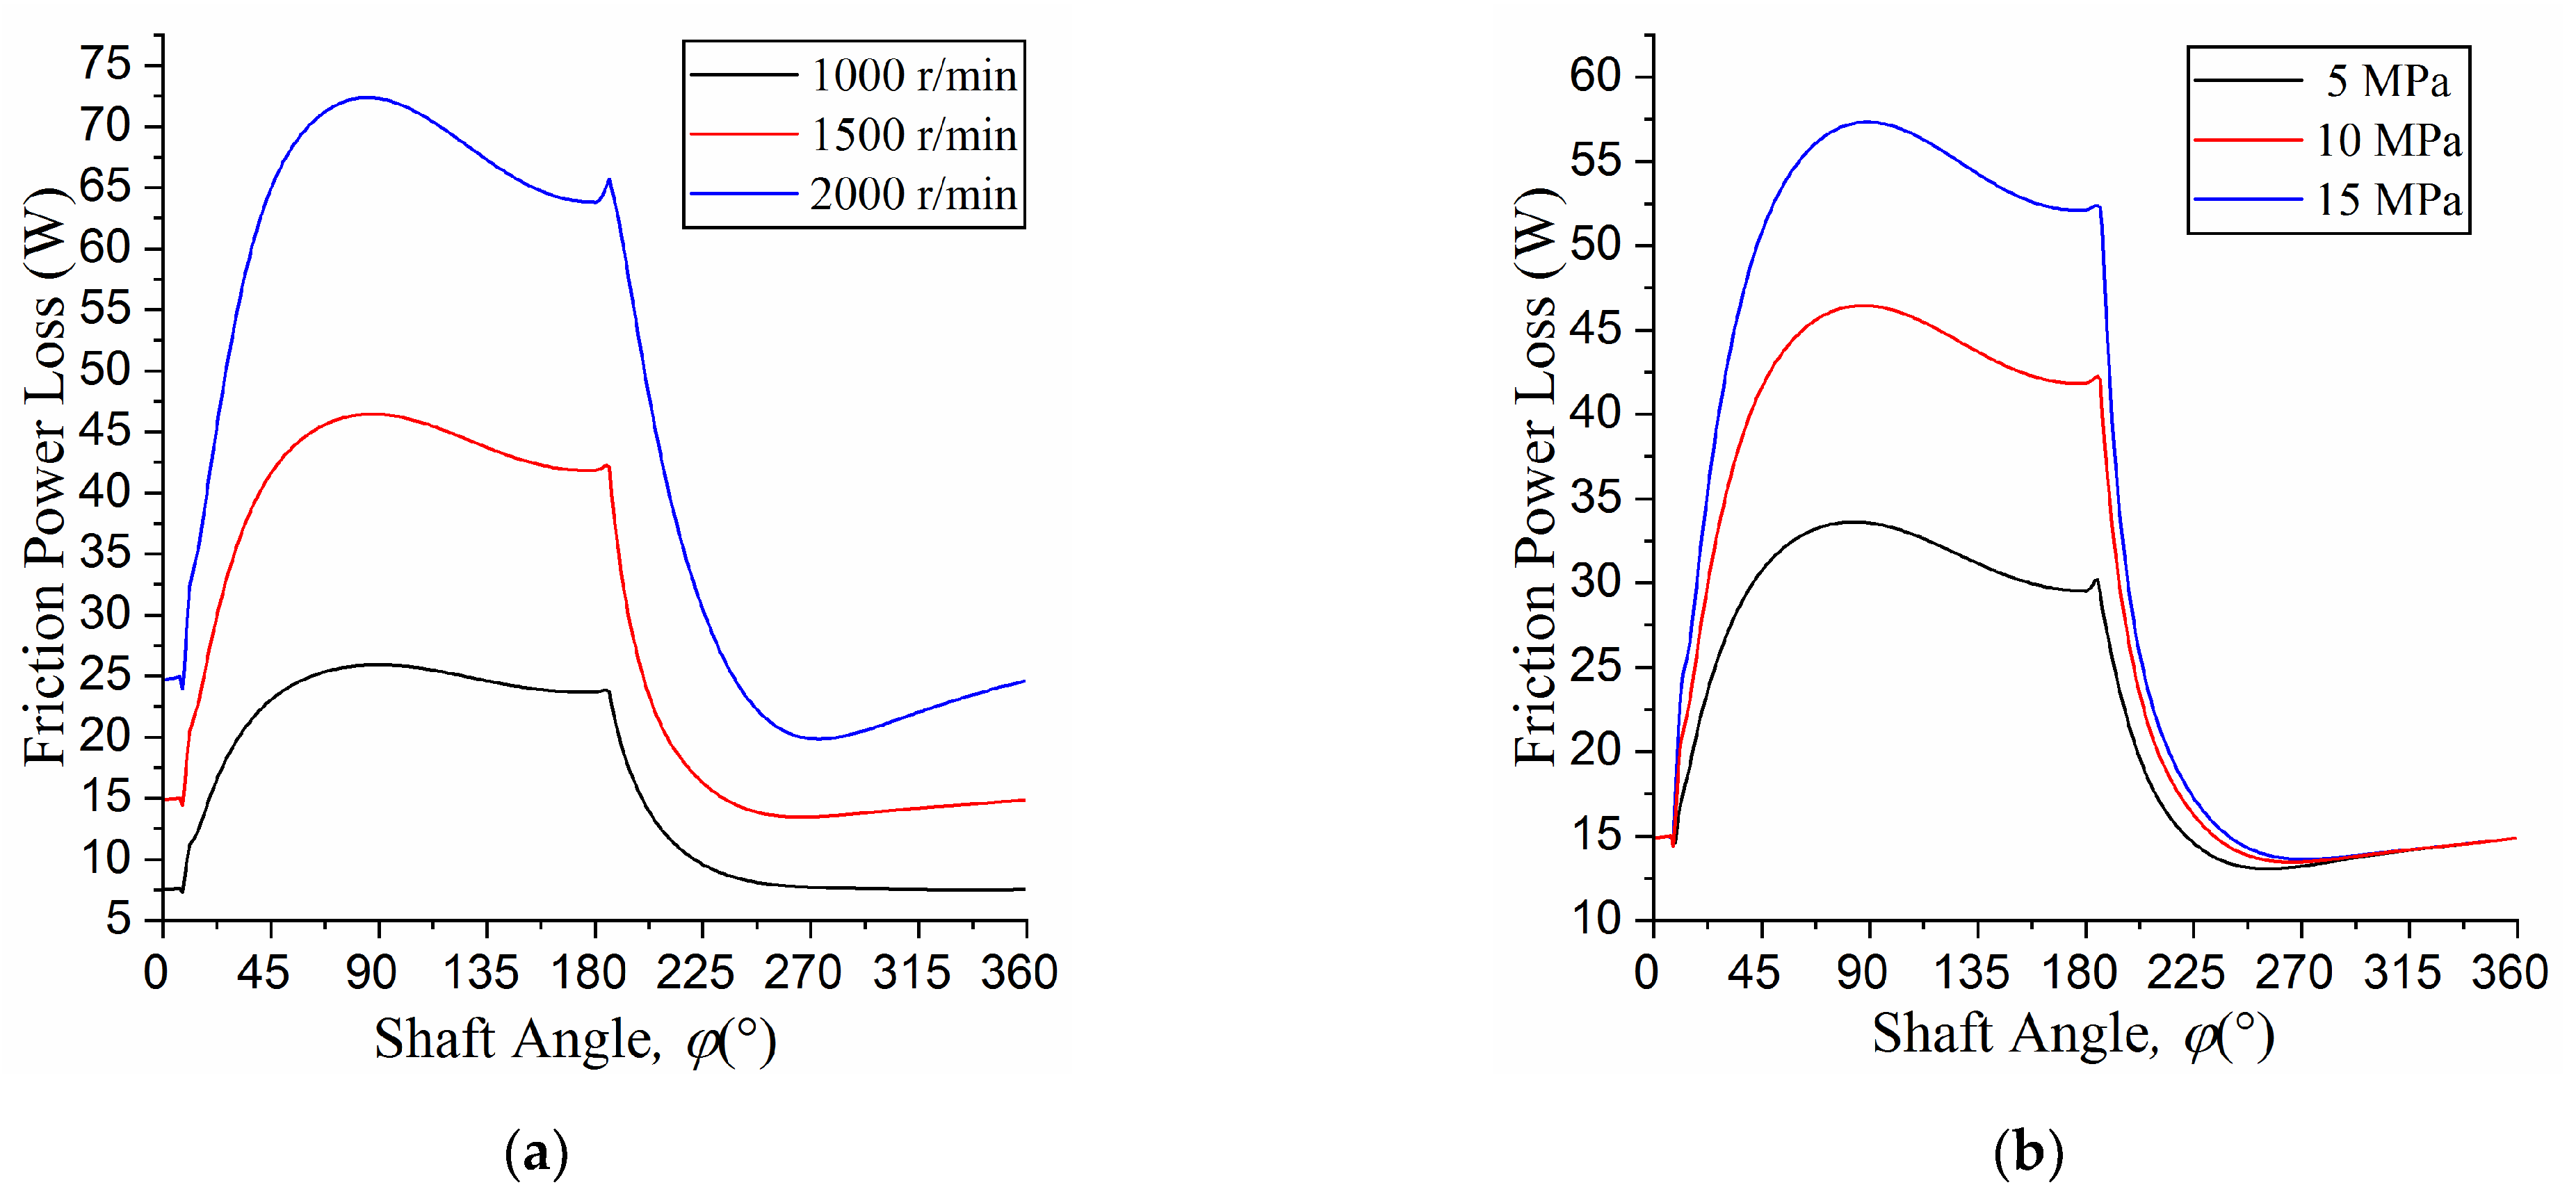
As seen in Figure 19, the experimental results show that the friction power loss of the slipper/swashplate interface increases with the increase in the working pressure and shaft speed, which is consistent with the simulation results (as shown in Figure 20).
The average friction power losses of the slipper/swashplate interface with the different shaft speed and working pressure are shown in Table 4 and Table 5, respectively.
As seen in Table 4 and Table 5, the experimental results are essentially consistent with the simulation results, which conforms the lubrication numerical model to be correct. Both the simulation and experimental results show that the shaft speed has a greater influence on the friction power loss than the working pressure.

6. Conclusions

In order to improve the lubrication characteristics and reduce the power loss between the slipper and swashplate, a coupling lubrication numerical model is developed and a coupling algorithm and a micro-chamfering are proposed. Based on the results of simulation and optimization, the following could be summarized.
(1)
The oil film thickness decreases with the increase in the working pressure and the swashplate inclination angle, but it increases with the increase in the shaft speed and the pump house pressure.
(2)
Micro-chamfering is conducive to generate the oil film lubrication and to reduce the power loss between the slipper and swashplate.
(3)
The minimum total power loss can be taken as the optimization objective. The optimal parameter group of micro-chamfering is the width of 1.2 mm and the depth of 3.5 μm or C1.2-3.5.
(4)
The simulation results of the optimal parameter group of micro-chamfering are approximately equal to the analytical ones. The experimental results of the power loss of the slipper/swashplate interface are also essentially consistent with the simulation one. The coupling lubrication numerical model and the optimization are proved to be correct and effective to provide a basis for further optimization design of axial piston pumps.

Author Contributions

The work performed by Z.W. as a Ph.D. student in this paper was supervised and mentored by J.J. The preparation of this manuscript included contributions from both the authors. All authors have read and agreed to the published version of the manuscript.

Funding

This research was funded in part by the National Key R&D Program of China, grant number 2018YFB2000900, and in part by the National Natural Science Foundation of China, grant number 51775131.

Institutional Review Board Statement

Not applicable.

Informed Consent Statement

Not applicable.

Data Availability Statement

The data presented in this study are available on reasonable request from the corresponding author.

Conflicts of Interest

The authors declare no conflict of interest.

References

  1. Guo, S.R.; Chen, J.H.; Lu, Y.L. Hydraulic piston pump in civil aircraft: Current status, future directions and critical technologies. Chin. J. Aeronaut. 2019, 33, 16–30. [Google Scholar] [CrossRef]
  2. Shen, W.; Huang, H.; Pang, Y. Review of the energy saving hydraulic system based on common pressure rail. IEEE Access 2017, 5, 655–669. [Google Scholar] [CrossRef]
  3. Kumar, N.; Kumar, R.; Sarkar, B.K. Condition monitoring of hydraulic transmission system with variable displacement axial piston pump and fixed displacement motor. Mater. Today Proc. 2020. [Google Scholar] [CrossRef]
  4. Xiong, S.P.; Wilfong, G.; Lumkes, J. Components sizing and performance analysis of hydro-mechanical power split transmission applied to a wheel loader. Energies 2019, 12, 1613. [Google Scholar] [CrossRef] [Green Version]
  5. Chen, Y.; Zhang, J.H.; Xu, B. Multi-objective optimization of micron-scale surface textures for the cylinder/valve plate interface in axial piston pumps. Tribol. Int. 2019, 138, 316–329. [Google Scholar] [CrossRef]
  6. Song, Y.H.; Ma, J.M.; Zeng, S.K. A numerical study on influence of temperature on lubricant film characteristics of the piston/cylinder interface in axial piston pumps. Energies 2018, 11, 1842. [Google Scholar] [CrossRef] [Green Version]
  7. Zhang, J.H.; Li, Y.; Xu, B. Experimental study on the influence of the rotating cylinder block and pistons on churning losses in axial piston pumps. Energies 2017, 10, 662. [Google Scholar] [CrossRef] [Green Version]
  8. Lan, Y.; Hu, J.W.; Huang, J.H. Fault diagnosis on slipper abrasion of axial piston pump based on Extreme Learning Machine. Measurement 2018, 124, 378–385. [Google Scholar] [CrossRef]
  9. Haidak, G.; Wang, D.Y.; Lisiane, E.A.E. Modelling of deformation and failure of slipper-retainer assembly in axial piston machine. Eng. Fail. Anal. 2020, 111, 104490. [Google Scholar] [CrossRef]
  10. Haidak, G.; Wang, D.Y. The impact of the deformation phenomenon on the process of lubricating and improving the efficiency between the slipper and swashplate in axial piston machines. IEEE Access 2019, 7, 69393–69409. [Google Scholar] [CrossRef]
  11. Wang, Y.J. Pressure distribution characteristics in slipper pad bearing of axial piston pump. Drain. Irrig. Eng. 2014, 32, 1–5. [Google Scholar]
  12. Hashemi, S.; Kroker, A.; Bobach, L. Multibody dynamics of pivot slipper pad thrust bearing in axial piston machines incorporating thermal elastohydrodynamics and mixed lubrication model. Tribol. Int. 2016, 96, 57–76. [Google Scholar] [CrossRef]
  13. Ye, S.G.; Tang, H.S.; Ren, Y. Study on the load-carrying capacity of surface textured slipper bearing of axial piston pump. Appl. Math. Model 2020, 77, 554–584. [Google Scholar] [CrossRef]
  14. Zhou, J.J.; Zhou, J.C.; Jing, C.B. Experimental Research on the Dynamic Lubricating Performance of Slipper/Swash Plate Interface in Axial Piston Pumps. Chin. J. Mech. Eng. 2020, 33, 1–7. [Google Scholar] [CrossRef] [Green Version]
  15. Wieczorek, U.; Ivantysynova, M. Computer aided optimization of bearing and sealing gaps in hydrostatic machines—The simulation tool CASPAR. Int. J. Fluid Power 2002, 3, 7–20. [Google Scholar] [CrossRef]
  16. Shang, L.Z.; Ivantysynova, M. Scaling Criteria for Axial Piston Machines Based on Thermo-Elastohydrodynamic Effects in the Tribological Interfaces. Energies 2018, 11, 3210. [Google Scholar] [CrossRef] [Green Version]
  17. Schenk, A.; Ivantysynova, M. A Transient Thermoelastohydrodynamic Lubrication Model for the Slipper/Swashplate in Axial Piston. J. Tribol. 2015, 137, 1–10. [Google Scholar] [CrossRef]
  18. Złoto, T.; Kowalski, K. Load of the slipper-swash plate kinematic pair of an axial piston pump. MATEC Web Conf. 2018, 157, 08013. [Google Scholar] [CrossRef]
  19. Xu, B.; Li, Y.B.; Zhang, B. Numerical simulation of overturning phenomenon of axial piston pump slipper pair. J. Mech. Eng. 2010, 46, 161–168. [Google Scholar] [CrossRef]
  20. Xu, B.; Zhang, J.H.; Yang, H.Y. Investigation on structural optimization of anti-overturning slipper of axial piston pump. Sci. China (Tech. Sci.) 2012, 55, 3010–3018. [Google Scholar] [CrossRef]
  21. Xu, B.; Wang, Q.N.; Zhang, J.H. Effect of case drain pressure on slipper/swashplate pair within axial piston pump. J. Zhejiang Univ.-Sci. A (Appl. Phys. Eng.) 2015, 16, 1001–1014. [Google Scholar] [CrossRef]
  22. Qun, C.; Zhang, J.H.; Xu, B. Multi-position measurement of oil film thickness within the slipper bearing in axial piston pumps. Measurement 2018, 122, 66–72. [Google Scholar]
  23. Tang, H.S.; Yan, Y.B.; Li, J. Characteristics of clearance leakage and friction torque of slipper pair in axial piston pump. J. South China Univ. Tech. (Nat. Sci. Ed.) 2014, 42, 74–79. [Google Scholar]
  24. Tang, H.S.; Li, J.; Yan, Y.B. Power loss characteristics of slipper/swash plate pair in axial piston pump. J. Cent. South Univ. (Sci. Tech.) 2017, 48, 361–369. [Google Scholar]
  25. Nie, S.L.; Huang, G.H.; Li, Y.P. Tribological study on hydrostatic slipper bearing with annular orifice damper for water hydraulic axial piston motor. Tribol. Int. 2006, 39, 1342–1354. [Google Scholar] [CrossRef]
  26. Ma, J.M.; Shen, Y.Y.; Li, Q.L. Oil Film Analysis of Swash Plate/slipper pair based on CFD. J. Beijing Univ. Aeronaut. Astronaut. 2016, 42, 265–272. [Google Scholar]
  27. Chen, J.; Ma, J.M.; Li, J. Performance optimization of grooved slippers for aero hydraulic pumps. J Chin. J. Aeronaut. 2016, 29, 814–823. [Google Scholar] [CrossRef] [Green Version]
  28. Borghi, M.; Specchia, E.; Zardin, B. Numerical analysis of the dynamic behavior of axial piston pumps and motors slipper bearing. SAE Int. J. Passeng. Cars-Mech. Syst. 2009, 2, 1285–1302. [Google Scholar] [CrossRef]
  29. Hooke, C.J.; Kakoullis, Y.P. The effect of non-flatness on the performance of slippers in axial piston pumps. Proc. Inst. Mech. Engrs. 1983, 197, 239–247. [Google Scholar] [CrossRef]
  30. Koc, E.; Hooke, C.J. Considerations in the design of partially hydrostatic slipper bearings. Tribol. Int. 1997, 30, 815–823. [Google Scholar] [CrossRef]
  31. Manring, N.D.; Wray, C.L.; Dong, Z.L. Experimental studies on the performance of slipper bearings within axial-piston pumps. ASME J. Tribol. 2004, 126, 511–518. [Google Scholar] [CrossRef]
  32. Sun, Y.; Jiang, J.H.; Liu, C.Q. Oil film characteristics and power consumption of slipper pair under redundant pressing force. J. South China Univ. Tech. (Nat. Sci. Ed.) 2011, 39, 111–116. [Google Scholar]
  33. Wang, K.L.; Jiang, J.H.; Wang, Z.B. Micro-motion of piston/cylinder interface and the influence of micro chamfering on it. J. Huangzhong Univ. Sci. Tech. (Nat. Sci. Ed.) 2019, 47, 46–51. [Google Scholar]
  34. Sharma, S.C.; Yadav, S.K. Performance analysis of a fully textured hybrid circular thrust pad bearing system operating with non-Newtonian lubricant. Tribol. Int. 2014, 77, 50–64. [Google Scholar] [CrossRef]
Figure 1. Pictures of slipper eccentric abrasion, where (a) is before eccentric abrasion; (b) is after eccentric abrasion.
Energies 14 01961 g001
Figure 2. Structural diagram of axial piston pump.
Energies 14 01961 g002
Figure 3. Kinetic analysis diagram of slipper.
Energies 14 01961 g003
Figure 4. Control points definition of micro motions of slipper, where (a) is positions of control points; (b) is grids of oil film.
Energies 14 01961 g004
Figure 5. Force analysis of slipper.
Energies 14 01961 g005
Figure 6. Control volume diagram of central oil pool.
Energies 14 01961 g006
Figure 7. Coupling algorithm block diagram of lubrication model.
Energies 14 01961 g007
Figure 8. Slipper structure diagram, where (a) is without micro-chamfering; (b) is with micro-chamfering.
Energies 14 01961 g008
Figure 9. Convergence process of oil film thickness, where (a) is the convergence error; (b) is the oil film thickness.
Energies 14 01961 g009
Figure 10. Pressure distribution of slipper bottom at shaft angle of 90°.
Energies 14 01961 g010
Figure 11. Central oil film thickness under different working pressure and shaft speed, where (a) is under different working pressure at shaft speed of 1500 r/min; (b) is under different shaft speed at working pressure of 10 MPa.
Energies 14 01961 g011
Figure 12. Central oil film thickness under different swashplate inclination angle and pump house pressure, where (a) is under different swashplate inclination angle; (b) is under different pump house pressure.
Energies 14 01961 g012
Figure 13. The diagram of parallel oil film between the slipper and swashplate.
Energies 14 01961 g013
Figure 14. Influence of parallel oil film thickness on leakage, friction, and total power loss.
Energies 14 01961 g014
Figure 15. Under the selected working conditions, optimization, influence of micro-chamfering parameters on total power loss, where (a) is under the different widths (LC) for the same depths; (b) is under the different depths (HC) for the same widths.
Energies 14 01961 g015
Figure 16. Simulation results of C1.2-3.5 under the selected working conditions, where (a) is the oil film thickness; (b) is the leakage, friction and total power loss of the slipper/swashplate interface.
Energies 14 01961 g016
Figure 17. The friction power loss testing platform for the slipper/swashplate interface. (a) Schematic diagram. (b) Platform picture.
Energies 14 01961 g017
Figure 18. Simulation results of friction power loss of the slipper/swashplate interface.
Energies 14 01961 g018
Figure 19. Experimental results of friction power loss of the slipper/swashplate interface. (a) Under the working pressure of 10 MPa. (b) Under the shaft speed of 1500 r/min.
Energies 14 01961 g019
Figure 20. Simulation results of friction power loss of the slipper/swashplate interface. (a) Under the working pressure of 10 MPa. (b) Under the shaft speed of 1500 r/min.
Energies 14 01961 g020
Table 1. Parameters used in the lubrication model.
SymbolsValueUnits
Rf33.5mm
rHSin5.9mm
rHSout10.7mm
lHK2.9mm
dHK0.8mm
lHC0.9mm
Cq0.63-
K2GPa
μ0.02784N·s/m2
γ18°
pHouse0.1MPa
pL10MPa
ω1500r/min
Table 2. Different micro-chamfering widths and depths
WidthLC (mm)
Depth 0.51.01.52.0
HC (μm)1C0.5-1C1.0-1C1.5-1C2.0-1
3C0.5-3C1.0-3C1.5-3C2.0-3
5C0.5-5C1.0-5C1.5-5C2.0-5
10C0.5-10C1.0-10C1.5-10C2.0-10
Table 3. Comparison between the analytical and simulation optimization results.
ParametersAnalytical ResultsSimulation Results
h (μm)5.631035.80803
PQ (W)4.992.57
PF (W)15.3222.07
PT (W)20.3124.64
Table 4. Average friction power loss under different shaft speed with working pressure of 10 MPa.
Shaft Speed
(r/min)
Average Friction Power Loss (W)
Experimental ResultsSimulation Results
100021.86421.104
150034.37233.795
200051.55550.748
Table 5. Average friction power loss under different working pressure with of shaft speed 1500 r/min.
Working Pressure
(MPa)
Average Friction Power Loss (W)
Experimental ResultsSimulation Results
528.82327.611
1034.37233.795
1539.77738.938
Publisher’s Note: MDPI stays neutral with regard to jurisdictional claims in published maps and institutional affiliations.