Article

Thermal Performance Analysis of Heat Collection Wall in High-Rise Building Based on the Measurement of Near-Wall Microclimate

1
School of Civil Engineering, Zhengzhou University, Zhengzhou 450001, China
2
Institute of Construction and Architecture, Moscow State University of Civil Engineering, 129337 Moscow, Russia
*
Author to whom correspondence should be addressed.
Energies 2021, 14(7), 2023; https://doi.org/10.3390/en14072023
Submission received: 6 March 2021 / Revised: 29 March 2021 / Accepted: 31 March 2021 / Published: 6 April 2021
(This article belongs to the Section B: Energy and Environment)

Abstract

:
Near-wall microenvironment of a building refers to parameters such as wind speed, temperature, relative humidity, solar radiation near the building’s façade, etc. The distribution of these parameters on the building façade shows a certain variation based on changes in height. As a technology of passive heating and ventilation, the effectiveness of this application on heat collection wall is significantly affected by the near-wall microclimate, which is manifested by the differences, and rules of the thermal process of the components present at different elevations. To explore the feasibility and specificity of this application of heat collection wall in high-rise buildings, this study uses three typical high-rise buildings from Zhengzhou, China, as research buildings. Periodic measurements of the near-wall microclimate during winter and summer were carried out, and the changing rules of vertical and horizontal microclimate were discussed in detail. Later, by combining these measured data with numerical method, thermal process and performance of heat collection wall based on increasing altitude were quantitatively analyzed through numerical calculations, and the optimum scheme for heat collection wall components was summarized to provide a theoretical basis for the structural design of heat-collecting wall in high-rise buildings.

1. Introduction

Since the 20th century, global population growth, energy consumption, and environmental pollution have gradually gained an increased focus worldwide. These urgent problems bring out new needs to the pattern of energy supply and demand. According to the latest world energy outlook British Petroleum (2020 edition) [1], estimates show that by 2050, the percentage of oil, gas, and coal in global energy total would drop from 85% in 2018 to a 20–65% range, while renewable energy proportion would rise from 20–60%, respectively. Buildings are one of the essential parts of energy consumption, which accounts for 39% of the total consumption. According to data from the International Refrigeration Association, the power consumption of the refrigeration and air conditioning industry accounts for about 15% of total power consumption in the world [2].
Since 1950, the world urbanization rate has increased from 29.2 to 57.4%, and the urban population has increased from 734 million to 4488 million. Urbanization in China has been developing rapidly for nearly twenty years. According to statistics, by the end of 2019, the total population occupied by the mainland was about 1.4 billion, of which 60.60% belonged to permanent urban residents (the urbanization rate of permanent residents), and 44.38% of them were registered as permanent residents. Urban area and population density in cities have increased rapidly, and the increase of high-rise buildings has brought huge pressure on heating and cooling energy requirements. The heating demand during winter greatly increases the energy consumption of buildings in Northern China, as a result, the consumption of heating energy per unit building area in China is much higher than that of developed countries with similar climatic conditions. Therefore, reducing energy consumption and saving energy have become the main melody of the current era, as the requirements development and utilization of renewable energy have become an inevitable trend. Renewable energy can be used in buildings in a variety of forms, including hydrogen [3], solar [4], wind and so on.
By reducing the energy consumption in buildings, people are also pursuing indoor thermal comfort, which puts forward higher requirements for ventilation, heating, and air conditioning systems in buildings. Passive building technologies have gradually started to attract people’s attention from which solar energy has been widely used in building heating and ventilation, due to its wide sources, convenient development, utilization, with its advantages of photothermal and photoelectric conversion. The heat collection wall structure collects solar energy to enhance natural ventilation in summer and heat preservation in winter, which is of great significance concerning relieving energy pressure and promoting the development of sustainable buildings. Through experimentation, some scholars have proposed that the heat collection wall structure could reduce energy consumption [5,6,7,8], improve the thermal environment in winter and the indoor airflow during summer [9,10,11,12,13]. With the development of the heat collection wall technology, people have put forward a series of research optimization, such as the PV-Trombe wall [14,15], the optimization of the airflow cavity [16], the application of fin to strengthen heat transfer [17], prefabricated Trombe wall [18], the new system combined with the solar chimney [19], and the application of phase change materials [20], etc.
It can be seen that in recent years, the current application and research of heat collection wall technology focuses mainly on low-rise buildings in villages and towns having abundant resources of solar energy. With the increase in urbanization, the heating and ventilation of urban high-rise buildings have produced a considerable amount of energy consumption. To meet this energy shift of demand, the application of the heat collection wall on high-rise buildings can play an important role in improving the heating and ventilation conditions of urban residents, relieving pressure in the construction of the urban heating network, and reducing energy consumption. However, there is a lack of relevant literary research, which cannot fully explain these complex problems this technology is facing in its application on high-rise buildings. In the application of heat collection and storage wall, the heat transfer process is affected by its structural parameters (such as air sandwich thickness, tuyere shape, and size), the Ra number, heat transfer temperature difference, and other factors [21,22,23,24,25,26]. When it comes to the application of heat collection and the storage wall in high-rise buildings, we should consider the change in the outdoor microenvironment that could affect the heat transfer performance of the heat collecting wall. Thus, the design of the heat collection wall should be adapted to the outdoor microclimate to ensure the uniformity and comfort of the thermal environment inside the same building, which has important research significance.
Existing literature also focuses on the change of the microclimate outside the building, which refers to the wind, sunlight, radiation, temperature, and humidity conditions at ground level around the building, also at specific locations such as, roof, wall, and the window sill [27]. Studies on microclimate have focused on three levels: the city, community, and a single building. In terms of cities, scholars have long proposed such phenomena as the greenhouse effect and gradient wind effect that have impacted the urban microclimate. If the building is located in a metropolitan area, it may be affected by the local heat island as Virgilio [28] found, its estimated consumption due to the cooling was underestimated by 35–50% according to a case study in Italy. Battista [29] investigated different strategies through ENVI-met (The Environment for Visualizing Images) software to mitigate overheating in a university campus. At the community level, some have paid attention to the influence of building elevation on the parameters of temperature in the surrounding microclimate [30,31,32], such as Mehaoued [30] studied the impact of reflective glass on the surrounding microclimate of existing buildings. And some studies have also focused on the influence of building shape [33] and its layout [34] on the wind environment of the pedestrian height in the community. Bherwani [33] studied the influence of the building shape and wind direction on the pedestrian horizontal wind, wind speed ratio was used to evaluate the wind environment, and discussed the influence of tree shading and the arrangement of the outdoor microclimate at a single building scale. Teshnehdel [35] simulated the air temperature and humidity, the average radiation temperature, and the physiological equivalent temperature in the building area under different vegetation. Castaldo [36] proposed a multi-scale microclimate method of improvement and analyzed the heat transfer performance in a residential near-zero energy area. And Zaki [37] evaluated the outdoor air temperature of different sheltered areas in a university campus under the conditions of hot and humid climate.
When it came to individual buildings, some scholars conducted field measurements to find out the influence of factors in the outdoor microclimate, such as height [38,39,40,41], orientation [42,43], and surrounding buildings [44]. Moghbel [45] measured the parameters of two different roofed buildings and found that the indoor air temperature and the average air CO2 concentration of the green-roofed buildings were lower than those of asphalt roofed buildings. Wilde [46] found that the performance of the building was largely determined by the exposed microclimatic conditions. Moreover, Bouyer [47] proposed a CFD and thermal radiation coupling model to evaluate the energy consumption of the building. Yi [48] proposed an indoor and outdoor coupling simulation evaluation framework for microclimate change to demonstrate the influence of outdoor microclimate on the indoor thermal performance of the buildings. Tejedor [49] proposes the implementation of a 2D U-value map to quantify the influence of thermal bridges on building facades by internal quantitative infrared thermography.
According to the related studies on the microclimate of individual buildings, the near-wall microclimate of a single building could be affected by many factors, such as height, orientation, group shadow, and urban gradient wind, etc. When solar radiation is high, the temperature difference of the outer surface in different orientations can be among 2 °C, thermal upwelling on the exterior surface of the building which is easily induced. On the other hand, the single simplified structure of the heat collection wall may cause indoor temperature delamination, uneven air distribution, overheating in summer, heat transfer problems in winter, and thus it cannot provide a comfortable indoor environment and achieve an ideal energy-saving effect. Therefore, it is particularly important to discuss the differences in the characteristics of heat transfer due to near-wall microclimate change in high-rise buildings.
To find out the change rule in a near-wall microclimate of an individual building and the differences in heat transfer characteristics caused by near-wall microclimate change on high-rise buildings in the city area under the same outdoor environment, and explore the suitability of the heat collection wall design based on the vertical and horizontal scale, in this paper, some existing projects in Zhengzhou were selected as objects, of which their near-wall microclimate parameters were measured periodically, including the velocity of the surface attached airflow, solar radiation received, temperature and humidity at a different height. A mathematical model of the typical heat collection wall was established with the corresponding thermal equilibrium equations, and the previously measured data were used as the outdoor parameters. A numerical method was used to discuss the difference in thermal performance of the heat collection wall with the change of height, and a reasonably designed structural method was proposed to provide theoretical support for the adaptive design of the heat collection wall in high-rise buildings.

2. Methodology

According to the 2018 National statistics of China, the National commercial housing sales area was 1.71464 billion m2, of which residential housing accounted for 86.2% of the sales. At the same time, China’s floating population had reached 247 million, of which 70% live in rented houses. This provided a good market demand for the studio industry. It can be seen that studios and apartment buildings take up a large proportion of the current urban high-rise buildings, which is of great representativeness and research significance. The main objectives of this study were to clarify the regular of near-wall microclimate change of urban high-rise residential buildings and evaluated the thermal performance of the heat collection wall on this basis. The relationships between the indoor thermal environment, microclimate of near-wall south-facing and outdoor climate were examined.

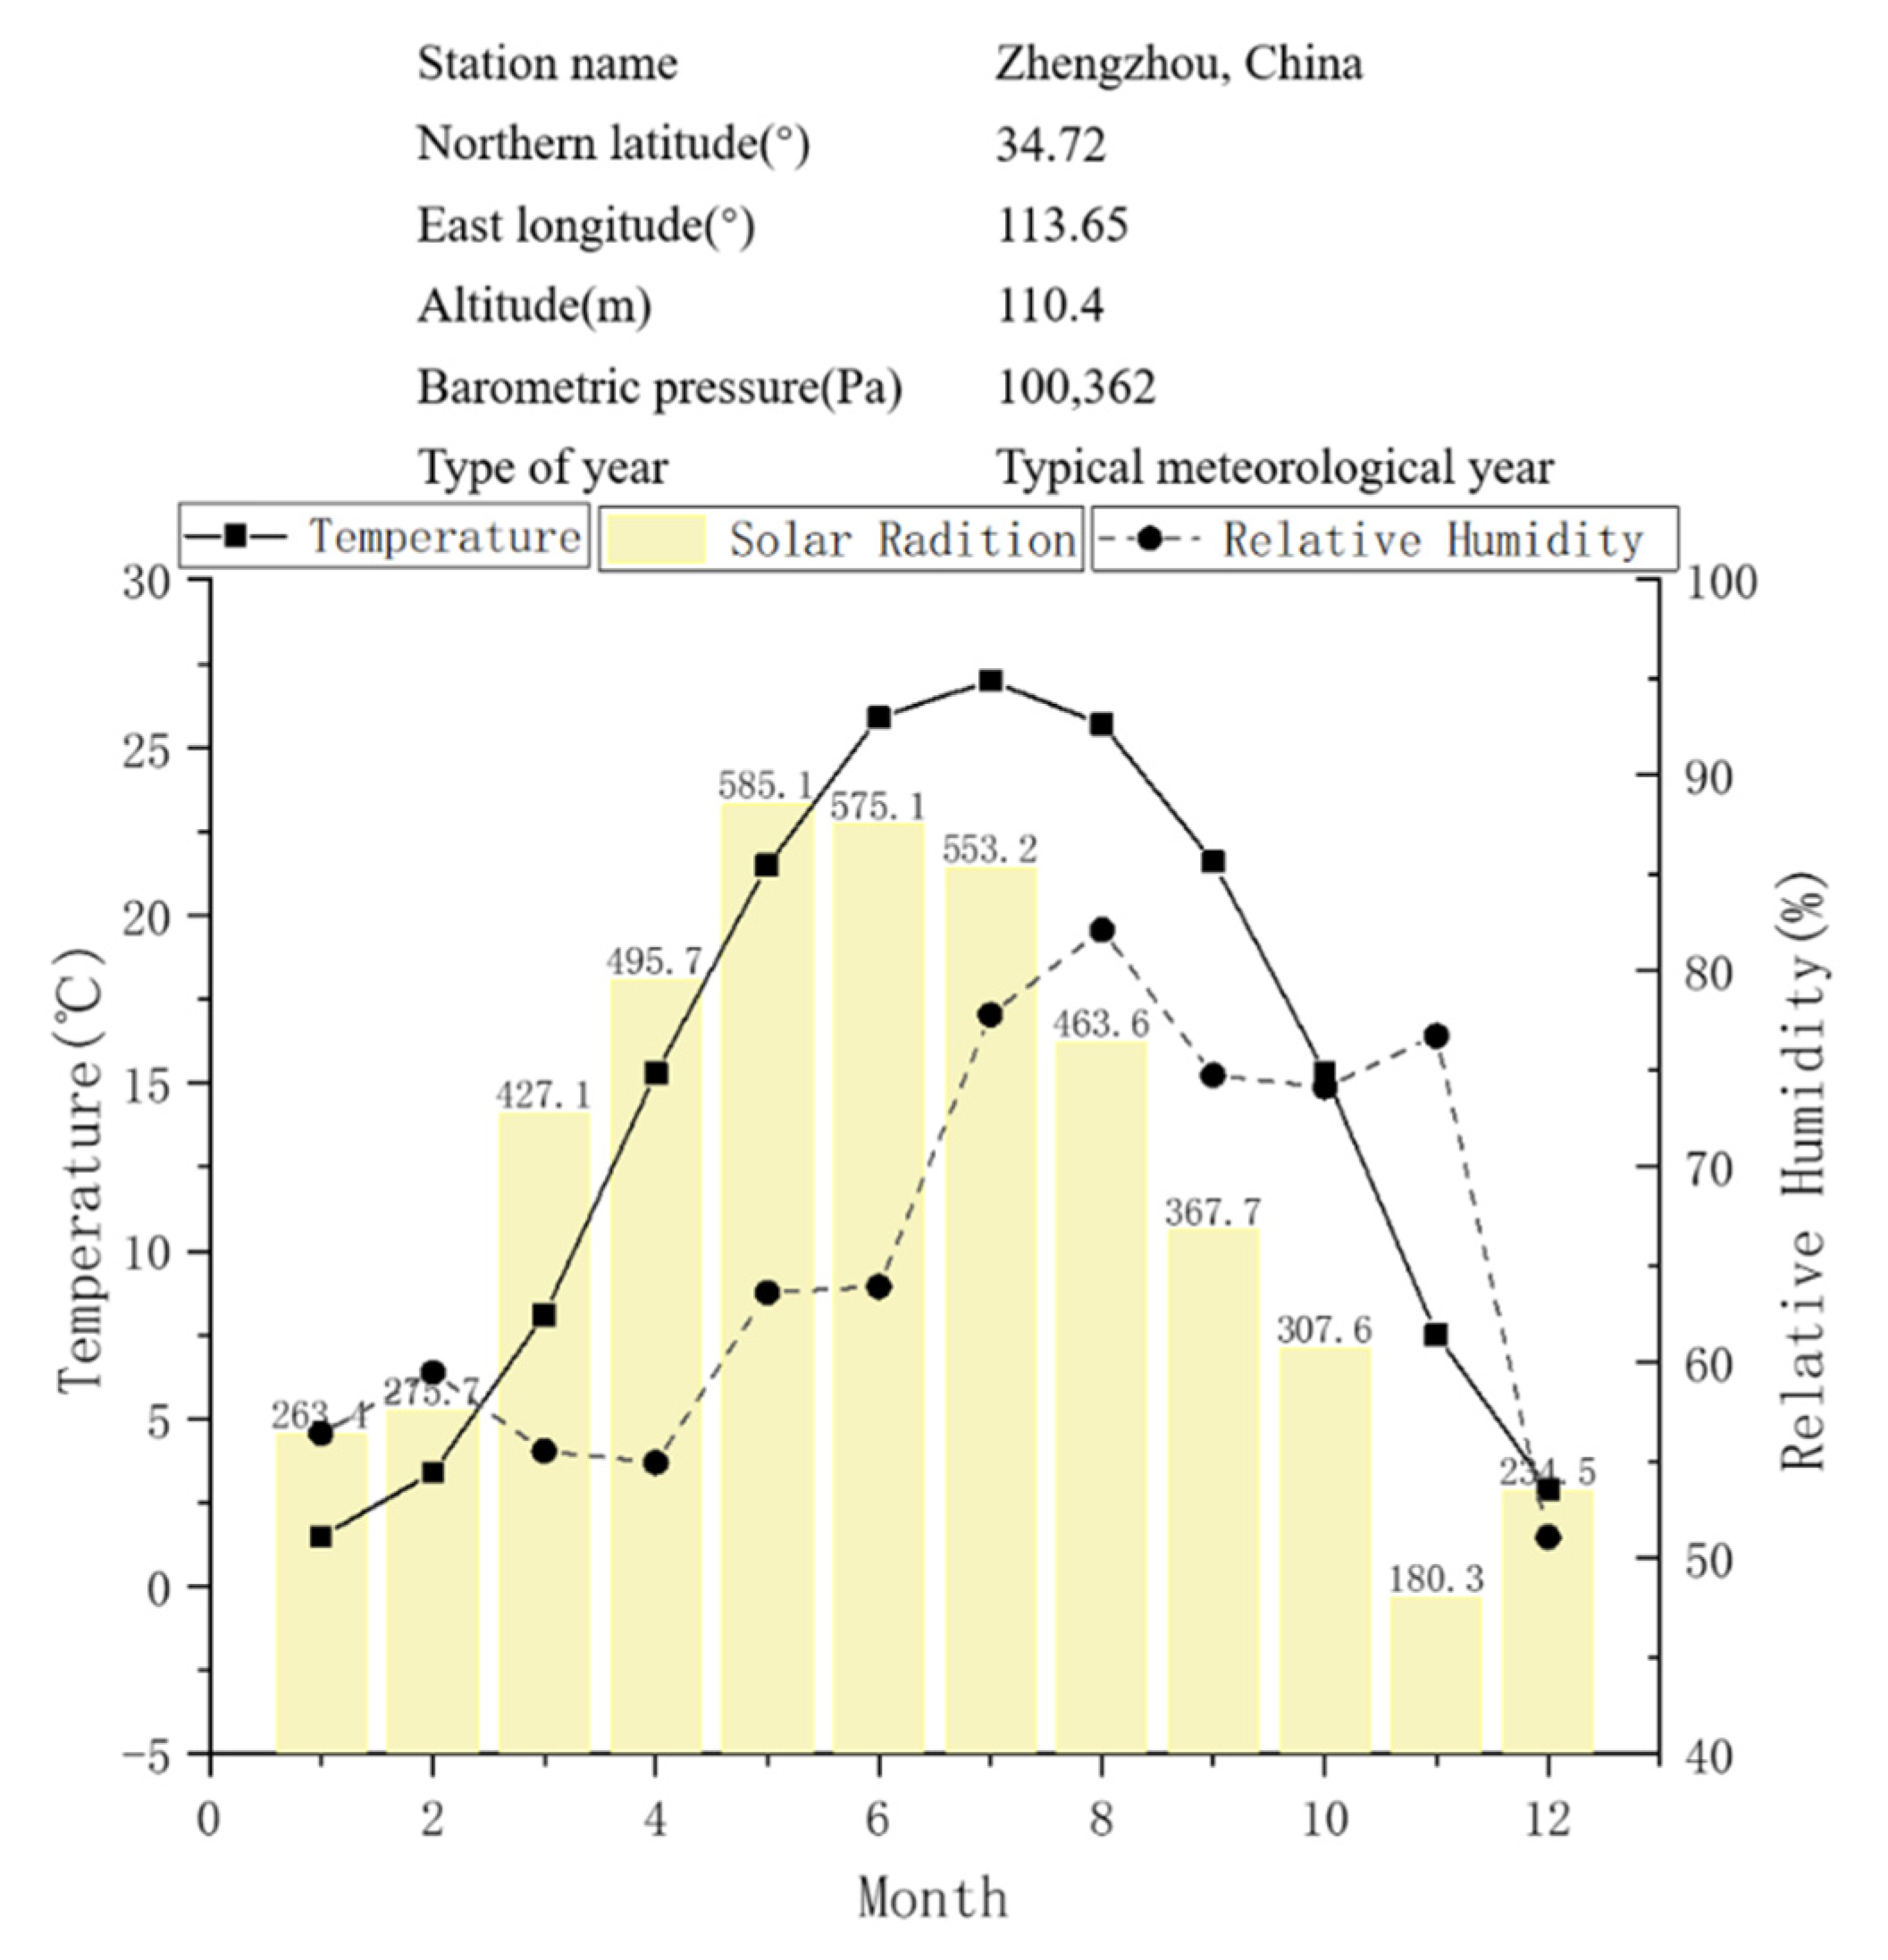
2.1. Research Area and Climate

This study conducted a field measurement of three buildings in Zhengzhou which is located in the south of the warm temperate zone and experiences the continental monsoon humid climate. According to the regulations of Thermal Climate Area Zone of Chinese Architecture, Zhengzhou belongs to a primarily cold region and the third-level area of solar energy resources in China (the annual sunshine duration is 2200–3000 h). The urbanization rate of Zhengzhou city is 74.6%, and its permanent resident population is 10.352 million with commercial housing sales area of 35.93 million m2. In Figure 1, it can be seen the monthly average temperature, relative humidity and monthly total solar radiation, which are from the annual report of typical meteorology in Zhengzhou (the unit of monthly total solar radiation is MJ/m2).

2.2. Test Buildings

A studio-building and two apartment buildings from Zhengzhou were taken as the test buildings. The building envelope wall is composed of cement mortar, external insulation layer, and aerated concrete blocks. None of the three buildings has external sunshade systems. More details of the three buildings are listed in Table 1 and Table 2, the locations, photographs, and shapes of buildings are shown in Figure 2.

2.3. Measurement Campaign

According to the aforementioned studies, it can be seen that near-wall microclimate will affect surrounding temperature, concentration of CO2, surface heat transfer coefficient and other thermal performance of ordinary single buildings. As for the application of heat collection wall on high-rise buildings, it will affect the heat transfer process and thermal efficiency of heat-collecting wall components. Thus near-wall microclimate measurement campaigns of different buildings were carried out to find out how microclimate parameters change on buildings’ façade. As for the selection of measurement time, we conducted tests in December and August of China’s typical meteorological year and conducted outdoor near-wall microclimate tests in winter and summer, respectively. According to previous studies, Lin et al. [38] conducted a 20-day test of microclimate parameters outside a five-story building. And Pan [41] carried out a measurement in a short period and analyzed the near-wall parameters of a super high-rise building in one day. It was found that the test results were consistent with those of Lin, which proved the validity of the short-term test data. Zhang et al. [42,43] also used three-day observation data to analyze the outdoor microenvironment in Kunming and Beijing, China. Moreover, Sa [50] designed several test cycles ranging from one day to three weeks to measure the thermal performance of the heat-collecting wall under different working conditions. Moreover, to reduce instrument errors, the instruments used have been calibrated, and in data processing, the average values of 50 min, 55 min, 0 min, 5 min and 10 min are selected as data at 0 min. This method refers to the previous literature [41,42].

2.3.1. Measurement Campaign in Winter

To explore the vertical and horizontal distribution rules of the near-wall microclimate of a high-rise building and to quantitatively evaluate the influence of the near-wall microclimate specificity on the thermal performance of the heat collection walls, in this paper, three buildings in Zhengzhou were measured in December 2019. A small weather station was set up on the roof to measure the wind speed, solar radiation intensity, outdoor temperature, humidity, and other measurement schemes as follows. The indoor temperature and the relative humidity measuring points were arranged in the center of the room, and the other measuring points were located on the southern wall. The detailed layout is shown in Figure 3 (The height of three measured buildings is different, so Building 1 was taken as an example.)
  • West of Building 1 (B1) measurement in winter: Measuring points were arranged in the south-facing rooms on the west side on the 2nd, 6th, 14th, 18th, and 22nd floors of the 22-story building. Presuming that the skirt house would affect the test results, the measuring points were not arranged on the 10th floor. The solar radiation meters were arranged in the south-facing rooms on the 2nd and 22nd floors, respectively, to measure the vertical solar radiation of the same building.
  • Middle of Building 1 (B1) measurement in winter: Measuring points were arranged in the south-facing rooms in the middle of the 2nd, 6th, 14th, 18th and 22nd floors of this 22-story studios building in contrast to the west side.
  • Building 2 (B2) measurement in winter: Measuring points were arranged on the 3rd, 5th, 8th, 12th, and 15th floors of the southern wall of the 15-story apartment building.
  • Building 3 (B3) measurement in winter: Measuring points were arranged on the 3rd, 5th, 7th, 9th, and 11th floors of the southern wall of the 11-story apartment building.

2.3.2. Measurement Campaign in Summer

To contrast with the winter test results, the 11-story apartment building was selected for the measurement in summer. Moreover, the vertical and horizontal measurements were designed to explore the changing law of the microclimate near the facade of residential buildings as shown in Figure 4 which were carried out in August 2020. The measuring equipment and arrangement of measuring points were consistent with the aforementioned winter experiment. The measurement scheme is as follows.
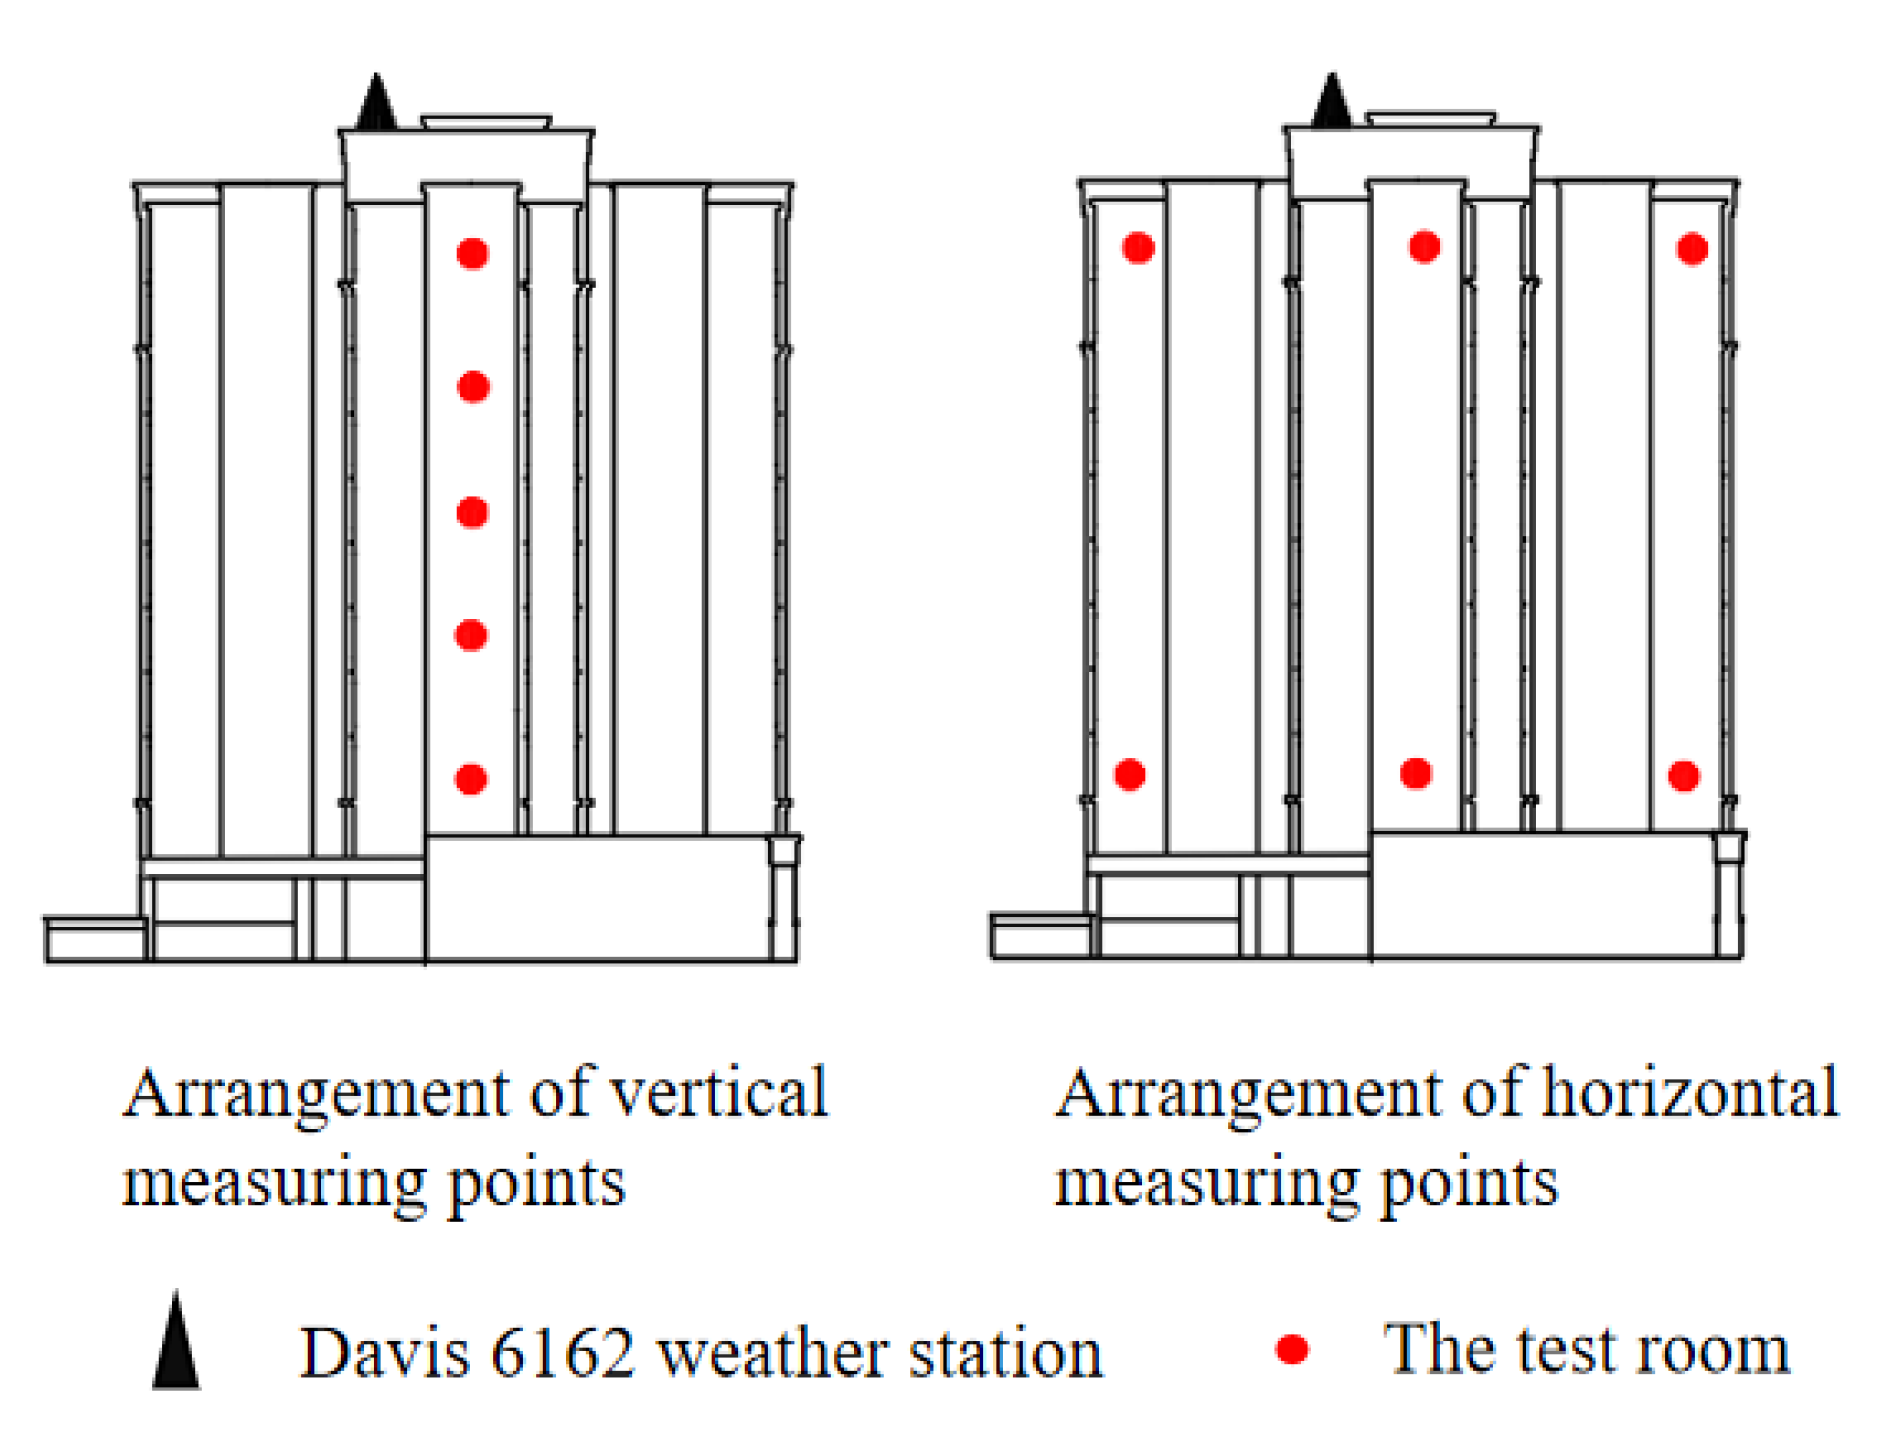
  • B3 vertical measurement in summer: Measurement points were arranged in the middle room of the southern wall on the 3rd, 5th, 7th, 9th, and 11th floors.
  • B3 horizontal measurements in summer: Measurement points are arranged in the three rooms on the 3rd and 11th floors, respectively.

2.3.3. Equipment

The following measurement parameters were determined as per the definition and literature of the near-wall microclimate; namely, air temperature and relative humidity, wind speed near the southern wall of the building, temperature, and relative humidity indoors and of the wall, furthermore the intensity of solar radiation. The measuring equipment is shown in Table 3.

2.3.4. Uncertainty Analysis

Uncertainty refers to the degree of uncertainty of the measured value due to the existence of measurement error. In order to evaluate the reliability of the data in this study and enhance the comparability between the measured results, uncertainty analysis was performed. Take the wall temperature data at 19:00 on December 7, 2019 as an example to calculate the uncertainty: the data at 18:50, 18:55, 19:00, 19:05, 19:10 are 3.5, 3.3, 3.2, 3.2, 3.1, respectively. The instrument is a RC-4 temperature and humidity recorder with an accuracy of ±0.6 °C. The calculation process is as follows.
In the direct measurement, type A evaluation of uncertainty is calculated by Bessel formula: Δ A = i = 1 n ( x i x ¯ ) 2 n ( n 1 ) = 0.068 , type B evaluation of uncertainty is generally evaluated by considering the maximum error of the equipment: Δ B = Δ Equipment 3 = 0.346 , and the resultant evaluation of uncertainty is calculated as following: Δ = Δ A 2 + Δ B 2 = 0.353 . Now the temperature is 3.26 ± 0.353 °C.

2.4. Equations Used in Analysis

2.4.1. Heat Balance Equation

1.
Heat balance equation of the glass cover plate
Q g s u n + Q g w = Q g a + Q g c
Q g s u n = α g I A g —Amount of solar radiation absorbed by the glass cover;
Q g w = ε g σ A g ( ( t g + 273 100 ) 4 ( t w + 273 100 ) 4 ) —Radiation exchange glass cover and heat-collecting wall;
Q g a = h g a A g ( t g t a ) —Heat transfer by convection between the glass cover and the outdoor air;
Q g c = h g c A g ( t g t m ) —Heat transfer by convection between the glass cover and the air layer.
2.
Heat balance equation of the air layer
Q g c + Q c w = Q m
Q c w = h c w A w ( t w t m ) —Heat exchange by convection between the heat-collecting wall and the air layer;
Q m = m c p ( t o t i ) —The amount of heat absorbed as the air temperature rises in the interlayer.
3.
Heat balance equation of heat-collecting wall
Q w s u n = Q w + Q g w + Q c w + Q w i
Q w s u n = α w β I A w —The amount of solar radiation absorbed by the heat-collecting wall;
Q w = λ A w t w t i l —Heat conduction through the heat collecting wall;
Q w i = h w i A w ( t w t i ) —Heat transfer by convection between the wall and the indoor air.
4.
Thermal balance equation of the room (the rest of the envelope is insulated surface)
Q g s u n + Q w s u n + Q s Q g a = Q i n
Q s —Heat source in the room;
5.
Parameter calculation
When calculating the above equations of heat balance, some parameters are calculated as follows [51,52]:
h g a is the convective heat transfer coefficient between the glass cover plate and the outdoor air, and the calculation formula is:
h g a = 5.7 + 3.8 × V
where V is the outdoor wind speed, which is obtained from the experimental data; m is the air mass flow rate through the air interlayer of the heat collecting wall, and its formula is:
m = v A g ρ
where v = 2 g h v ( t m t i n ) 8 ( A g A v ) 2 × t m is the air mass flow rate through the air interlayer of the heat collecting wall; A g is the cross-sectional area of the air sandwich in the hot wall; ρ is the air density when the temperature is t m ; h v is the vertical distance of the center of the lower tuyere on the heat collecting wall.
h g c is a variable that depends on the airflow state in the interlayer of the heat-collecting wall. Its calculation formula is as follows:
R e 2000 ,   h g c = ( 4.9 + 0.0606 ( R e P r D h h v ) 1.2 1 + 0.0856 ( R e P r D h h v ) 0.7 ) λ l
R e > 2000 ,   h g c = ( 0.0158 R e 0.8 ) λ l
where P r is Prandtl number; R e is Reynolds number; λ is the thermal conductivity of air; l is the thickness of the air cavity; D h is the equivalent diameter of the air cavity.
In the mathematical model of the heat collecting wall, t a ,   t i ,   I ,   V can be obtained through experimental data. The mathematical calculation model of the heat collection wall is established, and unknown quantities t g ,   t o ,   t m ,   t w ,   v are obtained through iteration to calculate the heat transfer performance of this heat collecting wall.

2.4.2. Natural Ventilation under the Action of Hot and Wind Pressure

In summer, the airflow in the heat collecting wall is affected by thermal pressure and wind pressure. The thermal pressure effect refers to the change in air buoyancy caused by changes in air density due to the temperature difference between the indoors and outdoors in certain areas. Wind pressure effect is the difference in wind pressure caused by obstacles encountered by wind, which forms a negative pressure zone on the leeward side of the building and positive pressure on the windward side of the building.
The calculation of natural ventilation under hot pressing is as follows:
Δ P 1 = ρ g h v α × ( t i n t a )
m 1 = C d A 2 Δ P 1 ρ
where α is the air expansion coefficient; C d is the flow coefficient; A is the tuyere area.
The calculation of natural ventilation under wind pressure is as follows:
Δ P 2 = 1 2 ε ρ v 2
m 2 = ρ v A
where ε is the local resistance coefficient of the tuyere; v is the velocity of air.

3. Results and Analysis

3.1. Results and Analysis of Winter

3.1.1. Solar Radiation in Winter

As shown in Figure 5, no significant delay was found in the duration of sunshine and no significant difference in the intensity of solar radiation at different heights. The maximum solar radiation during the day can be more than 600 W/m2, which satisfies the requirement of the solar energy collecting wall; thus, proves the feasibility and tremendous potential of the application of solar energy collecting wall in Zhengzhou.

3.1.2. Horizontal Analysis of Near-Wall Temperature of B1

Figure 6 shows the indoor and near-wall temperature changes of B1. tout-ave represents the average near-wall temperature of the five measuring points, Tout represents the outdoor temperature measured by the weather station, and tin-ave represents the average indoor temperature of the five measuring points. It can be seen that the temperature trend was tout-ave > Tout > tin-ave. It can be seen that the range of temperature change of the measuring points in the west is larger than that of the middle ones.
Figure 7 shows the variation of the vertical temperature difference of B1, which is the difference between the near-wall temperature present at the top and the bottom temperatures. The comparison shows that the average value and variance of the vertical temperature difference on the central wall are smaller than that in the west, indicating that the temperature fluctuation on the western wall is greater than that of the middle, which is greatly affected by the outdoor environment.

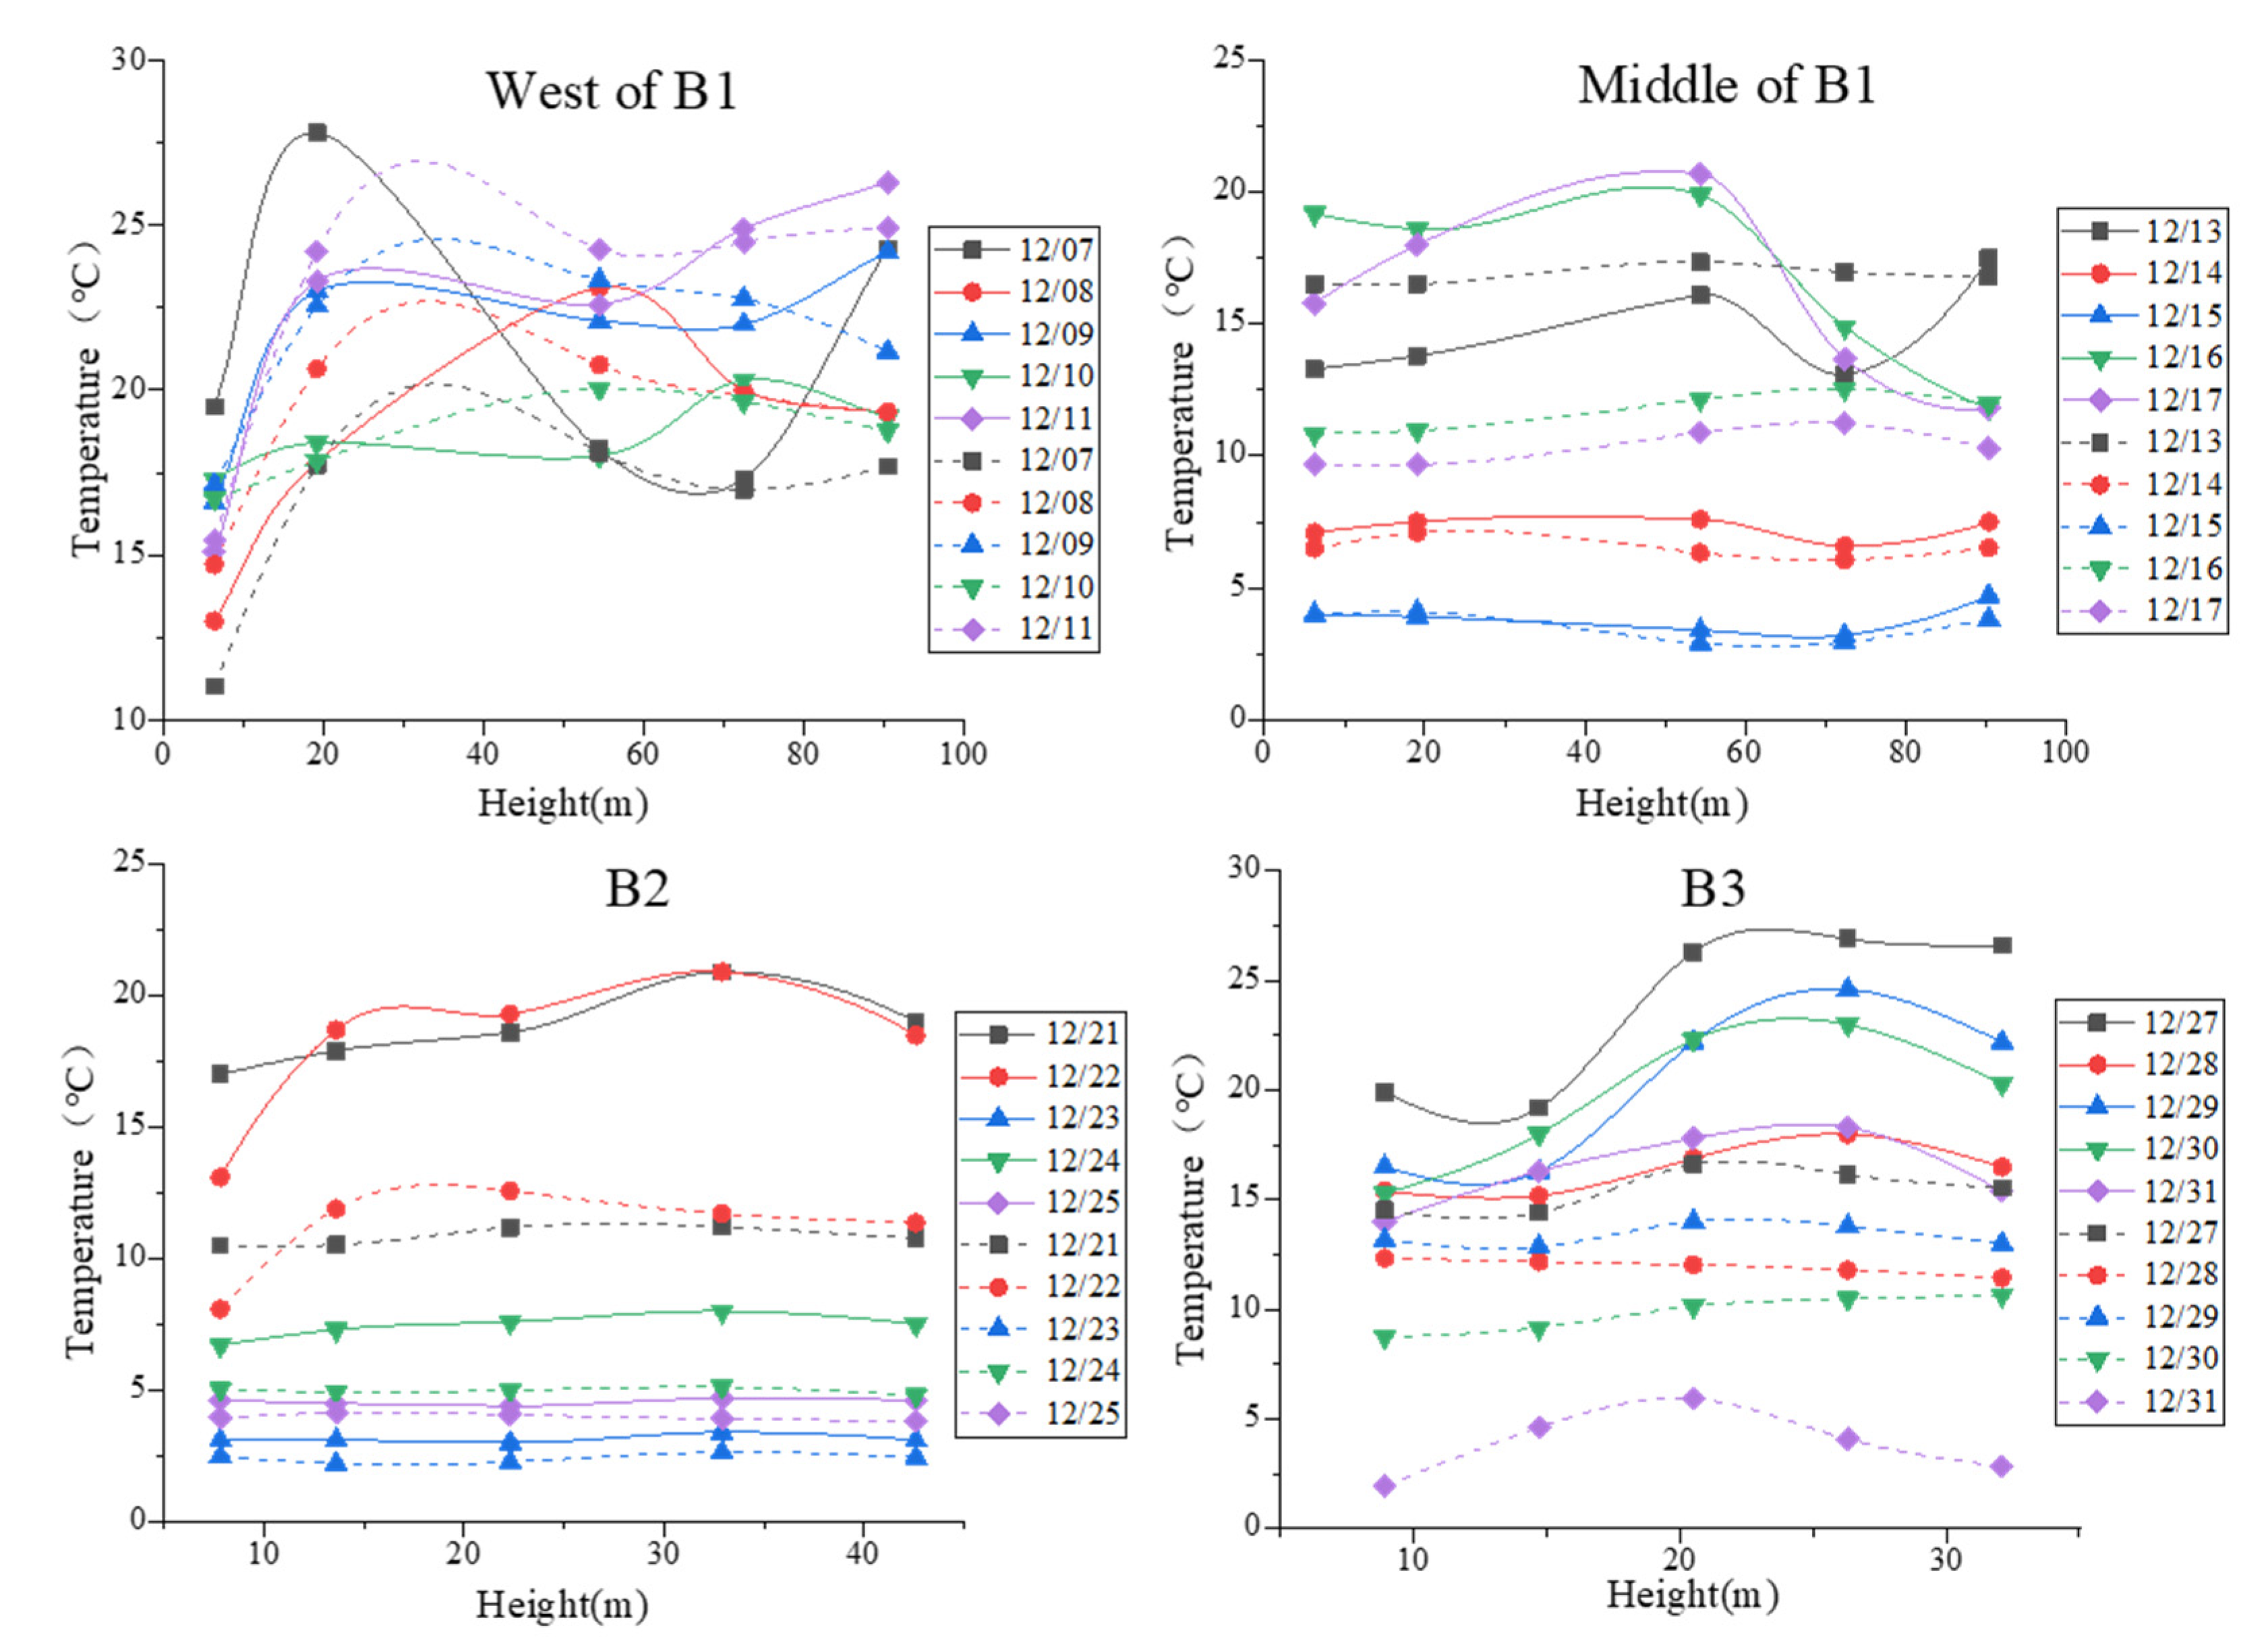
3.1.3. Vertical Analysis of Near-Wall Temperature of Three Buildings

To clearly describe the temperature distribution in the vertical direction, Figure 8 below shows the changes in the near-wall temperature and the adjacent temperature with height in the four test cycles. The solid line represents the near-wall temperature, and the dashed line represents the surrounding temperature (50 mm from the wall), which are obtained by the WFWZY-1 universal wind speed and wind temperature recorder. According to the test data, we find that the temperature fluctuated significantly with height from 11:00 to 15:00. Due to a large number of measured data, Figure 8 only shows the temperature at 12:00 every day which can best display the temperature change. For the 22-story studios B1, the outer wall temperature and surrounding temperature are presented as highly increased s-shaped fluctuations. Firstly, they increase as the height increases at the surface layer until it reaches a maximum of 23 m, and then reaches a minimum at 60 m, and then finally rises again. This process reflects the s-shaped change of temperature in the vertical direction, and the average amplitude of the two tests is 1.37 °C and 0.43 °C, respectively, which indicates that the western measuring point is more susceptible to airflow. For the 15-story and 11-story apartment buildings (B2 and B3), the temperature also presents S-shaped changes in the vertical direction, with a wave average amplitude of 0.39 °C and 0.27 °C, respectively. At the same time, the surrounding temperature is lower than the wall temperature, which is due to the heating effect after the wall absorbs the solar radiation is greater than the convective heat transfer effect between the wall and surrounding air.
To sum up, the outdoor temperature of the building presented an S-shaped fluctuation with the increase of height, which rises as the height increases in the surface layer and then gets fluctuated. This variation trend is related to the horizontal position and height of the building. The amplitude of the side of the building is larger than that of the middle, and the greater the height of the building, the larger the amplitude.

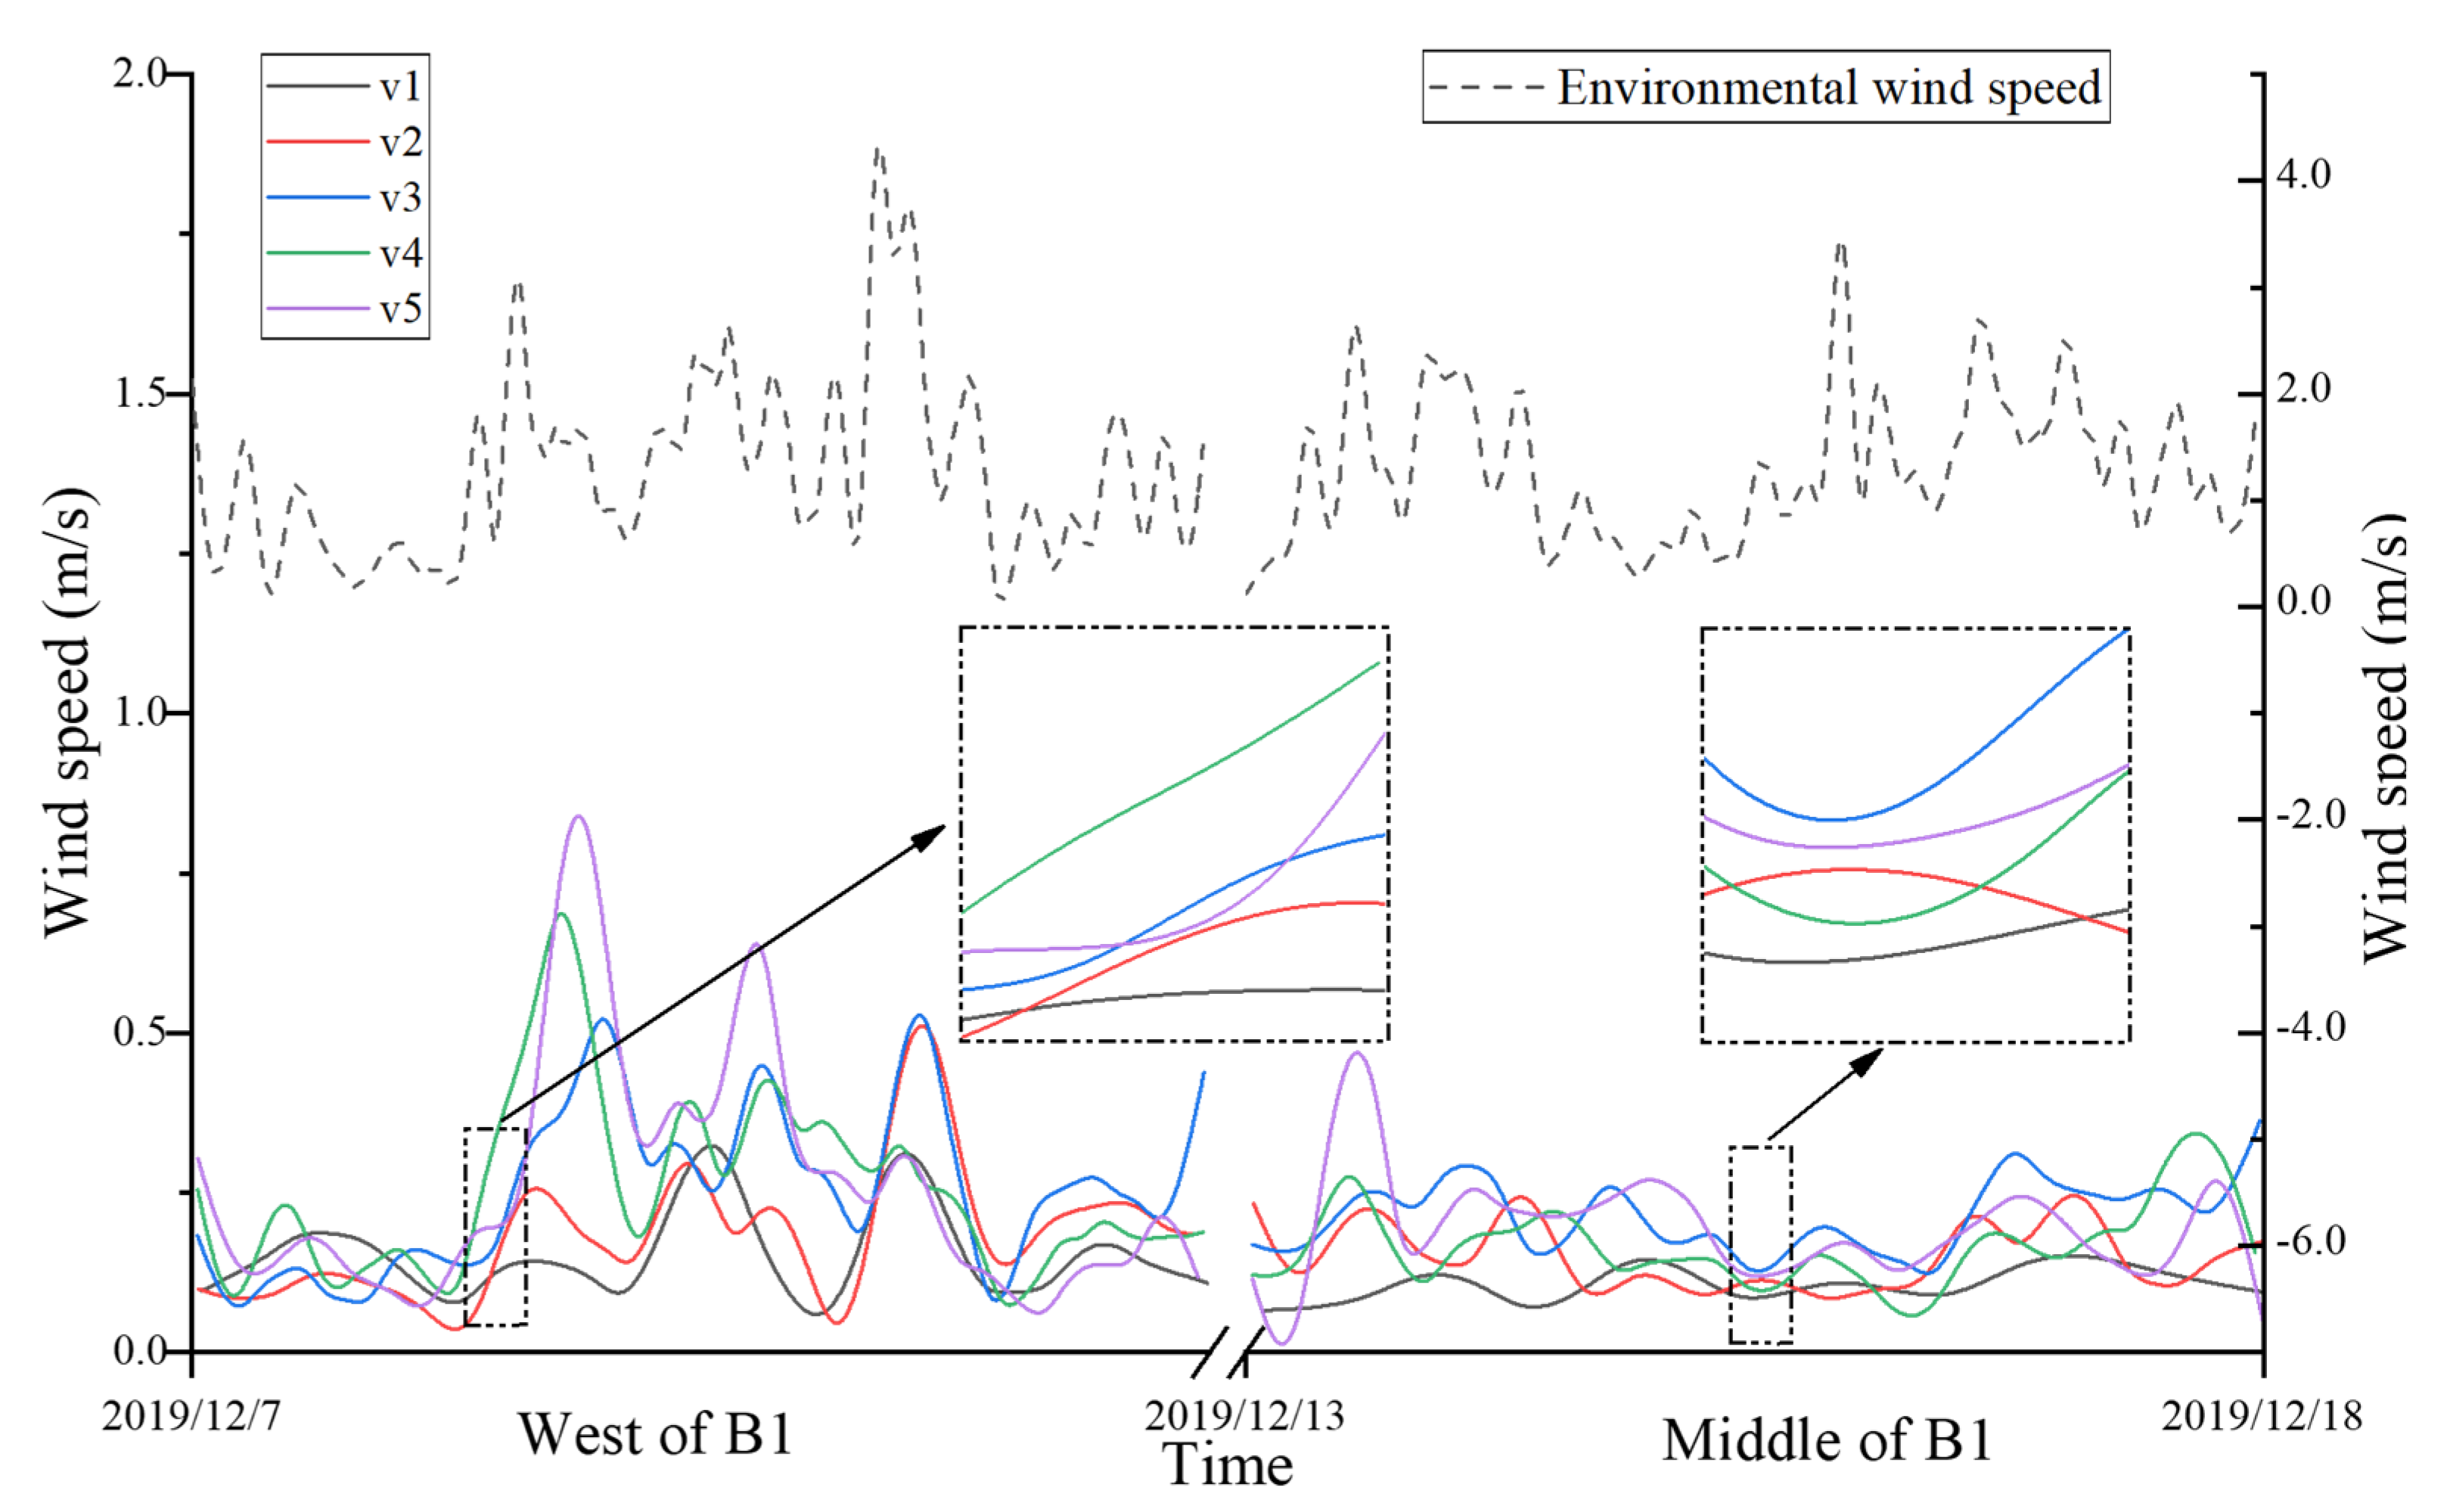
3.1.4. Horizontal Analysis of Airflow Velocity of B1

Figure 9 shows the comparison of wind speed of B1, in which v-i is the attached airflow velocity at the measurement point i. It can be seen that the attached air velocity fluctuates under ambient wind speed. While ambient wind speed remains the same, the average airflow velocity of the west-side reaches up to 2.146 times that of the middle, which indicates that horizontally, the side of the building is more susceptible to the influence of ambient air distribution. The airflow velocity of the west-side is greater than that of the middle, which lowers the temperature in the west and fluctuates greater than that in the middle.

3.1.5. Vertical Analysis of Airflow Velocity of the Three Buildings

To analyze the variation law of the near-wall updraft attached to the surface, the wind speed ratio (the percentage ratio between the wind speed at the measuring point and the environmental wind speed) was defined as a comparison parameter, so that the influence of the environmental wind speed could be ignored. The calculation results were shown in Table 4, and Figure 10 was carried out according to the results. It was found that in the vertical direction, similar fluctuation rules were shown in the four sets of data. At the near-surface layer, the wind speed increased with an increase of height, while at the top layer, it came to a plateau or remained flat. This is consistent with Max’s research theory on the urban gradient wind effect. He believed that the effect of outdoor wind speed and the wind pressure on the exterior surface of buildings increases gradually with the increase of height within a certain height limit.
Based on the above analysis regarding the distribution of wind speed on the building’s facade, it was found that the wind speed on the surface of the building presents the same trend in the vertical direction: the wind speed increases with the increase of height at the near formation, and it comes to a plateau or stayed flat at the top layer. The side of the building in the horizontal direction was more susceptible to the influence of environmental air distribution. The wind speed on the west side was greater than that present of the middle side, which reduced the temperature and caused greater fluctuations on the west. Different types of buildings showed different changes in wind speed. As shown in Table 3, the maximum difference of the average wind speed ratio of the four periods is 9.4%, 8.3%, 28.8%, 21.4%, respectively. The building’s facade with a small-sized body coefficient was more likely to form a stable wind field near the wall, which made the variation range of the attached airflow velocity smaller.

3.2. Results and Analysis of Summer

3.2.1. Near-Wall Temperature of B3 in Summer

The variation trend of the indoor and outdoor temperature of the test room of B3 were analyzed. The outer wall temperature, indoor temperature, and the outdoor temperature of the building presented the same fluctuation trend, which was consistent with the conclusions of the winter test, and hence it will not be repeated here. To intuitively find out the temperature distribution of the outer surface, the average wall temperature difference obtained from the summer test of B3 was used for horizontal and vertical interpolation. Figure 11 was obtained for the comparison of vertical and horizontal directions.
Horizontally, the temperature of the central measuring point is higher than that of the east and west measuring points. On the topmost floor, the average temperature of the wall surface of the central measuring point was 0.43 °C higher than that of the east side and 3.11 °C higher than that of the west side. On the bottom floor, the average temperature of the wall surface of the central measuring point was 1.89 °C higher than the east side and 1.81 °C higher than the west side. In the vertical direction, the temperature showed an s-shaped fluctuation, the average temperature at the measuring points gradually increased with the increase of height in the surface layer and fluctuated, and reached the extreme value in P4 at 9th floor, which was similar to the fluctuation rule in winter. However, the amplitude in summer (0.48 °C) was larger than that in winter (0.27 °C).
In short, the temperature distribution of this building in summer could be described as follows: An s-shaped fluctuation occurred in the vertical direction, and its amplitude was larger than that of in winter; in the horizontal direction, the temperature in the middle was higher than that on two sides, which was related to the distribution of wind speed.

3.2.2. Airflow Velocity of B3 in Summer

By calculating the wind speed data obtained from the two tests, it was found that there was a major difference between the average environmental wind speed of the two. Therefore, the ratio of the wind speed at the measuring point and the environmental wind speed was shown in Table 5 and was taken as a parameter, in order to draw the distribution diagram of the attached airspeed on its building wall as shown in Figure 12.
It was found that in the horizontal direction, the wind speed on both sides of the building was larger, and the wind speed in the middle was the smallest. In the vertical direction, the wind speed on the building surface was consistent with the winter fluctuation rule, with the maximum value appearing at P4, and the amplitude was found to be smaller than the winter variation.

4. Mathematical Calculation of Heat Collection Wall in High Rise Apartments

The corresponding heat balance equation of heat collection wall was established in this paper by considering the measured room to be the physical model and the mathematical model. The measured data were substituted into the calculation model as parameters of the wall envelope surrounding the wall, to study the change of heat transfer performance of the wall having the height. As the actual heat transfer process of the heat collecting wall is relatively complex with many influencing factors, the following simplified assumptions were made for the heat balance equation established:
  • Assume that the air is uniformly incompressible;
  • Assume that the glass temperature does not change along with thickness;
  • Assume that the solar heat collection and storage wall system shows steady-state heat transfer;
  • Ignore the influence of the change of relative humidity;
  • Ignore the influence of cold air penetration on the heat transfer process;
  • The rest of the envelope is an adiabatic surface.
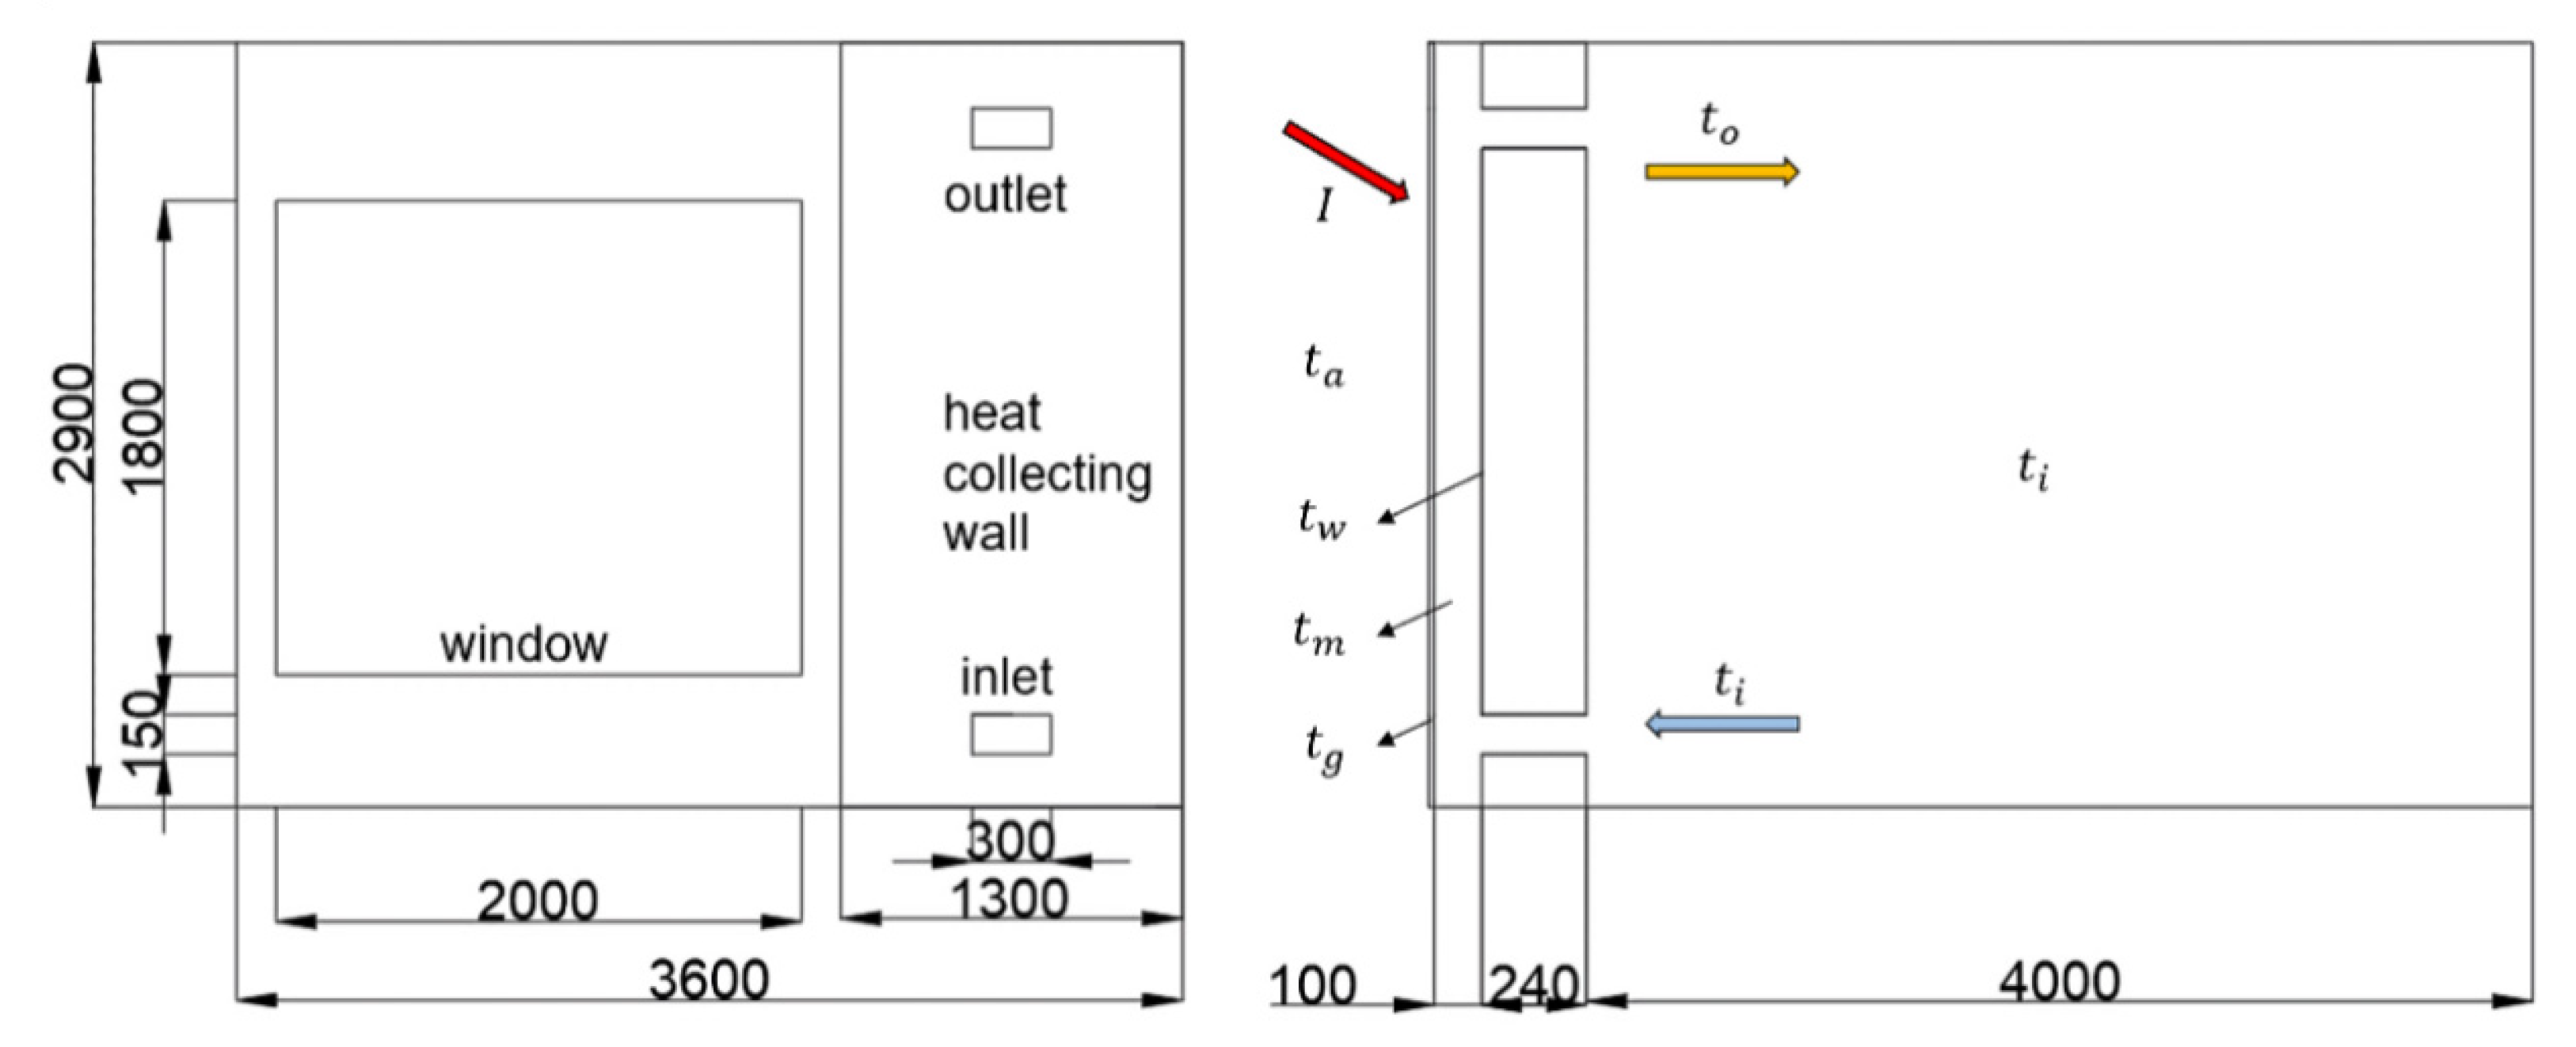
4.1. Physical Model

A room model of 3.6 m × 4 m × 2.9 m with a window of 1.8 m × 2 m on the south wall was determined as per the measured project. On this basis, a heat collection wall model of 2.9 m × 1.3 m was built on the southern wall. An interlayer thickness of 0.1 m and a ventilation holes size of 0.3 m × 0.15 m was chosen as the typical design of heat collection wall according to the literature [53]. The thermal physical property parameters of the heat collection wall model are shown in Table 6, and the calculation model of the heat collection wall is shown in Figure 13.

4.2. Calculation of Attenuation Delay of Heat Collection Wall

The transfer matrix of the plate wall’s thermal system expresses the relationship between the four boundary parameters of inner and outer surface temperature and the Laplace transform of the heat flow. Given any two parameters, the other two parameters can be obtained.
The attenuation multiples ν y n and time delay ξ y n of the wall to the sinusoidal temperature waves of different frequencies outside were calculated as follows when the temperature was kept at zero:
ν y n = A a n t i n = α r | B ( i ω n ) | = α r B ( i ω n ) R e s 2 + B ( i ω n ) I m 2
ξ y n = T 2 π ψ y n = T 2 π a r c t a n [ B ( i ω n ) I m B ( i ω n ) R e s ]
At night in winter, the ventilation hole of the heat collection wall is closed. MATLAB software is used to program and calculate its attenuation delay. The results are shown in Table 7:
It can be seen from the calculation results, the multiple attenuations and delay phases of the heat collection wall with its ventilation hole closed are higher than that of ordinary walls without heat collection structures. Within the same external disturbance, the indoor thermal environment will be more stable and comfortable.

5. Results and Discussion

5.1. Calculation Results during Winter

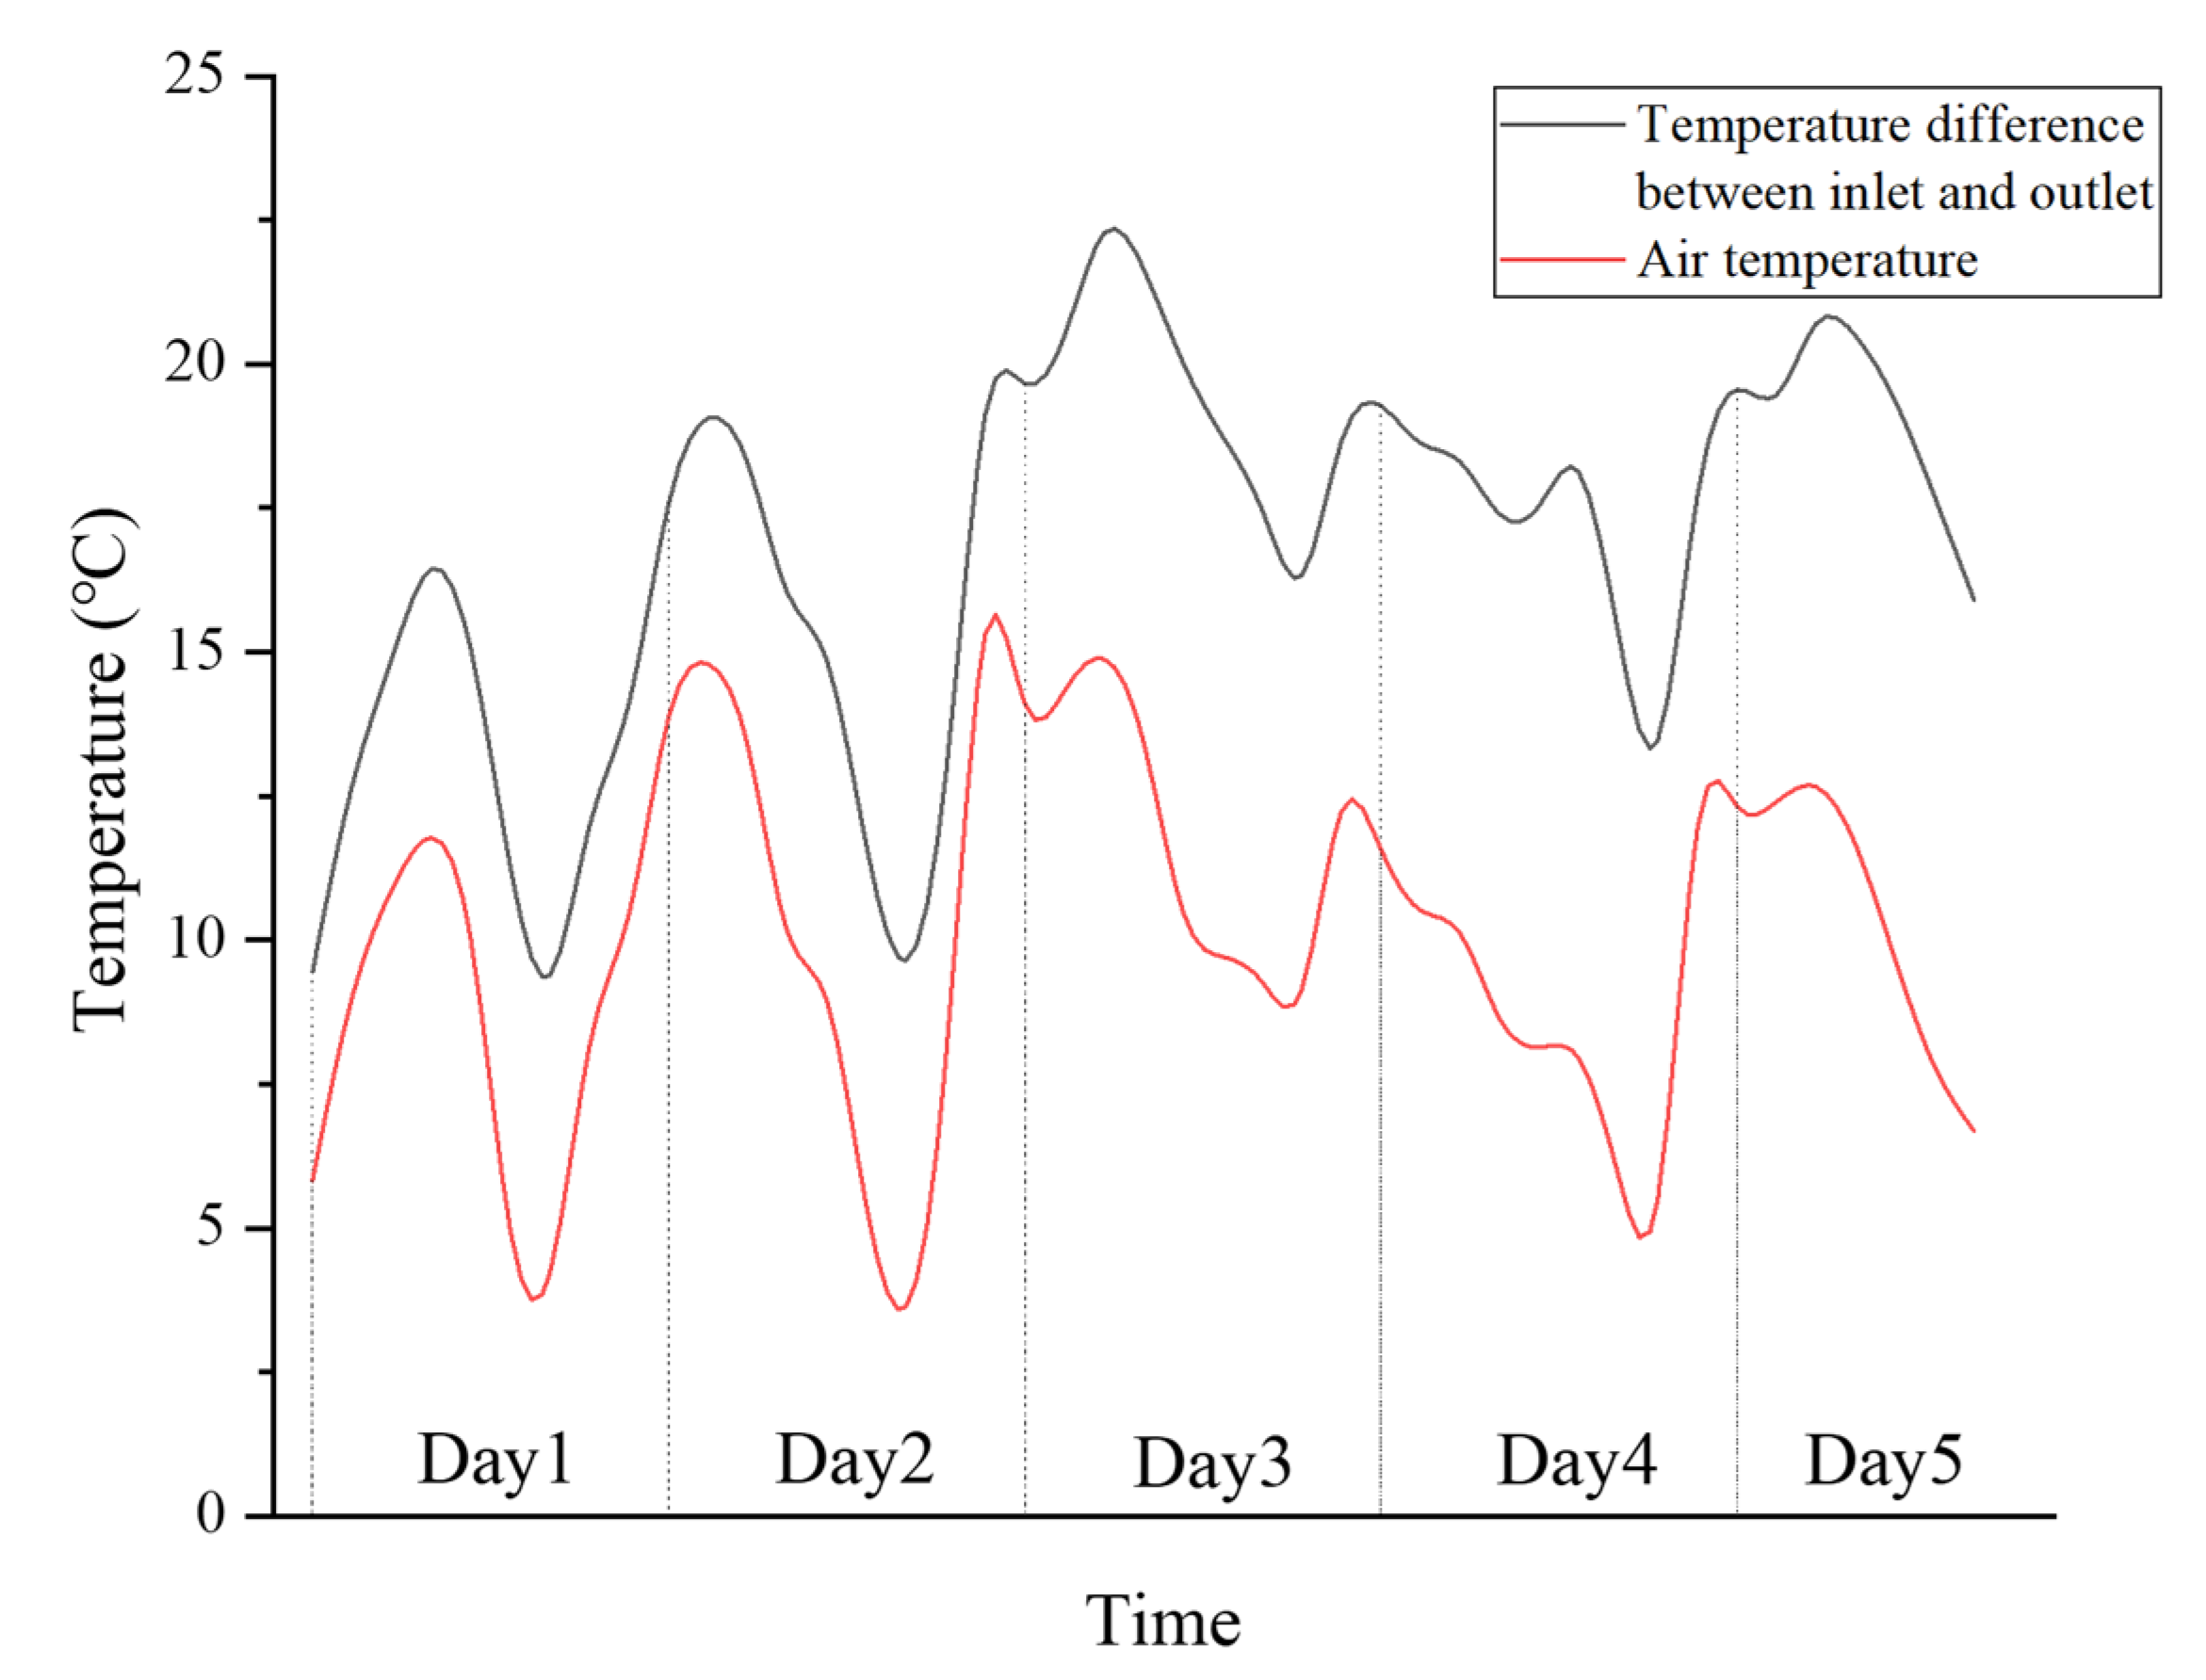
5.1.1. Temperature Difference between Inlet and Outlet

Because the vents of the heat collection wall are closed during the night, the data from December 7th to December 11th are chosen as the parameters of the solar radiation, and it was found that the solar thermal wall showed poor heat collection effect 2 h after sunrise and 2 h before sunset; thus, during this time, the vents should be closed for insulation. Therefore, the calculation results from 10:00 to 16:00 which were counted every 5 min were selected to draw the following chart Figure 14 and define calculation cycle time axis as Day 1–Day 5. According to calculation results, the temperature difference between inlet and outlet in winter can reach up to 19.61 °C, and the average value of each measuring point is 10.99, 12.11, 13.13, 12.79, and 11.25 °C, respectively.
The variation law between the inlet and outlet temperature difference of the heat collecting wall and the outdoor wind temperature is explored, and the Figure 15 below shows the outdoor temperature at P1 and the curve chart of the inlet and outlet temperature of the heat collecting wall. It can be seen that the temperature difference between inlet and outlet is highly correlated with the ambient temperature, and the calculated correlation coefficient is 0.849, while the change of inlet and outlet temperature is slightly behind the ambient temperature.

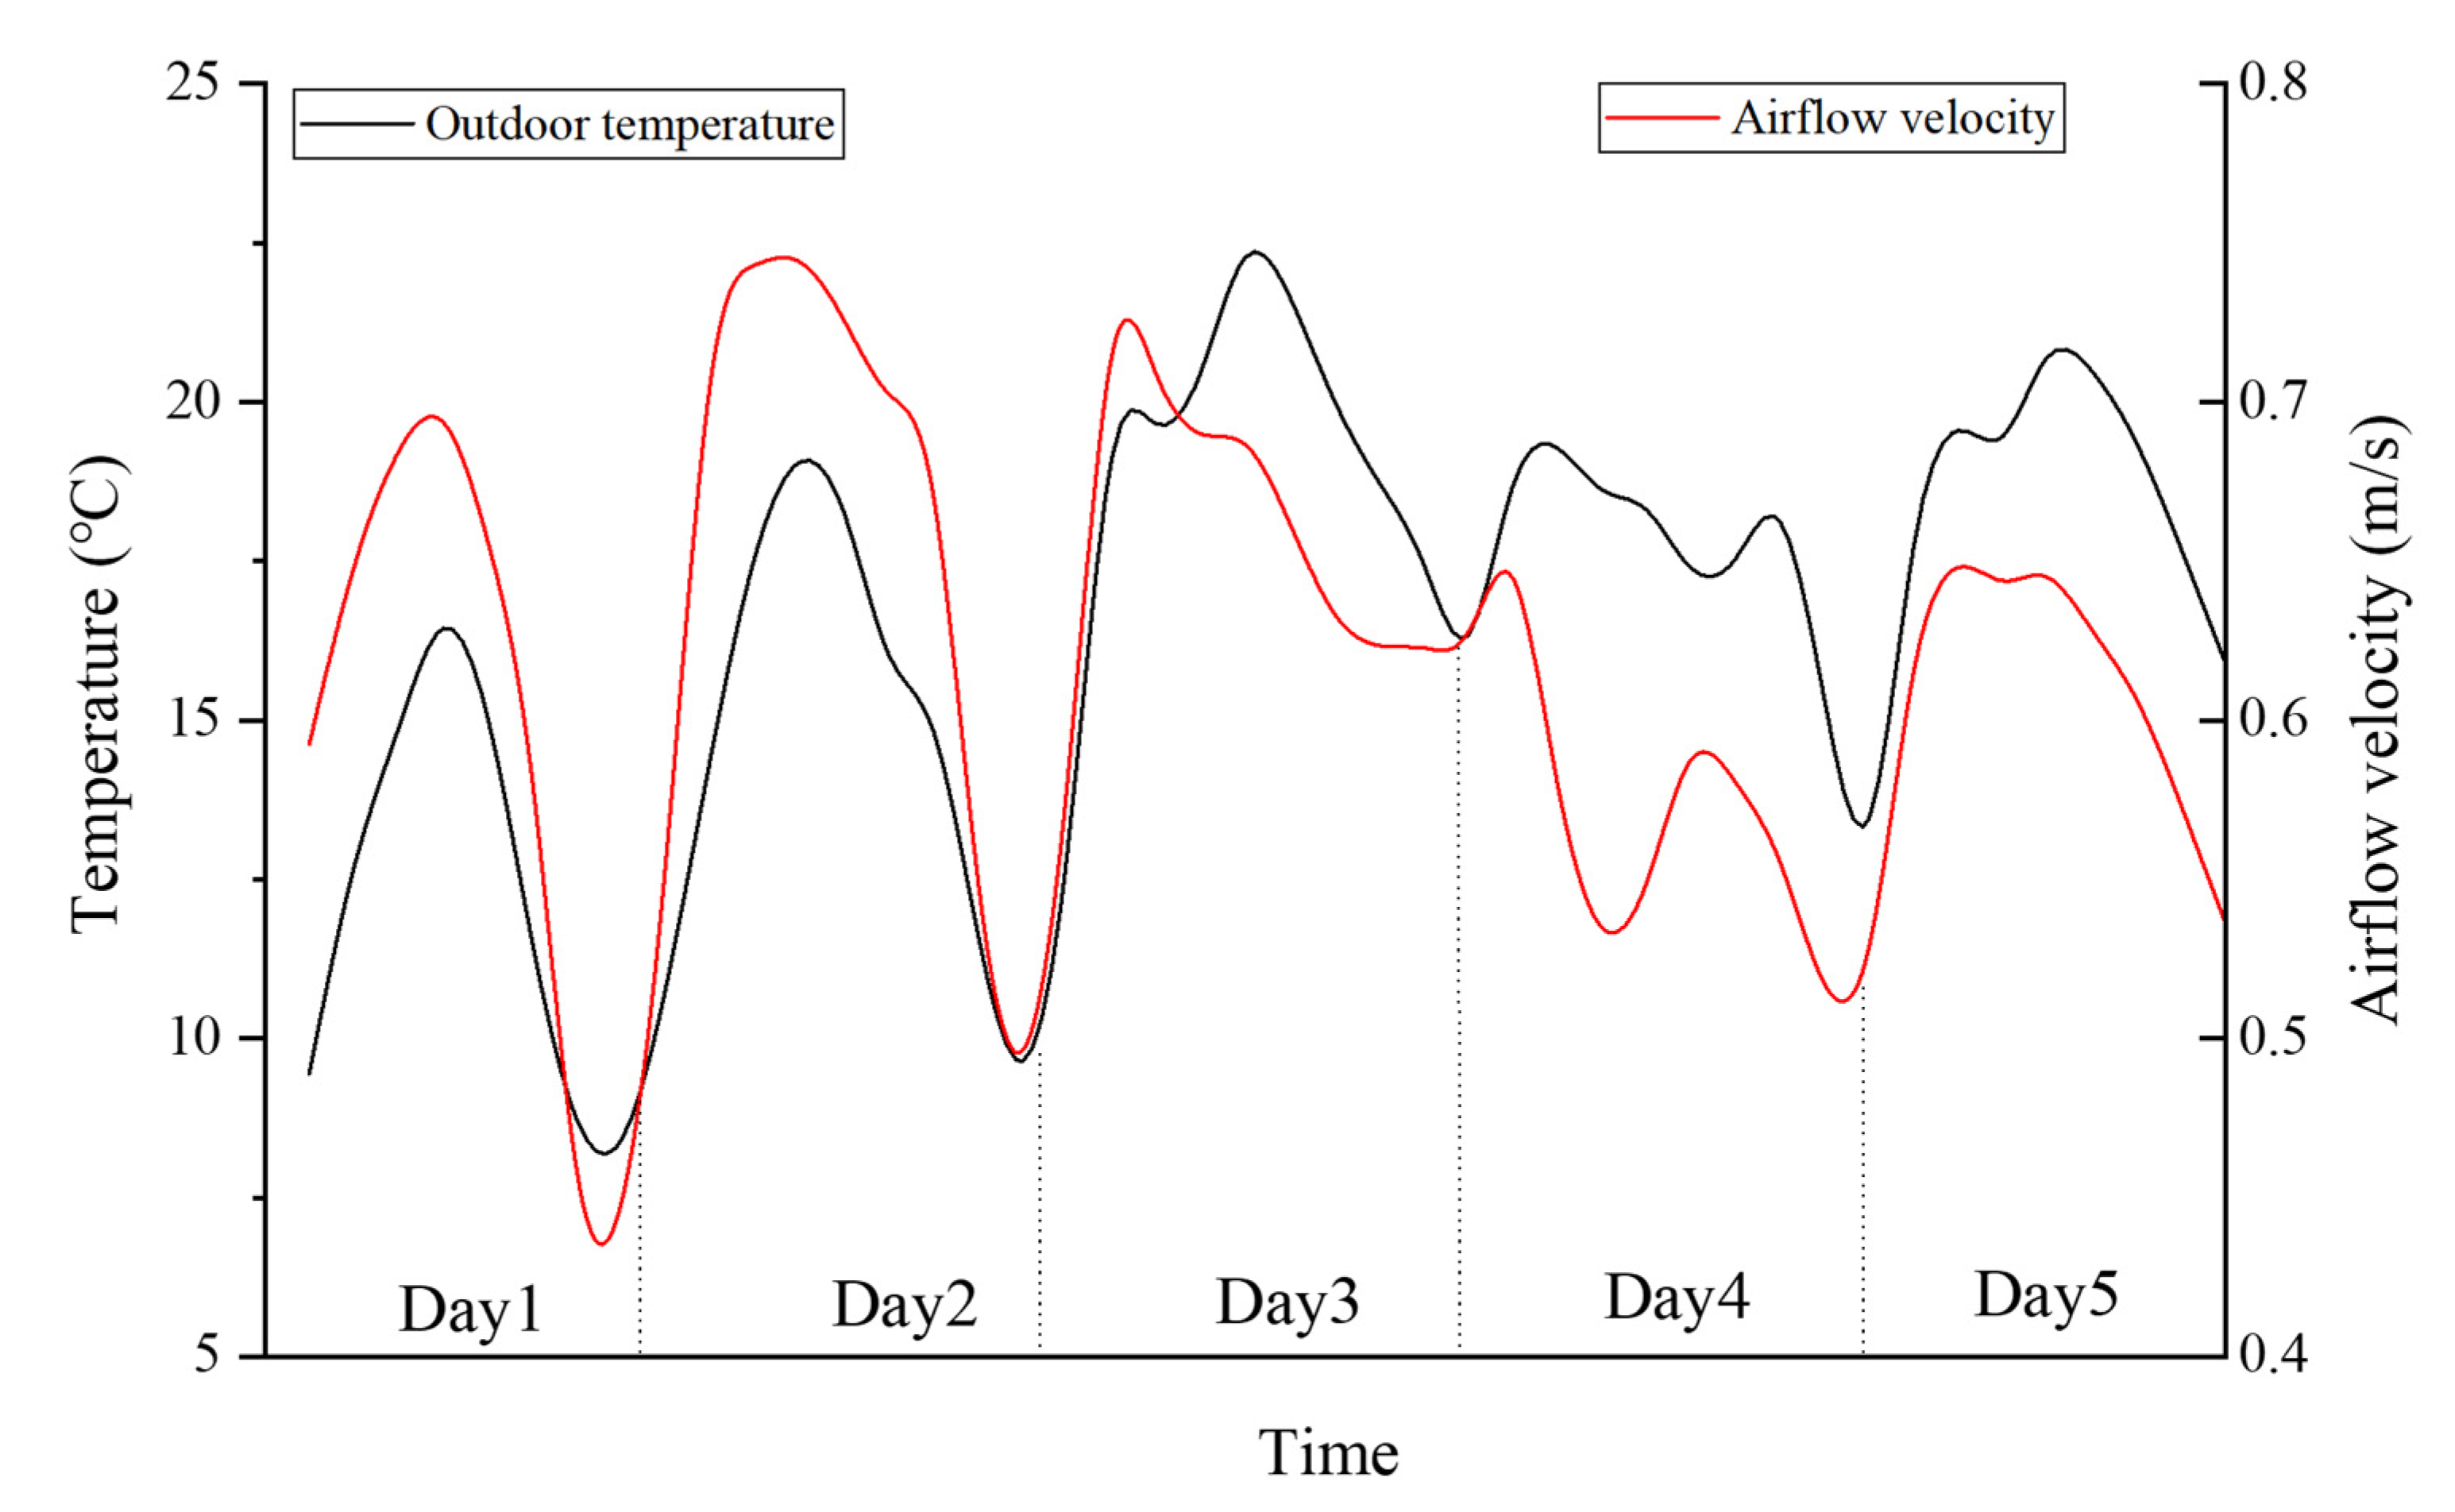
5.1.2. Airflow Velocity in the Cavity

During winter, the vents on the glass structure of heat collection walls are closed, and the airflow is sent in from the lower tuyere and out from the upper tuyere. As shown in Figure 16, through the analysis of the calculated data, it is found that the correlation coefficient between the airflow velocity in cavity and outdoor temperature is 0.624, while the correlation coefficient between the airflow velocity in cavity and outdoor wind speed is very small. The variation curve of average air velocity and outdoor temperature in the cavity is drawn as follows:

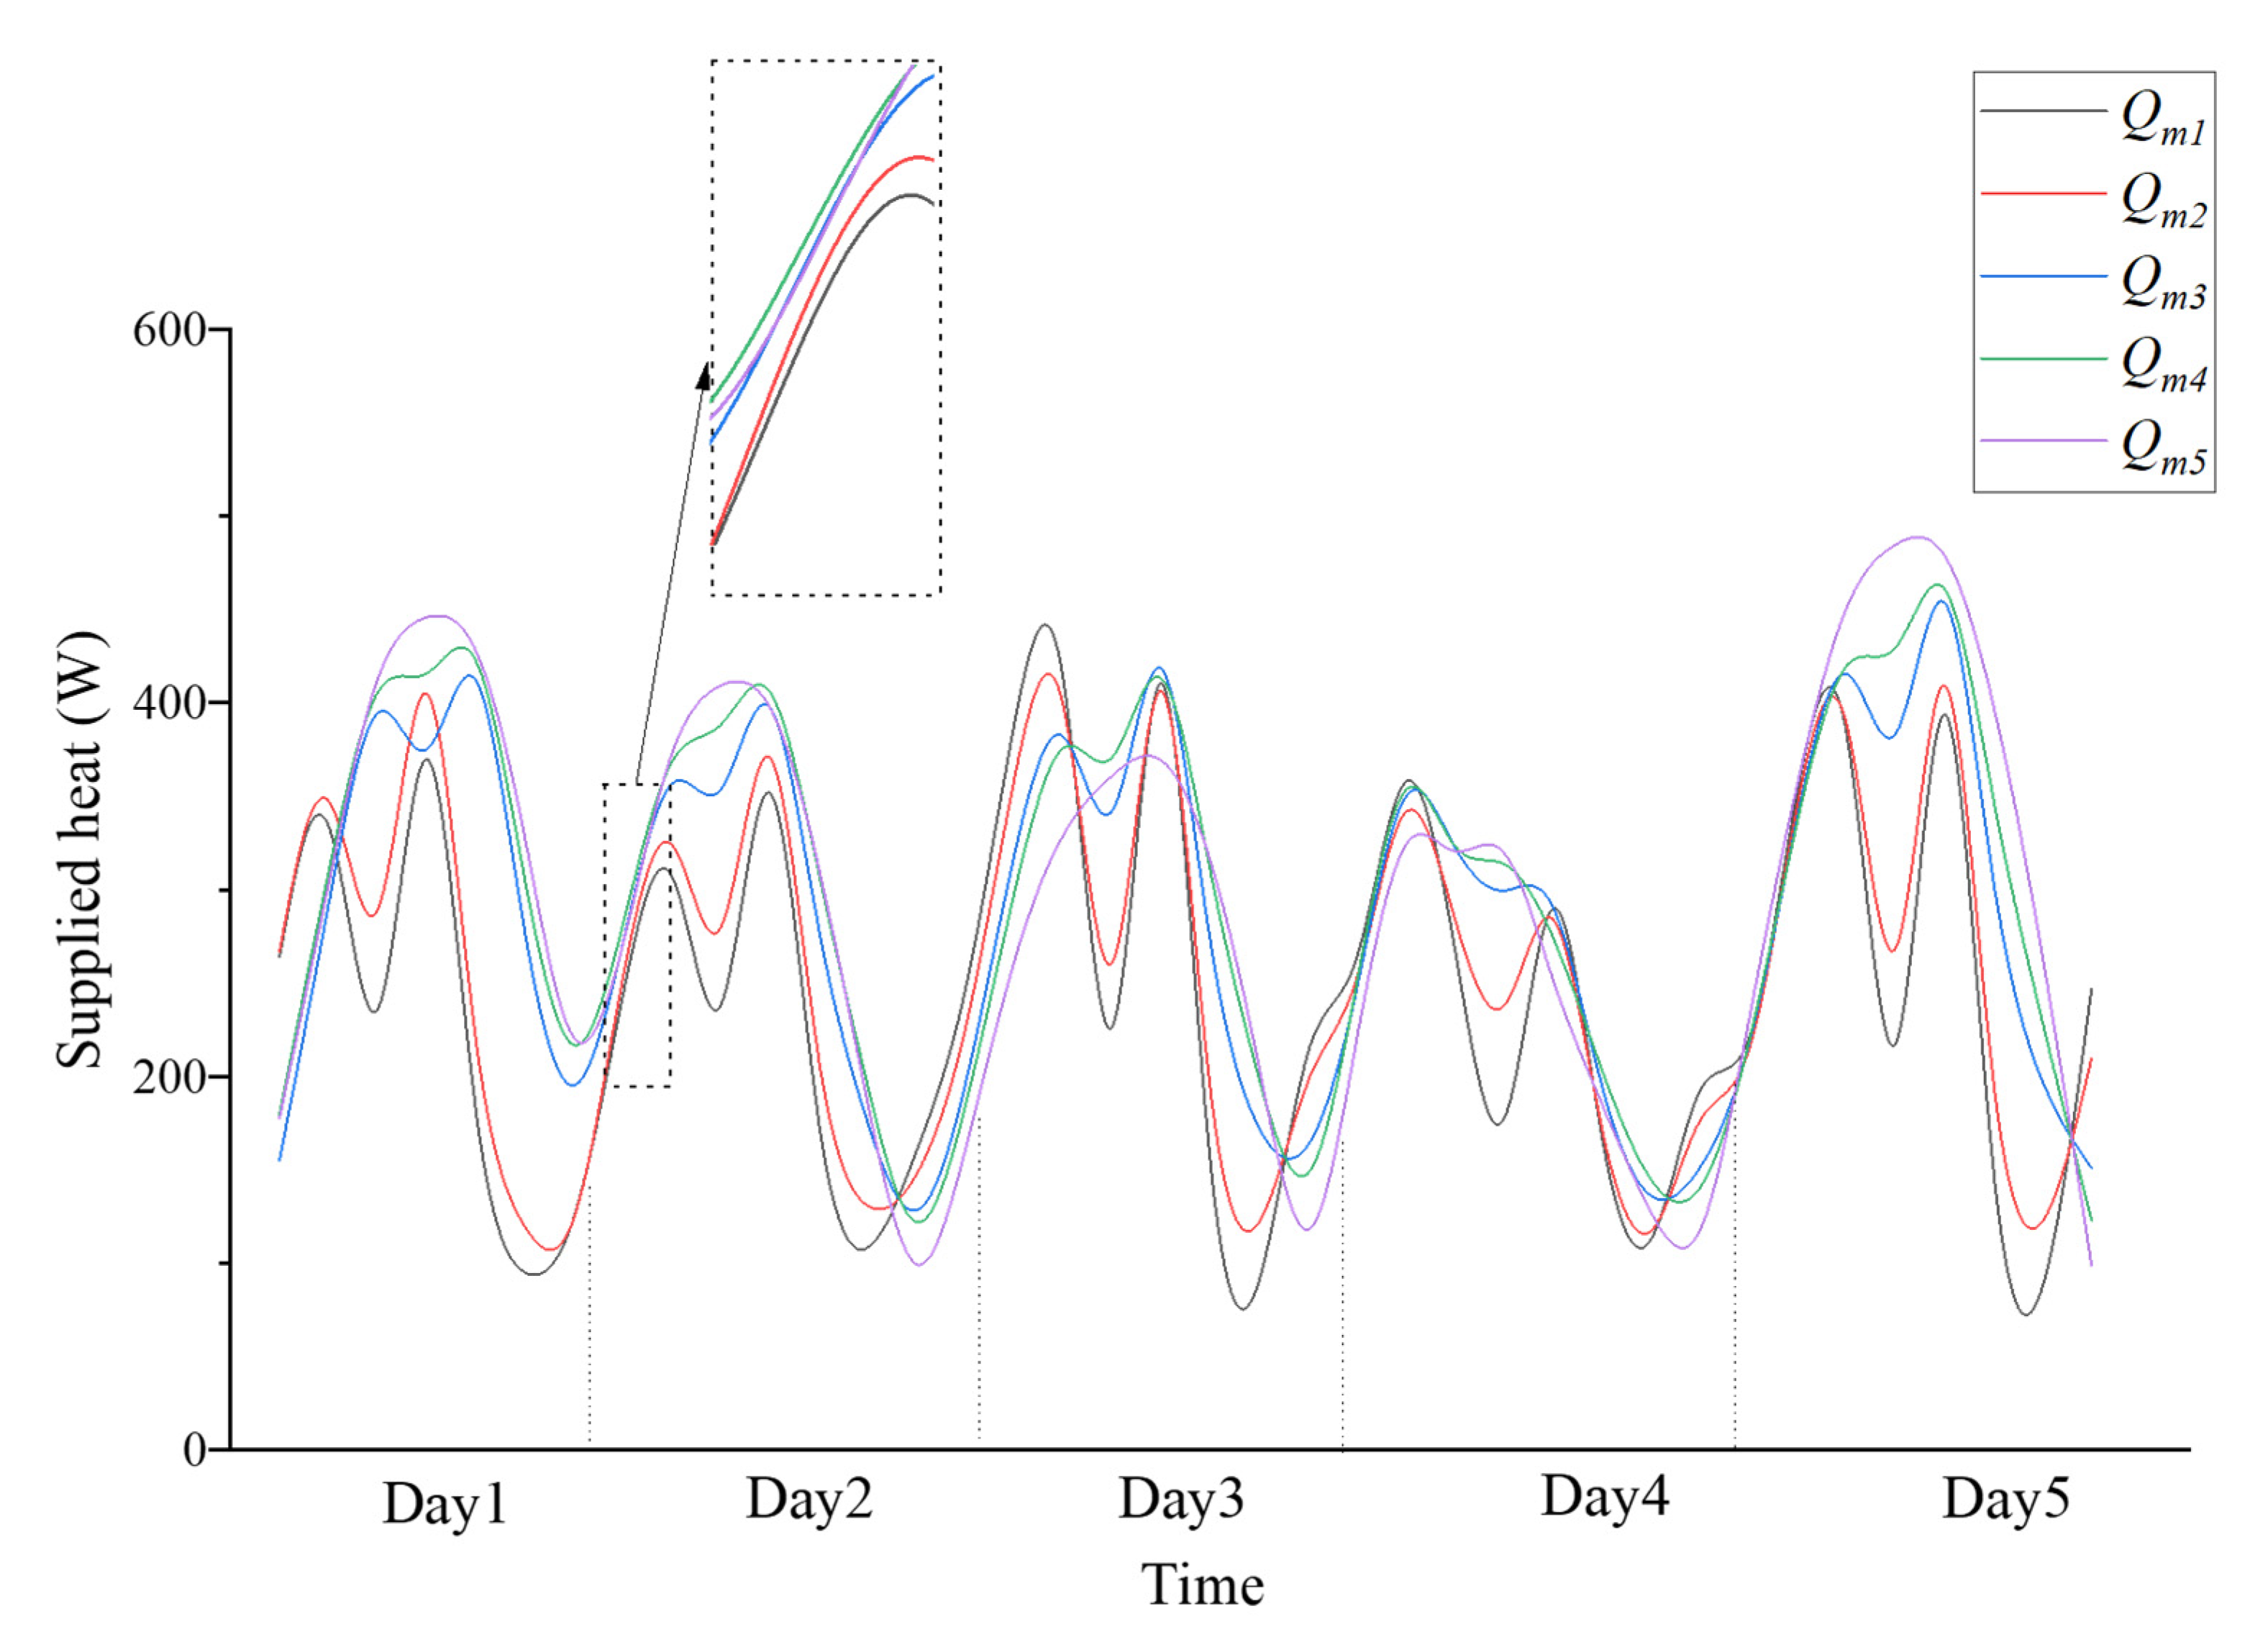
5.1.3. Heat Collecting Efficiency

The heat supplied to the room by the heat collection wall outlet is calculated as follows:
Q m = m c p ( t o t i )
The thermic heat collecting efficiency of the heat collection wall is defined as follows:
η = Q m I × A g
Based on the above data calculation, the following curve of the heat supplied by the vent at the measuring point is obtained as shown in Figure 17.
As per Table 8, the average heat collection efficiency of the heat collection wall at each measuring point is 19%, and the average heat supply of the tuyere at P1 and P2 is relatively smaller. In the future, the corresponding optimization structure of the heat collection wall is required to achieve a comfortable and ideal indoor thermal environment.

5.2. Calculation Results in Winter

Figure 18 shows the average value of the total ventilation volume at every measured and calculated point and Figure 19 shows the ventilation quantity by thermal pressure and wind pressure at P1. It is found that the ventilation volume on the east and west sides of the building first increases and then decreases with an increase in height, while at the middle of the building, ventilation volume has no prevalent trend with the changes in height.
Figure 19 shows the effect of ventilation volume caused by hot pressure and wind pressure at measuring point 1. Ten sets of data are selected for calculation every day. It can be seen that the ventilation volume caused by wind pressure is very small. In the vertical direction, the ventilation quantity due to thermal pressure is stable, while in the horizontal direction, the total ventilation quantities of east and west are greater than the middle. Moreover, the ventilation volume of the topmost floor is larger than that of the lower floor.

6. Conclusions

In this paper, the near-wall microclimate of the three buildings in Zhengzhou was measured in winter and summer, trying to find the variation law of outdoor temperature and attached airflow velocity with height. Through the establishment of a typical heat collection wall mathematical model and quantitative analysis of its thermal performance, the following conclusions were drawn:
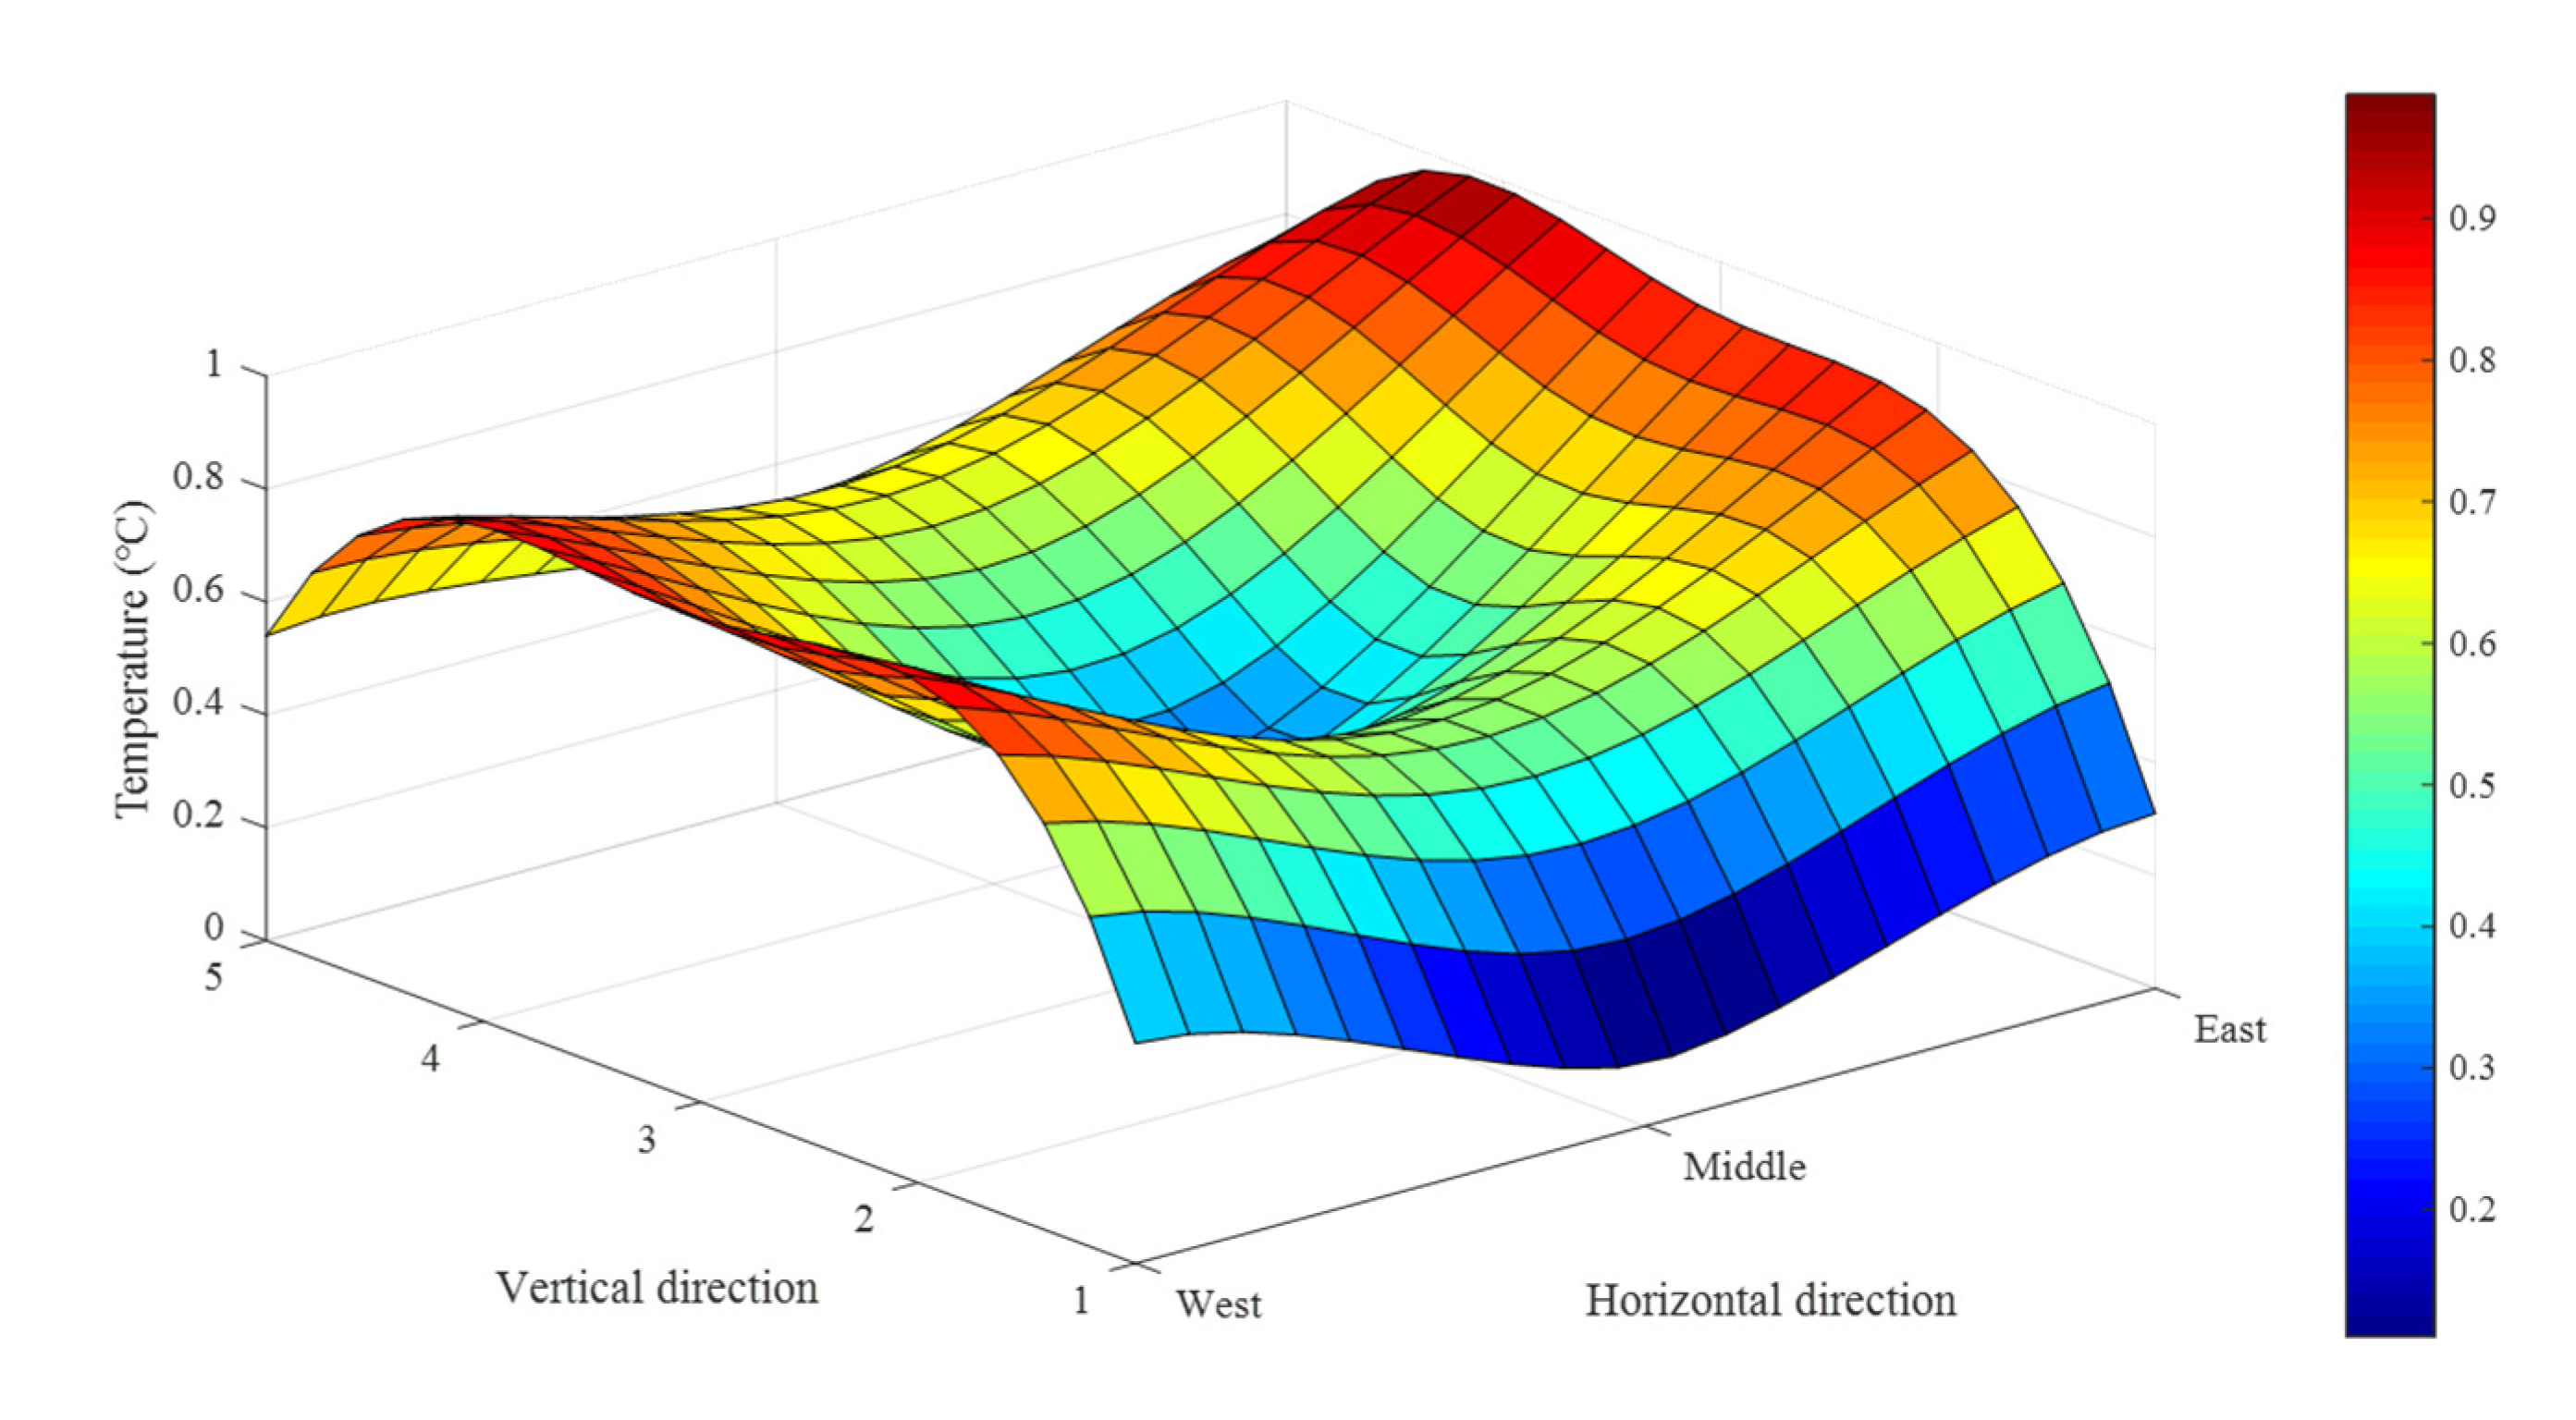
  • In the vertical direction, the temperature of the building’s near-wall showed an S-shaped fluctuation with an increase in height. The lower the building height, the smaller fluctuation amplitude. The average amplitude of the four tests in winter is 1.37 °C, 0.43 °C, 0.39 °C and 0.27 °C, respectively. The temperature of the measuring point at the middle of the building in the horizontal direction is higher than that on the side with a maximum average temperature difference of 3.11 °C.
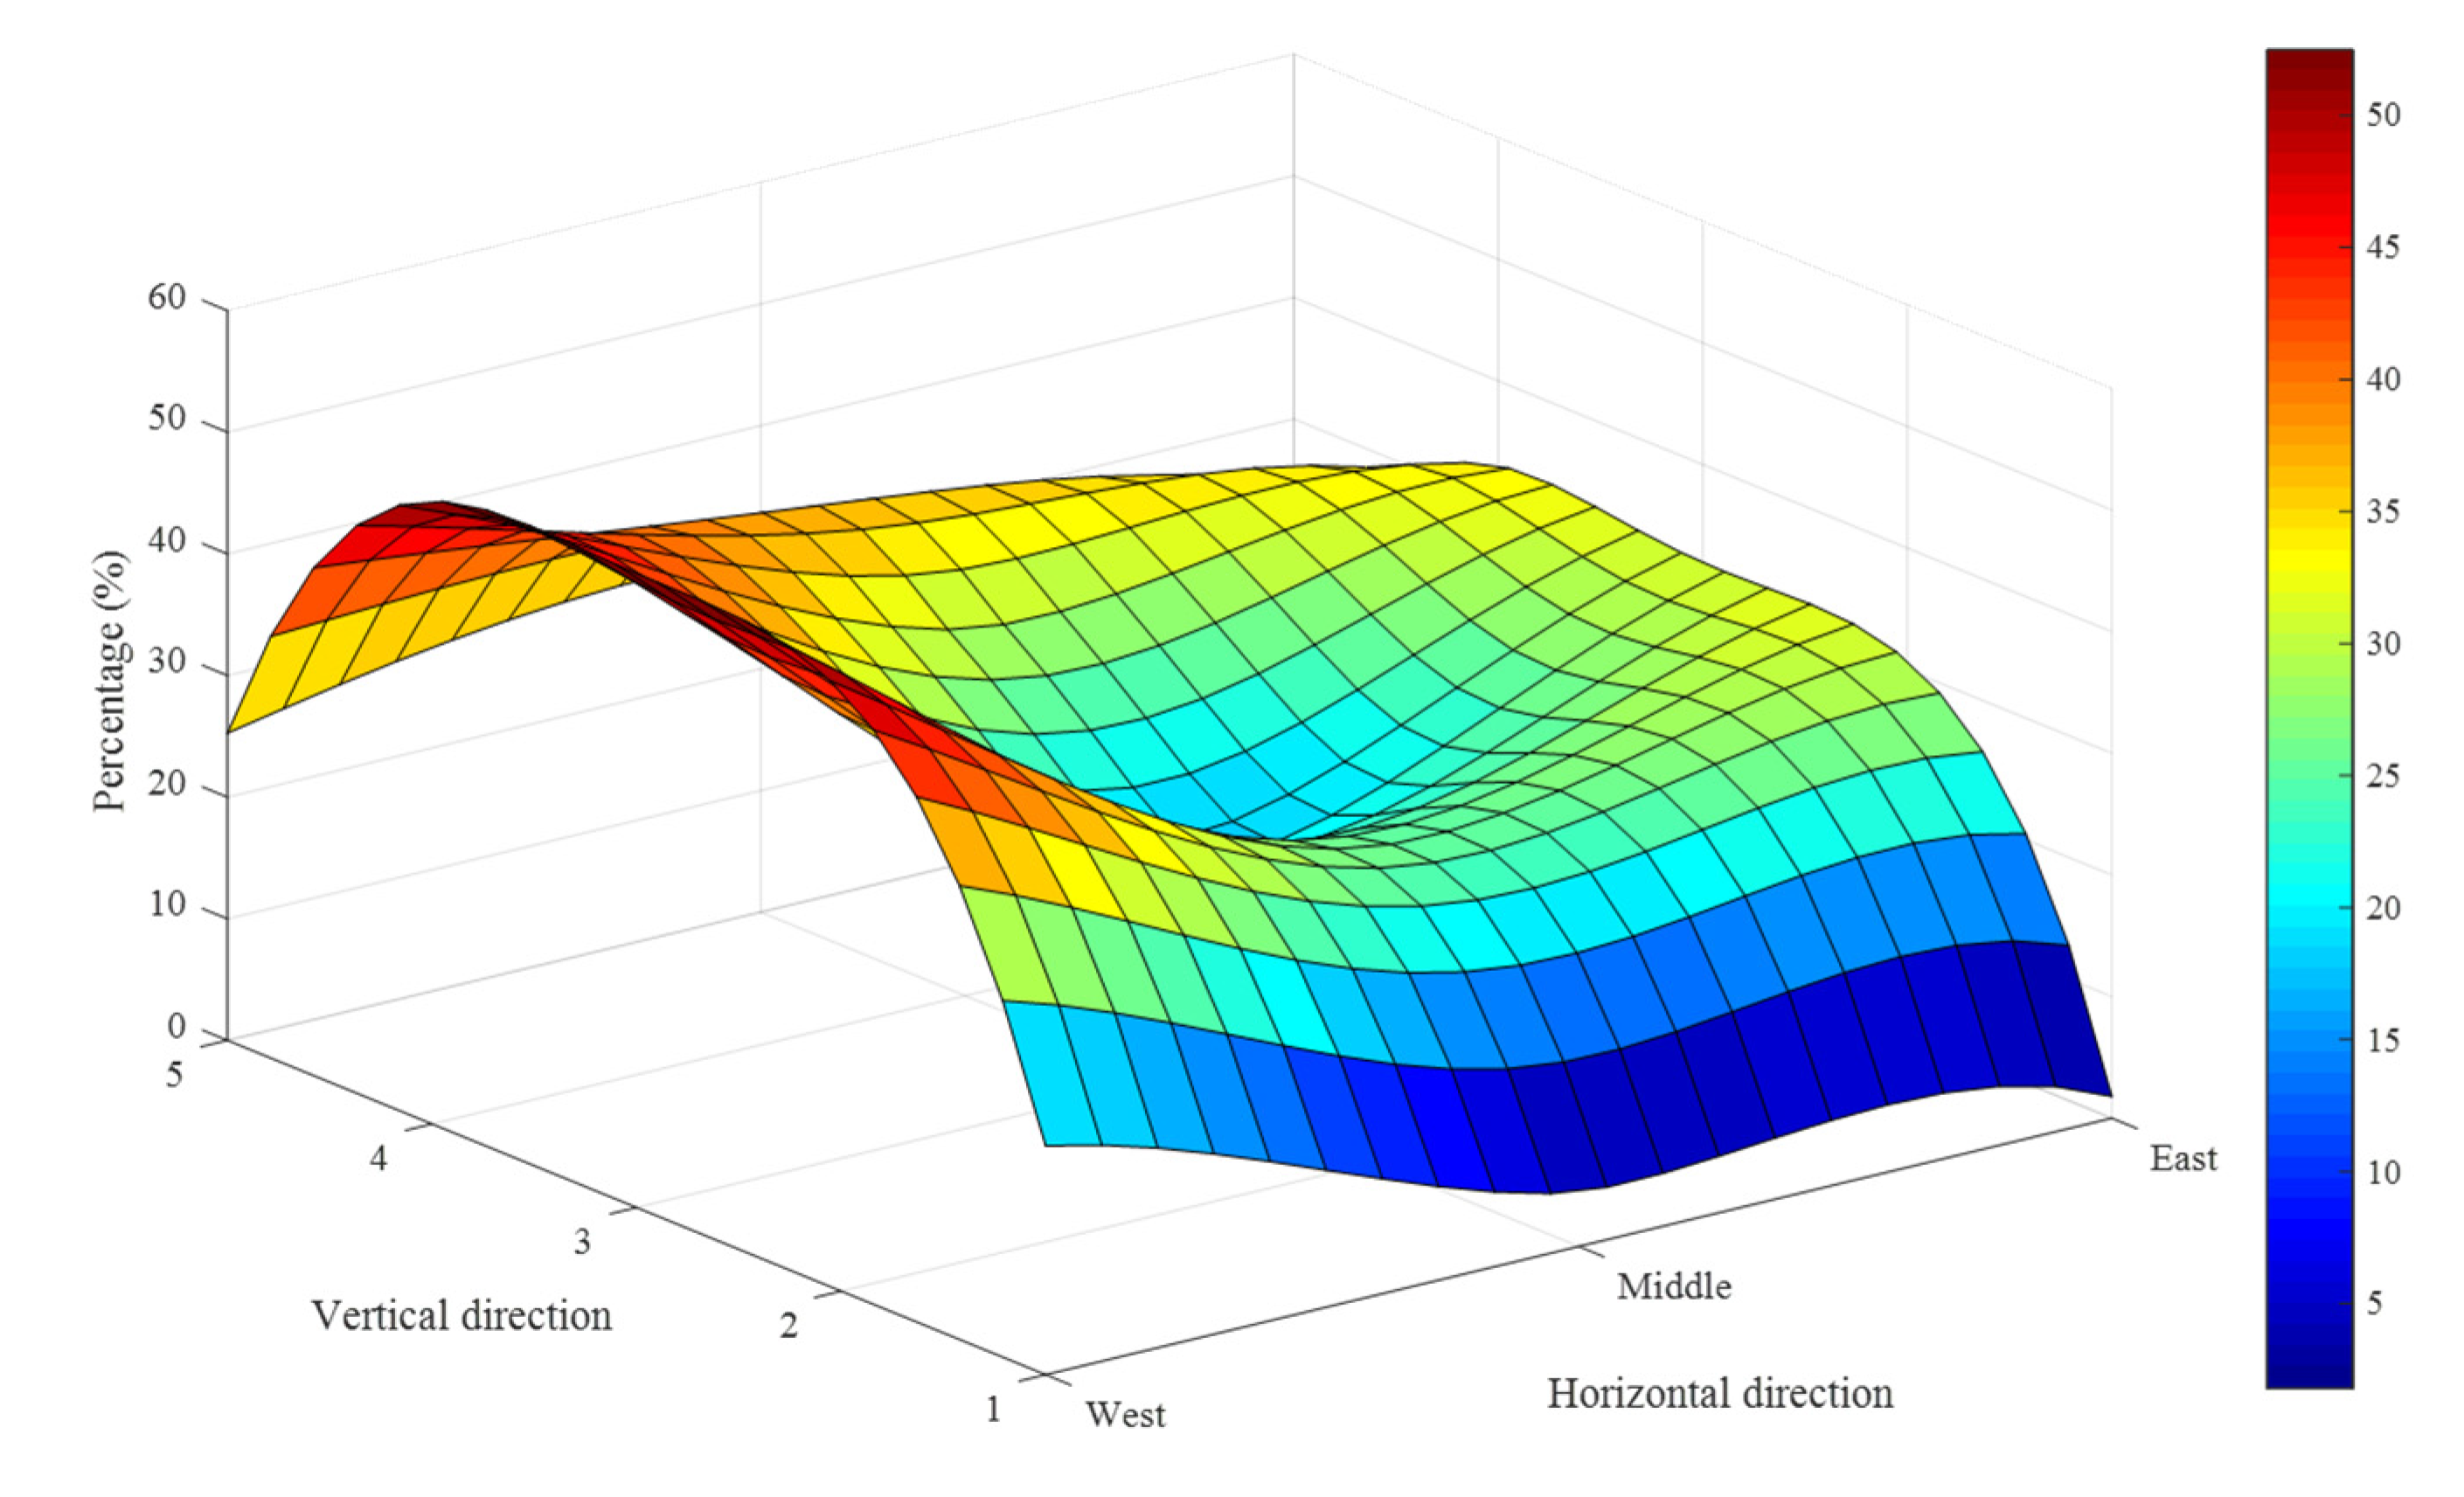
  • In the vertical direction, the airflow velocity attached to the building facade increases with the increase in the surface layer and falls slightly or remains flat on the top floor. Horizontally, the side of the building is more susceptible to ambient air distribution, and the wind speed reaches up to 2.146 times that of the middle part in winter. The smaller the size coefficient is, the smaller the variation range of airflow velocity is. The maximum difference of the average wind speed ratio of the four periods in winter is 9.4%, 8.3%, 28.8% and 21.4%, respectively.
  • By numerical calculation, during daytime in winter, the average temperature difference between inlet and outlet is 12.05 °C, and the highest recorded was 20.61 °C, and the average heat collection efficiency is 0.19. At night, the attenuation coefficient and delay phase of the heat collection wall with its ventilation holes closed are higher than those of ordinary walls without heat collection structures. The feasibility of heat collection walls in the Zhengzhou area is proven.
  • The winter calculation results show that the temperature difference between the inlet and outlet of the air layer in the heat collection wall is highly correlated with the environmental temperature, with a correlation coefficient of 0.849. The correlation coefficient between the air velocity and the outdoor temperature is 0.624.
  • Calculation results in summer show that in vertical direction, hot pressure ventilation rate plays a major role in the ventilation process. As for horizontal direction, the total ventilation is larger on the side of the building, and the less in the middle, while the ventilation on the topmost floor is larger than that on the lower floor. In the application of heat collection walls in a high-rise building, different structures and sizes must be designed in different parts of the building to achieve the optimal indoor environment and energy-saving effect.

Author Contributions

Conceptualization, R.L. and Y.Z.; methodology, R.L. and Y.Z.; software, Y.Z. and G.L.; formal analysis, J.Z., W.L. and O.L.B.; investigation, Y.Z. and G.L.; data curation, Y.Z., R.L. and G.L.; writing—original draft preparation, Y.Z.; writing—review and editing, R.L., J.Z. and W.L.; visualization, Y.Z.; supervision, R.L., J.Z. and W.L.; project administration, R.L. and O.L.B. All authors have read and agreed to the published version of the manuscript.

Funding

This research was supported by a grant from the National Natural Science Foundation of China (grant number 51808506).

Institutional Review Board Statement

Not applicable.

Informed Consent Statement

Informed consent was obtained from all subjects involved in the study.

Data Availability Statement

Data available on request.

Acknowledgments

This research was supported by a grant from the National Natural Science.

Conflicts of Interest

The authors declare no conflict of interest. The funders had no role in the design of the study; in the collection, analyses, or interpretation of data; in the writing of the manuscript, or in the decision to publish the results.

Nomenclature

Parameters
toutNear-wall temperature of the five measuring points, °C
ToutOutdoor environmental temperature, °C
tinIndoor temperature of the five measuring points, °C
v1, v2, v3, v4, v5Attached airflow velocity at first, second et al. measuring point, m/s
Q m Heat supplied to the room by the heat collection wall outlet, W
η Thermic efficiency of the thermic wall, %
Δ, ΔA, ΔBEvaluation of uncertainty and type A, B evaluation of uncertainty
νynAttenuation multiples
ξynPhase delay time, rad
m1Ventilation volume due to hot pressure, m3/s
m2Ventilation volume due to air pressure, m3/s
SRAbbreviation of solar radiation, W/m2
Abbreviations
B1, B2, B3Abbreviation of Building1, Building2 and Building3
P1, P2, P3, P4, P5Abbreviation of measuring point 1 to 5
Subscripts
aveAverage of data
maxMaximum of data
minMinimum of data

References

  1. Li, H.Y.; Zhao, S.; Liu, F.; Li, L.; Dai, X.D. World Energy Supply and Demand Outlook in 2040—Based on BP World Energy Outlook (2019 edition). J. Nat. Gas Oil 2019, 37, 1–8. [Google Scholar]
  2. Asimakopoulos, D.; Santamouris, M. Passive Cooling of Buildings; Taylor and Francis: Oxfordshire, UK, 2013; pp. 10–31. [Google Scholar]
  3. Mario, L.; Benedetto, N.; Daniele, G.; Caroline, R.; Massimiliano, M.; Davide, A.G. Techno-economic assessment of reversible Solid Oxide Cell integration to renewable energy systems at building and district scale. J. Energy Convers. Manag. 2021, 235. [Google Scholar] [CrossRef]
  4. Benedetto, N.; Stefano, M.; Daniele, G.; Alessandro, R.; Davide, A.G. Solar power-to-gas application to an island energy system. J. Renew. Energy 2021, 164. [Google Scholar] [CrossRef]
  5. Jiang, Y.; Feng, Y.; Rong, X.Y.; Pan, Y.G.; Fu, X.Z. Discussion on urban heating mode in Lhasa. J. Heat. Vent. Air Cond. 2013, 43, 1–7. [Google Scholar]
  6. Chen, X.; Chen, B.; Ding, Y.H. Experimental study of different operation strategies of Trombe wall for summer cooling in Dalian. J. Heat. Vent. Air Cond. 2006, 26, 7–12. [Google Scholar]
  7. Chen, B.; Sun, Y.F.; Zhu, J.Y.; Yang, L.H. Heating ability and climate adaptability analysis of wall-mounted solar air collectors (WSAC). J. Heat. Vent. Air Cond. 2010, 40, 121–125. [Google Scholar]
  8. Dimassi, N.; Dehmani, L. Thermal performance of a passive test room with a Trombe wall in Tunisia. J. Renew. Sustain. Energy 2012, 4. [Google Scholar] [CrossRef]
  9. Milorad, B.; Kévyn, J.; Frédéric, K. Optimizing energy and environmental performance of passive Trombe wall. J. Energy Build. 2014, 70. [Google Scholar] [CrossRef]
  10. Zhou, Y.; Zhang, L.H.; Jiang, Y.H.; Dong, H.R.; Hao, K. Influence of Trombe wall on indoor environment in Qingdao rural area. J. Renew. Energy Resour. 2017, 35, 990–997. [Google Scholar]
  11. Zhou, P.Z.; Jiang, S.G.; Qu, H. Effect analysis of energy saving reconstruction of heating in severe cold area of Xinjiang. J. Low Temp. Archit. Technol. 2017, 39, 148–150, 156. [Google Scholar]
  12. Xu, X.; Li, J.; Jiang, S.G.; Dai, J.; Wu, M.Y. Cooling effect of passive solar house with different cooling control modes during summer in rural areas of Xinjiang. J. Trans. Chin. Soc. Agric. Eng. 2019, 35, 198–204. [Google Scholar]
  13. Lohmann, V.; Santos, P. Trombe wall thermal behavior and energy efficiency of a light steel frame compartment: Experimental and numerical assessments. J. Energies 2020, 13, 2744. [Google Scholar] [CrossRef]
  14. Ji, J.; Yi, H.; He, W.; Pei, G.; Lu, J.P.; Jiang, B. Numerical study on the photo-thermal and electrical performance of a novel Trombe wall with PV cells. J. Acta Energlae Sol. Sin. 2006, 9, 870–877. [Google Scholar]
  15. Abed, A.A.; Ahmed, O.K.; Weis, M.M.; Hamada, K.I. Performance augmentation of a PV/Trombe wall using Al2O3/Water nano-fluid: An experimental investigation. J. Renew. Energy 2020, 157. [Google Scholar] [CrossRef]
  16. Rabani, M.; Kalantar, V.; Rabani, M. Heat transfer analysis of a Trombe wall with a projecting channel design. J. Energy 2017, 134, 943–950. [Google Scholar] [CrossRef]
  17. Rabani, M.; Rabani, M. Heating performance enhancement of a new design Trombe wall using rectangular thermal fin arrays: An experimental approach. J. Energy Storage 2019, 24, 100796. [Google Scholar] [CrossRef]
  18. Agurto, L.; Allacker, K.; Fissore, A.; Agurto, C.; De Troyer, F. Design and experimental study of a low-cost prefab Trombe wall to improve indoor temperatures in social housing in the Biobío region in Chile. J. Sol. Energy 2020, 198, 704–721. [Google Scholar] [CrossRef]
  19. Elghamry, R.; Hassan, H. Experimental investigation of building heating and ventilation by using Trombe wall coupled with renewable energy system under semi-arid climate conditions. J. Sol. Energy 2020, 201. [Google Scholar] [CrossRef]
  20. Yan, L.Y.; Hou, L.Q.; Yang, Y.D.; Feng, Y.P.; Yang, L.; Gao, Q.L. Effects of external insulation component on thermal performance of a Trombe wall with phase change materials. J. Sol. Energy 2020, 204, 115–133. [Google Scholar]
  21. Ben, Y.R.; Bilgen, E. Natural convection and conduction in Trombe wall systems. J. Pergamon. 1991, 34, 1237–1248. [Google Scholar]
  22. Gan, G.; Riffat, S.B. A numerical study of solar chimney for natural ventilation of buildings with heat recovery. J. Appl. Therm. Eng. 1998, 18. [Google Scholar] [CrossRef]
  23. Ong, K.S. A mathematical model of a solar chimney. J. Renew. Energy 2003, 28. [Google Scholar] [CrossRef]
  24. Wang, H.H.; Huang, C.Y. Natural convection heat transfer in the air-layer of insulating glass. J. Chongqing Univ. 2009, 32, 809–814. [Google Scholar]
  25. He, Y.; Liu, T.; Lin, W.X. Direct Numerical Simulation and Analysis of Transient Velocity Fields in a Trombe Wall Channel. J. Yunnan Norm. Univ. (Nat. Sci. Ed.) 2013, 33, 13–20. [Google Scholar]
  26. Zhang, T.T. Flow and Heat Transfer Characteristic in Air Layers and Its Application in Building Envelopes; Harbin Institute of Technology: Harbin, China, 1 June 2016. [Google Scholar]
  27. Max, T.A.; Morris, E.N. Building, Climate and Energy; China Building Industry Press: Beijing, China, 1990. [Google Scholar]
  28. Ciancio, V.; Falasca, S.; Golasi, I.; Curci, G.; Coppi, M.; Salata, F. Influence of input climatic data on simulations of annual energy needs of a building: EnergyPlus and WRF modeling for a case study in Rome (Italy). Energies 2018, 11, 2835. [Google Scholar] [CrossRef] [Green Version]
  29. Battista, G.; Evangelisti, L.; Guattari, C.; Vollaro, E.D.L.; Vollaro, R.D.L.; Asdrubali, F. Urban Heat Island Mitigation Strategies: Experimental and Numerical Analysis of a University Campus in Rome (Italy). Sustainability. 2020, 12, 7971. [Google Scholar] [CrossRef]
  30. Mehaoued, K.; Lartigue, B. Influence of a reflective glass façade on surrounding microclimate and building cooling load: Case of an office building in Algiers. Sustain. Cities Soc. 2019, 46. [Google Scholar] [CrossRef]
  31. Fabbri, K.; Gaspari, J.; Bartoletti, S. Effect of façade reflectance on outdoor microclimate: An Italian case study. Sustain. Cities Soc. 2020, 54, 101984. [Google Scholar] [CrossRef]
  32. Naboni, E.; Milella, A.; Vadalà, R.; Fiorito, F. On the localised climate change mitigation potential of building facades. J. Energy Build. 2020, 224, 110284. [Google Scholar] [CrossRef]
  33. Bherwani, H.; Singh, A.; Kumar, R. Assessment methods of urban microclimate and its parameters: A critical review to take the research from lab to land. J. Urban Clim. 2020, 34, 100690. [Google Scholar] [CrossRef]
  34. Wang, Z.W.; Gao, Y.F.; Meng, Q.L.; Zhao, L.H.; Jin, L. Study on Relationship between Building Group Distribution and Natural Ventilation. J. Build. Sci. 2007, 75, 24–27. [Google Scholar]
  35. Teshnehdel, S.; Akbari, H.; Giuseppe, E.D.; Brown, R.D. Effect of tree cover and tree species on microclimate and pedestrian comfort in a residential district in Iran. J. Build. Environ. 2020, 178, 106899. [Google Scholar] [CrossRef]
  36. Castaldo, V.L.; Pisello, A.L.; Piselli, C.; Fabiani, C.; Cotana, F.; Santamouris, M. How outdoor microclimate mitigation affects building thermal-energy performance: A new design-stage method for energy saving in residential near-zero energy settlements in Italy. J. Renew. Energy 2018, 127, 920–935. [Google Scholar] [CrossRef]
  37. Zaki, S.A.; Syahidah, S.W.; Shahidan, M.F.; Ahmad, M.I.; Yakub, F.; Hassan, M.Z.; Daud, M.Y.M. Assessment of Outdoor Air Temperature with Different Shaded Area within an Urban University Campus in Hot-Humid Climate. J. Sustain. 2020, 12, 5741. [Google Scholar] [CrossRef]
  38. Lin, B.R.; Li, X.F.; Zhu, Y.X. Study on solar radiation effects on the microclimate of building envelope: The characteristics of external surface temperature and airflow. J. Acta Energiae Sol. Sin. 2001, 3, 327–333. [Google Scholar]
  39. Li, H.J.; Lin, B.R.; Zhu, Y.X. The Influence of Surrounding Buildings on the Ventilation Condition of Single Buildings. In Proceedings of the 2006 Annual academic Conference on HVAC and Refrigeration in China, Hefei, China, 1–3 November 2006; Volume 262. [Google Scholar]
  40. Wang, X.B.; Huang, C.; Wang, L.H. Experimental Study of Temperature Distribution and Heat Transfer Coefficient of Vertical Exterior Surface of a Building. J. Fluid Mach. 2011, 39, 69–73. [Google Scholar]
  41. Pan, B.L.; Guo, X.J.; Wei, L.L.; Cai, W. Experimental Research on Vertical Variation of Microclimate Parameters in the Super High-Rise Building. J. Build. Energy Effic. 2016, 44, 49–52. [Google Scholar]
  42. Zhang, H.N.; Zhang, Y.P.; He, Y.L.; Zhou, Y. Vertical distributions characteristics of air temperature of the atmosphere over the courtyard and influences of different underlying surface in Kunming city. J. Trop. Meteorol. 2007, 3, 293–299. [Google Scholar]
  43. Zhang, H.N.; Zhang, Y.P.; Zhou, Y. Impact of Buildings’ External Wall Surfaces on the Courtyard Air Temperature in Kunming City. J. Clim. Environ. Res. 2008, 13, 663–674. [Google Scholar]
  44. Zhai, B.Z.; Lin, B.R.; Mao, Q.Z.; Zhang, J. Experimental study on neighborhood form and outdoor microclimate in Zhengzhou. J. Eco-City Green Build. 2014, 119–124. [Google Scholar]
  45. Moghbel, M.; Salim, R.E. Environmental benefits of green roofs on microclimate of Tehran with specific focus on air temperature, humidity and CO2 content. J. Urban Clim. 2017, 20, 46–58. [Google Scholar] [CrossRef]
  46. Wilde, P.; Coley, D. The implications of a changing climate for buildings. J. Build. Environ. 2012, 55, 1–7. [Google Scholar] [CrossRef] [Green Version]
  47. Bouyer, J.; Inard, C.; Musy, M. Microclimatic coupling as a solution to improve building energy simulation in an urban context. J. Energy Build. 2011, 43, 1549–1559. [Google Scholar] [CrossRef]
  48. Yi, C.Y.; Peng, C.Z. Microclimate Change Outdoor and Indoor Coupled Simulation for Passive Building Adaptation Design. J. Procedia Comput. Sci. 2014, 32, 691–698. [Google Scholar] [CrossRef] [Green Version]
  49. Tejedor, B.; Barreira, E.; Almeida, R.M.S.F.; Casals, M. Thermographic 2D U-value map for quantifying thermal bridges in building façades. J. Energy Build. 2020, 224, 110176. [Google Scholar] [CrossRef]
  50. Sa, A.B.; Boaventura-Cunha, J.; Lanzinha, J.C.; Paiva, A. An experimental analysis of the Trombe wall temperature fluctuations of high range climate conditions: Influence of ventilation openings and shading devices. J. Energy Build. 2017, 138, 546–558. [Google Scholar]
  51. Wang, D.F.; Wu, S.P.; Xi, W.H. The mathematical model and the simulation calculation program of passive solar heated housesI. The direct gain and collector-storage wall PSHDC (First Part). J. Gansu Sci. 1989, 0, 1–8. [Google Scholar]
  52. Wang, D.F.; Wu, S.P.; Xi, W.H. The mathematical model and the simulation calculation program of passive solar heated housesI. The direct gain and collector-storage wall PSHDC (Second Part). J. Gansu Sci. 1990, 1, 19–27. [Google Scholar]
  53. Wang, B. Trombe Wall Heat Transfer Process and Optimization Design Research; Xi’an University of Architecture & Technology: Xi’an, China, 1 May 2012. [Google Scholar]
Figure 1. Meteorological data of Zhengzhou, China.
Energies 14 02023 g001
Figure 2. Locations, photographs, and shapes of three buildings.
Energies 14 02023 g002
Figure 3. South elevation and vertical section of the measuring point layout.
Energies 14 02023 g003
Figure 4. Test room diagram in summer.
Energies 14 02023 g004
Figure 5. Solar radiance on the vertical wall of a high-rise building (without group shadow).
Energies 14 02023 g005
Figure 6. Indoor and near-wall temperature changes of B1.
Energies 14 02023 g006
Figure 7. The vertical temperature difference of B1.
Energies 14 02023 g007
Figure 8. The variation trend of near-wall temperature with height in winter.
Energies 14 02023 g008
Figure 9. Changes of airflow velocity and environmental wind speed of B1.
Energies 14 02023 g009
Figure 10. Airflow velocity variation trend in winter.
Energies 14 02023 g010
Figure 11. Average near-wall temperature difference distribution of B3 in summer.
Energies 14 02023 g011
Figure 12. Airflow velocity of B3 in summer.
Energies 14 02023 g012
Figure 13. Plan and elevation of heat collection wall and operating principle in winter.
Energies 14 02023 g013
Figure 14. The temperature difference between inlet and outlet in winter.
Energies 14 02023 g014
Figure 15. Variation of temperature difference between inlet and outlet at P1.
Energies 14 02023 g015
Figure 16. Change of airflow velocity and outdoor temperature at P1.
Energies 14 02023 g016
Figure 17. Supplied heat at each measuring point.
Energies 14 02023 g017
Figure 18. Ventilation quantity in summer.
Energies 14 02023 g018
Figure 19. The ventilation quantity by thermal pressure and wind pressure at P1.
Energies 14 02023 g019
Table 1. Details of the three buildings.
BuildingBuilding StoryShape Factor (1/m)Building Area (m2)Building Height (m)
Building 1220.2349,51495.70
Building 2150.3711,51845.30
Building 3110.39423834.80
Table 2. Thermophysical parameters of the external wall of measured buildings.
LMaterialThickness
(mm)
Thermal Conductivity
(W/(m·K))
Specific Heat
(kJ/(kg K))
Density
(kg/m³)
Temperature
Conductivity (m2/s)
L1Cement mortar50.93000.84001800.00000.0022
L2Polystyrene800.05041.500032.00000.0038
L3Aerated concrete2000.35201.0500700.00000.0017
L4Cement mortar50.93000.84001800.00000.0022
Table 3. Introduction of measuring equipment and parameters.
Equipment and
its manufacturer
Measuring
Parameter
Measuring point
location
Equipment ParameterEquipment Photos
WSZY-1 Temperature and
humidity recorder
(Beijing Tianjian Huayi Technology Development Co., Ltd.)
Indoor temperature and
humidity
1.5 meters high in the
center of the measured room
Temperature range −40–85 °C,
accuracy ±1.5 °C (−10–60 °C)
Relative humidity range 0–100%,
accuracy ±3% (20–80% RH)
Energies 14 02023 i001
RC-4 Temperature and
humidity recorder
(Jiangsu Jingchuang Electronics Co., Ltd.)
Temperature and humidity of the southern wallMiddle height position of the southern wallTemperature range –40–85 °C,
accuracy ±0.6 °C (−20–50 °C)
Relative humidity range 0–100%,
accuracy ±3% (25 °C, 20–90% RH)
Energies 14 02023 i002
WFWZY-1 Universal wind speed and temperature
recorder
(Beijing Tianjian Huayi Technology Development Co., Ltd.)
Wind speed and air
temperature near the wall
In the middle height position, and it is 50 mm far from the southern wallWind speed range 0.05–30 m/s,
accuracy 5% ±0.05 m/s
Temperature range −20–60 °C,
accuracy ±0.5 °C
Energies 14 02023 i003
Davis 6162 Weather station
(Davis Weather Station Inc in America)
Ambient temperature,
humidity and wind speed,
solar radiation intensity
On the roof of the
measured building
Wind speed range 1–67 m/s, accuracy ±5%
Temperature range –40–65 °C,
accuracy ±0.5 °C
Relative humidity range 1%–100%,
accuracy ±4%
Solar radiation range 0–1800 W/m2,
accuracy ±5%
Energies 14 02023 i004
TBQ-2 Total solar radiation table
(Jinzhou Sunshine Meteorology Technology Co., Ltd.)
Solar radiation intensityBottom of the southern wall at the top and bottom of the measured buildingSolar radiation range 0–2000 W/m2,
sensitivity 7–14 µV/(W·m2)
Energies 14 02023 i005
Table 4. Calculation summary of wind speed of three buildings in winter.
Test PeriodParametersP1P2P3P4P5Environmental Wind Speed
West of B1Velocityave0.170.210.290.290.281.32
Wind speed ratio12.8%15.6%22.0%22.2%21.2%100.0%
Middle of B1Velocityave0.130.170.240.200.191.31
Wind speed ratio9.7%12.9%18.0%15.1%14.6%100.0%
B2Velocityave0.080.150.190.260.240.48
Wind speed ratio16.1%31.6%39.1%54.9%50.8%100.0%
B3Velocityave0.220.330.380.470.441.16
Wind speed ratio19.1%28.3%32.9%40.5%37.7%100.0%
Table 5. Calculation summary of the wind speed of B3 in summer.
Test PeriodParametersP1P2P3P4P5Environmental Wind Speed
Vertical
measurement of B3
Velocityave0.170.410.310.500.471.60
Wind speed ratio10.60%25.60%19.40%31.20%29.30%100.00%
Horizontal
measurement of B3
Velocityave0.230.140.260.230.191.01
Wind speed ratio22.90%13.90%25.90%22.90%18.90%100.00%
Table 6. Thermophysical parameters of the heat collection wall model.
LMaterialThickness (mm)Thermal
Conductivity (W/(m·K))
Specific Heat
(kJ/(kg·K))
Density
(kg/m³)
Temperature
Conductivity (m2/s)
L1Glass40.76000.84002300.00000.0014
L2Air1000.02591.00501.20500.0770
L3Polystyrene800.05041.500032.00000.0038
L4Aerated concrete2000.35201.0500700.00000.0017
Table 7. Attenuation and delay calculation results.
OrderTraditional WallHeat-Collecting Wall with Vent Closing
ν y n ξ y n   ( rad ) ν y n ξ y n   ( rad )
170.028.42292.5211.11
2173.356.131054.908.05
3350.805.082899.836.56
4640.544.456754.425.64
Table 8. Calculation of supplied heat and heat collection efficiency at each measurement point.
Measuring PointP1P2P3P4P5
Qm-ave242.31254.73284.61295.73293.83
Qm-max579.99542.01528.87504.66495.04
Qm-min50.0688.40102.9289.8063.93
ηave0.190.190.190.190.18
ηmax0.210.220.220.210.21
ηmin0.110.150.160.160.14
Publisher’s Note: MDPI stays neutral with regard to jurisdictional claims in published maps and institutional affiliations.

