A Fundamental Study on the Development of New Energy Performance Index in Office Buildings
Abstract
:1. Introduction
1.1. Research Background and Objective
1.2. Research Method and Scope
2. Analysis of Previous Research
3. Simulation Overview
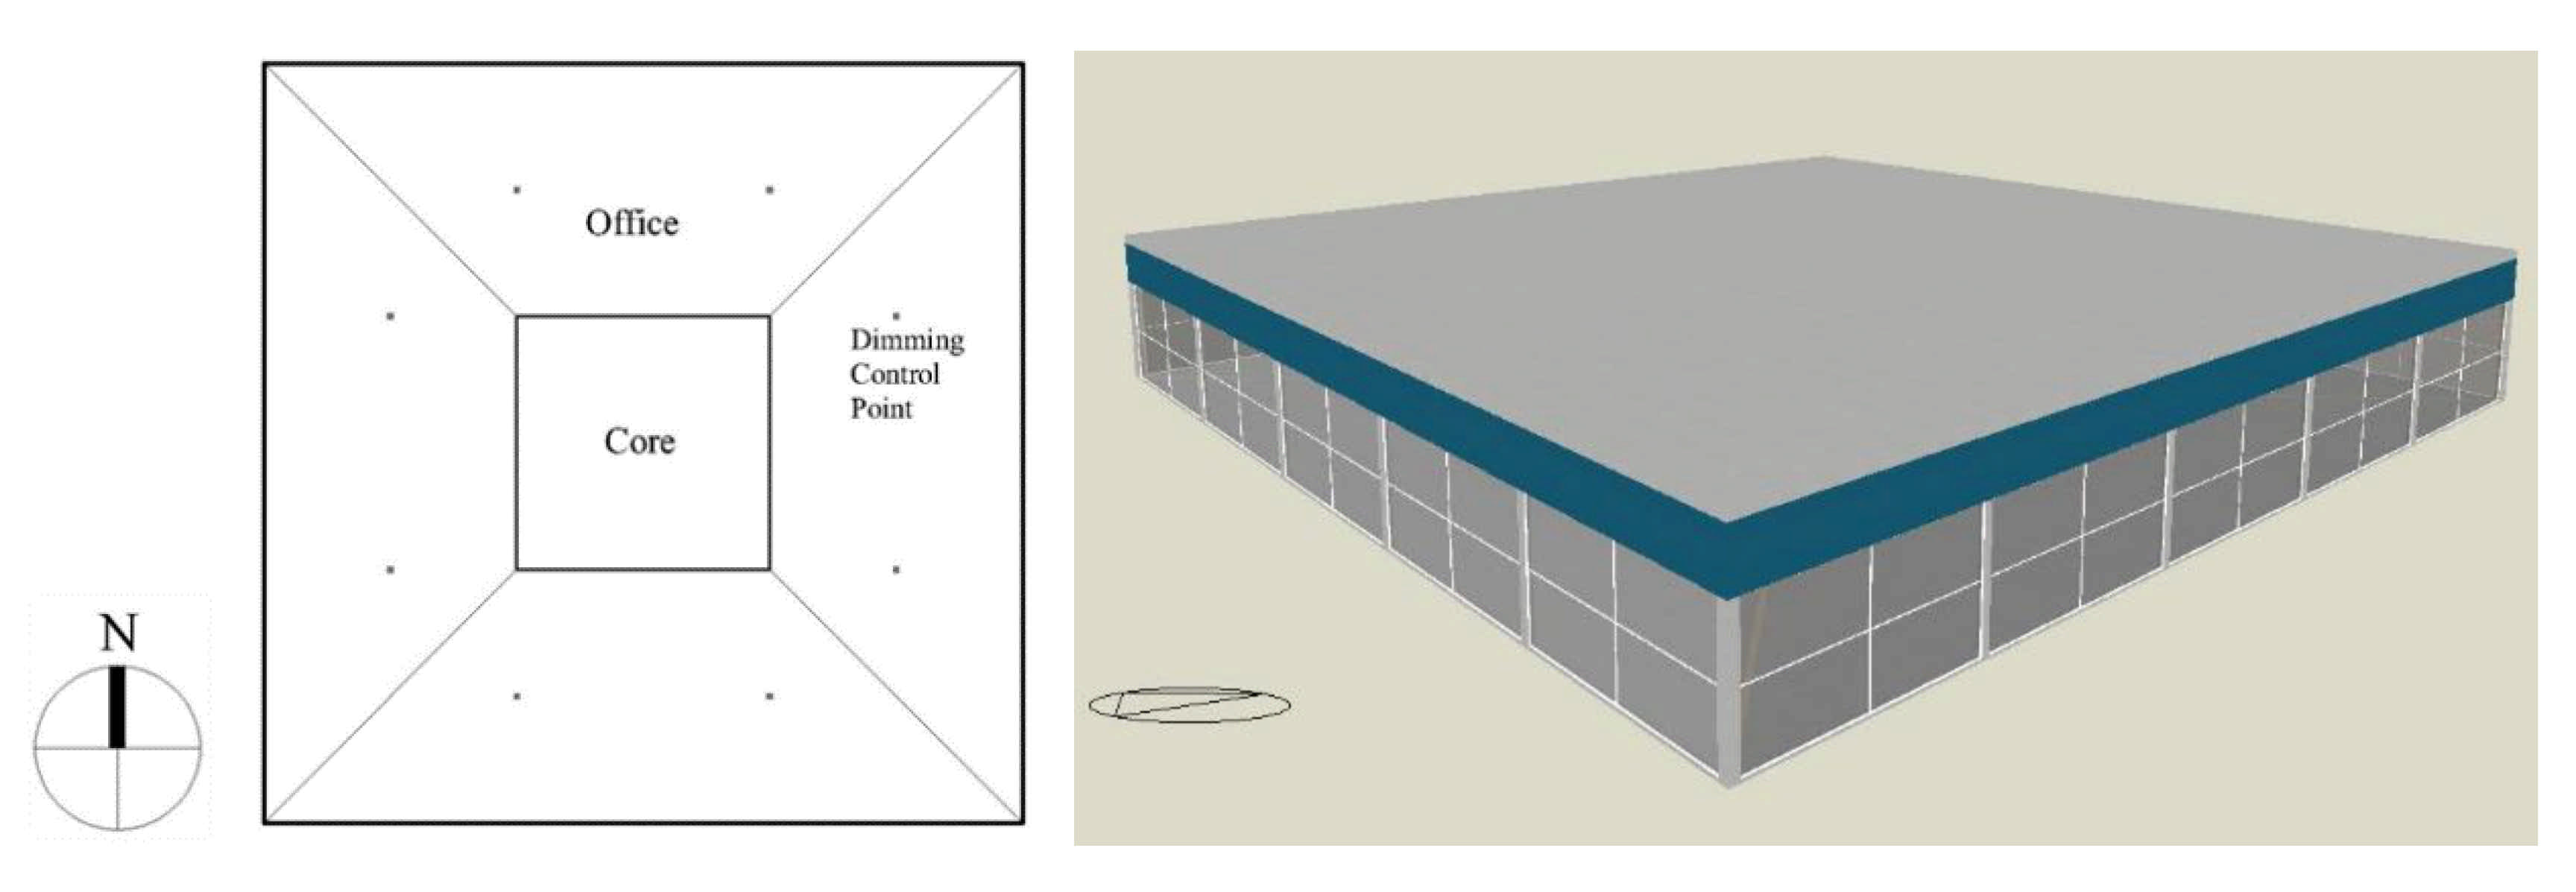
3.1. Baseline Building Model
3.2. Window Materials Perperties of the Building Model
4. Analysis of Simulation Results
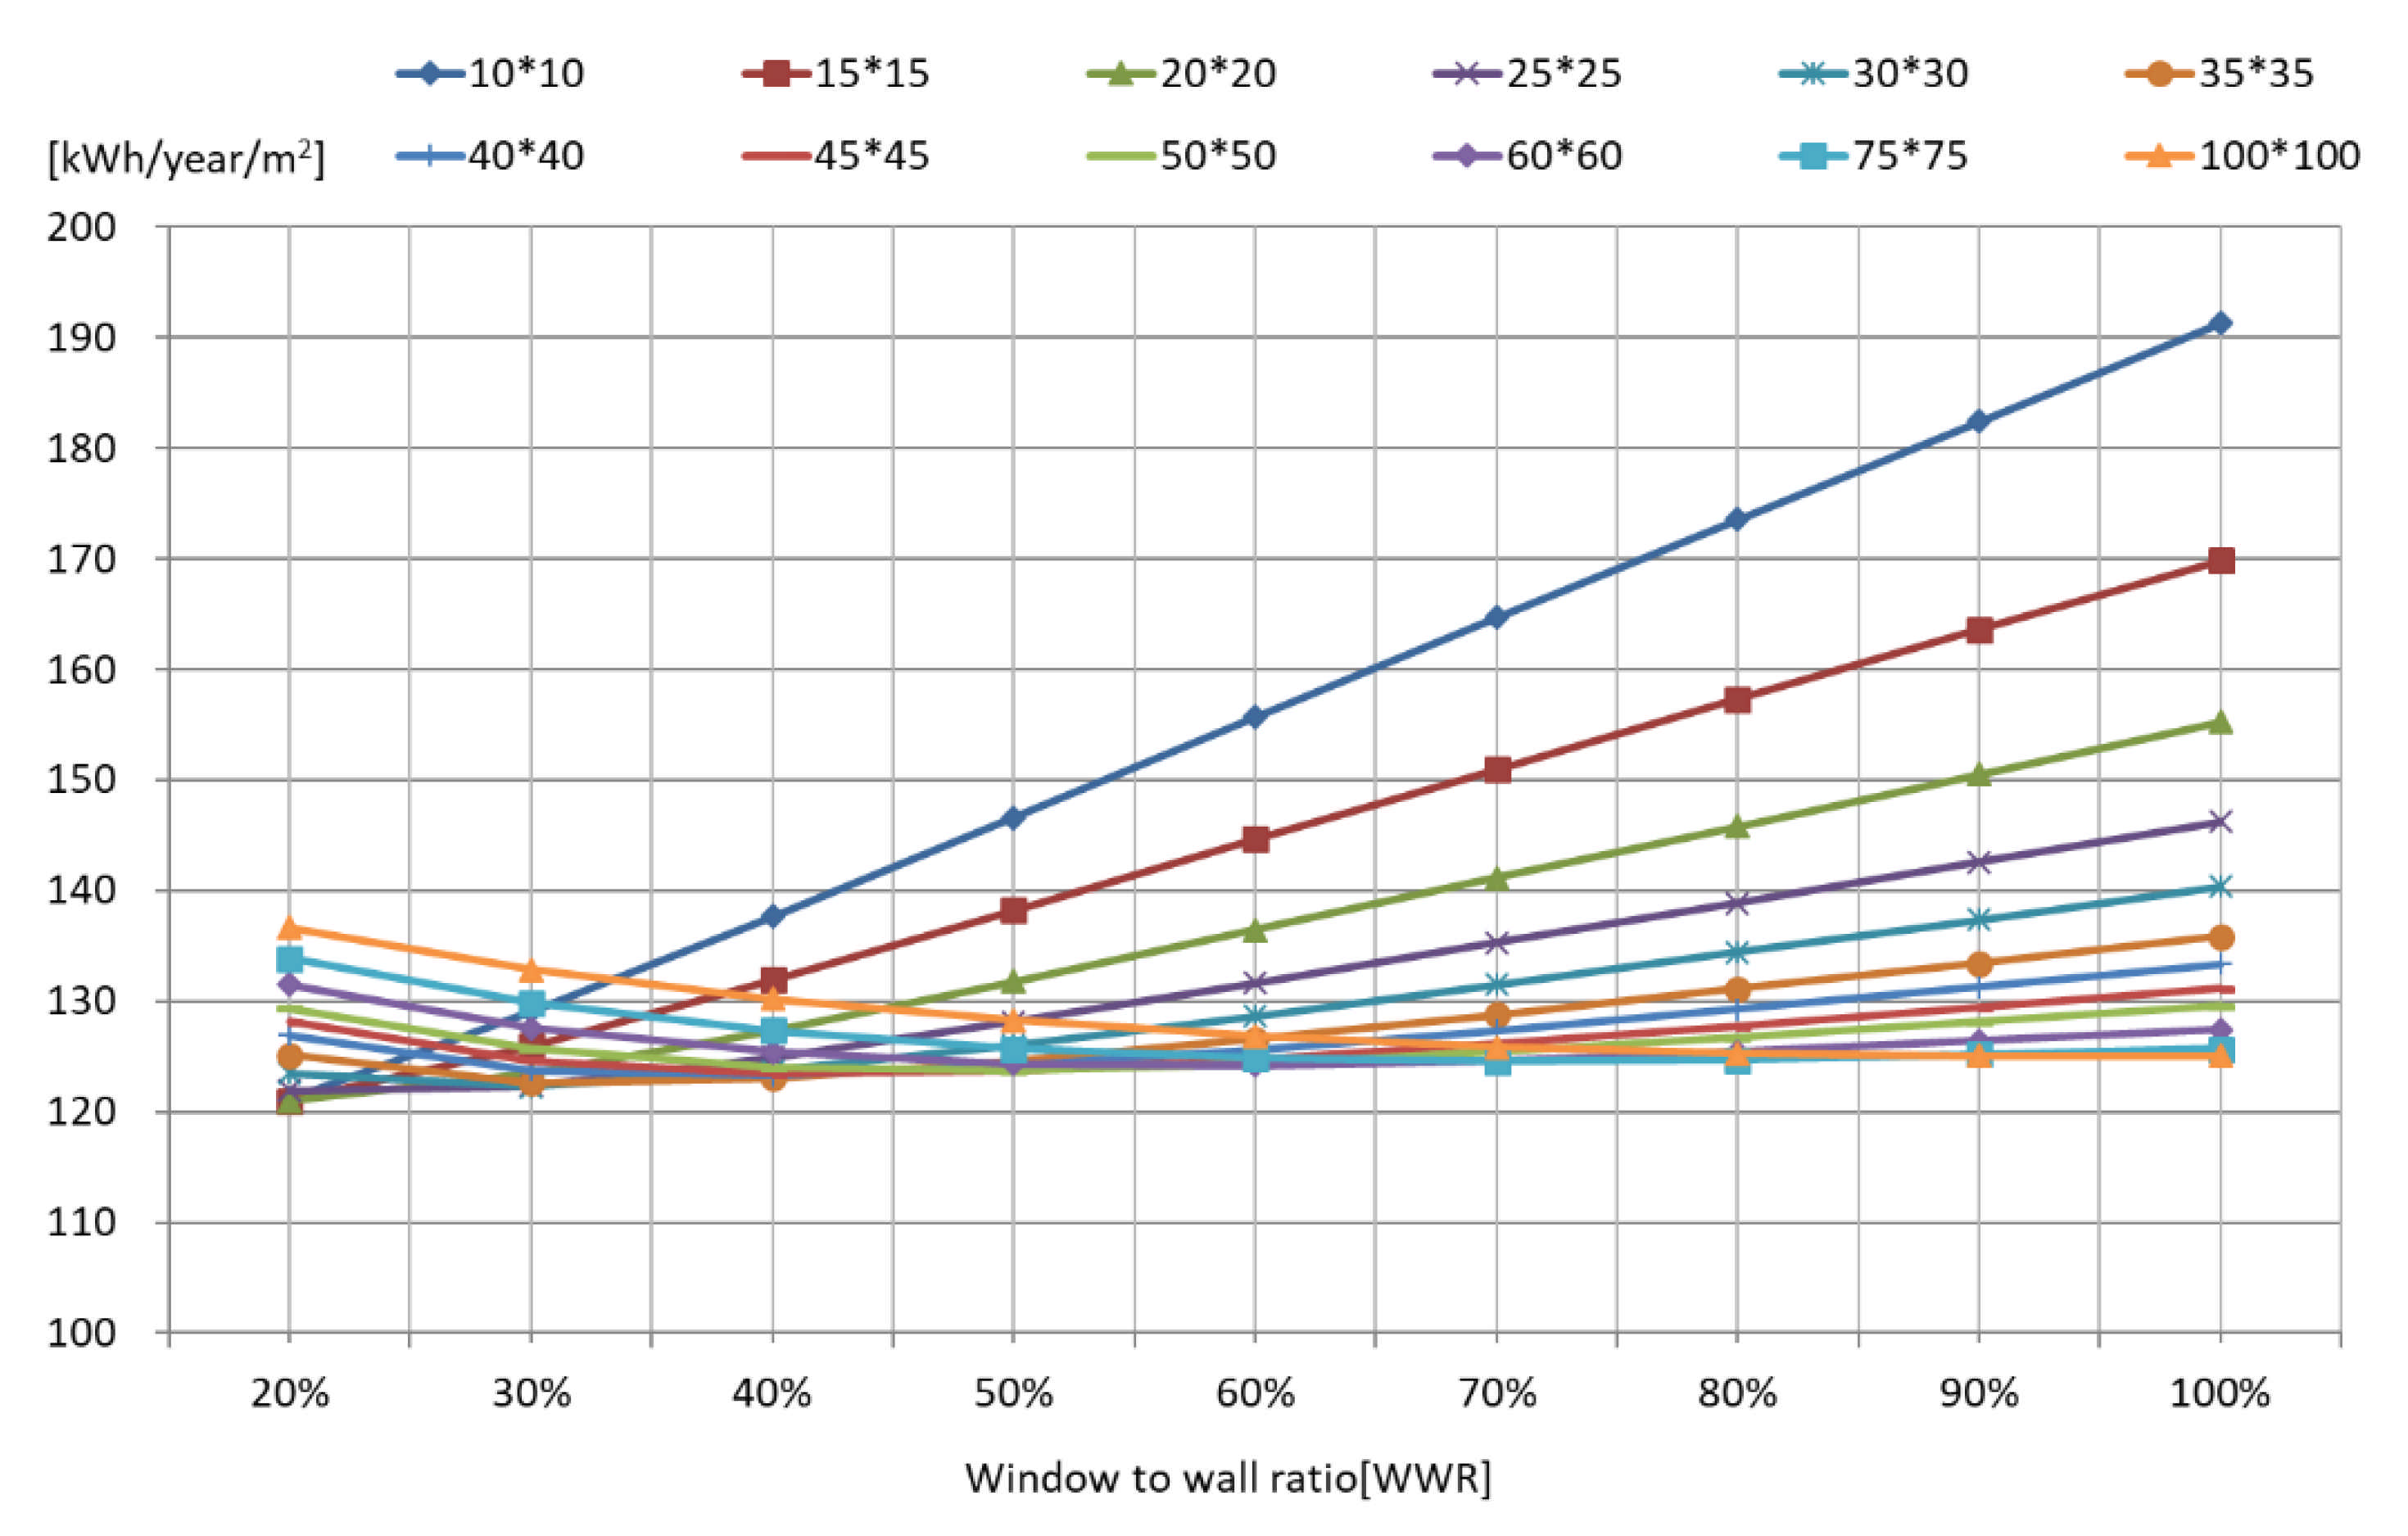
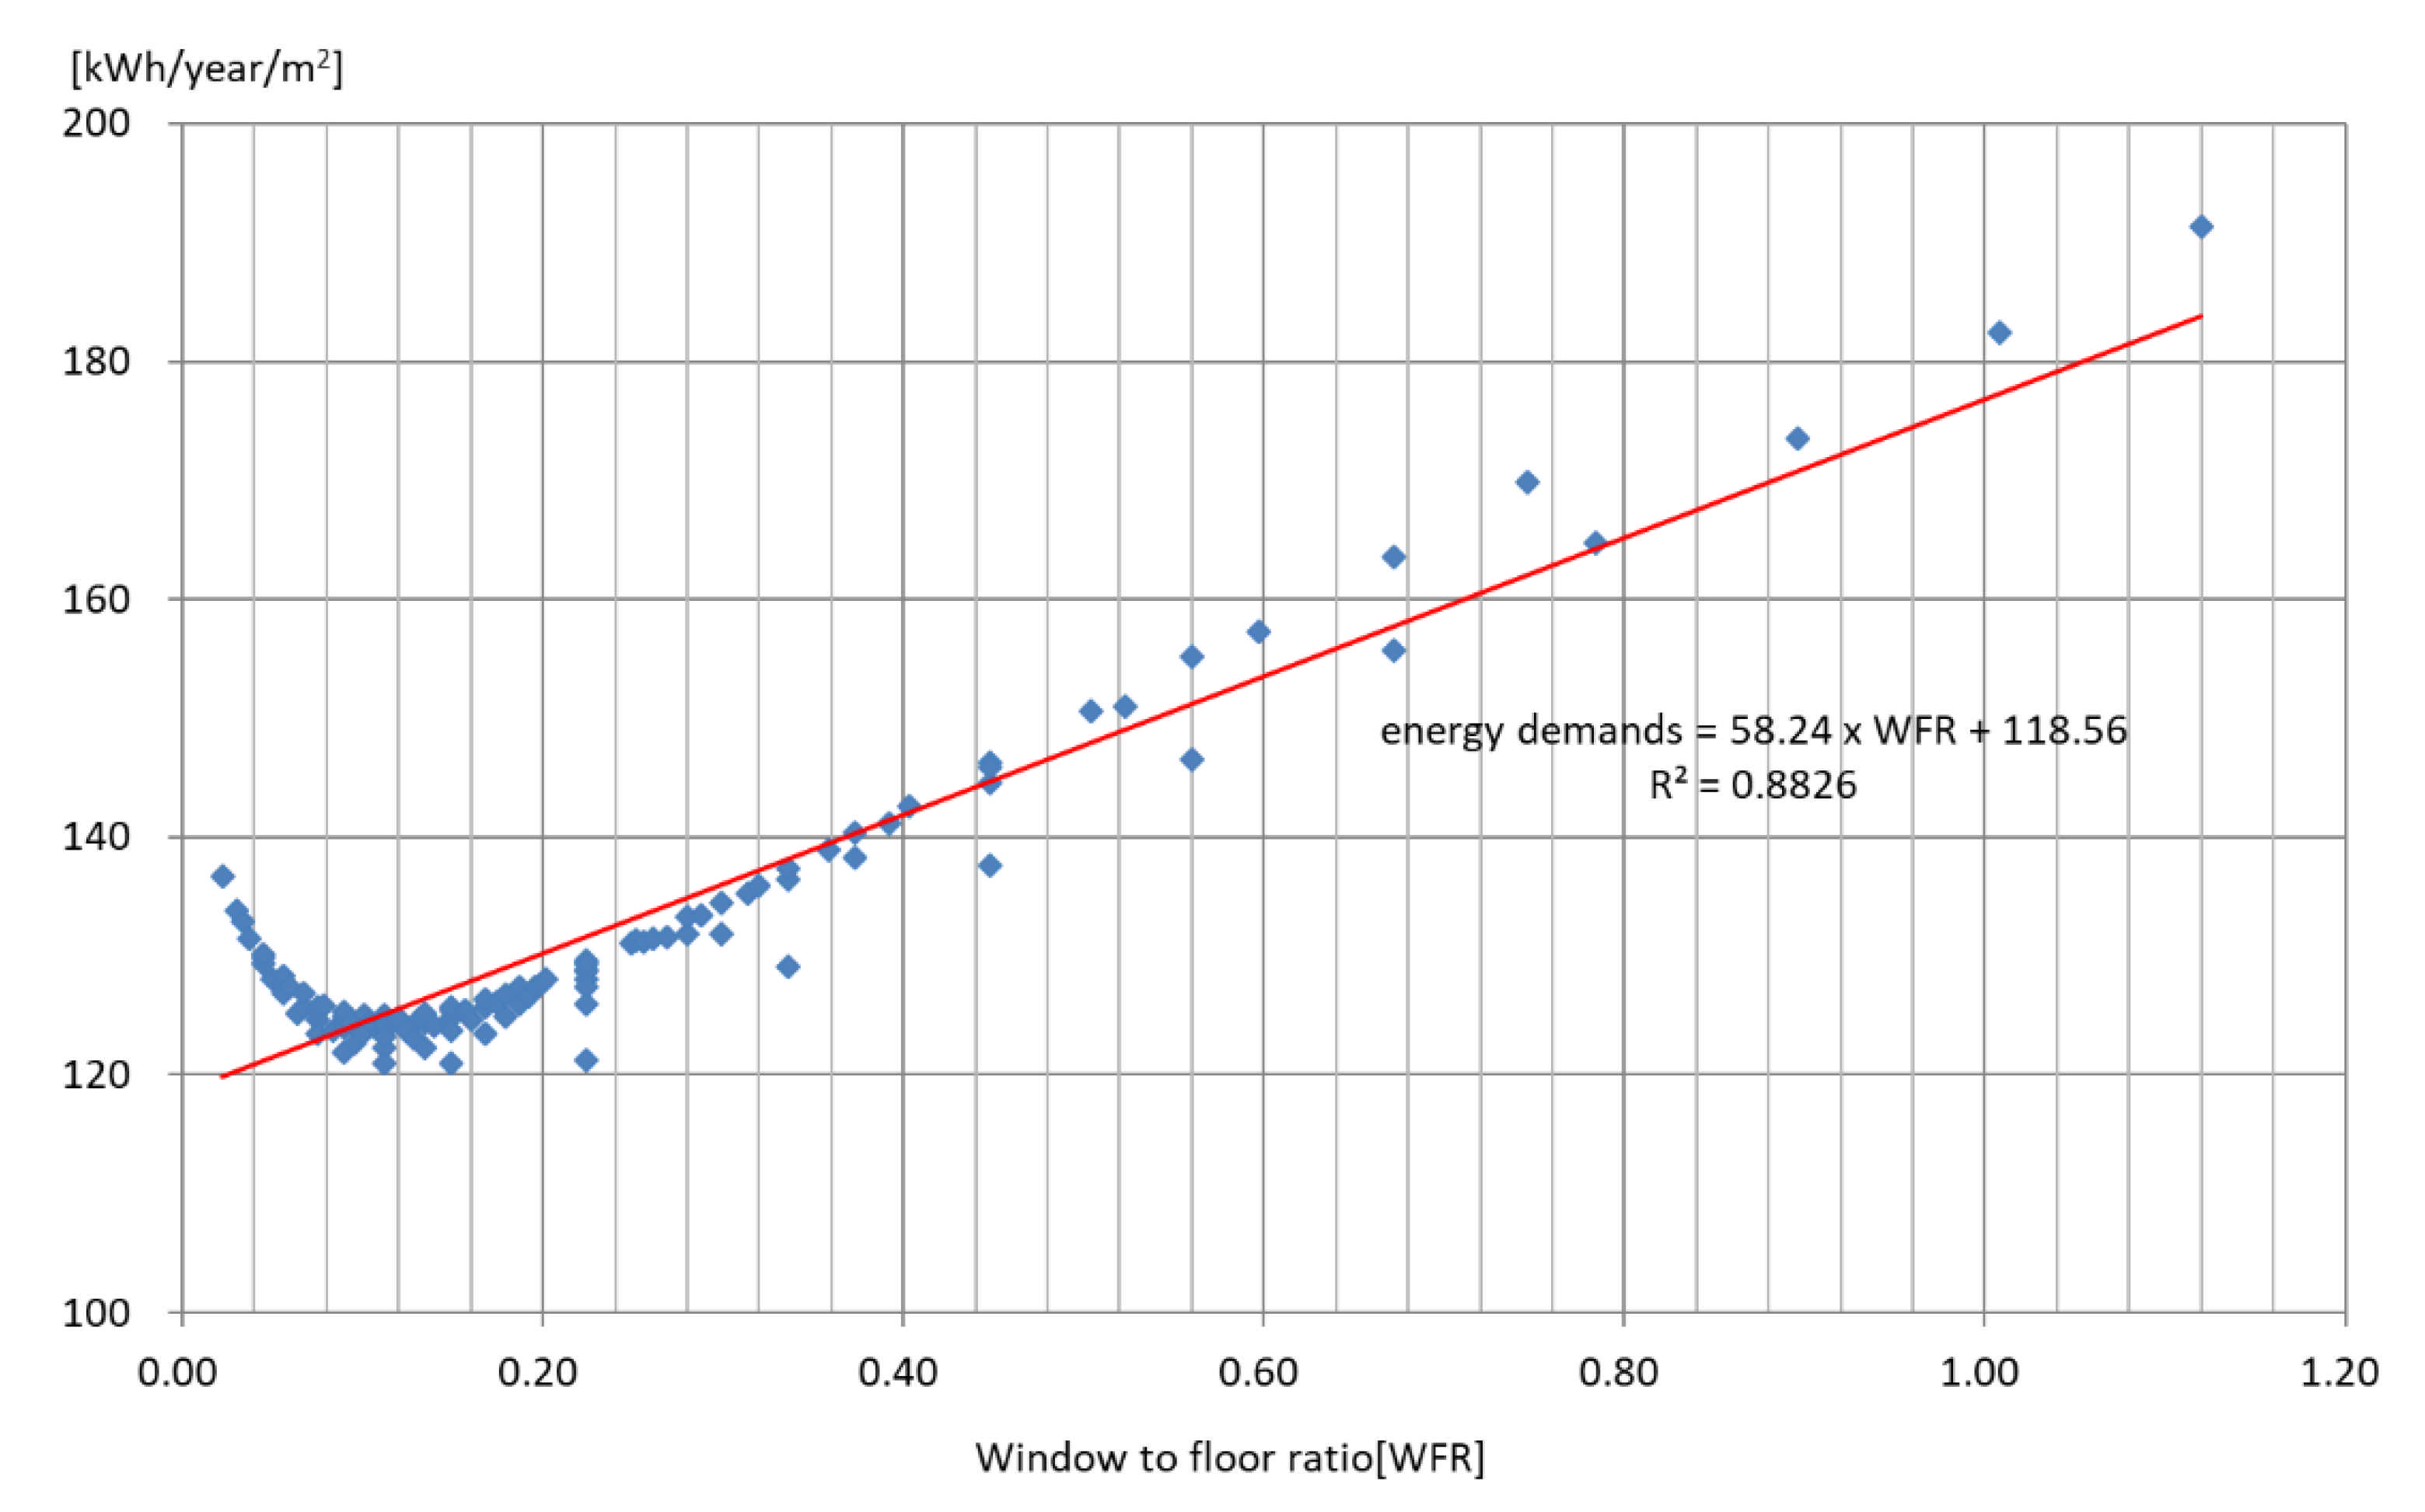
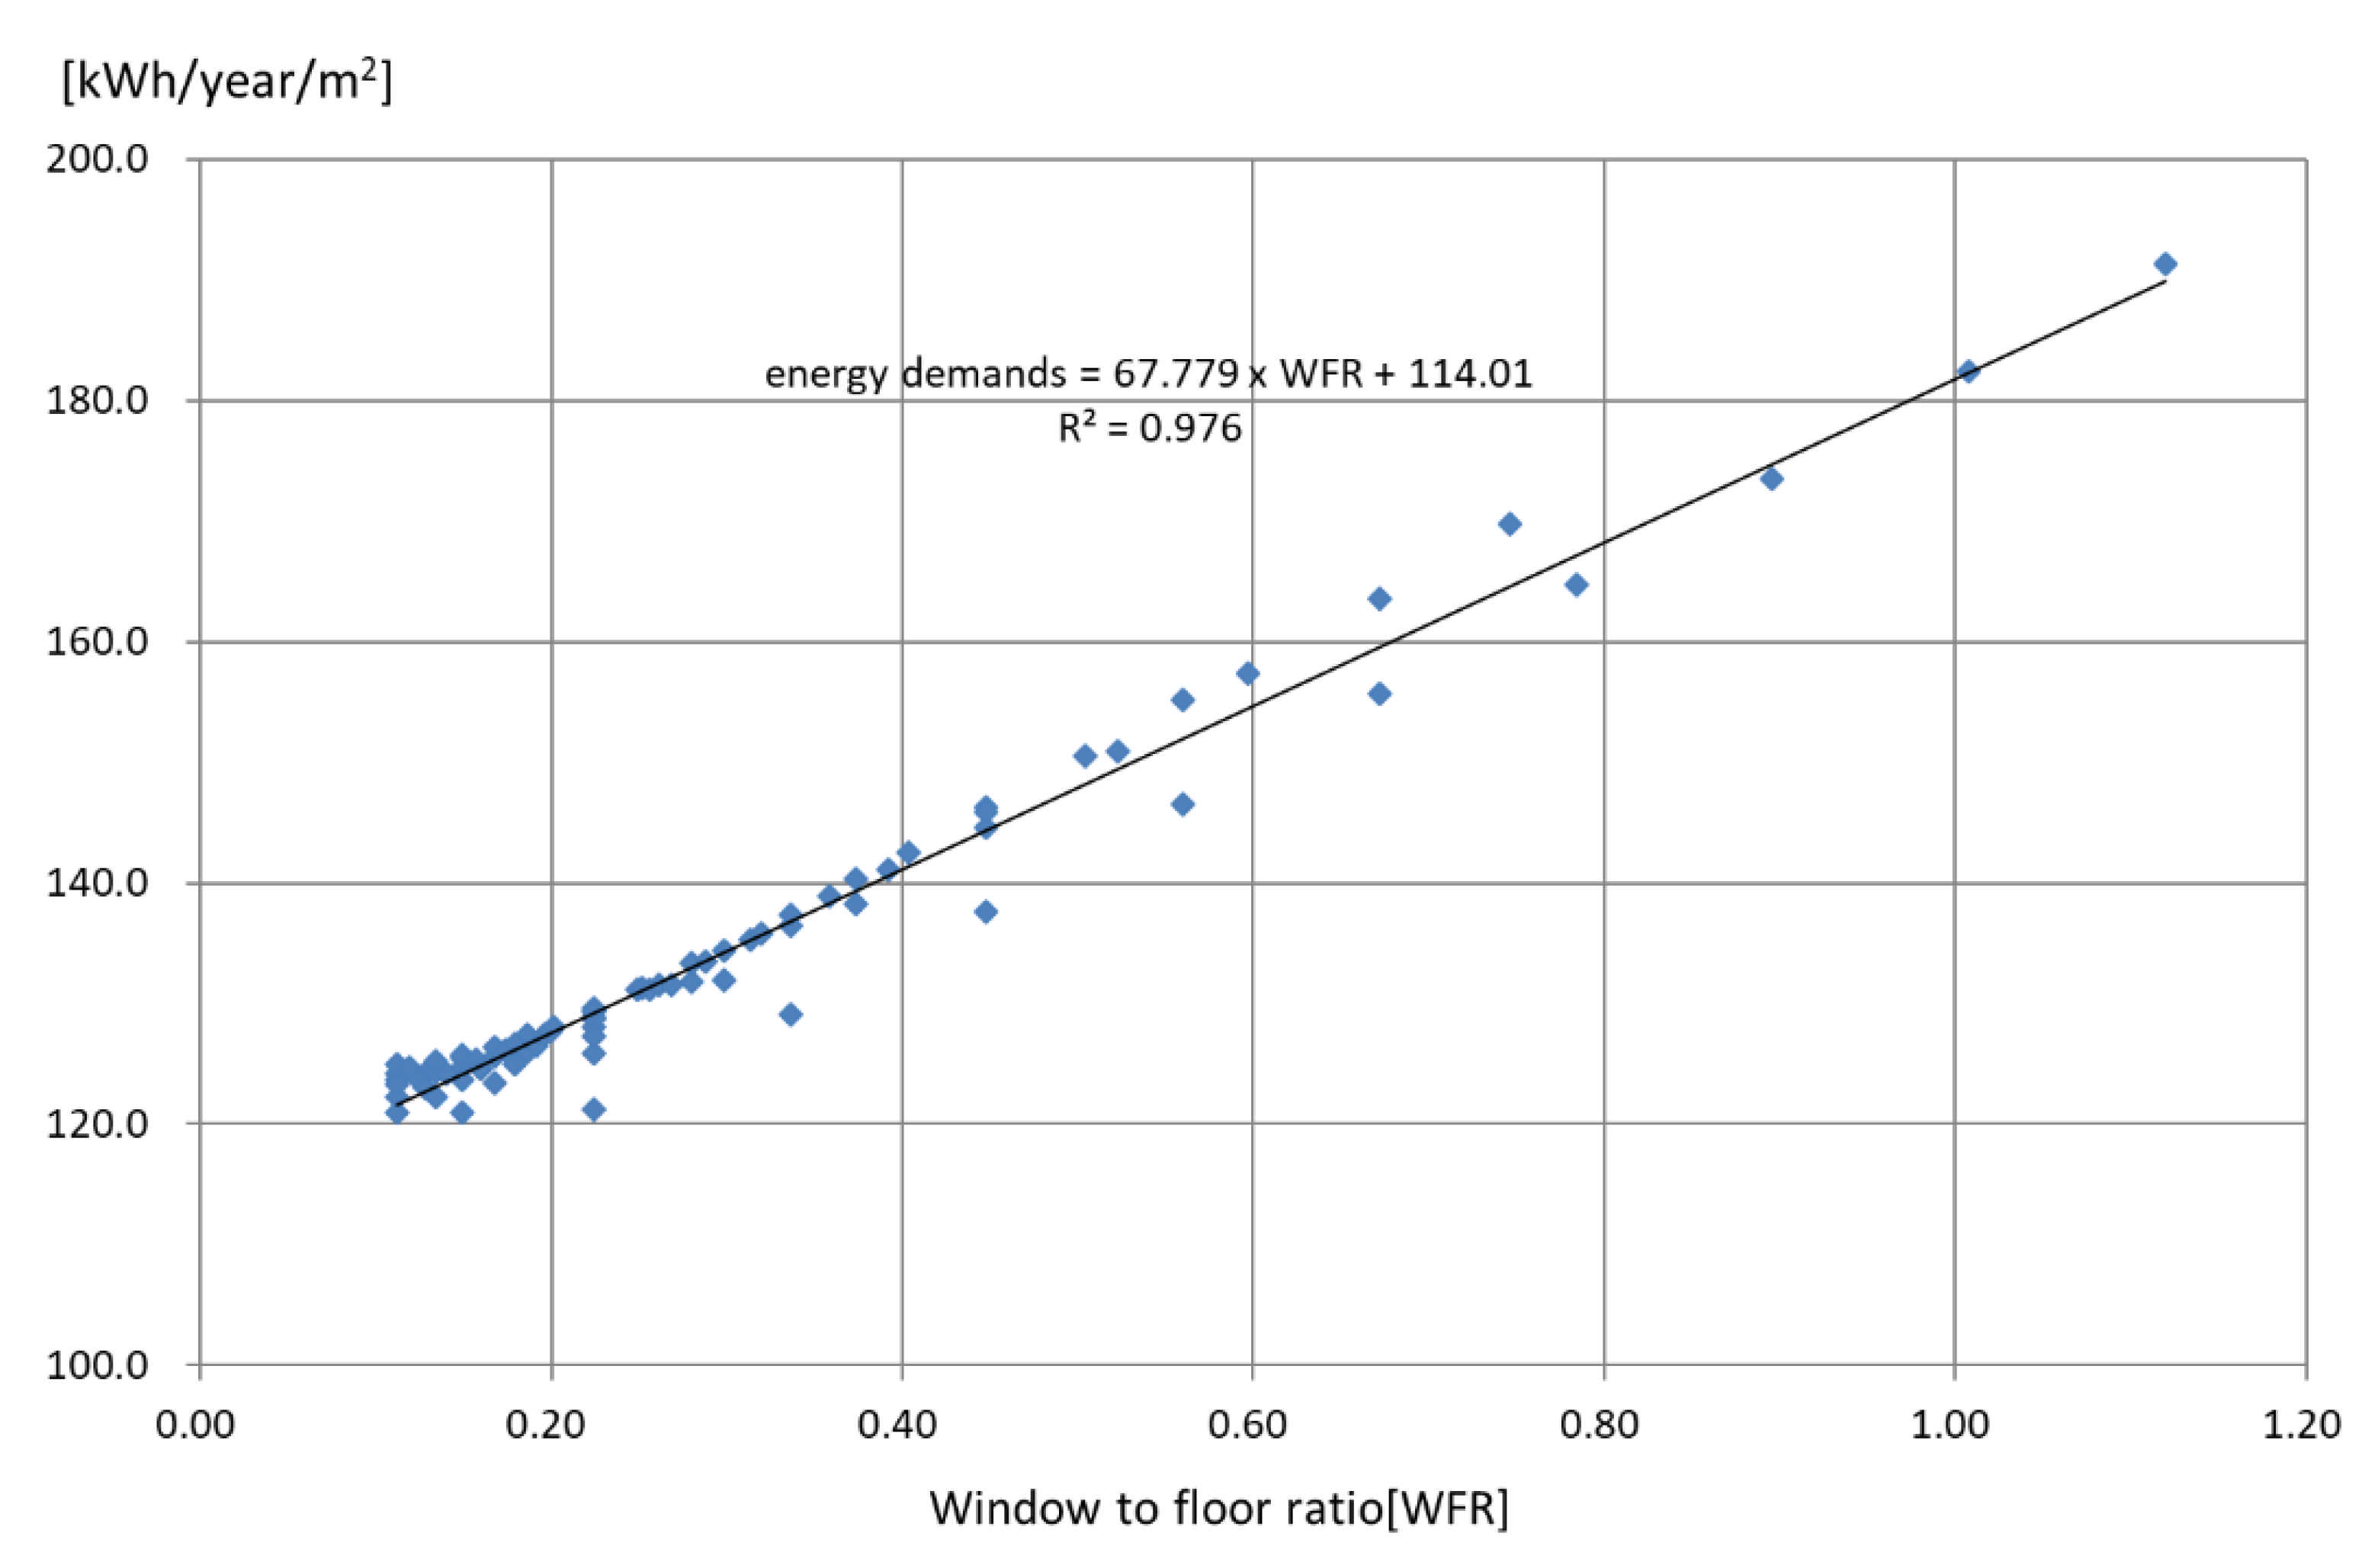
4.1. Correlation between WWR and Building Energy
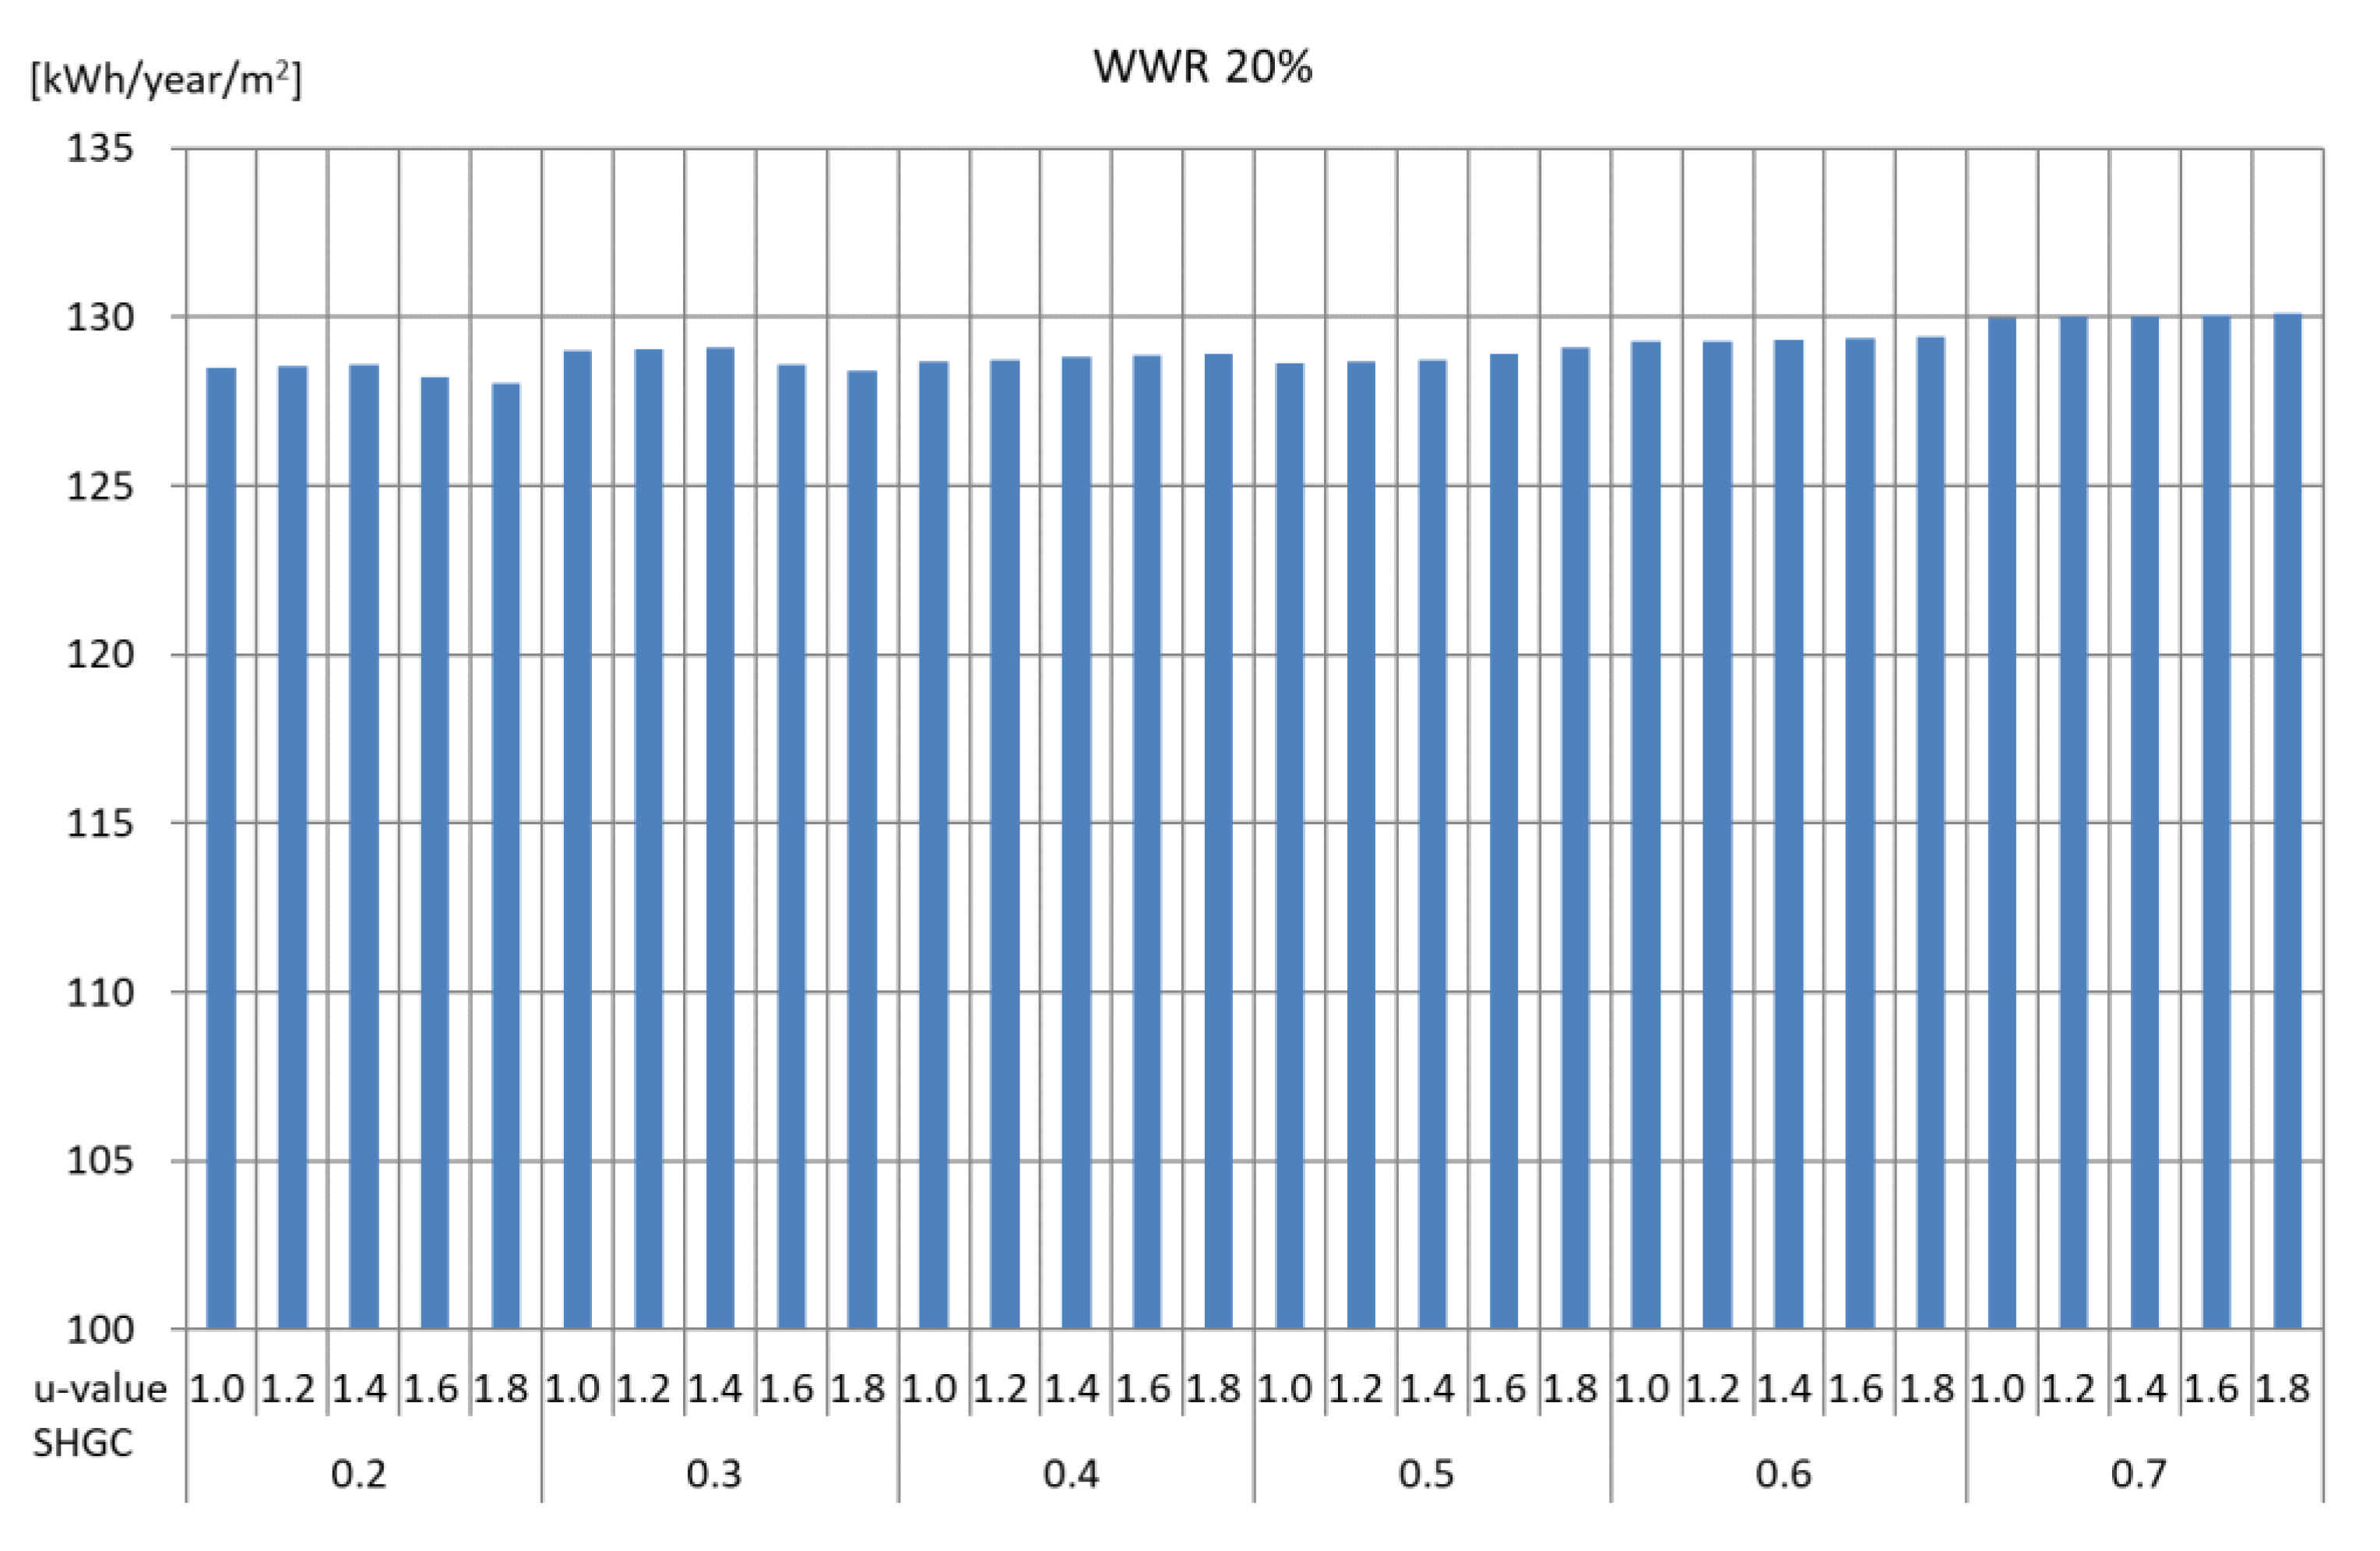
4.2. Correlation between Window Performance and Buliding Energy Use
5. Conclusions
Author Contributions
Funding
Institutional Review Board Statement
Informed Consent Statement
Conflicts of Interest
References
- Tracking Buildings 2020, International Energy Agency, Paris. Available online: https://www.iea.org/reports/tracking-buildings-2020 (accessed on 31 January 2021).
- Kazmierczak, K. Review of Curtain Walls, focusing on Design Problems and Solutions. In Proceedings of the International conference on Building Enclosure Science & Technology, Portland, OR, USA, 12–14 May 2010. [Google Scholar]
- Yoon, Y.S.; Mun, S.H.; Yoon, J.H.; Hyun, J.H.; Choi, M.H.; Hwang, W.J.; Shin, J.G.; Choi, W.K. A Study of Correlation between Window to Floor Ration and Building Energy in Buildings. J. Archit. Inst. Korea 2012, 27, 243–250. [Google Scholar]
- Yoon, J.H.; Hong, W.H.; Hwang, W.J.; Choi, W.K. A Study of Correlation Between Performance and Building Energy -Focused on the U-value, SHGC and VLT in a Curtain Wall building. J. Archit. Inst. Korea 2011, 27, 341–348. [Google Scholar]
- John, C.; Stephen, S.; Eleanor, S.L.; Dariush, A.; Todd, W. Window Systems for High-Performance Buildings; W.W. Norton & Company, Inc.: New York, NY, USA, 2004. [Google Scholar]
- Jung, J.H.; Choi, S.H.; Min, J.K. The Analysis on Annual Energy Performance according to Characteristics of Curtain-wall Glasses in Office Building. In Proceedings of the Korean Society of Ecological and Environmental Architecture Conference, Seoul, Korea, 26 May 2010. [Google Scholar]
- Jeong, Y.S.; Jung, H.K.; Jang, H.K.; Yu, K.H. A study on the reference building based on the building design trends for non-residential building. J. Korean Sol. Energy Soc. 2014, 34, 1–11. [Google Scholar] [CrossRef]
- EnergyPlus Documentation–Getting Started; U.S. Department of Energy, 2010.
- Lim, T.S.; Kim, B.S. Improvement of Indoor Thermal Environment through Solar Heat Gain Loads Reduction for an Office Building. Archit. Inst. Korea 2010, 10, 313–320. [Google Scholar]
- Goia, F. Search for the Optimal window-to-wall ratio in Office Buildings in different European Climates and the Implications on Total Energy Saving Potential. Solar Energy 2016, 132, 467–492. [Google Scholar] [CrossRef]
- Chi, F.; Wang, Y.; Wang, R.; Li, G.; Peng, C. An Investigation of Optimal window-to-wall Ratio based on changes in Building Orientations for Traditional Dwellings. Solar Energy 2020, 195, 64–81. [Google Scholar] [CrossRef]
- Wen, L.; Hiyama, K.; Koganei, M. A Method for creating Maps of recommended window-to-wall ratios to assign appropriate default Values in Design Performance Modeling: A Case Study of a typical Office Building in Japan. Energy Build. 2017, 145, 304–317. [Google Scholar] [CrossRef]
- Xue, P.; Li, Q.; Zhao, M.; Liu, J. Optimization of window-to-wall ratio with Sunshades in China low Latitude Region considering Daylighting and Energy Saving Requirements. Appl. Energy 2019, 233–234, 62–70. [Google Scholar] [CrossRef]
- Phillips, R.; Troup, L.; Fannon, D.; Eckelman, M.J. Triple bottom Line Sustainability Assessment of window-to-wall ratio in US Office Buildings. Build. Environ. 2020, 182, 1–13. [Google Scholar] [CrossRef]
- Troup, L.; Phillips, R.; Eckelman, M.J.; Fannon, D. Effect of window-to-wall ratio on measured Enrgy Consumption in US office Buildings. Energy Build. 2019, 203, 1–10. [Google Scholar] [CrossRef]
- Badeche, M.; Bouchahm, Y. Design optimization Criteria for Windows providing Low Energy Demand in Office Buildings in Algeria. Environ. Sustain. Indic. 2020, 6, 1–10. [Google Scholar] [CrossRef]
- Marino, C.; Nucara, A.; Pietrafesa, M. Does Window-to-wall Ratio have a Significant Effect on the Energy Consumption of Buildings? A Parametric Analysis in Italian Climate Conditions. J. Build. Eng. 2017, 13, 169–183. [Google Scholar] [CrossRef]
- Didwania, S.K.; Garg, V.; Mathur, J. Optimization of Window-Wall Ratio for Different Building Types; ResearchGate: Berlin, Germany, 2011; pp. 1–11. [Google Scholar]
- Shen, H.; Tzempelikos, A. Sensitivity analysis on daylighting and energy performance of perimeter offices with automated shading. Build. Environ. 2013, 59, 303–314. [Google Scholar] [CrossRef]
- Basack, S.; Sarkar, A. Evaluation of Correction Factor in Quasi-steady State Method for Assessment of Operational Cooling Impact of Orientation on Window, Wall and Floor Area. J. Chart. Assoc. Build. Eng. 2018, 9, 26–30. [Google Scholar]
- Yoon, Y.S.; Choi, W.K.; Sim, M.H. A study on the characteristics of the energy performance in curtain wall building. J. Archit. Inst. Korea 2013, 29, 255–263. [Google Scholar]


| WWR (%) | Building Size (m2) | 10*10 | 15*15 | 20*20 | 25*25 | 30*30 | 35*35 | 40*40 | 45*45 | 50*50 | 60*60 | 75*75 | 100*100 |
|---|---|---|---|---|---|---|---|---|---|---|---|---|---|
| Floor Area (m2) | 100 | 225 | 400 | 625 | 900 | 1225 | 1600 | 2025 | 2500 | 3600 | 5625 | 10000 | |
| 100 | Window Area (m2) | 112.0 | 168.0 | 224.0 | 280.0 | 336.0 | 392.0 | 448.0 | 504.0 | 560.0 | 672.0 | 840.0 | 1120.0 |
| WFR | 1.12 | 0.75 | 0.56 | 0.45 | 0.37 | 0.32 | 0.28 | 0.25 | 0.22 | 0.19 | 0.15 | 0.11 | |
| 90 | Window Area (m2) | 100.8 | 151.2 | 201.6 | 252.0 | 302.4 | 352.8 | 403.2 | 453.6 | 504.0 | 604.8 | 756.0 | 1008.0 |
| WFR | 1.01 | 0.67 | 0.50 | 0.40 | 0.34 | 0.29 | 0.25 | 0.22 | 0.20 | 0.17 | 0.13 | 0.10 | |
| 80 | Window Area (m2) | 89.6 | 134.4 | 179.2 | 224.0 | 268.8 | 313.6 | 358.4 | 403.2 | 448.0 | 537.6 | 672.0 | 896.0 |
| WFR | 0.90 | 0.60 | 0.45 | 0.36 | 0.30 | 0.26 | 0.22 | 0.20 | 0.18 | 0.15 | 0.12 | 0.09 | |
| 70 | Window Area (m2) | 78.4 | 117.6 | 156.8 | 196.0 | 235.2 | 274.4 | 313.6 | 352.8 | 392.0 | 470.4 | 588.0 | 784.0 |
| WFR | 0.78 | 0.52 | 0.39 | 0.31 | 0.26 | 0.22 | 0.20 | 0.17 | 0.16 | 0.13 | 0.10 | 0.08 | |
| 60 | Window Area (m2) | 67.2 | 100.8 | 134.4 | 168.0 | 201.6 | 235.2 | 268.8 | 302.4 | 336.0 | 403.2 | 504.0 | 672.0 |
| WFR | 0.67 | 0.45 | 0.34 | 0.27 | 0.22 | 0.19 | 0.17 | 0.15 | 0.13 | 0.11 | 0.09 | 0.07 | |
| 50 | Window Area (m2) | 56.0 | 84.0 | 112.0 | 140.0 | 168.0 | 196.0 | 224.0 | 252.0 | 280.0 | 336.0 | 420.0 | 560.0 |
| WFR | 0.56 | 0.37 | 0.28 | 0.22 | 0.19 | 0.16 | 0.14 | 0.12 | 0.11 | 0.09 | 0.07 | 0.06 | |
| 40 | Window Area (m2) | 44.8 | 67.2 | 89.6 | 112.0 | 134.4 | 156.8 | 179.2 | 201.6 | 224.0 | 268.8 | 336.0 | 448.0 |
| WFR | 0.45 | 0.30 | 0.22 | 0.18 | 0.15 | 0.13 | 0.11 | 0.10 | 0.09 | 0.07 | 0.06 | 0.04 | |
| 30 | Window Area (m2) | 33.6 | 50.4 | 67.2 | 84.0 | 100.8 | 117.6 | 134.4 | 151.2 | 168.0 | 201.6 | 252.0 | 336.0 |
| WFR | 0.34 | 0.22 | 0.17 | 0.13 | 0.11 | 0.10 | 0.08 | 0.07 | 0.07 | 0.06 | 0.04 | 0.03 | |
| 20 | Window Area (m2) | 22.4 | 33.6 | 44.8 | 56.0 | 67.2 | 78.4 | 89.6 | 100.8 | 112.0 | 134.4 | 168.0 | 224.0 |
| WFR | 0.22 | 0.15 | 0.11 | 0.09 | 0.07 | 0.06 | 0.06 | 0.05 | 0.04 | 0.04 | 0.03 | 0.02 |
| Description (U-Value, W/m2K) | Material | Conductivity (W/m K) | Specific Heat (J/kg K) | Density (kg/m3) |
|---|---|---|---|---|
| Internal Wall (1.600) | Mortar | 0.880 | 896 | 2800 |
| lightweight Concrete | 0.380 | 1000 | 1200 | |
| Mortar | 0.880 | 896 | 2800 | |
| Slab (3.535) | Concrete | 1.400 | 1000 | 2100 |
| Spandrel (0.356) | Glass | 1.000 | 837 | 2400 |
| Air | 0.024 | 1005 | 1.293 | |
| Aluminum | 160 | 880 | 2800 | |
| Glass wool | 0.036 | 1000 | 24 | |
| Aluminum | 160 | 880 | 2800 |
| Setting temperature | Heating: 20 °C Cooling: 26 °C | |
| Operating schedule | Weekday: 08:00~18:00 Weekend: Off | |
| Occupancy | 0.11 people/m2 | |
| Met. | 126 W/person | |
| Internal gains | Office | 15 W/m2 |
| Core | 2 W/m2 | |
| Target lux | Office | 400 lux |
| Core | 100 lux | |
| Lighting | 3.4 W/m2 100 lux (dimming control) | |
| Infiltration | 0.3 ACH | |
| HVAC | Ideal load air system | |
| Weather data | Seoul TMY2 | |
| Month | Dry Bulb Temp. (°C) | Dew Point Temp. (°C) | Relative Humidity (%) | Global Radiation (kWh/m2) | Wind Speed (m/s) |
| Jan | −1.29 | −7.84 | 60.40 | 37.20 | 2.35 |
| Feb. | 0.98 | −7.24 | 54.38 | 44.14 | 2.55 |
| Mar. | 6.87 | −1.76 | 55.42 | 60.83 | 2.77 |
| Apr. | 13.04 | 2.84 | 53.49 | 74.67 | 2.72 |
| May | 18.27 | 10.23 | 62.36 | 81.97 | 2.46 |
| Jun. | 22.82 | 15.67 | 66.09 | 85.90 | 2.07 |
| Jul. | 25.29 | 20.30 | 74.33 | 67.50 | 2.19 |
| Aug. | 24.84 | 19.97 | 74.31 | 65.91 | 1.56 |
| Sep. | 20.92 | 14.80 | 69.32 | 52.41 | 1.83 |
| Oct. | 15.48 | 7.74 | 61.31 | 49.69 | 1.78 |
| Nov. | 6.20 | −0.68 | 62.61 | 33.85 | 2.14 |
| Dec. | 0.99 | −5.65 | 59.81 | 39.54 | 2.25 |
| (a) Total energy demands according to the building size (kWh) | ||||||||||||
| WWR | 10*10 | 15*15 | 20*20 | 25*25 | 30*30 | 35*35 | 40*40 | 45*45 | 50*50 | 60*60 | 75*75 | 100*100 |
| 20% | 12,117.9 | 27,220.9 | 48,388.9 | 76,206.5 | 111,148.5 | 153,314.7 | 203,061.3 | 259,402.8 | 323,319.2 | 473,272.8 | 752,832.1 | 1366,458.1 |
| 30% | 12,906.9 | 28,333.3 | 49,367.4 | 76,449.0 | 110,022.0 | 150,260.0 | 198,014.1 | 252,380.6 | 314,163.7 | 459,343.7 | 730,549.9 | 1328,527.3 |
| 40% | 13,767.5 | 29,678.3 | 50,941.6 | 78,067.2 | 111,332.5 | 150,717.6 | 197,222.0 | 249,932.6 | 310,030.2 | 451,372.3 | 716,479.1 | 1,301,919.2 |
| 50% | 14,655.0 | 31,102.8 | 52,719.5 | 80,073.8 | 113,391.2 | 152,620.4 | 198,662.0 | 250,459.7 | 309,291.7 | 447,706.4 | 707,163.0 | 1282,725.8 |
| 60% | 15,565.2 | 32,540.2 | 54,582.8 | 82,256.5 | 115,795.2 | 155,027.2 | 201,023.8 | 252,585.7 | 310,865.3 | 447,146.5 | 702,364.8 | 1268,574.7 |
| 70% | 16,470.1 | 33,969.3 | 56,462.3 | 84,534.4 | 118,366.8 | 157,768.7 | 203,786.9 | 255,386.5 | 313,517.1 | 448,681.4 | 700,566.4 | 1258,687.2 |
| 80% | 17,351.0 | 35,397.4 | 58,328.2 | 86,795.8 | 120,979.3 | 160,660.1 | 206,880.6 | 258,600.2 | 316,728.9 | 451,536.9 | 701,511.2 | 1,252,927.4 |
| 90% | 18,242.5 | 36,811.7 | 60,212.1 | 89,098.6 | 123,634.9 | 163,474.2 | 210,103.1 | 262,044.3 | 320,292.1 | 455,043.1 | 704,071.2 | 1,250,324.3 |
| 100% | 19,128.3 | 38,210.3 | 62,081.0 | 91,410.9 | 126,345.6 | 166,442.8 | 213,312.0 | 265,526.3 | 323,955.8 | 458,827.3 | 706,983.4 | 1,250,313.2 |
| (b) Energy demands per area according to the building size (kWh/m2) | ||||||||||||
| Floor area (m2) | 100 | 225 | 400 | 625 | 900 | 1225 | 1600 | 2025 | 2500 | 3600 | 5625 | 10,000 |
| 20% | 121.2 | 121.0 | 121.0 | 121.9 | 123.5 | 125.2 | 126.9 | 128.1 | 129.3 | 131.5 | 133.8 | 136.6 |
| 30% | 129.1 | 125.9 | 123.4 | 122.3 | 122.2 | 122.7 | 123.8 | 124.6 | 125.7 | 127.6 | 129.9 | 132.9 |
| 40% | 137.7 | 131.9 | 127.4 | 124.9 | 123.7 | 123.0 | 123.3 | 123.4 | 124.0 | 125.4 | 127.4 | 130.2 |
| 50% | 146.6 | 138.2 | 131.8 | 128.1 | 126.0 | 124.6 | 124.2 | 123.7 | 123.7 | 124.4 | 125.7 | 128.3 |
| 60% | 155.7 | 144.6 | 136.5 | 131.6 | 128.7 | 126.6 | 125.6 | 124.7 | 124.3 | 124.2 | 124.9 | 126.9 |
| 70% | 164.7 | 151.0 | 141.2 | 135.3 | 131.5 | 128.8 | 127.4 | 126.1 | 125.4 | 124.6 | 124.5 | 125.9 |
| 80% | 173.5 | 157.3 | 145.8 | 138.9 | 134.4 | 131.2 | 129.3 | 127.7 | 126.7 | 125.4 | 124.7 | 125.3 |
| 90% | 182.4 | 163.6 | 150.5 | 142.6 | 137.4 | 133.4 | 131.3 | 129.4 | 128.1 | 126.4 | 125.2 | 125.0 |
| 100% | 191.3 | 169.8 | 155.2 | 146.3 | 140.4 | 135.9 | 133.3 | 131.1 | 129.6 | 127.5 | 125.7 | 125.0 |
| SHGC | U-Value | WWR 20% | WWR 50% | WWR 100% | |||
|---|---|---|---|---|---|---|---|
| (-) | (W/m2K) | (kWh/Year) | (kWh/Year/m2) | (kWh/Year) | (kWh/Year/m2) | (kWh/Year) | (kWh/Year/m2) |
| 0.2 | 1.0 | 321,183.0 | 128.5 | 294,451.5 | 117.8 | 288,763.0 | 115.5 |
| 1.2 | 321,345.1 | 128.5 | 295,046.8 | 118.0 | 290,083.4 | 116.0 | |
| 1.4 | 321,491.2 | 128.6 | 295,700.5 | 118.3 | 291,567.4 | 116.6 | |
| 1.6 | 320,561.1 | 128.2 | 295,520.8 | 118.2 | 292,754.8 | 117.1 | |
| 1.8 | 320,129.3 | 128.1 | 295,760.1 | 118.3 | 294,225.9 | 117.7 | |
| 0.3 | 1.0 | 322,456.2 | 129.0 | 297,715.8 | 119.1 | 295,325.9 | 118.1 |
| 1.2 | 322,600.5 | 129.0 | 298,144.1 | 119.3 | 296,046.7 | 118.4 | |
| 1.4 | 322,731.5 | 129.1 | 298,619.5 | 119.4 | 296,981.1 | 118.8 | |
| 1.6 | 321,510.8 | 128.6 | 297,320.5 | 118.9 | 295,736.0 | 118.3 | |
| 1.8 | 321,046.6 | 128.4 | 297,326.8 | 118.9 | 296,470.5 | 118.6 | |
| 0.4 | 1.0 | 321747.5 | 128.7 | 298,458.7 | 119.4 | 298,704.7 | 119.5 |
| 1.2 | 321,863.8 | 128.7 | 298,749.1 | 119.5 | 299,075.9 | 119.6 | |
| 1.4 | 321,990.2 | 128.8 | 299,145.7 | 119.7 | 299,630.3 | 119.9 | |
| 1.6 | 322,100.9 | 128.8 | 299,563.3 | 119.8 | 300,416.8 | 120.2 | |
| 1.8 | 322,217.3 | 128.9 | 300,053.1 | 120.0 | 301,369.9 | 120.5 | |
| 0.5 | 1.0 | 321,561.9 | 128.6 | 300,641.4 | 120.3 | 305,424.7 | 122.2 |
| 1.2 | 321,671.1 | 128.7 | 300,838.7 | 120.3 | 305,206.6 | 122.1 | |
| 1.4 | 321,777.0 | 128.7 | 301,077.5 | 120.4 | 305,278.9 | 122.1 | |
| 1.6 | 322,264.3 | 128.9 | 302,430.7 | 121.0 | 306,689.6 | 122.7 | |
| 1.8 | 322,678.6 | 129.1 | 303,567.2 | 121.4 | 308,169.3 | 123.3 | |
| 0.6 | 1.0 | 323,154.9 | 129.3 | 305,307.7 | 122.1 | 315,962.8 | 126.4 |
| 1.2 | 323,242.0 | 129.3 | 305,330.3 | 122.1 | 315,122.3 | 126.0 | |
| 1.4 | 323,337.1 | 129.3 | 305,435.4 | 122.2 | 314,573.0 | 125.8 | |
| 1.6 | 323,430.2 | 129.4 | 305,546.5 | 122.2 | 314,327.7 | 125.7 | |
| 1.8 | 323,537.0 | 129.4 | 305,771.5 | 122.3 | 314,304.7 | 125.7 | |
| 0.7 | 1.0 | 324,964.0 | 130.0 | 310,849.6 | 124.3 | 328,848.1 | 131.5 |
| 1.2 | 325,031.0 | 130.0 | 310,614.6 | 124.2 | 327,115.9 | 130.8 | |
| 1.4 | 325,086.7 | 130.0 | 310,481.8 | 124.2 | 325,785.7 | 130.3 | |
| 1.6 | 325,160.2 | 130.1 | 310,455.5 | 124.2 | 324,875.4 | 130.0 | |
| 1.8 | 325,241.7 | 130.1 | 310,473.4 | 124.2 | 324,268.9 | 129.7 | |
Publisher’s Note: MDPI stays neutral with regard to jurisdictional claims in published maps and institutional affiliations. |
© 2021 by the authors. Licensee MDPI, Basel, Switzerland. This article is an open access article distributed under the terms and conditions of the Creative Commons Attribution (CC BY) license (https://creativecommons.org/licenses/by/4.0/).
Share and Cite
Kim, J.-H.; Son, S.-K.; Choi, G.-S.; Kim, Y.-T.; Kim, S.-B.; Choi, W.-K. A Fundamental Study on the Development of New Energy Performance Index in Office Buildings. Energies 2021, 14, 2064. https://doi.org/10.3390/en14082064
Kim J-H, Son S-K, Choi G-S, Kim Y-T, Kim S-B, Choi W-K. A Fundamental Study on the Development of New Energy Performance Index in Office Buildings. Energies. 2021; 14(8):2064. https://doi.org/10.3390/en14082064
Chicago/Turabian StyleKim, Jin-Hee, Seong-Koo Son, Gyeong-Seok Choi, Young-Tag Kim, Sung-Bum Kim, and Won-Ki Choi. 2021. "A Fundamental Study on the Development of New Energy Performance Index in Office Buildings" Energies 14, no. 8: 2064. https://doi.org/10.3390/en14082064
APA StyleKim, J.-H., Son, S.-K., Choi, G.-S., Kim, Y.-T., Kim, S.-B., & Choi, W.-K. (2021). A Fundamental Study on the Development of New Energy Performance Index in Office Buildings. Energies, 14(8), 2064. https://doi.org/10.3390/en14082064


