Abstract
Experimental tests performed in a wind tunnel or in a natural laboratory represent a fundamental research tool to develop floating wind technologies. In order to obtain reliable results, the wind turbine scale model rotor must be designed so to obtain a fluid-structure interaction comparable to the one experienced by a real machine. This implies an aerodynamic design of the 3D blade geometry but, also, a structural project to match the main aeroelastic issues. For natural laboratory models, due to not controlled test conditions, the wind turbine rotor model must be checked also for extreme winds. The present paper will focus on all the strategies adopted to scale a wind turbine blade presenting two studied cases: the first is a 1:75 scale model for wind tunnel applications and the second a 1:15 model for natural laboratory tests.
1. Introduction
Experiments play a key role in the development of wind turbine technologies. Within the last 20 years, several scale model tests of wind turbines were carried out for very different applications. Wind tunnel tests were run to produce low-uncertainty datasets for the validation of numerical codes [1,2,3] to test wind turbine control strategies [4,5,6,7] and to investigate wakes and wake interaction [8,9,10,11,12,13]. In floating offshore wind turbine (FOWT), scale-model experiments are required to better understand the fluid-structure interactions between the rotor and the incoming flow. Moreover, numerical tools need data for calibration and verification. Experimental tests can be performed both in indoor laboratories, such as a wave basin and wind tunnel, or in a natural outdoor laboratory. For the first kind of tests, the typical scale allowed is between 1:50–1:100 for wave basin tests and 1:75–1:200 for wind tunnel tests, while higher scales can be adopted for outdoor models. In particular, in the latter case, we can distinguish between prototypal campaigns on close to full-scale wind turbines (see, e.g., [14,15]) and intermediate-scale experiments performed at sea [16,17]. Prototypal activities are generally characterized by a scale lower than 1:10 and a TRL (Technology Readiness Level) of about 7–9 and are generally performed just before commercial development, while intermediate-scale tests are more research-oriented tests, with a TRL of about 5–7 and length scale between 1:10 and 1:20. In any of these cases, to properly reproduce the dynamic behavior of a FOWT, the wave and wind action must be reproduced simultaneously, and this can be obtained by applying different strategies in considerations of the test typology. In wave basin tests, the hydrodynamics is completely reproduced, while the aerodynamic wind turbine behavior can be simulated with different levels of accuracy. The simplest approach uses a solid disc together with a battery of fans to reproduce the drag force; the gyroscopic moments can be obtained through an auxiliary rotating mass [18]. A higher level of accuracy can be ensured with a spinning rotor in the stationary flow [19]. Both these approaches can reproduce just a few issues of the aerodynamic behavior of a wind turbine. A more complete aerodynamic reproduction can be achieved through a more complex setup, where the wind turbine is directly modeled and the wind field is generated by a fan’s array [20,21,22].
Recently, the hybrid/HIL (Hardware In the Loop) approach has been introduced in wave basin tests: the hydrodynamics is physically reproduced during the experiments, while the wind turbine is numerically modeled and connected, in real time, to the physical model [23,24,25,26,27]. The hybrid/HIL approach is adopted in wind tunnel tests on FOWT [28,29,30]: in this case, the physical model is represented by a scaled wind turbine, while the floating subsystem is emulated by means of a numerical model that is executed in real time. In the case of natural outdoor laboratory tests, wind and waves are naturally present. However, these cannot be controlled. Moreover, the wind and wave statistics are correlated, but their properties and the correlation may differ from the ones expected for a full-scale FOWT. These aspects need to be considered when designing a scale model rotor for outdoor tests, in order to make it representative of the real system. For tests that include a wind turbine physical model, such as hybrid/HIL wind tunnel tests and natural outdoor laboratory tests, the scale model rotor design is of utmost importance. The reduction in size and the limited wind speed results in a Reynolds number that is two/three orders of magnitude lower than in a real rotor. In these conditions, it is hard to match the aerodynamic performance of the full-scale machine with a geometrically scaled copy of its rotor.
This paper presents and compares two scale model rotors of the DTU 10MW [31] reference wind turbine. The first one is a 1:75 scale model for wind tunnel experiments, referred to as the WT (wind tunnel) model throughout the paper, that was designed for hybrid/HIL wind tunnel tests. The second is a 1:15 large-scale model developed within the EU project H2020 Blue Growth Farm, referred to as the BGF (Blue Growth Farm) model. This project aims at developing an offshore multipurpose platform that integrates wave energy converters and a wind turbine with aquaculture. The scaled model of the complete structure will be deployed at the Natural Ocean Engineering Laboratory (NOEL) in Reggio Calabria [32,33]. The key contribution of this paper is to compare two scale models of the same full-scale rotor and to highlight how the specific requirements of a wind tunnel and an outdoor laboratory influence the aerodynamic and structural designs. The outline of the paper is as follows: in Section 2, the scaling strategies for the two models are discussed, in Section 3, the aerodynamic blade design is presented, and in Section 4, the structural design is described. The conclusions are drawn in Section 5.
2. Scaling Strategy
Following the similitude theory, it is possible to represent a full-scale system by means of a scaled model thanks to the definition of dimensionless variables, the so-called scaling factors. In fluid-mechanic systems, such as wind turbines, the problem of scaling results to be over-constrained, mainly due to the interaction among inertia, gravity and viscosity. In particular, for FOWTs, conflicts arise because of the incompatible requirements set by Froude scaling, needed for reproducing the wave and gravity forces, and the necessity of having high Reynolds numbers to be the blade aerodynamic representatives of a full-scale rotor. The definition of the scaling law and the scale factors, computed as in Table 1 as a function of length and velocity, is the consequence of the established target, test modality and campaign goals.

Table 1.
Factors as a function of the length and velocity for a generic scaling law.
First, the length scale factor is chosen. The main constraints in the selection of the dimension of the model are, on one hand, the test facility capacity and, on the other hand, the costs and complexity related to model-making. In the case of natural laboratory testing, the length scale can be chosen comparing the significant wave height (Hs) at the laboratory site and at the target full-scale deployment site: it is possible to define the ratio between the expected value of Hs at the rated wind speed for the model and the prototype.
Second, the velocity scale factor is selected. For a correct reproduction of the aerodynamic effects and, therefore, of the loads acting on the wind turbine rotor, the Reynolds similitude should be satisfied. However, this is rarely possible due to technical constraints: the common length factors to scale a multi-megawatt wind turbine are between 1:10 (outdoor models) and 1:100 (indoor models), and this would imply a model wind speed 10 to 100 times greater than the full-scale one, values out of the operating range for most facilities. Moreover, in the case of FOWT testing, the correct reproduction of the hydrodynamic and gravitational forces becomes important, and this is guaranteed by the Froude similitude. Stating the impossibility of the simultaneous matching of Reynolds and Froude numbers, a compromise has to be reached, according to the type of the test and its purpose.
In the case of natural laboratory testing, another constraint in the velocity selection is given by the site wind occurrence. The met-ocean conditions of the test site must be considered in relation to those expected at the target full-scale deployment site. Differently from the traditional wind tunnel and ocean basin testing, the wind and wave characteristics cannot be controlled; thus, the design of the strategy has to rely on probabilistic data only. Moreover, we also have to consider that the interdependence of the wind and waves cannot be perfectly representative of a target FOWT deployment site. A possible criterion to define the scale velocity takes into consideration the cumulative distribution functions of the wind velocities relative to the test and deployment site: the wind turbine rated hub-height wind speed velocity can be chosen as the value that keeps constant the probability of exceedance, as this would ensure the same probability to have the wind turbine working in partial or full-load conditions for both the model and full scale. Starting with the defined length and velocity factors, the FOWT structure and hydrodynamics are scaled according to Froude’s law, while the rotor of the machine is scaled with independent length and velocity scales.
Further details in the wind turbine performance scaling strategies are reported in the following section.
2.1. Rotor Design Requirements
For wind tunnel testing of onshore wind turbines, a possible scaling strategy is to adopt a hybrid scale selecting independently the length and velocity factor and accept a reduction in the Reynolds number at the model scale, coping with it in the aerodynamic design of the model. For the wind tunnel testing of FOWTs, a possibility is to use this approach together with a HIL system, as in reference [28]. For testing a FOWT in a natural laboratory, Froude similitude is mandatory, and the wind speed generation cannot be controlled, as in common facilities; the solution considered here is to adopt a different scaling strategy for the FOWT structure and the rotor. The structure is scaled according to Froude law to ensure the hydrodynamic similitude, whereas the rotor is scaled trying to reproduce the aerodynamic performance of the full-scale turbine [32,33].
The requirements for the aerodynamic design considered here are:
- match the rotor thrust force, as this drives the rigid body motion of the FOWT, the structural loads for the blades and tower,
- reproduce the power as good as possible and
- match the first flapwise bending mode of the rotor.
The matching thrust force is especially important in FOWTs, because it is responsible for the coupled rotor–platform dynamics and the well-known problem of negative damping [34] in the above-rated control.
2.2. The Wind-Tunnel Scale Model (WT)
The wind turbine for wind tunnel tests is a 1/75 scale model of the DTU 10 MW. It was realized as part of the EU H2020 LIFES50+ project to carry out experiments about floating offshore wind turbines. The scale model was designed to: (1) investigate the effects of large platform motions on the rotor aerodynamic loads [35,36,37] and wake [38,39] and use the experimental data for model calibration/validation and (2) study the global dynamics of FOWT concepts by means of a hybrid/HIL system [28,40]. The scale factors for the wind turbine scale model were defined in consideration of these goals. The length and velocity scale factors were set one independently from the other: (1) because, in hybrid/HIL experiments, it is possible to simulate FOWT dynamics without having to rely on Froude similitude and (2) to increase, as much as possible, the blade Reynolds number (see Figure 1) and have the rotor aerodynamics closer to the full-scale target. The length scale factor was set to 75, the best compromise between having a large rotor while minimizing the blockage effects in the test chamber section of the Politecnico di Milano wind tunnel (14 × 3.84 m). The main constraints for the velocity scale factor are the maximum wind speed it can be achieved in the wind tunnel (15 m/s) and the frequency of the scale model flexible dynamics. The velocity scale factor was fixed to 3. The value of the other scale factors was derived from the mass and velocity scale factors, and these are reported in Table 2.
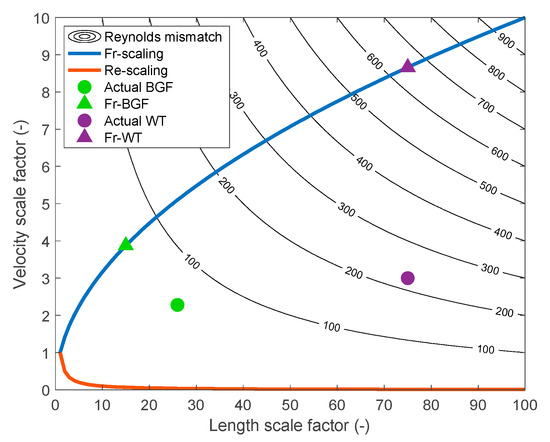
Figure 1.
The Reynolds mismatch (reduction with regard to full-scale) as a function of the length and velocity scale factors. The blue and orange lines correspond to the Froude and Reynolds scaling, respectively. Markers show the Blue Growth Farm (BGF) model scaling (green) and wind tunnel model scaling (purple), with “Fr-x” corresponding to the scale factors where Froude scaling was used and “Actual x” corresponding to the adopted scale factors.
Table 2.
Scale factors for the wind turbine model for wind tunnel testing: Politecnico di Milano.
2.3. The Blue Growth Farm Outdoor Prototype (BGF)
The wind turbine model designed within the Blue Growth Farm project (EU H2020) is a scaled reproduction of DTU 10 MW, like the previous one. This project has the objective to develop a multipurpose offshore farm placed on a modular floating structure and its targets are efficiency, cost-competitiveness and environmental-friendliness. A wind turbine is combined with wave energy converters and aquaculture to achieve cost-effectiveness in various high-sea applications. This model will be installed at the Natural Ocean Engineering Laboratory (NOEL) in Reggio Calabria.
The chosen length scale for the global structure (1:15) is appropriate to properly scale the target full-scale deployment site (Golfe de Fos) at the NOEL site. A comparison between the full-scale deployment site and test site wind and waves characteristics considered for the scale definition is shown in Figure 2. The rated wind speed, evaluated imposing the equal probability of exceedance between the test site and full-scale target deployment site, was defined as equal to 5 m/s. The velocity factor and the length factor of the non-Froude scale, used for turbine performances, were calculated accordingly. The resulted scale factors are depicted in Table 3 and Figure 1. This results in having the turbine structure (except the rotor) scaled 1:15 according to Froude law and the performances (rotor dimension included) scaled according to a generic scale defined by the length factor equal to 26 and the velocity factor equal to 2.28. The length factor of 26 was obtained as the factor that, combined with the selected velocity factor of 2.28, gives the same force factor as the 1:15 Froude scale in order to reproduce the 1:15 thrust force. This hybrid scaling approach allows to scale according to Froude law the structure of the platform (crucial for hydrodynamics) and the turbine (i.e., tower dimension and structural frequencies important for a correct representation of the turbine dynamic loads acting on the platform) and, at the same time, to reproduce the Froude-scaled rotor thrust force with a smaller rotor capable of a more accurate reproduction of the aerodynamic loads (lower Reynolds number ratio w.r.t. with regard to Froude) and turbine working conditions occurrence (same probability of exceedance of the rated speed). A comparison between the dimensional values of the DTU 10 MW, WTM and BGF model is shown in Table 4.
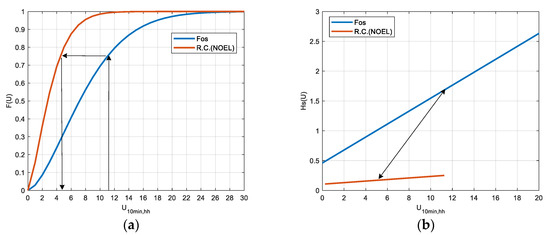
Figure 2.
Comparison between the full-scale deployment site (Fos) and test site at Natural Ocean Engineering Laboratory (NOEL) (R. C.) in terms of the wind speed cumulative distribution (a). Significant wave height Hs as a function of the wind speed (b). U10min,hh is the 10-min mean hub-height wind speed.
Table 3.
Scale factors of the hybrid scaling of The Blue Growth Farm outdoor prototype turbine.
Table 4.
Actual gross properties of the DTU 10 MW, wind tunnel model (WTM) and Blue Growth Farm (BGF) model.
3. Aerodynamic Design
It is possible to divide the procedure for the blade design into two main steps, the first focused on 2D geometry and the second on 3D geometry. The first step is the selection of the airfoil shape, and the second results in the computation of the blade distribution. The aerodynamic design process is similar for the wind tunnel scale model (WT) and the outdoor prototype (BGF).
3.1. Airfoil Selection
The main aerodynamic-related problem arising from scaling is Reynolds number mismatch. The chord Reynolds number for the BGF and WT rotors at their respective rated operating points are shown in Figure 3a. As seen, it is around two orders of magnitude less than for the full-scale wind turbine. To cope with this issue, a new airfoil is selected, and the blade chord and twist distribution is modified. The scale model airfoil is selected according to the operating Reynolds range. Low-thickness airfoils are selected to replace the high-thickness airfoils of the full-scale rotor. The airfoil must have a good lift-to-drag ratio, soft-stall behavior and a linear lift coefficient. One single airfoil or more airfoils can be used along the blade span. Some examples are RG-14, AH79-100C, WM006 and SD7032, SG6040 and SG6041. The airfoils for the BGF and WT models were selected among those of the database “Low Reynolds airfoils” [41]. The low thickness results in a reduced sensitivity to the flow separation at low Reynolds numbers, which translates into a greater lift-to-drag ratio than what would be achieved with a conventional blade profile. The nondimensional shape of the two model airfoils is compared to the one of DTU 10 MW blade (i.e., FFA-W3-xxx) in Figure 4b. It is possible to see that the airfoil selected for the BGF rotor has a higher compared to the WT airfoil. A higher thickness airfoil was selected for the BGF blade, because the expected loads are greater than in a small-scale wind tunnel model, and the Reynolds number is higher thanks to the larger dimensions of the blade.
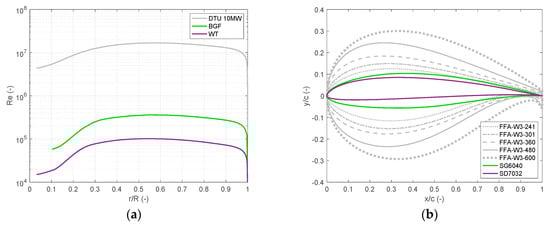
Figure 3.
(a) Chord Reynolds number along the blade span at the rated operation for the outdoor prototype (BGF), wind tunnel model (WT) and DTU 10 MW. (b) Nondimensional shape of the airfoil for the outdoor prototype (SG6040), wind tunnel model (SD7032) and DTU 10 MW (FFA-W3-xxx).
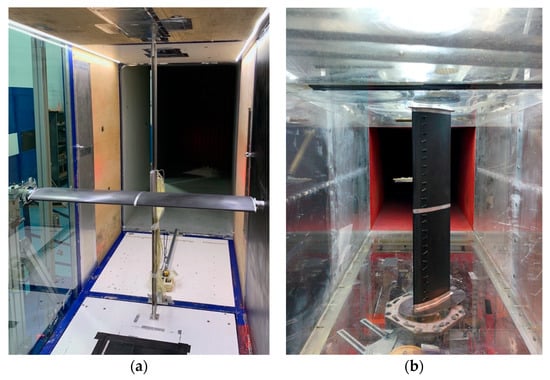
Figure 4.
Two-dimensional sectional model tests of the SG6040 airfoil (a) and of the SD7032 (b). In both models, the pressure loop is seen at the midspan and the wake rake downstream of the test section.
The chosen profiles were further characterized through wind tunnel tests on a 2D section model of the airfoil to define the aerodynamic coefficients in a range of Reynolds numbers that is not covered by the literature. Moreover, low-thickness airfoils are sensitive to local separation phenomena and to freestream turbulence. Two-dimensional sectional model tests were carried out with an increased inflow turbulence to simulate the rotor-sampled turbulence seen by the wind turbine model blades; the 2D sectional model was manufactured with similar materials and the production process adopted for the 3D blade, so to have the same surface roughness. The experimental setups for the BGF and WT airfoils are depicted in Figure 4. The lift force was measured with a pressure loop at the model midspan, whereas the drag force was obtained from the wake deficit, which was measured by means of a wake rake positioned downstream of the leading edge. The aerodynamic coefficients of the SG6040 and of the SD7032 that were measured for a Reynolds number of 150,000 are reported in Figure 5. The airfoils behave similarly for small values of the angle-of-attack (AoA), where the lift coefficient is linear and of similar slope. The stall AoA for the SG6040 is slightly lower than for the SD7032, which also shows a larger lift-to-drag ratio. In the BGF blade, aerodynamic performance is traded for structural performance.
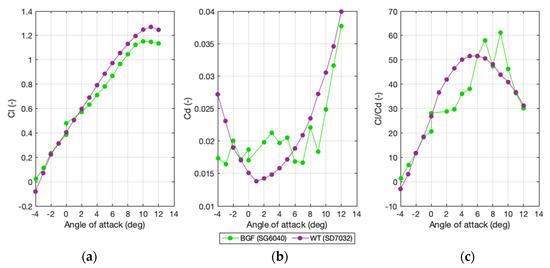
Figure 5.
Experimental lift coefficient (a), drag coefficient (b) and lift-to-drag ratio (c) of the blade profiles used in the outdoor prototype (BGF) and wind tunnel model (WT) rotor for a chord Reynolds of 150,000.
3.2. Blade Aerodynamic Design
The goal of the blade aerodynamic design is to preserve the nondimensional thrust force of the full-scale rotor imposing kinematic similarity (i.e., same tip–speed ratio _(TSR)) for the scale model and full-scale blade [3,4,41,42]. The thrust force and the blade–root flapwise bending moment are mainly determined by the lift force, so a good approximation is to match the lift along the blade, section by section. The aerodynamic design procedure was originally introduced in reference [18], but it is recalled here for the sake of clarity. The lift force of any blade section, either of the model or the full scale (FS), is
where subscript denotes the model or the reference, is the air density, the airflow speed, the local chord and the local lift coefficient. The model chord and twist are obtained as
where is the slope of the lift coefficient with respect to the angle-of-attack (AoA), is the lift at zero AoA and is the length scale factor for the model. The blade chord is increased, preserving the distribution of the reference rotor, to compensate for the different slopes of the lift coefficients. Given the increased chord, the local twist is modified to achieve the target nondimensional lift force at the rated operating point. A general overview of the algorithm used for the blade aerodynamic design is given in the block diagram of Figure 6. The algorithm takes as input the full-scale chord, twist and thickness distribution, together with the force coefficients of the full-scale airfoils. Based on the theoretical considerations of the thrust matching strategy, the algorithm computes at every iteration the optimal chord and twist distributions to match the thrust force on the rotor. The output of the aerodynamic design of the WT and BGF rotors is shown on the right of Figure 6. The nondimensional chord is similar for the two blades, as the lift coefficients of the SD7032 and SG6040 are comparable. The chord of the BGF blade is slightly larger in the outer portion of the blade, and this is because of the lower lift slope of the SG6040. Similarly, the twist angle for the BGF blade is also lower, because an increased AoA is needed to produce the target nondimensional lift force.
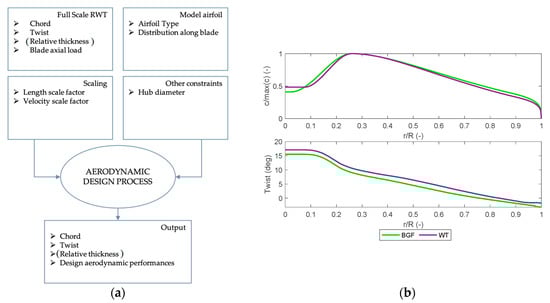
Figure 6.
(a) Flow chart of the blade design process (b). Normalized chord and twist distribution of the outdoor prototype (BGF) and the wind tunnel model blade.
The aerodynamic performance of the rotor is evaluated by means of a BEM model implemented in (NREL, Denver, CO, USA), which is one of the most used, freely available rotor aerodynamic solvers. The results are presented in Figure 7 in terms of the power and thrust coefficients for several combinations of TSR and blade pitch angle. The performance of both the scaled rotors is close to the DTU 10 MW. Very small differences are seen in the thrust coefficient, which is largely set by the lift force, objective towards the aerodynamic design. Additionally, the shape is preserved, and this ensures an equal sensitivity to wind, rotor speed and pitch variations. Differences in the power coefficient are slightly more pronounced and are due to the different drag forces developed by the blade profiles. The maximum power coefficient is, in any case, close to 0.5, and it is reached for a TSR around 7.5 and a blade pitch angle of 0 degrees. Additionally, the shape of the power coefficient is similar to the full-scale target, and this enables the implementation in the scale model of conventional power control strategies.
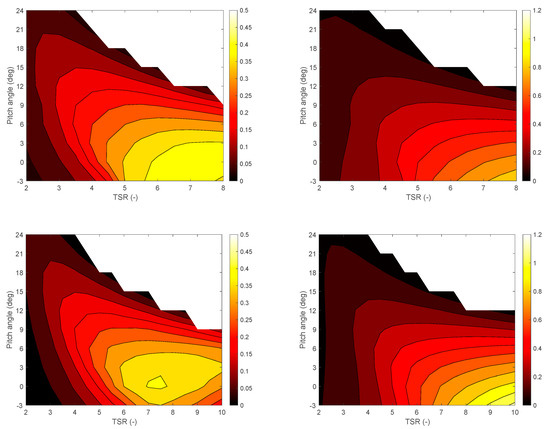
Figure 7.
Power coefficient (left) and thrust coefficient (right) of the DTU 10 MW (top), BGF scale model (middle) and WT model (bottom) from the BEM calculations for several values of the tip–speed ratio (TSR) and blade pitch angle. Negative values are omitted.
Comparing the aerodynamic designs of the WT and BGF models, it is possible to conclude that
- the reduced dimension of the rotor requires redesigning the blade to match the full-scale aerodynamic loads. Even in the case of the outdoor prototype, which is three times as big as the WT model, the chord Reynolds is around two orders of magnitude lower than at the full scale.
- low-thickness airfoils have a desirable behavior when using the model Reynolds. In case of the BGF model, the airfoil thickness is increased compared to the WT model to cope with the higher structural requirements that are more stringent. The aerodynamic performance is partially traded for a structural performance.
- the optimization procedure aimed at matching the nondimensional lift force allows to have a model thrust coefficient close to the full scale. The power is reduced, but the shape of the power coefficient is preserved.
4. Structural Design
As described in reference [42], the rotor blades must be designed not only in terms of aerodynamic performances, but, being very flexible components, even the structural parameters must be properly reproduced. For the WT model, structural and aerodynamic design procedures were performed simultaneously, defining the final 3D geometry of the blade as a function of the aerodynamic and of the structural requirements. On the contrary, for BGF model, the structural project was performed once the final 3D geometry was completely defined only based on the aerodynamic requirements. Due to the higher complexity of the structural design of a blade for an outdoor model, it was considered easier to keep the two processes separated.
In both cases the main parameters that must be considered are:
- mass. Mass scales with the cube of the length-scale factor. It is a strict requirement for any scale model rotor. The rotor weight has a significant effect on the flexible dynamics of the wind turbine and the rigid dynamics of the structure, in the case of floating systems. Usually, it is not possible to achieve the scaled mass target, and the blades are designed so to minimize the rotor mass.
- stiffness. Stiffness requirements are set by the need of reproducing the flexible dynamics of the blade. The adoption of low-thickness airfoils makes it difficult to achieve high values of sectional stiffness. Materials that offer a high modulus-to-density ratio, such as CFRP (Carbon Fiber Reinforced Polymer), are utilized for blade manufacturing.
Additionally, for the BGF model, mechanical resistance becomes important. The blade must bear the structural loads, operational and extreme, to which it is exposed.
4.1. Wind Tunnel Scale Model
The output of the aerodynamic design is the chord and twist distribution along the blade span. The structural design aims to define the blade thickness distribution. The blade is divided into three regions, and for each of them, the thickness-over-chord (t/c) is obtained as follows:
- Region 1 is the blade root. The cross-section is circular, and t/c is equal to 1. The radial extension of region 1 is given by manufacturing and assembly constraints. This part of the blade is utilized to fit the components required to mount the blade on the hub.
- Region 3 is the tip region. The cross-section and the t/c are the nominal airfoil selected for the blade design.
- Region 2 is the transition region. The cross-section gradually transitions from a circular shape to the nominal airfoil shape. A longer transition region results in an increased flapwise stiffness, at the expense of a reduced aerodynamic performance.
The radial extension of Region 2 is optimized to have the first flapwise frequency of the scale model blade matching the scaled frequency of the full-scale blade. The radial position where Region 2 starts (i.e., the innermost) is fixed, and the optimization routine searches for the position where Regions 2 ends to minimize the absolute difference between the natural frequency of the first-flapwise mode for the scale model blade and the scaled frequency of the full-scale blade. The optimization routine is the unconstrained nonlinear programming solver fminsearch of MATLAB (The MathWorks, Natick, MA, USA). The natural frequency of the scale model blade is defined based on an Finite Element beam model; the target frequency is obtained from the DTU 10 MW specifications and the frequency-scale factor of Table 2. The radial distribution of the nondimensional thickness for the wind tunnel scale model is shown in Figure 8.
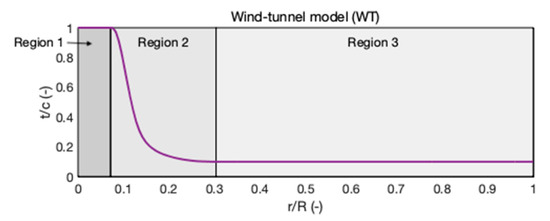
Figure 8.
The radial distribution of the nondimensional thickness for the wind tunnel model.
The 3D geometry of the blade is shown in Figure 9. The blade was realized in a composite material starting from an aluminum mold that was manufactured based on the blade external geometry obtained in the design procedure. A single bidirectional CFRP layer was stacked on an inner glass fiber layer. This was necessary in order to increase the torsional stiffness and increased the final mass of the blade of 230 g.
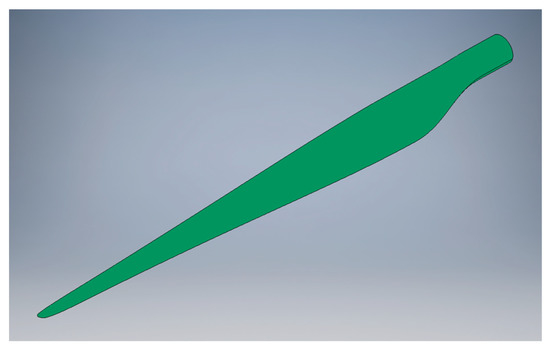
Figure 9.
The 3D geometry of the wind tunnel model blade.
The flexible structural dynamics of the blade was assessed via an experimental modal analysis. The frequency of the first flapwise mode is reported in Table 5, where it is compared to the DTU 10MW target, while the mode shapes are displayed in Figure 10. The modes frequencies are lower than expected, and this is mainly because the mass was increased above its design value in the manufacturing process.
Table 5.
Comparison between the frequency of the first flapwise mode for the DTU 10 MW (target) and the 1:75 wind tunnel scale model (frequencies are reported at the model scale).
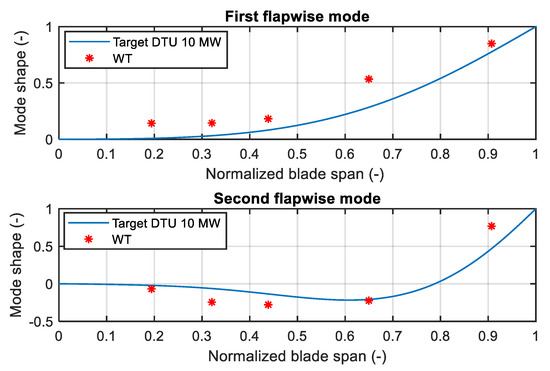
Figure 10.
First and second flapwise mode shapes of the wind tunnel scale model blade from the experimental modal identification.
4.2. Blue Growth Farm Scale Model
The output of the aerodynamic design for the BGF model is the external shape of the blade. The relative thickness was defined as for the WT model, distinguishing between the three regions presented in the previous section: the aeroelastic design was not the primary goal, and the width of the transition region (Region 2) was defined in order to have the minimum stiffness permitted by the structural design (see Figure 11).
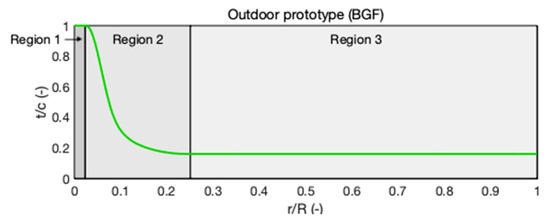
Figure 11.
The radial distribution of the nondimensional thickness for the Blue Growth Farm model.
The final 3D external design of the blade is depicted in Figure 12. Two shear webs were inserted along the blade axis to enhance the resistance of the blade to buckling, and they extended from the section at a radius of 0.09 m to the section at a radius of 2.19 m. The blade structure is modeled on the commercial FE software ABAQUS CAE to build a preliminary structural model.
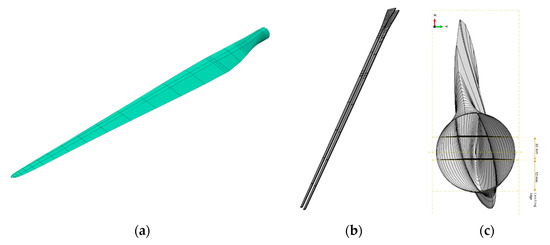
Figure 12.
The outdoor prototype blade: external shape (a), shear webs (b) and their position inside the blade (c).
The selected material for the manufacturing of the blade is glass fiber reinforced plastic (GFRP) [43]. In general, fiber-reinforced plastics (FRP) are known for their stiffness, resistance and low weight and are then often adopted for wind energy applications. GFRP is chosen due to its lower cost compared to carbon fiber and for its suitability in marine and warm environments. Two kinds of fiber tissues, bounded by an epoxy resin matrix, were selected to carry out the blade design: S2-glass U (unidirectional fibers) and E-glass Fabric (bidirectional fibers). The blade layup is obtained alternating 0° unidirectional plies and ±45° bidirectional plies. The former is needed to resist the flapwise bending moment, the latter to resist torsional and shear loads. The final layup was defined starting from a preliminary layup that was progressively modified, verifying it with respect to the expected loads. In the first design phase, mechanical resistance was considered as the primary requirement; the design was later refined considering the inertial and aeroelastic requirements. In the second stage, the blade layup was tuned to achieve a match as close as possible to the mass and the scaled natural frequencies. For the structural design, static loads were firstly considered, while dynamic forces due to wind/wave excitation were included only in the final assessments. The static loads were obtained, adopting, as a reference, the IEC 61400-2:2006 [44]. The standard suggests an ensemble of load cases to be withstood by blades, depending on the wind turbine class and the wind condition (normal, occurring continuously during operation and extreme, with a one-year or 50-year period of return). The load cases listed by the standard are many for an industrial-scale wind turbine; however, in the case of a scale model, some of them can be discarded (e.g., fatigue load cases are neglected due to the short duration of the experimental campaign). Among the 10 load cases suggested by [44], the five reported in Table 6 were considered.
Table 6.
The evaluated design load cases.
Each load case reported in Table 6 is characterized by four parameters: wind speed, rotor speed, collective pitch and yaw angle. These load cases were simulated in FAST (NREL, Denver, CO, USA), and the loads obtained on each section of the blade, normal and tangential to the rotor plane, were applied to the FE model in ABAQUS to define the stresses and deflections. The distribution of aerodynamic loads per unit length on the blade span for the load cases listed in Table 6 is reported in Figure 13, whereas the resultant blade–root loads are reported in Table 7.
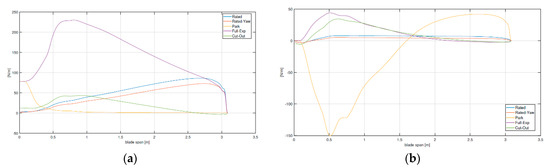
Figure 13.
Blade force per unit length: (a) normal to the rotor plane (positive downwind) and (b) tangential to the rotor plane (positive in the blade rotation direction.
Table 7.
Blade–root loads for the design load cases. FN is the force normal to the rotor plane, FT the tangential force, MFN the out-of-plane bending moment and MFT the torque.
The “full-exposure” case, being the most demanding from the structural point of view, was chosen for dimensioning the layup thickness. The blade–root region carries most of the loads, and the layup thickness is driven by the structural resistance requirements. The tip region does not contribute much to the overall structural resistance; hence, the layup was tuned to match the mass and inertia of the blade. Finally, shear webs have a constant thickness along their span to ease blade manufacturing. The final shell layup thickness is reported in Figure 14.
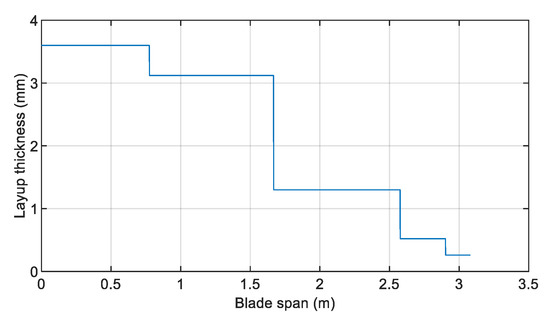
Figure 14.
Blade shell layup thickness.
In order to evaluate the structural resistance, the Tsai–Hill criterion [43] was adopted, and the safety factors defined in the GL standards (Germanischer Lloyd standards [45]) were considered. In addition to the static stress analysis, composite laminates can fail by buckling when subjected to compressive or shear loading. Composite structures exhibit large out-of-plane displacements when the initial buckling load is reached, and geometric instability may occur. The linear eigenvalue buckling methodology was chosen among the criteria reported in [43] for the analysis of this phenomenon. The total safety factor for the buckling condition is evaluated from the partial safety factors, as described in reference [45]. The last requirement for the layup design was set on the maximum blade–tip deflection, which must satisfy the minimum tower–blade clearance [46].
The FEM (Finite Element Model) also allows a check on the mass, moment of inertia and natural frequencies of the blade. When designing a scaled blade, it is a common occurrence to obtain natural frequencies that are higher than the ones found by Froude scaling. This happens because aerodynamic constraints force the blade to be shorter than the geometrically scaled one, so that the overall bending stiffness is increased. In natural laboratory models, this fact is, however, not a problem, because a stiffer blade has less deflection, and its frequencies are farther from the dynamic excitation of the rotation (3P). For the BGF model, the mass of the blade is 7.1 kg. This value is lower than the one set by the 1:15 scaling, equal to 12.4 kg, but is higher than the one requested by the 1:26 scaling of the rotor, equal to 2.4 kg. The ideal case would prescribe having a 1:26-scale rotor inertia and a blade structure able to sustain a 1:15-scale force This is impossible to achieve from a resistance point of view. The final blade mass is the best compromise between the resistance and weight of the component, given that the main objective of the whole design is thrust matching. From a dynamic point of view, the final blade design is fairly rigid with respect to the target. This was expected due to the lower length of the blade as compared to the 1:15-scale value, but structural issues were privileged with respect to the aeroelastic ones. The final aeroelastic characteristics of the blades will be described in the following section, as well as the experimental tests performed to verify the blade design obtained from the FE analysis.
Structural Tests
The IEC 61400 [47] prescribes structural tests to assess the dynamic performance of the designed blade and its structural resistance. A complete test campaign would ideally include: (1) measurements of the mass, the mass distribution and the position of the center of mass; (2) check of the natural frequencies and mode shapes; (3) static resistance tests and the (4) ultimate resistance tests, where the blade is brought to failure. For the present application, only the static resistance and modal identification tests were considered mandatory.
For the structural assessment, both fatigue and static tests are requested by the standards. However, given the short duration of the experimental campaign, fatigue tests were omitted. Realistic load conditions were simulated with a static test bench and by means of the load coefficients approach, as proposed in reference [45]. The continuous load distribution along the blade obtained by means of FAST simulations (see Figure 12) was approximated in a discrete number of points by a set of eight concentrated forces, four flapwise and four edgewise. The values of the static loads applied to the blade were computed by means of the shear force-matching method. This method tries to minimize the difference between the area below the internal shear curve with design loads and with the actual loads of the test bench. In this way, it is possible to compute the bending moment generated by the force distribution and verify if the stress state of the tested blade is close to the design one or, at least, more conservative in the regions of interest. A schematic of the mechanism used to apply loads to the blade and the static test bench are shown in Figure 15. The blade is clamped at its root; forces are applied through tie rods that transmit axial forces. Each tie rod is put in a series with a load cell, and the force is applied to the blade section using a saddle. The stress state in the blade is measured with strain gages placed sufficiently far from the tensioning saddles in four different sections, as depicted in Figure 16. The strain gages measure the axial stress due to flapwise and edgewise moments and torsion around the pitch axis. The tip deflection is measured with a laser transducer.
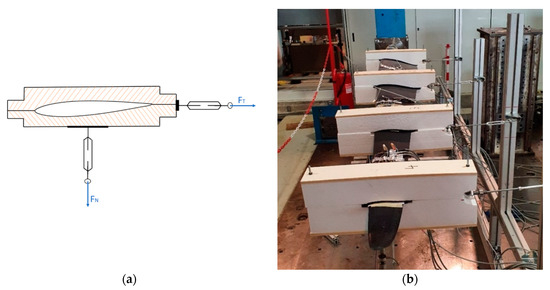
Figure 15.
Schematic of the load-application mechanism (a). The blade static test bench (b).
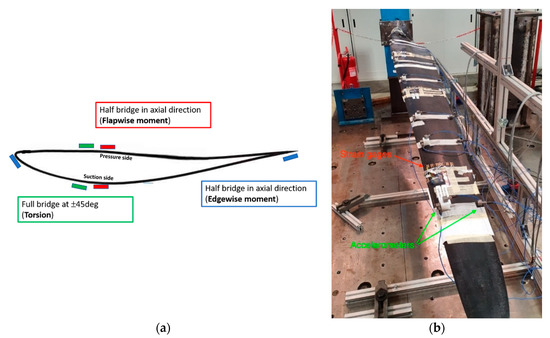
Figure 16.
Strain gages arrangement on a blade section (a). Strain gages and accelerometers along the blade (b).
Two are the main outcomes of the static test: one side the blade is tested with respect to the design loads, and its resistance is assessed; on the other side, the experimental data can be used to verify the FEM model of the blade. The validated FEM model is then utilized to assess the blade resistance with a more realistic continuous-load distribution. To verify the fidelity of the FEM model, the blade is loaded with a force in the flapwise direction at the tip, and the tip displacement is measured for several load values. A comparison of the experimental data and FEM model predictions is shown in Figure 17.
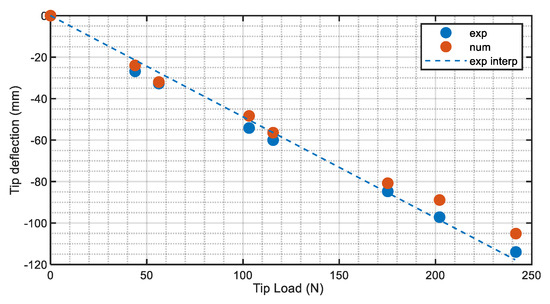
Figure 17.
FEA (Finite Element Analysis) and experimental tip deflection.
Natural frequencies and mode shapes are verified with an impact test. The validated FEM model is utilized to define the position of the accelerometers and of the impulse force provided with a dynamometric hammer. Accelerations are measured in six sections of the blade; the flapwise acceleration is measured on both the trailing and the leading edge, while edgewise acceleration is measured only at the leading edge. The comparison between the experimental and FEA results shows a good agreement in terms of the modal shapes, while the frequencies measured are lower with respect to the numerical ones (see Table 8); this discrepancy was imputed to a likely not-perfect modeling of the composite material layup, but the results were considered satisfactory to avoid possible excitation due to the rotation.
Table 8.
Comparison between the FEA and experimental flapwise natural frequencies.
A comparison between the flapwise modes of the BGF blade and in the DTU 10 MW RWT is reported in Figure 18 and in Table 9. As expected, as the blade shorter with respect to the 1:15 scaling, the natural frequencies of the BGF blade are higher than the target ones; this is not a concern, because aeroelastic properties are considered a secondary target with respect to aerodynamic and structural issues for the natural laboratory blade design.
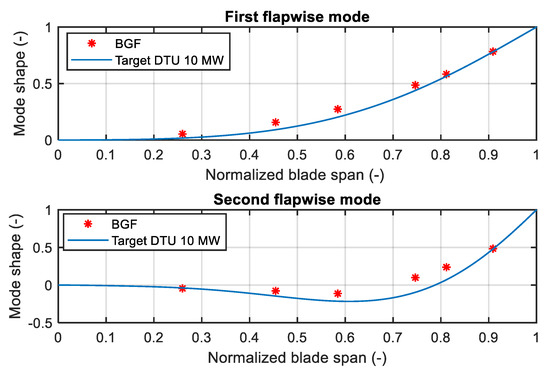
Figure 18.
Experimental and target (DTU 10 MW) first and second flapwise modes.
Table 9.
Comparison between the frequency of the first flapwise modes for the DTU 10 MW (target) and the experimental frequencies of the outdoor prototype (BGF) (frequencies are reported at the model scale).
Once the design was completed and verified, the blades were manufactured starting from two custom-made molds made of carbon fiber. The dividing line of the molds was chosen in order to follow, as far as possible, the leading edge and trailing edge of the blade. The two molds were manufactured from a master model made on resin using a CNC machine.
5. Conclusions and Recommendations
Scale model experiments about floating wind turbines often rely on Froude-scaled models and a wave basin facility. This paper presents the non-Froude scaled rotor of two 10MW floating wind turbines, with a focus on aerodynamic and structural design. The two models reproduce the DTU 10 MW wind turbine but at different scales and with different purposes: one (1/75) is meant for wind tunnel tests and the other (1/15) for an extended test campaign in a natural laboratory. Both the models were developed for tests that aim to improve the knowledge of wind turbine performances under floating structure excitation and to evaluate the effects of different control strategies.
Important observations were made about the aerodynamic and structural design of a floating wind turbine scale model rotor. It was shown that non-Froude scaling improved the blade Reynolds number and favored the reproduction of the aerodynamic behavior of the full-scale rotor. The Reynolds number for the two models was two-to-three orders of magnitude less than for the full-scale rotor, as a consequence of the reduction in size and the lower wind speed. In the case of wind tunnel tests, these limitations are imposed by the test facility (i.e., maximum flow speed and dimensions of the tests section); in the case of the natural laboratory, wind at the test site is different than the operating wind speed of the full-scale wind turbine. The correct aerodynamic performance is attained through adoption of a performance-scaled design methodology. The same algorithm is applied to the wind tunnel model and the outdoor prototype, and it is shown that by means of non-Froude performance scaling. It is possible to match the thrust coefficient of the reference wind turbine and preserve power coefficient shape. The former is required to simulate at a small scale the thrust force, the blade loads and the wind turbine wake, the latter implementing realistic closed-loop power control strategies. The structural design of the two models is carried out with different goals. In the case of the wind tunnel model, the objective is to reproduce the flexible blade dynamics, and structural requirements are of secondary importance. An optimization algorithm is utilized to define the blade thickness in its innermost region. With this approach, the first flapwise bending mode is matched. The structural design of the outdoor prototype blade is defined by the structural requirements, as the model must operate safely when exposed to uncontrolled environmental conditions. The blade design is guided by the standards for commercial wind turbines; operational loads are obtained from BEM simulations, and the blade material layup is designed with a FEM model in order to withstand these loads.
The following recommendations are proposed as a guide for future model design tasks:
- The aerodynamic design strategy adopted in this article considers just one wind turbine point and modifies the blade chord and twist based on a simple analytical model to match the nondimensional lift. Another possibility is to use a BEM model of the rotor to iteratively simulate several operating conditions and an optimization procedure to define the blade shape that minimizes the difference with respect to a target full-scale performance. The scale model rotor would perform closely to the reference but at the expense of an increase in the design procedure complexity and computational effort.
- The blade design was based on a single airfoil. Additional airfoils, of increased thickness, can be used in the innermost region of the rotor to increase the flapwise stiffness and strength; in this case, this would result in an increase in the design procedure complexity.
- In the case of the outdoor prototype, the aerodynamic and structural designs are achieved by means of two separated analyses, one dictating the blade shape and the other, the material. An improved result might be achieved by means of a more tied analysis. To this purpose, an aeroelastic beam-based model that accounts for the 3D geometry and material data for the blade [48] could be used in place of the 3D FEM model adopted here.
In conclusion, realizing a scale model wind turbine rotor is a challenge, with several objectives and constraints set by the application. The rotor performance is improved when dedicated methodologies and tools are adopted, but the latter are currently lacking. Future research is necessary to develop standardized scale model blade design tools and, therefore, have more reliable scale model experiments and data.
Author Contributions
Conceptualization, F.T. and S.D.C.; methodology, A.F.; formal analysis, S.D.C.; data curation, F.T., A.F. and S.D.C.; writing—original draft preparation, F.T., A.F. and S.D.C.; writing—review and editing, A.F. and S.M.; supervision, S.M. and M.B.; project administration, S.M. and M.B.; funding acquisition, M.B. All authors have read and agreed to the published version of the manuscript.
Funding
This research was funded by Horizon 2020, grant number 774426 and Horizon 2020 grant number 640741.
Institutional Review Board Statement
Not applicable.
Informed Consent Statement
Not applicable.
Data Availability Statement
Not applicable.
Acknowledgments
This paper is partially the result of the work carried out by the authors within the framework of the Blue Growth Farm project, which received funding from the European Union’s Horizon 2020 research and innovation programme under grant agreement number 774426, and within the framework of the LIFES50+ project, which received funding from the European Union’s Horizon 2020 research and innovation programme under grant agreement number 640741. The content of this work does not report the opinion of the European Commission and reflects only the views of the author(s), including errors or omissions. The European Commission is also not liable for any use that may be made of the information contained herein.
Conflicts of Interest
The authors declare no conflict of interest.
References
- Hand, M.M.; Simms, D.A.; Fingersh, L.J.; Jager, D.W.; Cotrell, J.R.; Schreck, S.; Larwood, S.M. Unsteady Aerodynamics Experiment Phase VI: Wind Tunnel Test. Configurations and Available Data Campaigns; National Tachnical Information Service: Springfield, VA, USA, 2001.
- Snel, H.; Schepers, J.G.; Montgomerie, B. The MEXICO project (Model Experiments in Controlled Conditions): The database and first results of data processing and interpretation. J. Phys. Conf. Ser. 2007, 75, 012014. [Google Scholar] [CrossRef]
- Berger, F.; Kuhn, M. Experimental investigation of dynamic inflow effects with a scaled wind turbine in a controlled wind tunnel environment. J. Phys. Conf. Ser. 2018, 1037, 052017. [Google Scholar] [CrossRef]
- Bottasso, C.L.; Campagnolo, F.; Petrović, V. Wind tunnel testing of scaled wind turbine models: Beyond aerodynamics. J. Wind Eng. Ind. Aerodyn. 2014, 127, 11–28. [Google Scholar] [CrossRef]
- Azcona, J.; Bouchotrouch, F.; González, M.; Garciandía, J.; Munduate, X.; Kelberlau, F.; Nygaard, A.T. Aerodynamic Thrust Modelling in Wave Tank Tests of Offshore Floating Wind Turbines Using a Ducted Fan. J. Phys. Conf. Ser. 2014, 524. [Google Scholar] [CrossRef]
- Frederik, J.; Kröger, L.; Gülker, G.; van Wingerden, J.-W. Data-driven repetitive control: Wind tunnel experiments under turbulent conditions. Control Eng. Pract. 2018, 80, 105–115. [Google Scholar] [CrossRef]
- Petrović, V.; Berger, F.; Neuhaus, L.; Hölling, M.; Kühn, M. Wind tunnel setup for experimental validation of wind turbine control concepts under tailor-made reproducible wind conditions. J. Phys. Conf. Ser. 2019, 1222, 012013. [Google Scholar] [CrossRef]
- Whale, J.; Papadopoulos, K.; Anderson, C.; Helmis, C.; Skyner, D. A study of the near wake structure of a wind turbine comparing measurements from laboratory and full-scale experiments. Sol. Energy 1996, 56, 621–633. [Google Scholar] [CrossRef]
- Vermeer, L.; Sørensen, J.; Crespo, A. Wind turbine wake aerodynamics. Prog. Aerosp. Sci. 2003, 39, 467–510. [Google Scholar] [CrossRef]
- Wang, J.; Foley, S.; Nanos, E.M.; Yu, T.; Campagnolo, F.; Bottasso, C.L.; Zanotti, A.; Croce, A. Numerical and Experimental Study of Wake Redirection Techniques in a Boundary Layer Wind Tunnel. J. Phys. Conf. Ser. 2017, 854, 012048. [Google Scholar] [CrossRef]
- Campagnolo, F.; Molder, A.; Schreiber, J.; Bottasso, C.L. Comparison of Analytical Wake Models with Wind Tunnel Data. J. Phys. Conf. Ser. 2019, 1256. [Google Scholar] [CrossRef]
- Bromm, M.; Rott, A.; Beck, H.; Vollmer, L.; Steinfeld, G.; Kühn, M. Field investigation on the influence of yaw misalignment on the propagation of wind turbine wakes. Wind Energy 2018, 21, 1011–1028. [Google Scholar] [CrossRef]
- Nanos, E.; Robke, J.; Heckmeier, F.; Jones, K.; Cerny, M.; Iungo, G.V.; Bottasso, C.L. Wake Characterization of a Multipurpose Scaled Wind Turbine Model. In Proceedings of the AIAA Scitech 2019 Forum, San Diego, CA, USA, 7–11 January 2019. [Google Scholar] [CrossRef]
- Ruzzo, C.; Muggiasca, S.; Malara, G.; Taruffi, F.; Belloli, M.; Collu, M.; Li, L.; Brizzi, G.; Arena, F. Scaling strategies for multi-purpose floating structures physical modeling: State of art and new perspectives. Appl. Ocean Res. 2021, 108, 102487. [Google Scholar] [CrossRef]
- Viselli, A.M.; Goupee, A.J.; Dagher, H.J. Model Test of a 1:8-Scale Floating Wind Turbine Offshore in the Gulf of Maine1. J. Offshore Mech. Arct. Eng. 2015, 137, 041901. [Google Scholar] [CrossRef]
- Ruzzo, C.; Romolo, A.; Malara, G.; Arena, F.; Taruffi, F.; Muggiasca, S.; Belloli, M.; Bouscasse, B.; Ohana, J.; Santoro, A.; et al. On the arrangement of two experimental activities on a novel multi-purpose floating structure concept. In Proceedings of the Developments in Renewable Energies Offshore, Lisbon, Portugal, 12–15 October 2020; Apple Academic Press: Palm Bay, FL, USA, 2020; pp. 291–302. [Google Scholar]
- Ruzzo, C.; Fiamma, V.; Collu, M.; Failla, G.; Nava, V.; Arena, F. On intermediate-scale open-sea experiments on floating offshore structures: Feasibility and application on a spar support for offshore wind turbines. Mar. Struct. 2018, 61, 220–237. [Google Scholar] [CrossRef]
- Cermelli, C.; Roddier, D.; Aubault, A. WindFloat: A Floating Foundation for Offshore Wind Turbines—Part II: Hydrodynamics Analysis. J. Renew. Sustain. Energy 2010, 2, 135–143. [Google Scholar]
- Kraskowski, M.; Zawadzki, K.; Rylke, A. A Method for Computational and Experimental Analysis of the Moored Wind Turbine Seakeeping. In Proceedings of the 18th Australasian Fluid Mechanics Conference, Launceston, Australia, 3–7 December 2012. [Google Scholar]
- Chujo, T.; Ishida, S.; Minami, Y.; Nimura, T.; Inoue, S. Model Experiments on the Motion of a SPAR Type Floating Wind Turbine in Wind and Waves. In Proceedings of the ASME 2011 30th International Conference on Ocean, Offshore and Arctic Engineering. Volume 5: Ocean Space Utilization; Ocean Renewable Energy, Rotterdam, The Netherlands, 19–24 June 2011. [Google Scholar] [CrossRef]
- Goupee, A.J.; Koo, B.J.; Kimball, R.W.; Lambrakos, K.F.; Dagher, H.J. Experimental Comparison of Three Floating Wind Turbine Concepts. J. Offshore Mech. Arct. Eng. 2014, 136, 020906. [Google Scholar] [CrossRef]
- Shin, H.; Kim, B.; Dam, P.T.; Jung, K. Motion of OC4 5MW Semi-Submersible Offshore Wind Turbine in Irregular Waves. In Proceedings of the ASME 2013 32nd International Conference on Ocean, Offshore and Arctic Engineering. Volume 8: Ocean Renewable Energy, Nantes, France, 9–14 June 2013. [Google Scholar] [CrossRef]
- Bachynski, E.E.; Chabaud, V.; Sauder, T. Real-time Hybrid Model Testing of Floating Wind Turbines: Sensitivity to Limited Actuation. Energy Procedia 2015, 80, 2–12. [Google Scholar] [CrossRef]
- Bredmose, A.H.; Campagnolo, F.; Pereira, R.; Sandner, F. Methods for Performing Scale-Tests for Method and Model Validation of Floating Wind Turbines, Deliverable D4.22. Inwind Project. 2014. Available online: https://www.semanticscholar.org/paper/D-4-.-22-%3A-Methods-for-performing-scale-tests-for-Andreas-Manjock/686e6f6e4492dcf71f89ef7620a72ad80bbbf299 (accessed on 26 March 2021).
- Li, L.; Collu, M.; Gao, Y.; Ruzzo, C.; Arena, F.; Taruffi, F.; Muggiasca, S.; Belloli, M. Development and validation of a coupled numerical model for offshore floating multi-purpose platforms. In Proceedings of the Developments in Renewable Energies Offshore, Lisbon, Portugal, 12–15 October 2020; Apple Academic Press: Palm Bay, FL, USA, 2020; pp. 274–281. [Google Scholar]
- Sauder, T.; Chabaud, V.; Thys, M.; Bachynski, E.E.; Sæther, L.O. Real-Time Hybrid Model Testing of a Braceless Semi-Submersible Wind Turbine: Part I-The Hybrid Approach. In Proceedings of the ASME 2016 35th International Conference on Ocean, Offshore and Arctic Engineering, Busan, Korea, 19–24 June 2016. [Google Scholar]
- Bachynski, E.E.; Thys, M.; Sauder, T.; Chabaud, V.; Sæther, L.O. Real-Time Hybrid Model Testing of a Braceless Semi-Submersible Wind Turbine: Part II Experimental Results. In Proceedings of the ASME 2016 35th International Conference on Ocean, Offshore and Arctic Engineering, Busan, Korea, 19–24 June 2016. [Google Scholar]
- Belloli, M.; Bayati, I.; Facchinetti, A.; Fontanella, A.; Giberti, H.; La Mura, F.; Taruffi, F.; Zasso, A. A hybrid methodology for wind tunnel testing of floating offshore wind turbines. Ocean Eng. 2020, 210, 107592. [Google Scholar] [CrossRef]
- Thys, M.; Fontanella, A.; Taruffi, F.; Belloli, M.; Berthelsen, P.A. Hybrid Model Tests for Floating Offshore Wind Turbines. In Proceedings of the ASME 2019 2nd International Offshore Wind Technical Conference, St. Julian, Malta, 3–6 November 2019. [Google Scholar]
- Bayati, I.; Belloli, M.; Bernini, L.; Giberti, H.; Zasso, A. Scale model technology for floating offshore wind turbines. IET Renew. Power Gener. 2017, 11, 1120–1126. [Google Scholar] [CrossRef]
- Bak, C.; Zahle, F.; Bitsche, R.; Kim, T.; Yde, A.; Henriksen, L.C.; Hansen, M.H.; Blasques, J.P.A.A.; Gaunaa, M.; Natarajan, A. The DTU 10-MW Reference Wind Turbine; Technical University of Denmark, DTU Wind Energy: Lyngby, Denmark, 2013. [Google Scholar]
- Fontanella, A.; Taruffi, F.; Muggiasca, S.; Belloli, M. Design Methodology for a Floating Offshore Wind Turbine Large-Scale Outdoor Prototype. In Proceedings of the International Conference on Offshore Mechanics and Arctic Engineering, Glasgow, UK, 9–14 June 2019. [Google Scholar]
- Muggiasca, S.; Fontanella, A.; Taruffi, F.; Giberti, H.; Facchinetti, A.; Belloli, M.; Bollati, M. Large Aeroelastic Model of a Floating Offshore Wind Turbine: Mechanical and Mechatronics Design. In Proceedings of the ASME 2019 2nd International Offshore Wind Technical Conference, St. Julian, Malta, 3–6 November 2019. [Google Scholar]
- Larsen, T.J.; Hanson, T.D. A method to avoid negative damped low frequent tower vibrations for a floating, pitch controlled wind turbine. J. Phys. Conf. Ser. 2007, 75, 11. [Google Scholar] [CrossRef]
- Bayati, I.; Belloli, M.; Bernini, L.; Boldrin, D.; Boorsma, K.; Caboni, M.; Cormier, M.; Mikkelsen, R.; Lutz, T.; Zasso, A. UNAFLOW project: UNsteady Aerodynamics of FLOating Wind turbines. J. Phys. Conf. Ser. 2018, 1037, 072037. [Google Scholar] [CrossRef]
- Bayati, I.; Belloli, M.; Bernini, L.; Zasso, A. A Formulation for the Unsteady Aerodynamics of Floating Wind Turbines, with Focus on the Global System Dynamics. Offshore Technol. 2017, 1. [Google Scholar] [CrossRef]
- Bayati, I.; Belloli, M.; Bernini, L.; Zasso, A. Wind tunnel validation of AeroDyn within LIFES50+ project: Imposed Surge and Pitch tests. J. Phys. Conf. Ser. 2016, 753, 092001. [Google Scholar] [CrossRef]
- Bayati, I.; Belloli, M.; Bernini, L.; Zasso, A. Wind Tunnel Wake Measurements of Floating Offshore Wind Turbines. Energy Procedia 2017, 137, 214–222. [Google Scholar] [CrossRef]
- Bayati, I.; Bernini, L.; Zanotti, A.; Belloli, M.; Zasso, A. Experimental investigation of the unsteady aerodynamics of FOWT through PIV and hot-wire wake measurements. J. Phys. Conf. Ser. 2018, 1037, 052024. [Google Scholar] [CrossRef]
- Bayati, I.; Facchinetti, A.; Fontanella, A.; Taruffi, F.; Belloli, M. Analysis of FOWT dynamics in 2-DOF hybrid HIL wind tunnel experiments. Ocean Eng. 2020, 195, 106717. [Google Scholar] [CrossRef]
- Lyon, C.A.; Broeren, A.P.; Giguère, P.; Gopalarathnam, A.; Selig, M.S. Summary of Low-Speed Airfoil Data; SoarTech Pulications: Orlando, FL, USA, 1997. [Google Scholar]
- Bayati, I.; Belloli, M.; Bernini, L.; Zasso, A. Aerodynamic design methodology for wind tunnel tests of wind turbine rotors. J. Wind Eng. Ind. Aerodyn. 2017, 167, 217–227. [Google Scholar] [CrossRef]
- Matthews, F.L.; Davies, G.A.O.; Hitchings, D.; Soutis, C. Finite Element Modelling of Composite Material and Structures; Woodhead Publishing: Cambridge, UK, 2000. [Google Scholar]
- IEC 61400–2. Wind Turbines-Part 2: Design Requirements for Small Wind Turbines; International Electrotechnical Commission: Geneva, Switzerland, 2006. [Google Scholar]
- Lloyd, G. Guideline for the Certification of Wind Turbines; Germanischer Lloyd Industrial Services GmbH: Hamburg, Germany, 2010. [Google Scholar]
- Cox, K.; Echtermeyer, A. Structural Design and Analysis of a 10MW Wind Turbine Blade. Energy Procedia 2012, 24, 194–201. [Google Scholar] [CrossRef]
- IEC 61400–23:2002. Wind Turbine Generator Systems-Part 23: Full Scale Testing of Rotor Blades; International Electrotechnical Commission: Geneva, Switzerland, 2002. [Google Scholar]
- Branner, K.; Blasques, J.; Kim, T.; Fedorov, V.; Berring, P.; Bitsche, R.; Berggreen, C. Anisotropic Beam Model for Analysis and Design of Passive Controlled Wind Turbine Blades; DTU Wind Energy: Lyngby, Denmark, 2012. [Google Scholar]


Publisher’s Note: MDPI stays neutral with regard to jurisdictional claims in published maps and institutional affiliations. |
© 2021 by the authors. Licensee MDPI, Basel, Switzerland. This article is an open access article distributed under the terms and conditions of the Creative Commons Attribution (CC BY) license (https://creativecommons.org/licenses/by/4.0/).