Article

Numerical Analysis of the Influence of Different Flow Patterns on Power and Reactant Transmission in Tubular-Shaped PEMFC

1
School of Mechanical and Power Engineering, Zhengzhou University, Zhengzhou 450001, China
2
Zhengzhou Greenburning Machinery Equipment Co., Ltd., Zhengzhou 450001, China
3
Editorial Board of Journal of Zhengzhou University, Zhengzhou University, Zhengzhou 450001, China
*
Author to whom correspondence should be addressed.
Energies 2021, 14(8), 2127; https://doi.org/10.3390/en14082127
Submission received: 6 March 2021 / Revised: 5 April 2021 / Accepted: 7 April 2021 / Published: 10 April 2021

Abstract

:
The influence of a tubular structure PEMFC (proton exchange membrane fuel cell) with different flow patterns is investigated in this study. A complete 3D non-isothermal model is constructed for square and circular tubular PEMFCs, and the distribution of oxygen and water concentration in cathode channels, current density, power density and cell net power are studied. To this end, the four arrangements of tubular PEMFC are square chordal (SC), square peripheral (SP), circular chordal (CC) and circular peripheral (CP). The calculation of the effective area and boundary conditions remains the same when performing all four configurations. The consequent results show that for the tubular structure PEMFC, compared with the co-flow mode, the counter-flow mode has better performance and provides more power. Using a counter-flow pattern, the permeability of the species increases, so a more uniform reaction occurs at the cell. The entire performance of the SP and CP model is not as good as that of the SC and CC models because the SP and CP models have a higher flow velocity. Moreover, the SC model using the counter-flow pattern has the maximum predicted net power among the other models.

1. Introduction

As the world continues to work hard to search for other energy sources to deal with climate change, the sources of energy used for electricity production should be scrutinized [1,2,3]. Over the past few years, fossil products have become the main source of energy production in the world [4,5,6,7]. Therefore, renewable resources are considered to be the best substitute for these fossil products [8,9]. The proton exchange membrane fuel cell (PEMFC) is widely applied as a new type of energy equipment for electric vehicles. However, the commercial success of the PEMFC depends on its ability to convert fuel into high current density electrical energy. For the purpose of making PEMFC more competitive, several research activities aiming to optimize the operating conditions of fuel cells have been completed [10].
Nowadays, so as to economically use PEMFCs to replace fossil fuel converters, many challenges remain unsolved. The most critical challenges currently encountered by PEMFCs are their performance, durability and cost. [11,12,13]. So far, many efforts have been made to overcome these challenges [14,15,16], but there are still some unsolved problems [17,18].
As is known to all, many parameters affect PEMFC performance, for instance, porosity, relative humidity and so on. In order to prove this, Tang et al. [19] developed a PEMFC to project the impact of operational parameters for fuel cells. They found that enhancing the working pressure and working temperature could improve fuel cell performance. Furthermore, facts have proved that as the air stoichiometric ratio increases, cell performance is improved. Badreddine Larbi [20] constructed a 2D PEMFC model and obtained the result that higher backing layer porosity was good for oxygen diffusion. Moreover, the conductivity decreases as the porosity increases. Dong Hyup Jeon [21] made a numerical study of the influence of cathode relative humidity on the species uniformity of PEMFCs. PEMFC performance and uniformity are greatly influenced by the relative humidity of the cathode. In addition, M.S. Ismail [22] created a 3D model for PEMFC with serpentine channels, and they found that conductivity has a significant impact on PEMFC, but the gas permeability has little effect on PEMFC. Aftab Ahmed et al. [23] found that at higher current densities, smaller flow channel sizes result in less polarization concentration for serpentine type single channel geometry PEMFCs.
Since the flow channel is the place for reactant transportation, the structure of the channel is the most influential parameter of the PEMFC [24]. Shiang-Wuu Perng et al. [25] employed a 3D numerical study of the effect of trapezoidal baffle on the transport of non-isothermal reactants in PEMFCs. They concluded that the new gas channel with trapezoidal baffle greatly increased the net power of the battery compared with the traditional gas channel without baffle. Moreover, Eraso Mancusi et al. [26] discussed the effect of a flow channel with an uneven cross-section of PEMFCs. Their findings showed that the distribution of reactants in the porous medium would result in more effective oxygen distribution by using more tapered channels. Mohammad Ziauddin Chowdhury, Omer Genca et al. [27] found that, compared with the land width, the pressure drop has a greater correlation with the channel width, and the anode pressure drop is not as significant as the cathode pressure drop. I. Khazaee et al. [28] carried out a PEMFC model, which showed that by increasing the number of channels and reducing the channel area, PEMFC performance can be improved.
In light of the work reviewed, it can be noticed that one of the main elements affecting PEMFC performance is the design of the architecture and flow field. The tubular fuel cell is a new design of PEMFC. Many fuel cell organizations and companies have conducted a large number of experimental studies on tubular fuel cells; however, a large of data are proprietary, and only a few data have been made public. The advantages of tubular design over flat design are as follows: (i) elimination of flow field loss and reduced pressure drop; (ii) uniform pressure distribution on MEA (Membrane Electrode Assembly); (iii) ease of recycling.
Al-Baghdadi and Maher A.R.Sadiq [29] checked and analyzed the performance of the tubular structure PEMFC under various material properties in detail. Ashkan Torkavannejad et al. [30] constructed three new tubular PEMFC structures and performed numerical analysis on these three models. They found that, compared with traditional PEMFC configuration, circular and square tubular-shaped fuel cells have multiple advantages and better performance. Sierra et al. [31] discussed the performance of different geometries in a cylindrical PEM fuel cell. Behzad Osanloo [32] analyzed the effect of three different architectures of membrane, catalytic layer and gas diffusion layer on the performance of square tubular PEMFCs. They found that, compared with the other two structures, the square chordal structure could produce better fuel cell performance. Akbar Mohammadi-Ahmar et al. [33] analyzed the performance of circular PEMFC with different architectures and layers. They presented five layouts of tubular PEMFC. Recently, Ali Solati et al. [34] observed that adding an intermediate electrode to the PEMFC would increase the current density and consume more reactants, thereby improving the performance of the PEMFC.
From the above research, innovational architectures and different flow fields may enhance PEMFC performance. Thence, in this research, the influence of different flow patterns on power and reactant transmission of square and circular tubular structure fuel cells of the same active reaction surface area is studied numerically for the first time. Figure 1b,c represent co-flow and counter-flow patterns, respectively. To this end, two square tubular-shaped architectures and two circular tubular-shaped architectures are created, which are called square chordal (SC), square peripheral (SP), circular chordal (CC), and circular peripheral (CP). Under the premise of the same effective area, geometric shape and boundary conditions, the four models were simulated numerically, and then the numerical simulation results were analyzed. In addition, the results of the basic model are compared with the experimental results of Wang et al. [35], so as to ensure the accuracy of the numerical simulation method in this paper.

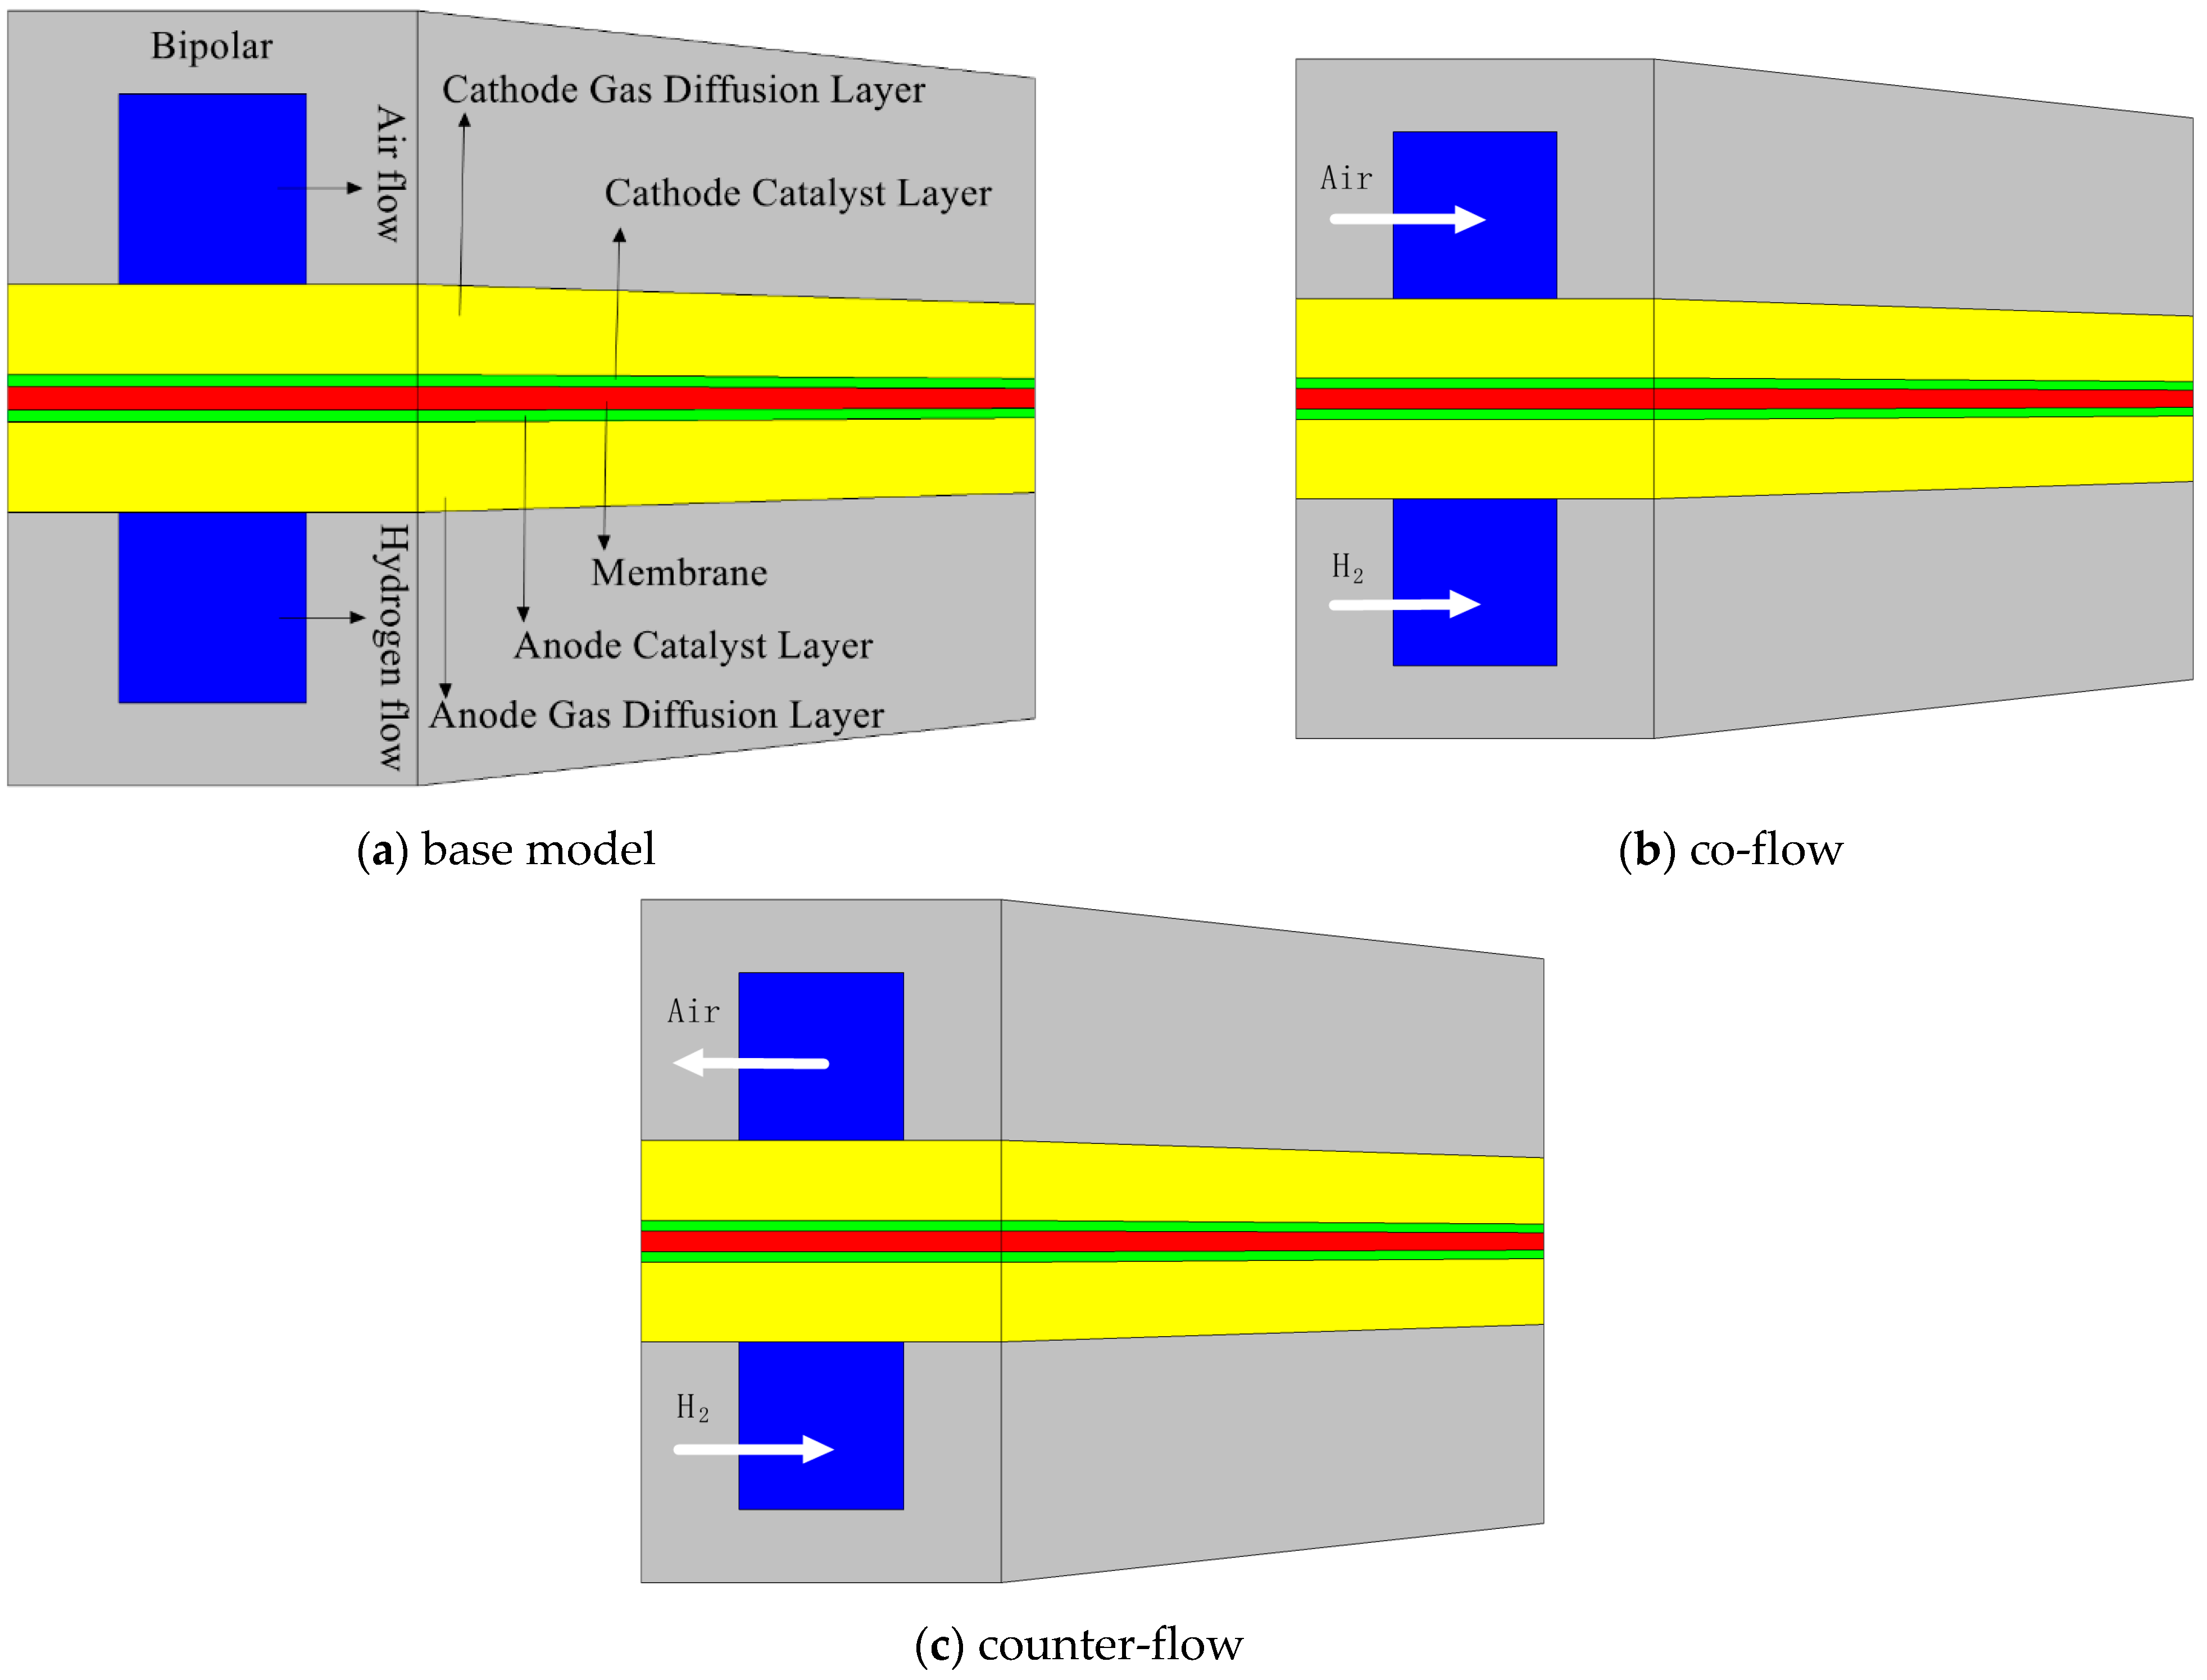
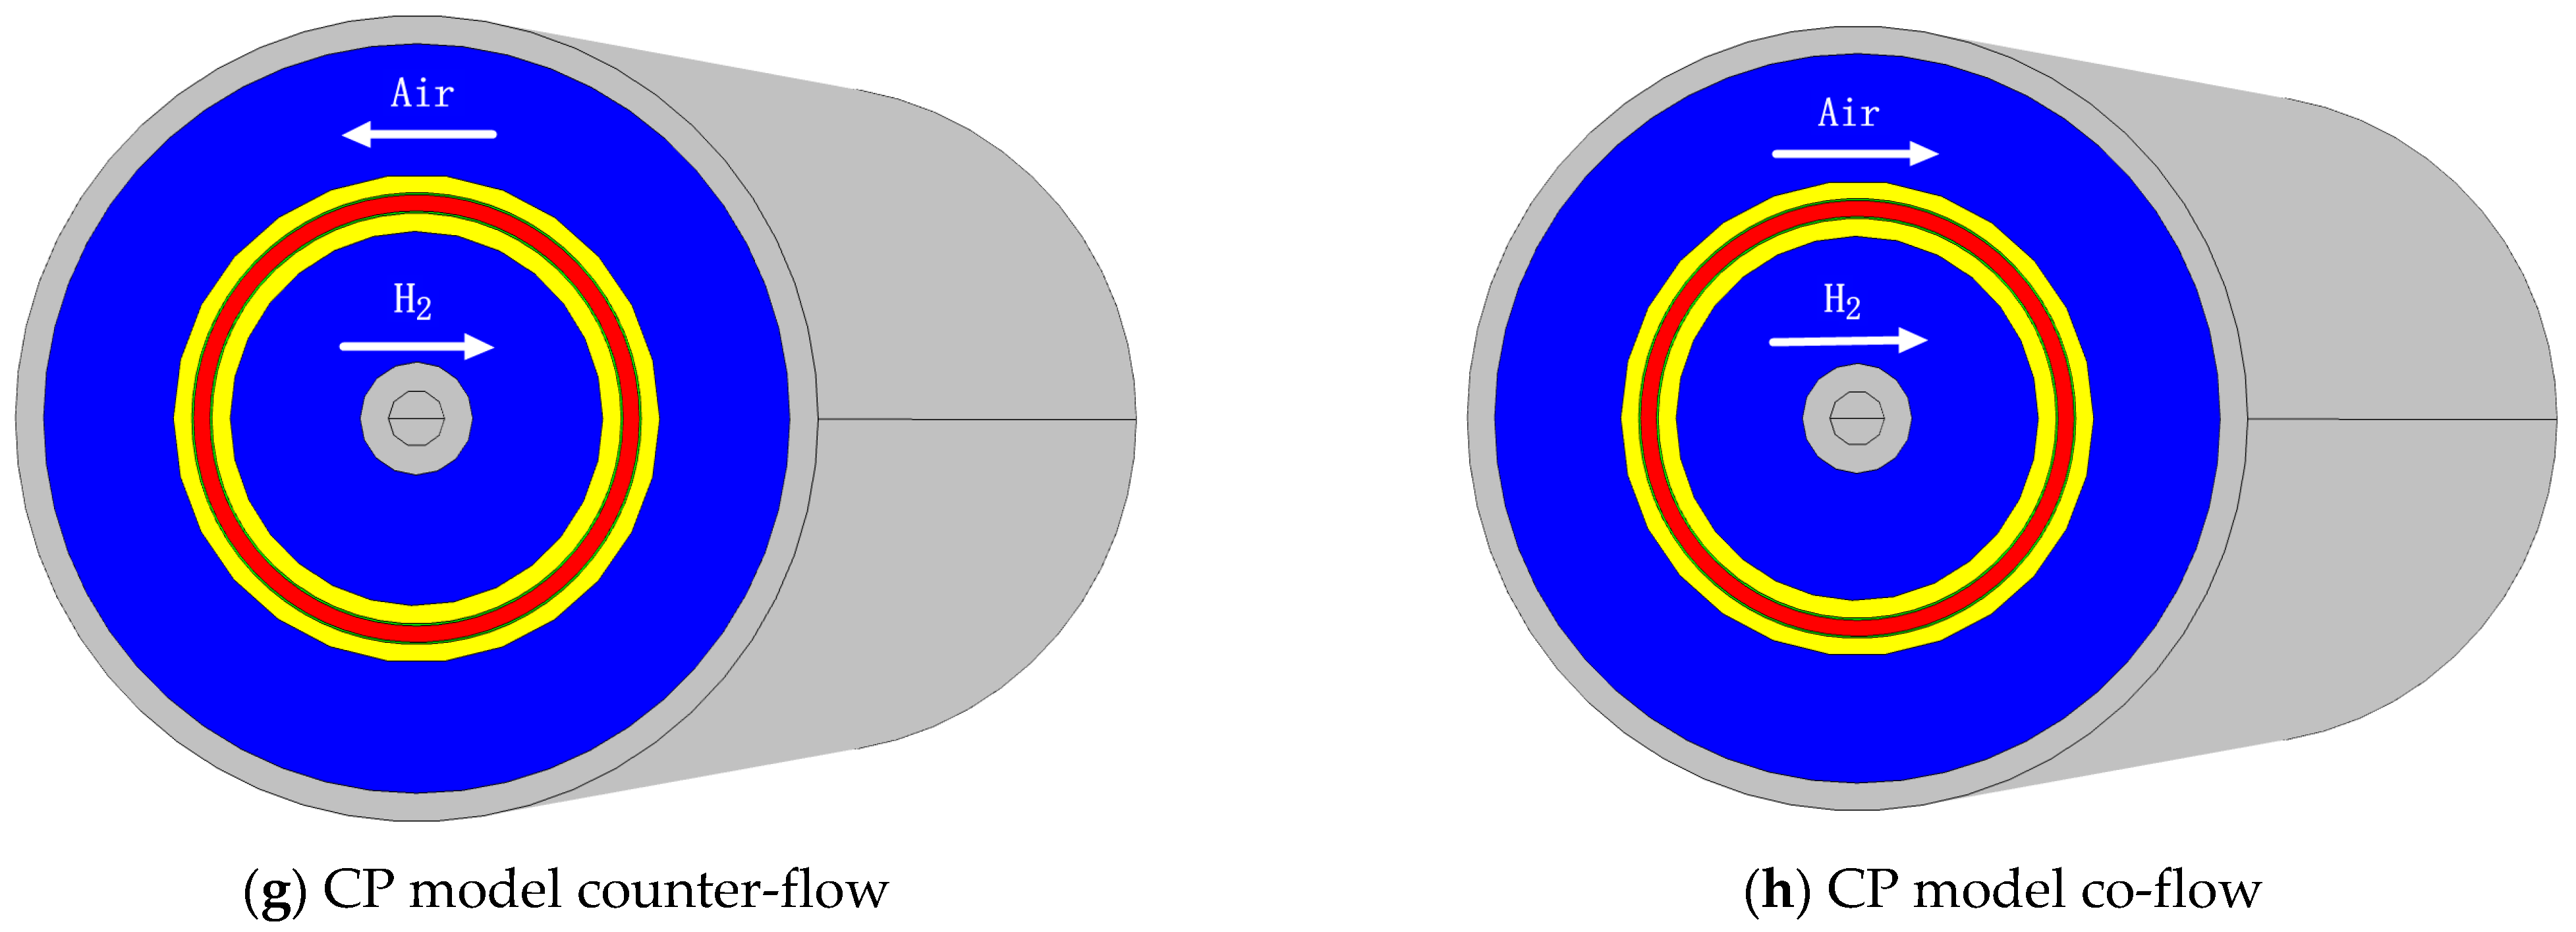
2. Mathematical Model

Figure 1a shows the computational domain for the base model, which includes two direct reaction channels; the upper half is the cathode, and the lower half is the anode. Figure 1b,c represent co-flow and counter-flow patterns, respectively. In this research, we assessed square and circular tubular-shaped geometry with four different architectures, namely square chordal, square peripheral, circular chordal, and circular peripheral, which are indicated in Figure 2. In this paper, four tubular structure models with 3D non-isothermal were considered for two flow patterns, co-flow and counter-flow. Using the fuel cell module in COMSOL Multiphysics 5.5 and contrasting the polarization and power density curves, the results of square and circular tubular PEMFC models with different flow patterns were analyzed. Moreover, the results were compared with the basic model. Table 1 shows the geometrical parameters of the models. Operating conditions and electrochemical parameters are shown in Table 2 [31,36,37,38].
Since one of the characteristics of the tubular structure is the transfer of electrons across the electrode surface, in the tubular PEMFC structure, the reactant concentration and temperature distribution will be more uniform [30,31]. Four different mesh divisions were used for each model to ensure the accuracy of the results obtained. The current density parameter was used to evaluate mesh independence. Finally, hexahedral meshes were chosen for these four models. In addition, the grid numbers for the (SC), (SP), (CC) and (CP) models were 161,620, 152,830, 148,370 and 167,060, respectively.

2.1. Assumptions

The assumptions of the studied model are as follows:
  • The gas inlet conditions of the cathode and anode are considered to be completely humid.
  • There are stationary and non-isothermal conditions.
  • The laminar flow is established inside the channel.
  • The system works under steady-state conditions.
  • The fluid is an ideal incompressible fluid.
  • The liquid water transfer mechanism in the membrane is controlled by permeation resistance and diffusion.
  • Membrane, CL and GDL are considered to have a uniform porous area and to be isotropic.

2.2. Governing Equations

The transport phenomena that occur inside the proton exchange membrane fuel cell are expressed by the governing equations of conservation of mass, momentum, energy, species, and charge transport. These equations are described as follows:
Continuity equation
( ρ V ) = S m
where V is the velocity vector, and ρ is the fluid density. Sm is the source term for the balance of species.
Momentum transport
The steady-state momentum equation is expressed as:
( ρ VV ) = p   + ( μ e f f V ) + S P
where μeff shows the average viscosity of the mixture, and p stands for static pressure. SP is the source term that contains the physical characteristics of the porous regions. It is calculated as:
S P = ( μ / k ) V
where k stands for the permeability of GDL and CL. V is the apparent velocity vector in the porous zones and μ is the viscosity of the gas.
Energy
( V ( ρ E + p ) ) = ( k e f f T i h i ( ρ D i y i ) )
where hi is the enthalpy of each species, E is total energy, and keff is the coefficient of effective conductivity.
Species transport
The species transport equation is used to determine the local mass fraction of each species yi. The equation is described as:
( ρ V y i ) = ( ρ ( D i y i ) ) + S i
where Si is the source term for each phase, and Di is the diffusion coefficient for species i. For the specific species in the reaction, Si can be expressed as follows:
S H 2 = M W , H 2 2 F R a n
S O 2 = M W , O 2 4 F R c a
S H 2 O = M W , H 2 O 2 F R c a
D i = ε 1.5 D 0 ( 101325 p ) ( T 300 ) 1.5
where D0 is the distribution of component mass in the specific pressure and temperature.
Electrochemical model
The electrochemical processes and transport phenomena in PEMFCs can be solved by the following two equations [39]. Equation (10) is related to the transport of electrons between the GDL, the CL and the plate. The Equation (11) is related to the transport of protons between the CL and the membrane.
( σ s o l ϕ s o l ) + R s o l = 0
( σ m e m ϕ m e m ) + R m e m = 0
where R stands for the convection currents, σ is the ionic conductivity and φ expresses the potential of the cell. Subscript sol corresponds to the solid phase, and subscript mem corresponds to the electrolyte phase.
The local current density in the catalytic layer can be expressed by Butler-Volmer’s general equation as follows:
R a n = J a n r e f ( H 2 H 2 , r e f ) γ a n [ exp ( α a n F η a n R T ) exp ( α c a t F η a n R T ) ]
R c a = J c a r e f ( O 2 O 2 , r e f ) γ c a [ exp ( α a n F η c a R T ) + exp ( α c a t F η c a R T ) ]
where Jref stands for the reference transfer current density; O2/O2,ref and H2/H2,ref are the reference and local species concentration on the cathode and anode, separately; γ is the coefficient of concentration; α stands for the transfer coefficient; η represents the activation losses; and F is the Faraday constant. Local surface overpotential, or activation losses η, controls the reaction. This parameter is linked to the potential difference between the electrodes and the electrolyte surfaces (φsol, φmem). The overpotential is calculated for both the cathode and anode, including the open circuit voltage VOC. Thence, the potential difference between the two electrodes can be determined as:
η a n = ϕ s o l ϕ m e m
η c a = ϕ s o l ϕ m e m V O C
VOC is calculated from Equation (16) [40]:
V O C = 0.0025 T + 0.2329
In the numerical simulation, the membrane is considered to be composed of porous media. Springer found that ionic conductivity, σmem, and the electro-osmotic drag coefficient is indicated as a function of the water content as follows [41]:
σ m e m = ( 0.00514 λ 0.00326 ) exp 1268 ( 1 303 1 T )
λ = 0.043 + 17.81 a 39.84 a 2 + 36 a 3 ,   ( a   <   1 )
λ = 14 + 1.4 ( a 1 ) ,   ( a   >   1 )
In which a is the water activity. Seok Yi Jung, Van Nguyen Trung [42] and JH. Nam et al. [43] studied the saturation model of PEMFCs to imitate the formation and transmission of liquid water in PEMFCs.

2.3. Boundary Conditions

Inlet gas velocity can be calculated as follows [44]:
u i n , a = ξ a n I A m e m M H 2 / ( 2 F ) ρ H 2 A a n
u i n , c a = ξ c a I A m e m M O 2 / ( 4 F ) ρ O 2 A c a
where I stands for the operating current density of PEMFCs.
Inlet velocities are gained by operating the current density (I) of PEMFCs; the stoichiometric flow ratios, ξ a n ξ c a ; hydrogen and air density; and the cross-sections of the anode and cathode, Aan Aca. Furthermore, at the inlet channels of the base model and four square and circular tubular-shaped tubular architectures (SC, SP, CC, CP), the same mass flow rates were applied. At the outlet, zero-gauge pressure was assumed to be the atmosphere for the discharge condition. The coupled boundary condition and zero species flux was applied for the velocity, non-slip boundary condition and the fluid-solid interface. The ambient temperature of 293.15 K is used for the outer surface of the entire model.

3. Results and Discussion

Obtained simulation results were verified by the basic model. The results are contrasted with the experimental data of Wang et al. [35] under the same research parameters, thereby ensuring the accuracy of the simulation results. Figure 3 shows the comparison results. From the comparison results in Figure 3, we can see that the simulated current density curve is extremely consistent with the experimental results under different working voltages. From the experimental data of Wang et al., at a low voltage, the current density result obtained by the experiment is lower than the results of the numerical simulation, and there is a small deviation between the two results. The main cause is that in the actual reaction, the liquid water produced will fill the porous structure in the GDL, thereby hindering the progress of the reaction and slowing down the reaction speed, so the current density results obtained are lower.
This section presents the simulation results of PEMFCs with different structures in the co-flow and counter-flow conditions and compares the results to the basic model. The results are represented by current density curve, power density curve, oxygen concentration distribution diagram, cathode water concentration distribution diagram, and pressure drop, which show relevant information about the internal reaction process of the fuel cell.

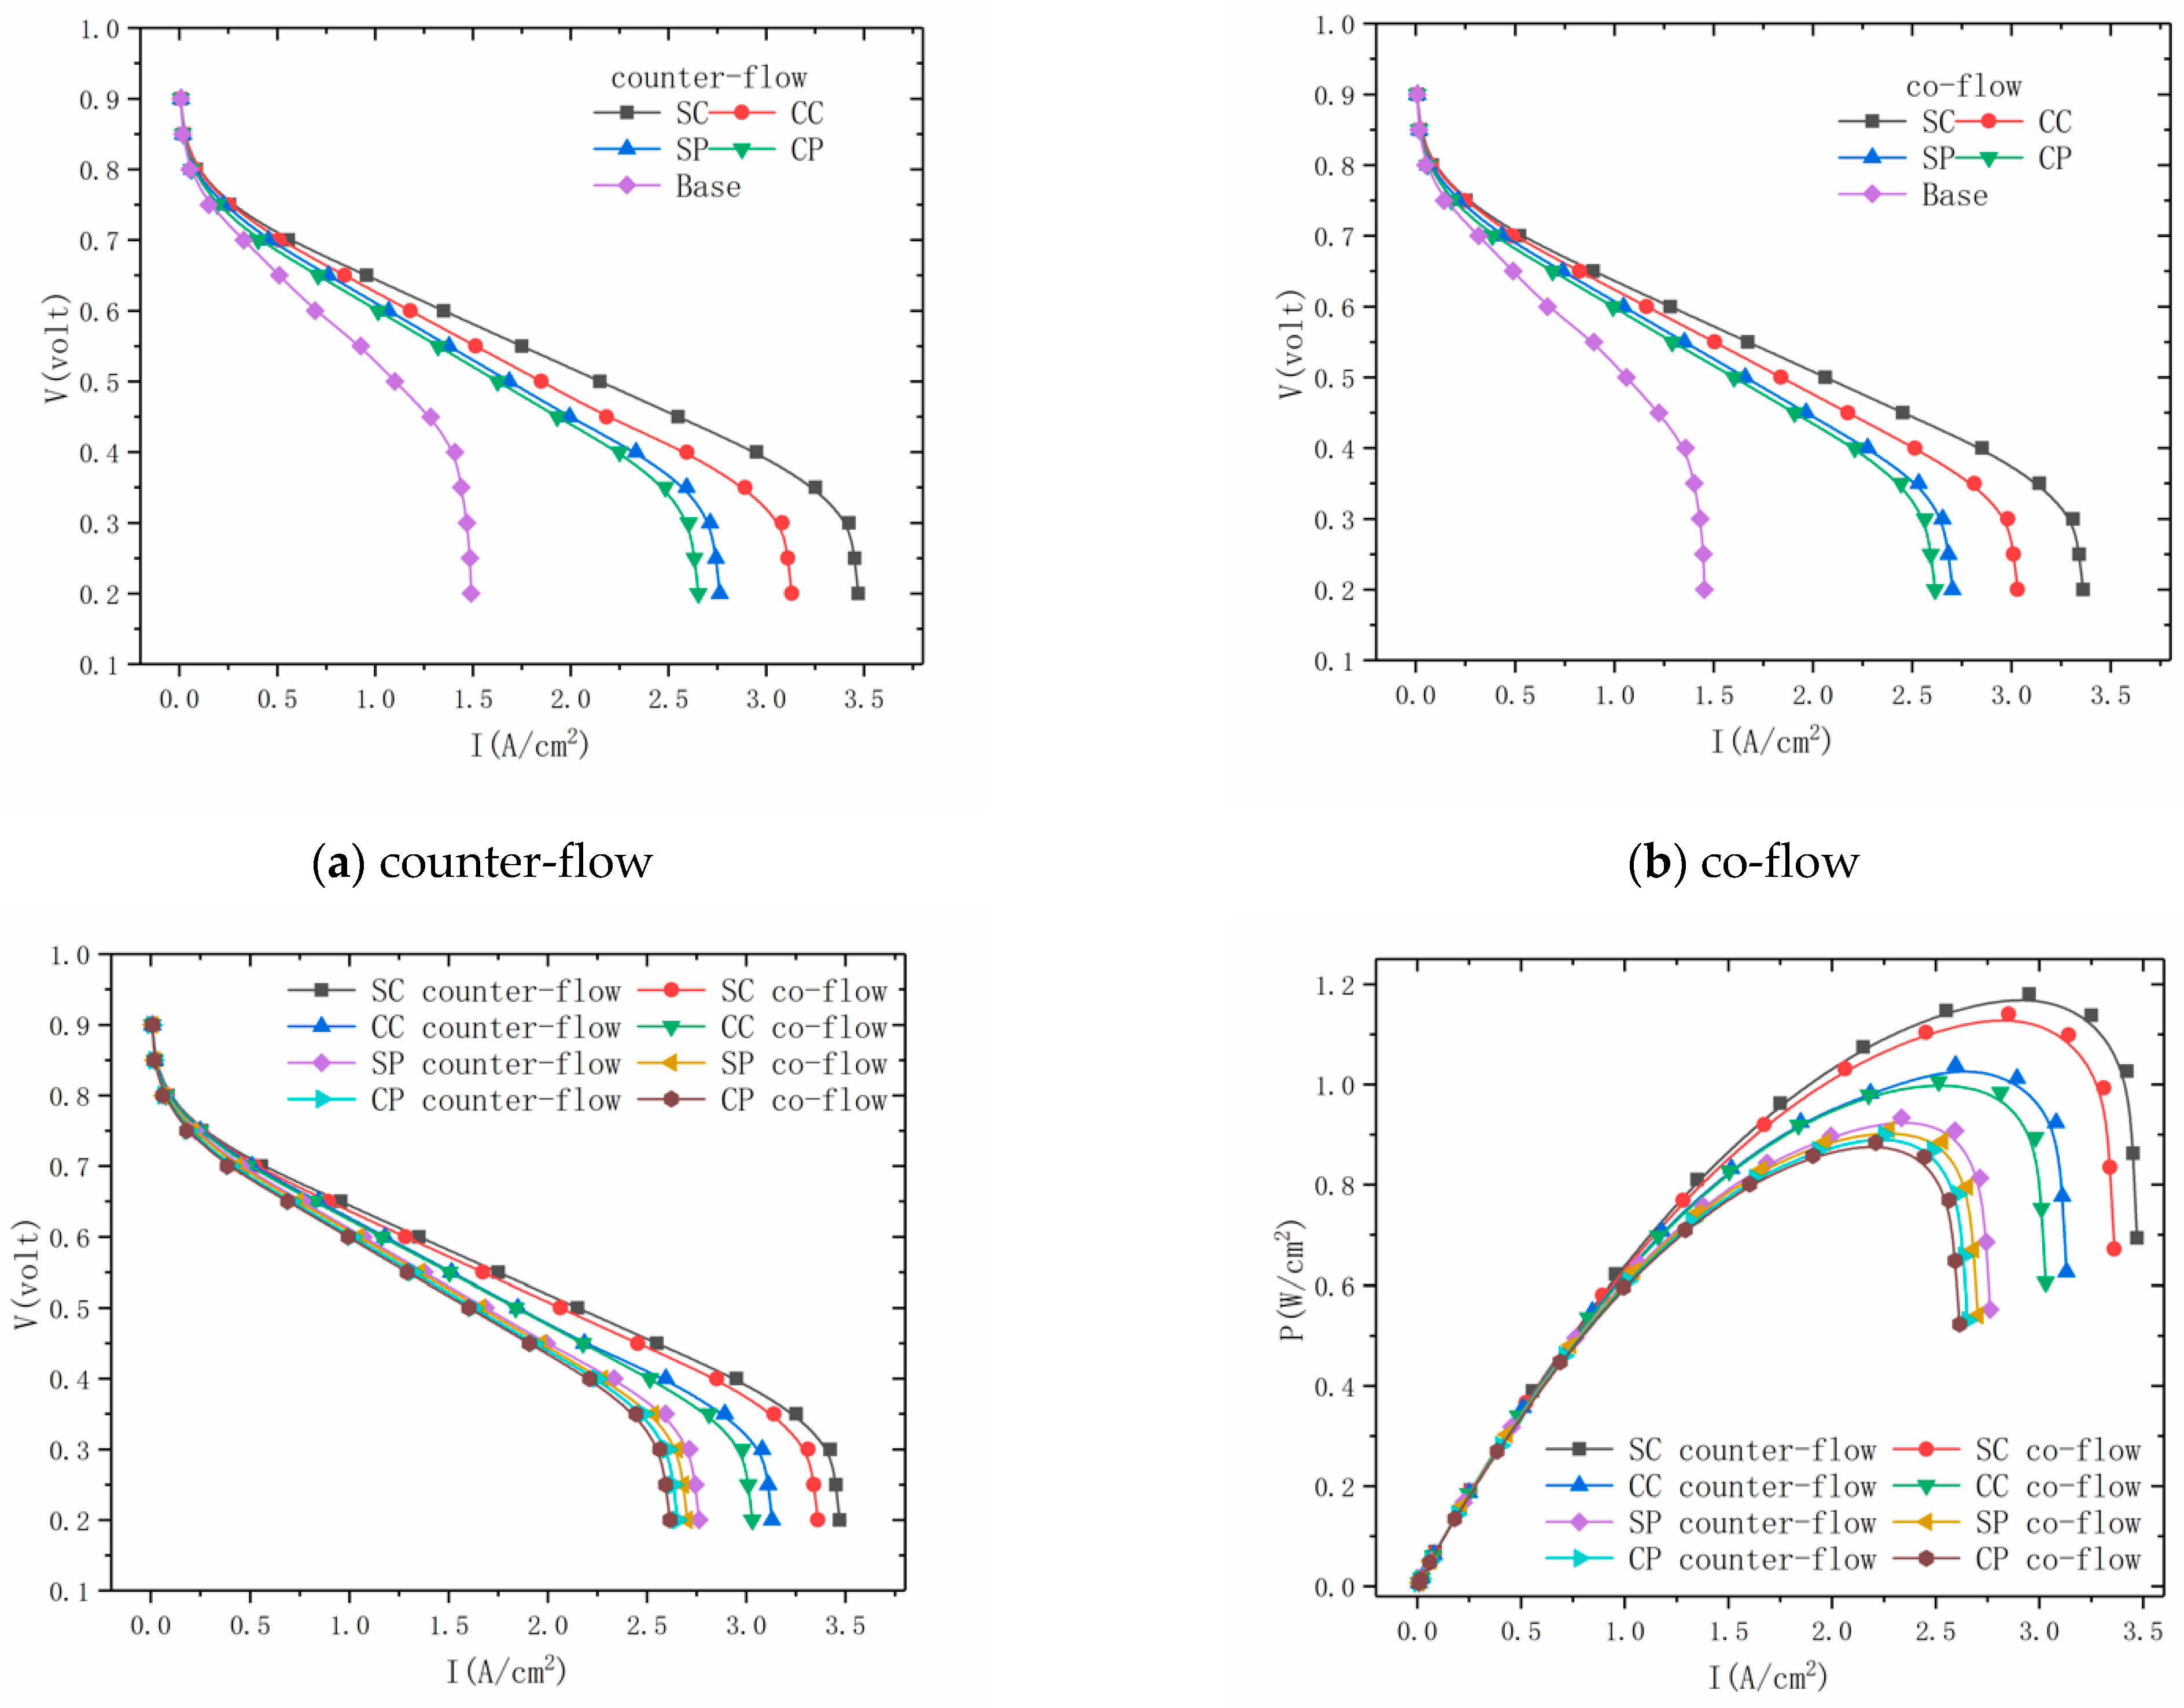
3.1. PEMFC Polarization Curve

Figure 4 displays the comparison of the current density and power density results of four different tubular PEMFC structures and the traditional planar structure under the same boundary conditions and model parameters. It can be seen from Figure 4a,b that the PEMFC performance of the tubular structure is better than that of the traditional planar structure under different operating voltages in counter-flow and co-flow patterns. In the tubular structure model, as the reaction progresses, the reaction gas can be replenished to the catalytic layer over time, which will result in lower concentration potential. Therefore, the simulation result of the tubular structure will be better than the traditional planar structure, showing better performance. Moreover, the cost of tubular structure PEMFC is reduced compared with the planar structure, because the length of the tubular model is reduced. The cross-sectional area of the reaction gas channel becomes smaller, thereby increasing the flow rate, promoting a more violent reaction, and showing better performance.
It can be seen from Figure 4 that the square chordal (SC) model has a higher current density than the other three models, no matter the co-flow and counter-flow patterns. In addition, Figure 4c,d show that in all tubular fuel cell structures, the current density and power density results simulated by the co-flow mode are lower than the counter-flow mode, and the PEMFC performance is not as high as the counter-flow mode.

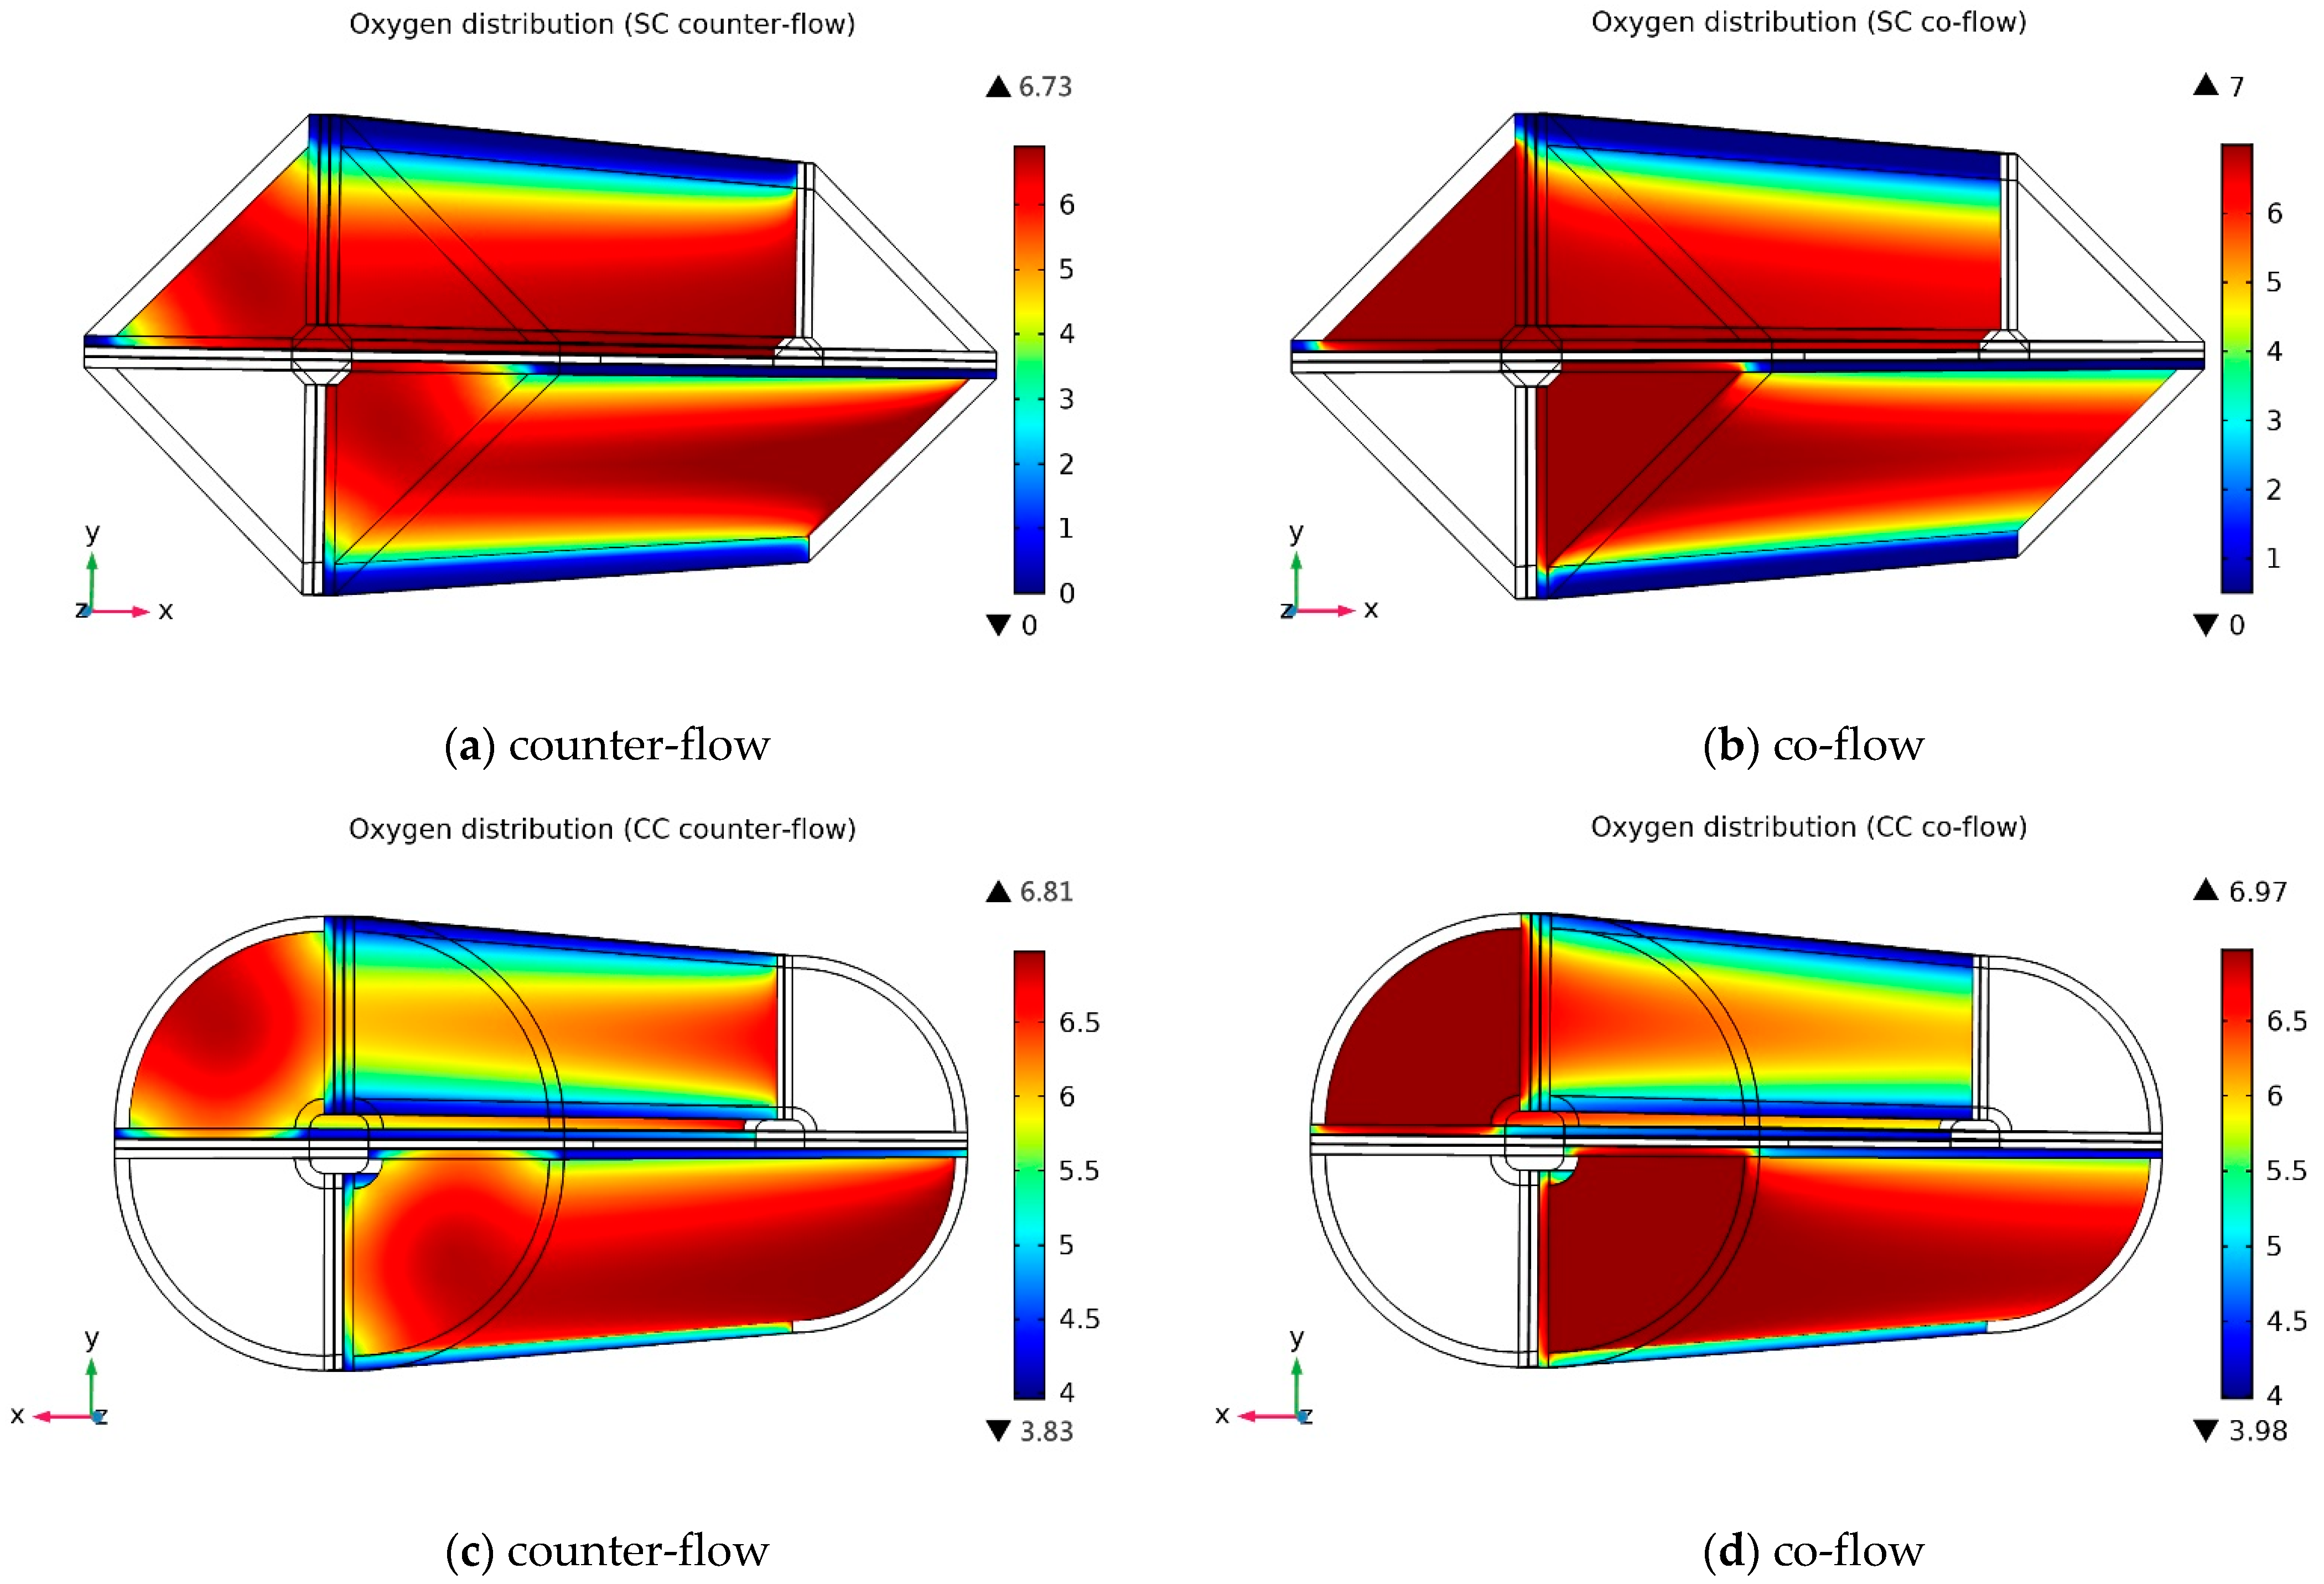
3.2. Species Concentration Distribution

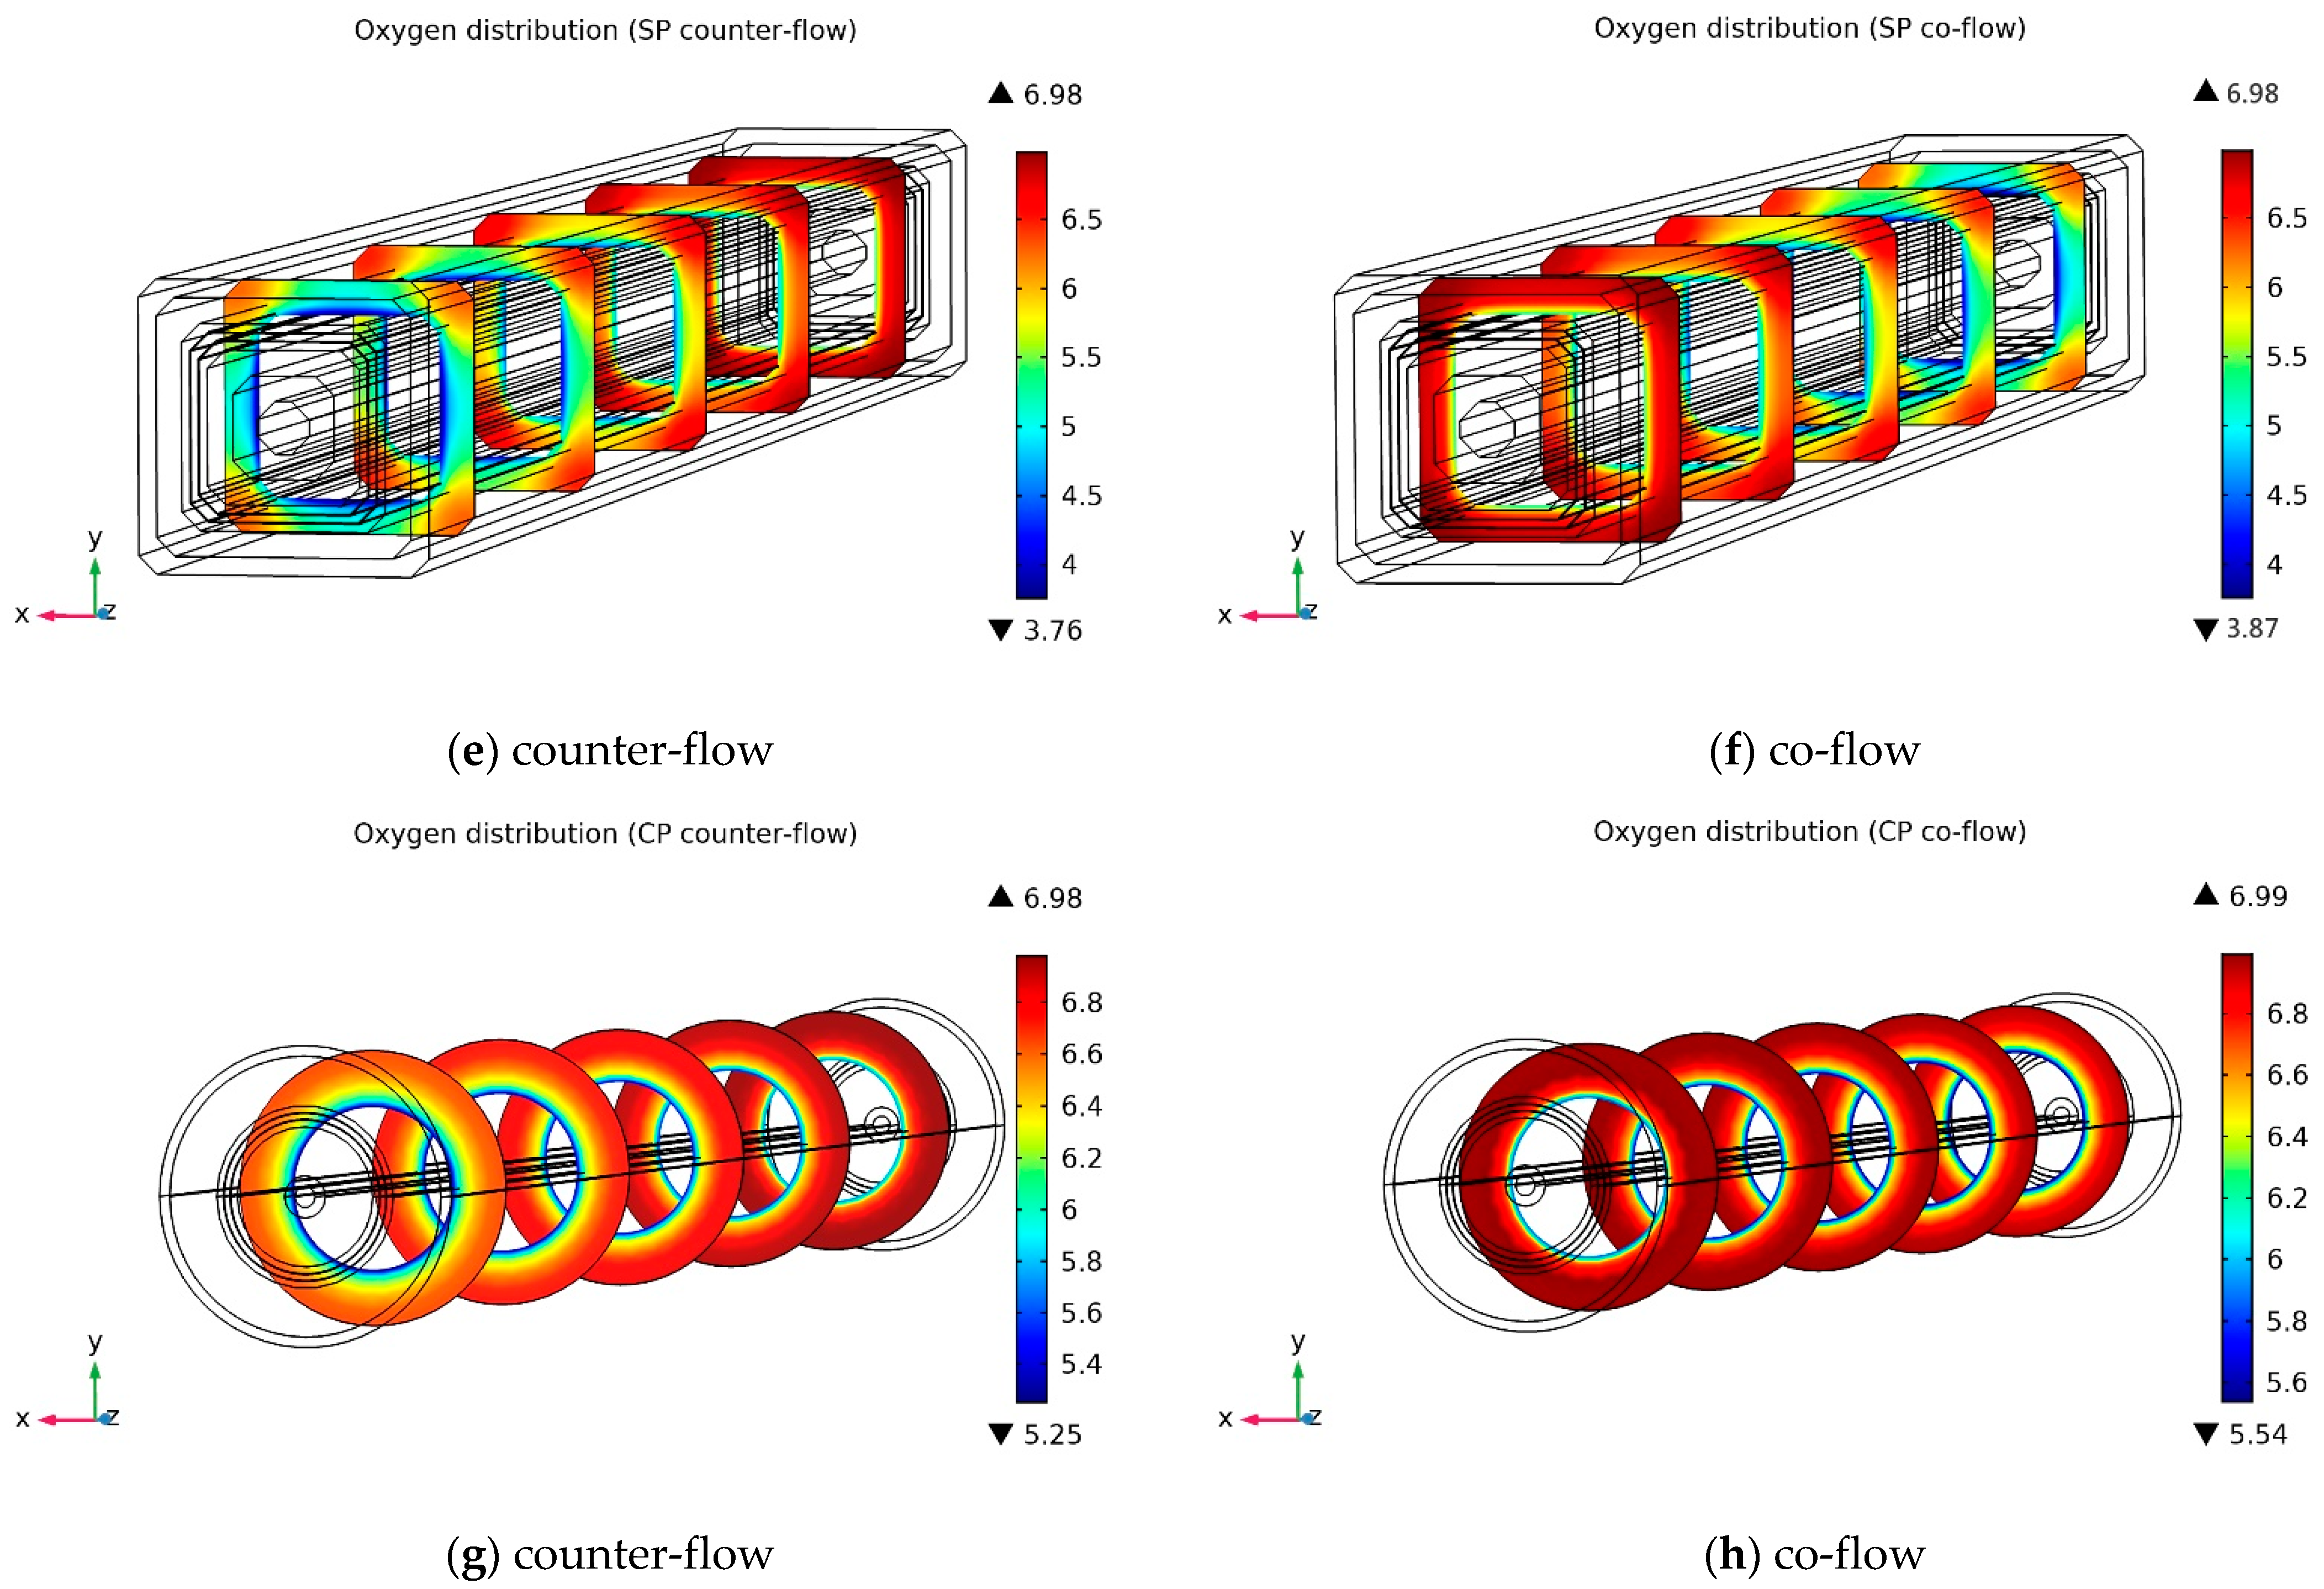
3.2.1. Oxygen Molar Concentration Distribution

In order to completely explain the above results, co-flow and counter-flow should be conducted simultaneously under the four models to study species consumption and reaction volume. With regards to this, the oxygen molar concentration distribution diagram of the four tubular PEMFC structures at the cathode channel are plotted in Figure 5. As the reaction progresses, the oxygen molar concentration gradually decreases along the length of the channel. The cathode outlet is on the left side in the case of counter-flow, while in the co-flow pattern, the cathode outlet is on the right side.
Figure 5a–d show that in the SC and CC models, the oxygen consumption at the edge of the cathode channel is greater, the reaction is violent, and the oxygen consumption at the center of the channel is lower. However, in Figure 5e–h, the oxygen consumption in the SP and CP structures is lower, mainly because the channel flow rate in these two models is higher, and there is not enough time for oxygen to diffuse from the channel to the gas diffusion layer. In addition, in the counter-flow pattern, more oxygen is consumed than in the co-flow pattern for these four different models because the reaction is more uniform in the entire channel, and the SC model consumes the most oxygen, especially at the corner of the channel.

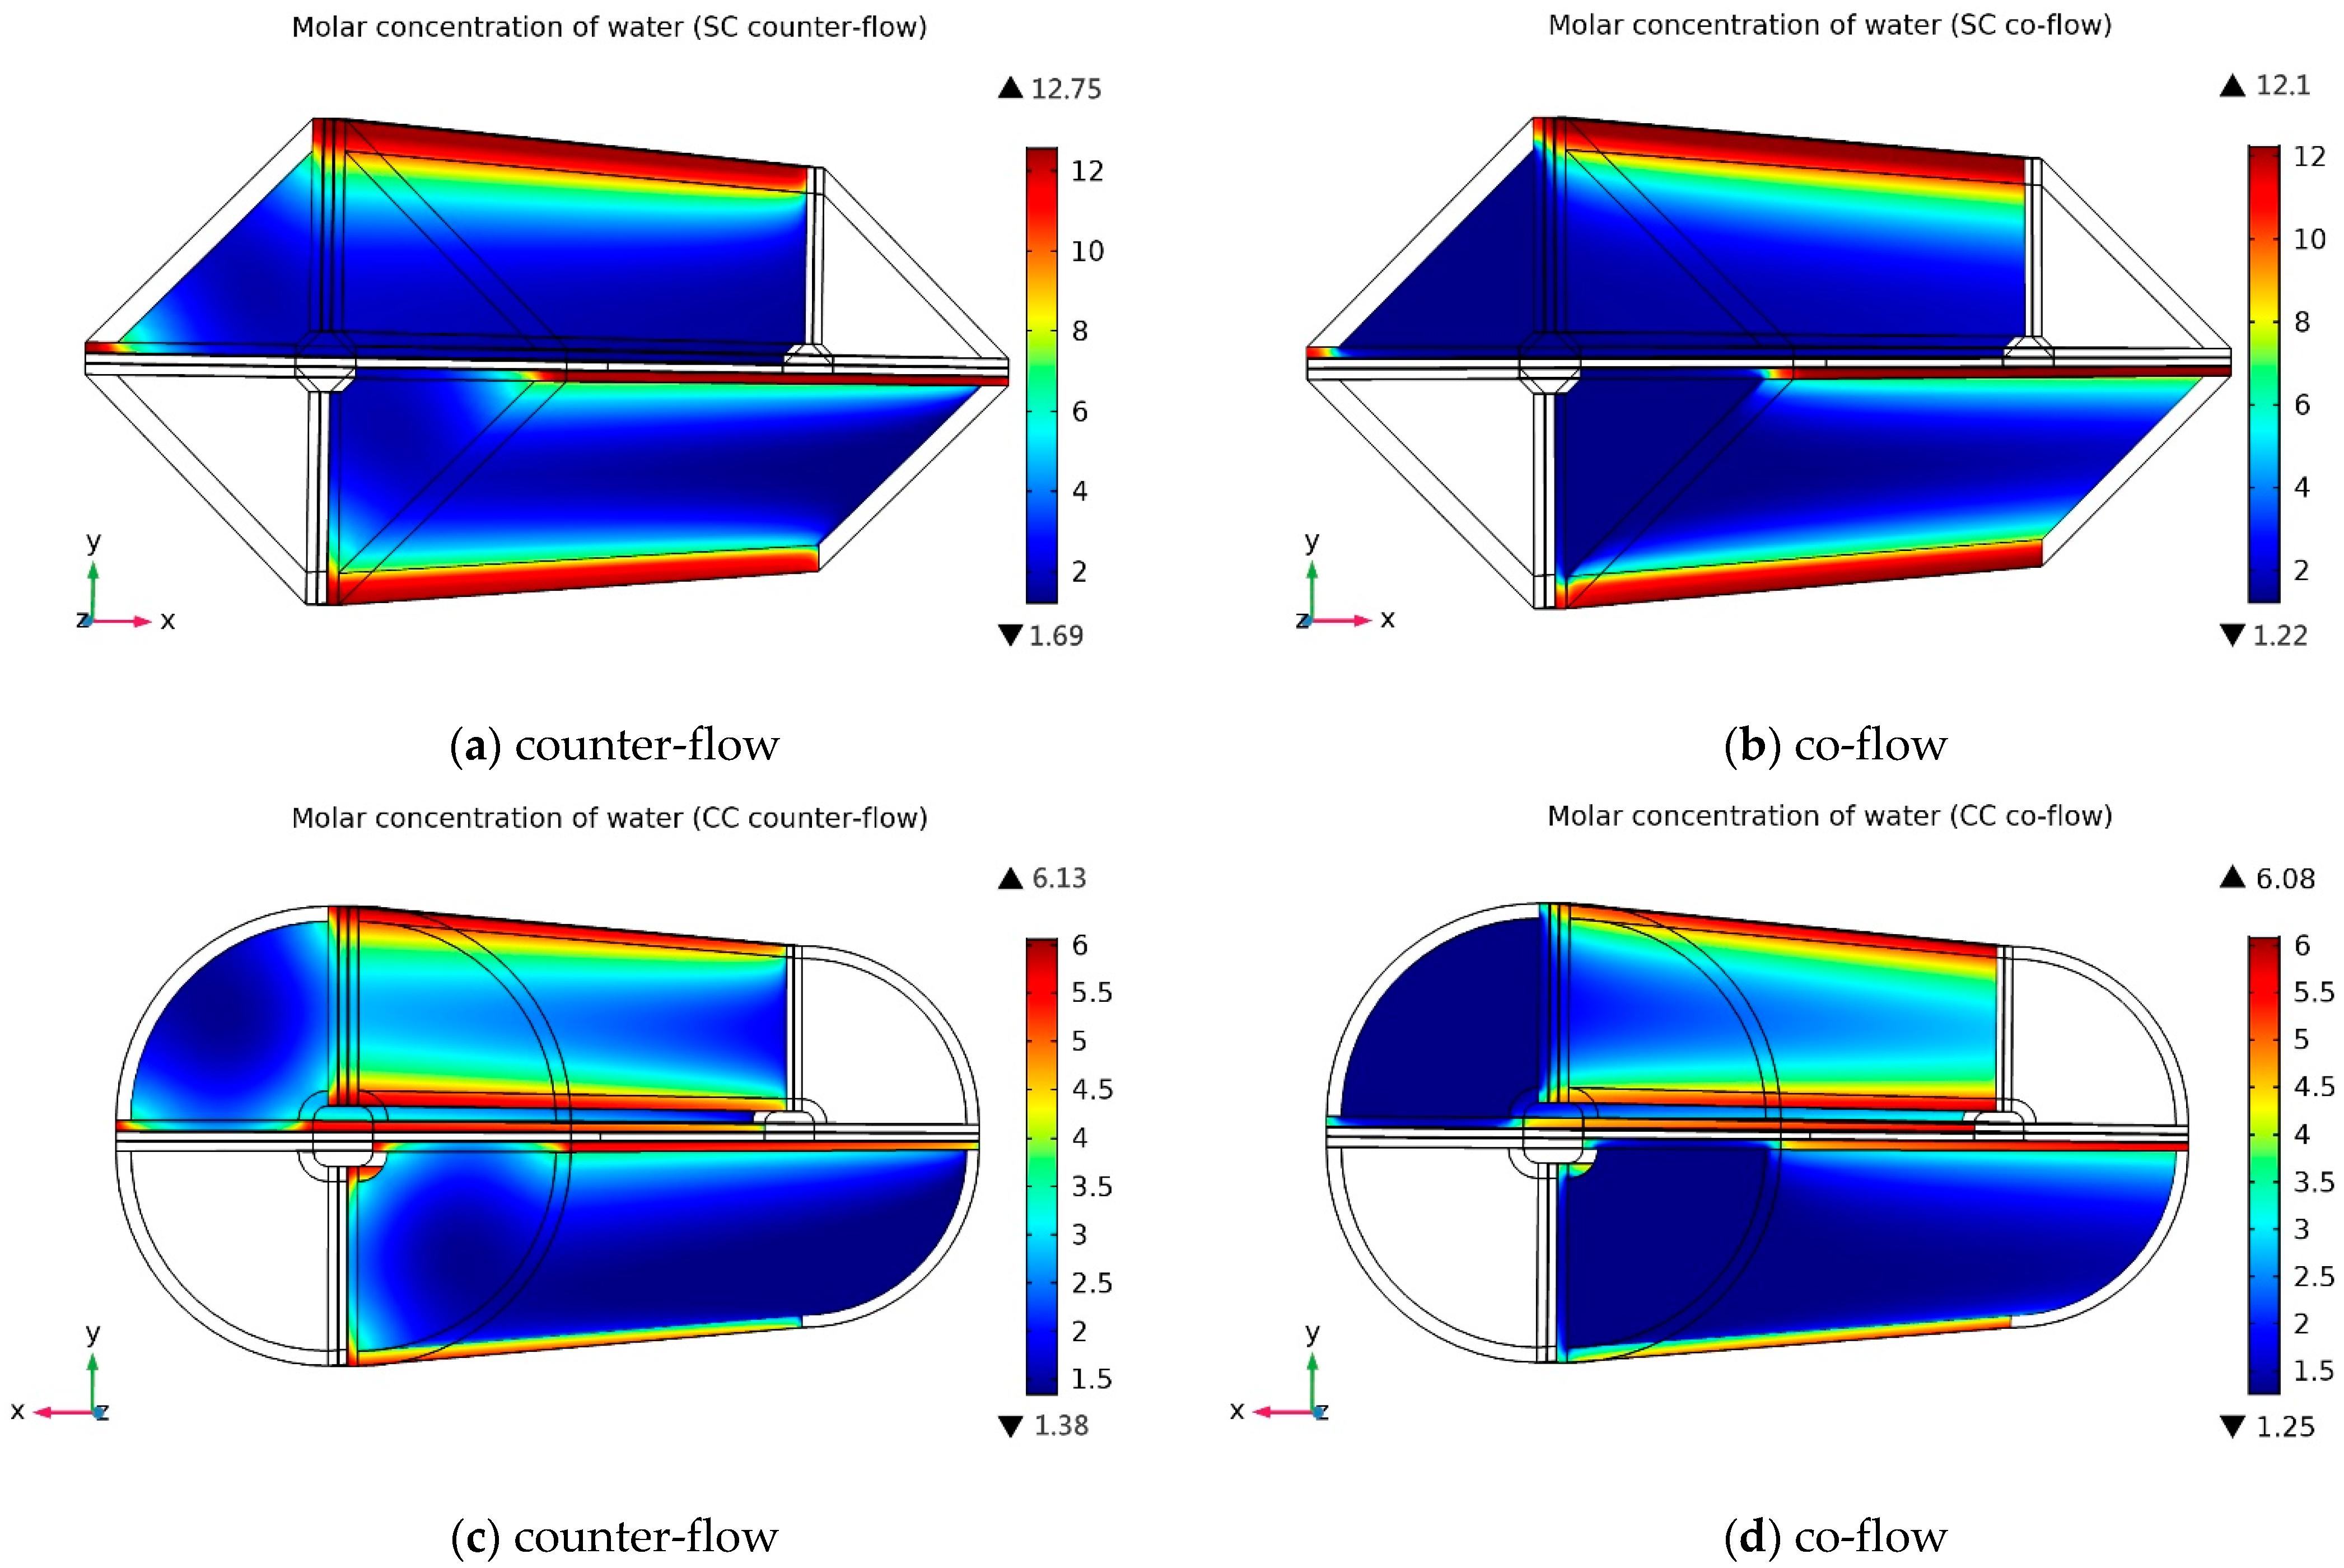
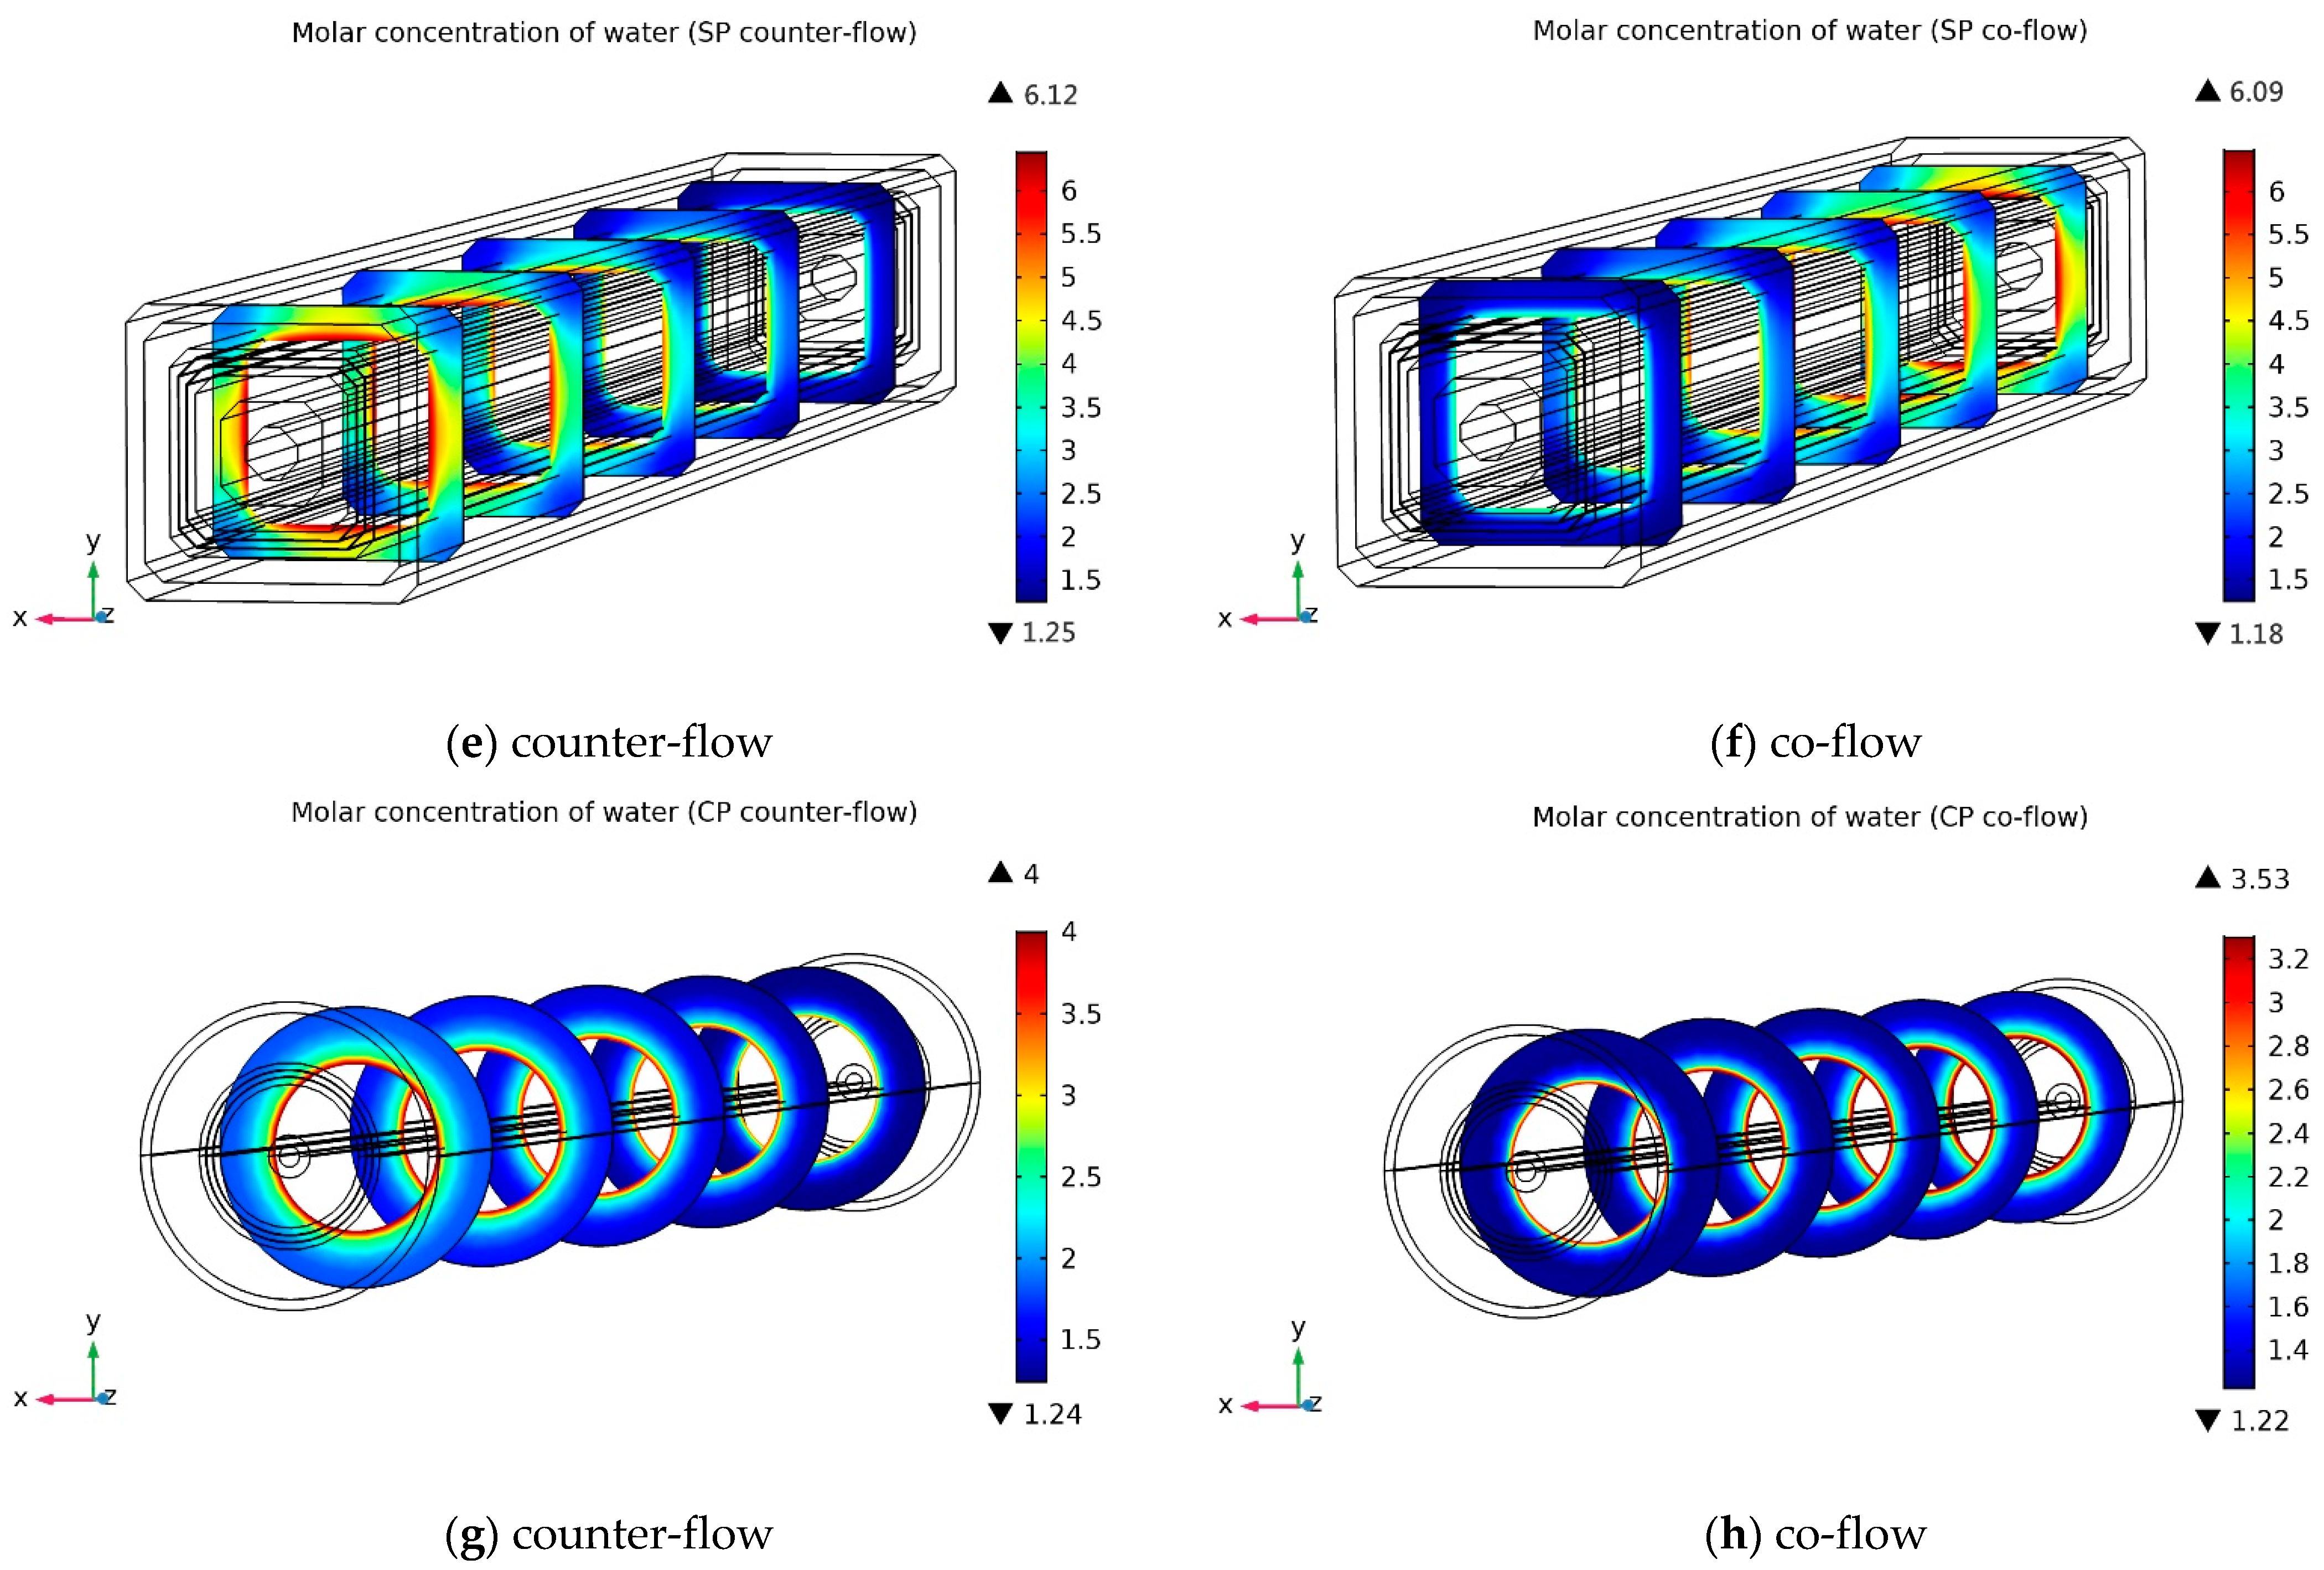
3.2.2. Cathode Water Molar Concentration Distribution
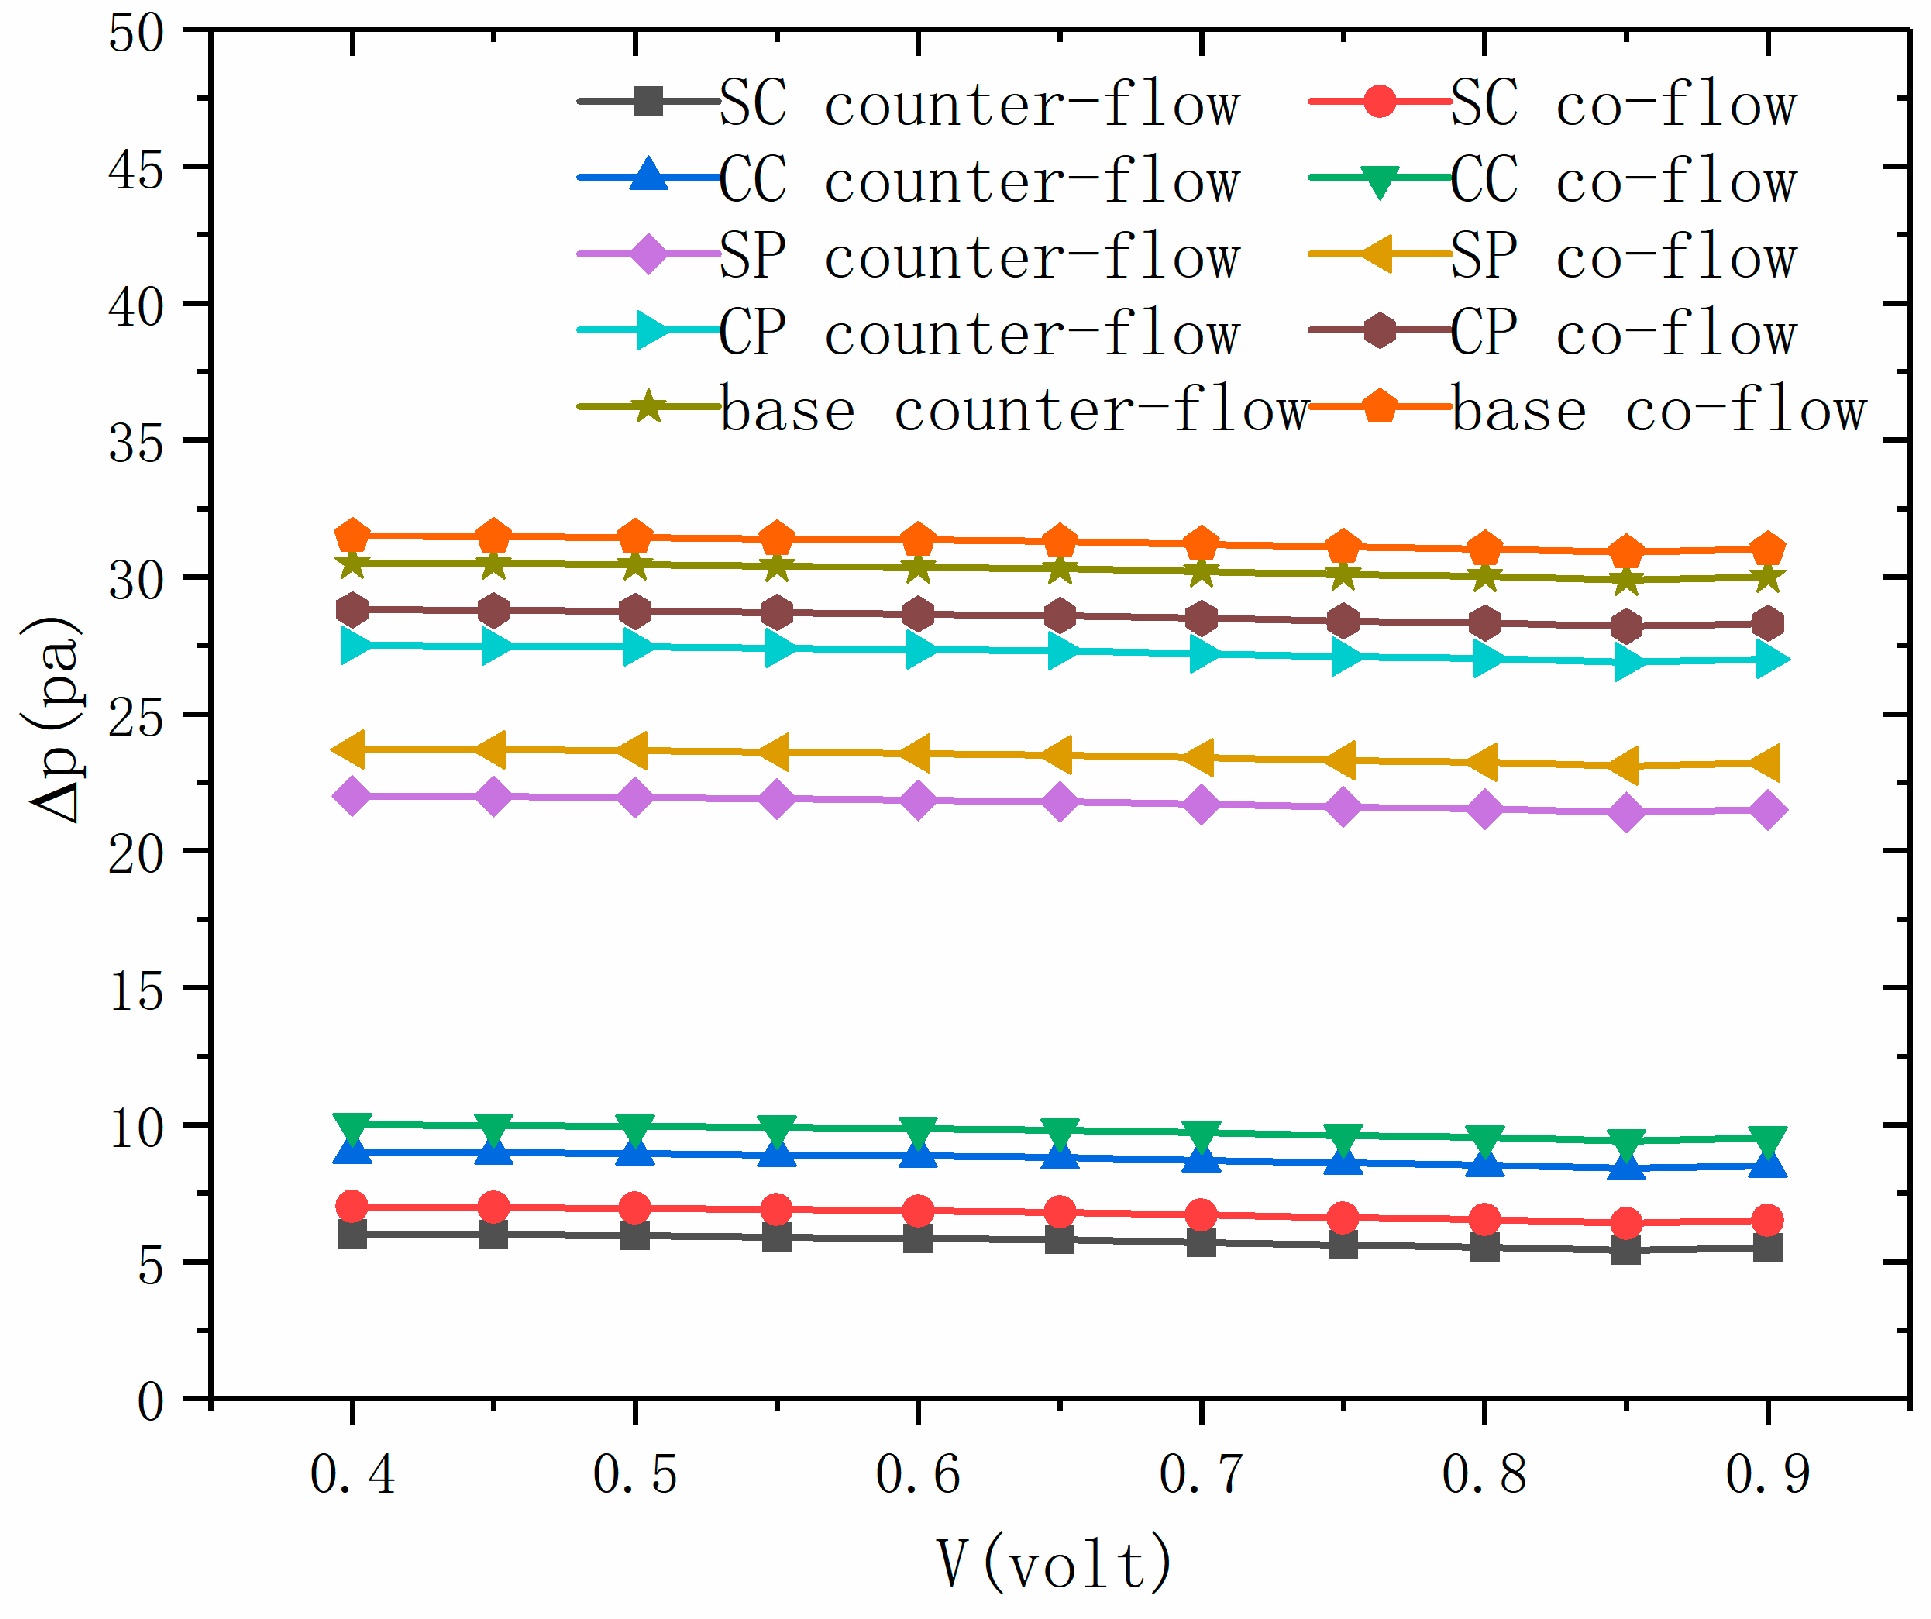
In PEMFCs, the strength of the reaction can be seen from the amount of water produced on the cathode side. Figure 6 shows the distribution of water’s molar concentration on the cathode side of four differently structured layers (SC, SP, CC, CP) in a tubular geometry under a voltage of V = 0.4 (v). The cathode outlet is on the left side in the case of counter-flow, while in co-flow pattern, the cathode outlet is on the right side.
The increase in water molar concentration along the length of the channel is due to the reaction and production of water at the cathode and the electro-osmotic effect, resulting in the transfer of electric water from the anode to the cathode. Furthermore, the counter-flow pattern produces a greater amount of water than the co-flow pattern for these four different models because the counter-flow pattern consumes larger number of species. Comparing Figure 6a–h, the lowest water production takes place in the CP tubular model.

3.3. Pressure Drop

The pressure drop is defined as ∆p = pinpout, where pin is the average pressure on the inlet surface and input, and pout is the average pressure on the outlet surface. Figure 7 displays the comparison of pressure drop under the four tubular structures. According to the curve changes in the figure, it is obvious that the pressure drop of the four tubular PEMFC structures does not change significantly under different voltages. As can be seen in Figure 7, the counter-flow pattern demonstrates less pressure drop than the co-flow pattern in all models. The reason for the small pressure drop in the counter-flow is that the concentration difference of the reactants in the channel is not as large as the co-flow.

3.4. Cell Net Power

The extra pump power caused by the pressure drop will directly affect the performance indicators of the PEMFC and the fuel cell net power output. Thus, the cell net power for the tubular shaped PEMFC is presented as follows:
P F C = I × V × A E L
P C = Δ p × A c h × u i n
P n e t = P F C P C
where PFC is the PEMFC power, PC is the extra pumping power, Pnet is the PEMFC net power, AEL is the electrode area, Ach is the inlet area of flow channel, and uin is the inlet velocity.
As the internal reaction of the fuel cell progresses, a pressure drop will occur in the reaction channel. In order to ensure that the reaction continues normally, additional power is needed to pump the reaction gas. This part of the additional power can be solved by Equation (23). Figure 8 shows the wattage variation of the net power generated by four different square and round tubular designs at different voltages. For the four tubular PEMFC structures, the net power of the PEMFC will be increased by reducing the voltage. Since the SC model has the lowest pressure drop and the highest current density, the SC structure has the highest net power output.

4. Conclusions

In the current research, the performance of four different square and circular tubular PEMFC structures with co-flow and counter-flow patterns, namely square chordal (SC), square peripheral (SP), circular chordal (CC), circular peripheral (CP), were researched using COMSOL Multiphysics. The main conclusions of the research are as follows:
From the current density and power density curves drawn by the four tubular models, it can be seen that the SC model with counter-flow pattern can provide higher power and exhibit better performance than the other models. Furthermore, the performance of the four tubular structures’ PEMFC is better than that of the basic model.
Comparison of the oxygen concentration distribution along the channel shows that the use of the counter-current mode increases the permeability of the substance, so a more uniform reaction occurs inside the fuel cell. The SC model consumed the most oxygen and produced the highest amount of water.
As for the pressure drop graph, the pressure drop in the counter-flow pattern is lower than that in the co-flow pattern, and the SC structure has the lowest pressure drop. Moreover, it is obvious that the pressure drop of the four tubular PEMFC structures does not change significantly under different voltages.
From the PEMFC net power curve, the net power of tubular PEMFC structures can be increased by reducing the voltage. Since the SC model has the lowest pressure drop and the highest current density, the SC structure with a counter-flow pattern has the highest net power output compared with the other three structures.

Author Contributions

Conceptualisation, methodology, software validation, formal analysis, and original draft preparation were done by L.Y.; supervision and editing were carried out by Z.J., P.Y., Y.Y. and D.W., X.C. All authors have read and agreed to the published version of the manuscript.

Funding

The project is supported by the National Natural Science Foundation of China (Grant No. 21676257).

Institutional Review Board Statement

Not applicable.

Informed Consent Statement

Not applicable.

Data Availability Statement

Not applicable.

Acknowledgments

The authors gratefully acknowledge the financial support for this project from the National Natural Science Foundation of China (Grant No. 21676257).

Conflicts of Interest

The authors declare no conflict of interest.

Nomenclature

Aan:caarea cross section channel for anode and cathode (m2)
Amemactive cell area (m2)
awater activity (-)
Dmass diffusion coefficient (m2/s)
FFaraday’s constant (C/mol)
KPermeability (m2)
kthermal conductivity (W/m·K)
Mmolecular weight (g/mol)
PPressure (Pa)
Runiversal gas constant (J/mol·K)
TTemperature (K)
VOCopen circuit voltage (V)
Xmole fraction (-)
Subscripts and Superscripts
anAnode (-)
caCathode (-)
effEffective (-)
memMembrane (-)
mMass (-)
iindividual specie in the reference condition (-)
refreference value (-)
Greek Symbols
αwater transfer coefficient (-)
εPorosity (-)
ρDensity (kg/m3)
γconcentration coefficient (-)
μViscosity (kg/m·s)
σmembrane conductivity
λwater content (-)
ξstoichiometric ratio (-)

References

  1. Nguyen, T.-T.; Fushinobu, K. Effect of operating conditions and geometric structure on the gas crossover in PEM fuel cell. Sustain. Energy Technol. Assess. 2020, 37, 100584. [Google Scholar] [CrossRef]
  2. Baroutaji, A.; Wilberforce, T.; Ramadan, M.; Olabi, A.G. Comprehensive investigation on hydrogen and fuel cell technology in the aviation and aerospace sectors. Renew. Sustain. Energy Rev. 2019, 106, 31–40. [Google Scholar] [CrossRef] [Green Version]
  3. Laribi, S.; Mammar, K.; Sahli, Y.; Koussa, K. Analysis and diagnosis of PEM fuel cell failure modes (flooding & drying) across the physical parameters of electrochemical impedance model: Using neural networks method. Sustain. Energy Technol. Assess. 2019, 34, 35–42. [Google Scholar]
  4. Ijaodola, O.S.; Hassan, Z.E.; Ogungbemi, E.; Khatib, F.N.; Wilberforce, T.; Thompson, J.; Olabi, A.G. Energy efficiency improvements by investigating the water flooding management on proton exchange membrane fuel cell (PEMFC). Energy 2019, 179, 246–267. [Google Scholar] [CrossRef]
  5. Sayed, E.T.; Eisa, T.; Mohamed, H.O.; Abdelkareem, M.A.; Allagui, A.; Alawadhi, H.; Chae, K.-J. Direct urea fuel cells: Challenges and opportunities. J. Power Sources 2019, 417, 159–175. [Google Scholar] [CrossRef]
  6. Ogungbemi, E.; Ijaodola, O.; Khatib, F.N.; Wilberforce, T.; el Hassan, Z.; Thompson, J.; Ramadan, M.; Olabi, A.G. Fuel cell membranes-Pros and cons. Energy 2019, 172, 155–172. [Google Scholar] [CrossRef] [Green Version]
  7. Priya, K.; Babu, T.S.; Balasubramanian, K.; Kumar, K.S.; Rajasekar, N. A novel approach for fuel cell parameter estimation using simple Genetic Algorithm. Sustain. Energy Technol. Assess. 2015, 12, 46–52. [Google Scholar] [CrossRef]
  8. Abdelkareem, M.A.; Al Haj, Y.; Alajami, M.; Alawadhi, H.; Barakat, N.A.M. Ni-Cd carbon nanofibers as an effective catalyst for urea fuel cell. J. Environ. Chem. Eng. 2018, 6, 332–337. [Google Scholar] [CrossRef]
  9. Olabi, A.G.; Mahmoud, M.; Soudan, B.; Wilberforce, T.; Ramadan, M. Geothermal based hybrid energy systems, toward eco-friendly energy approaches. Renewable Energy 2020, 147 Pt 1, 2003–2012. [Google Scholar] [CrossRef]
  10. Subin, K.; Jithesh, P.K. Experimental study on self-humidified operation in PEM fuel cells. Sustain. Energy Technol. Assess. 2018, 27, 17–22. [Google Scholar] [CrossRef]
  11. Verma, A.; Pitchumani, R. Influence of transient operating parameters on the mechanical behavior of fuel cells. Int. J. Hydrogen Energy 2015, 40, 8442–8453. [Google Scholar] [CrossRef]
  12. Jeon, Y.; Na, H.; Hwang, H.; Park, J.; Hwang, H.; Shul, Y. Accelerated life-time test protocols for polymer electrolyte membrane fuel cells operated at high temperature. Int. J. Hydrogen Energy 2015, 40, 3057–3067. [Google Scholar] [CrossRef]
  13. Kim, Y.S.; Kim, S.I.; Lee, N.W.; Kim, M.S. Study on a purge method using pressure reduction for effective water removal in polymer electrolyte membrane fuel cells. Int. J. Hydrogen Energy 2015, 40, 9473–9484. [Google Scholar] [CrossRef]
  14. Shao, Y.; Yin, G.; Gao, Y. Understanding and approaches for the durability issues of Pt-based catalysts for PEM fuel cell. J. Power Sources 2007, 171, 558–566. [Google Scholar] [CrossRef]
  15. Goltsov, V.A.; Veziroglu, T.N. From hydrogen economy to hydrogen civilization. Int. J. Hydrogen Energy 2001, 26, 909–915. [Google Scholar] [CrossRef]
  16. Sherif, S.A.; Barbir, F.; Veziroglu, T.N. Wind energy and the hydrogen economy-review of the technology. Sol. Energy 2005, 78, 647–660. [Google Scholar] [CrossRef]
  17. Wei, Z.; Su, K.; Sui, S.; He, A.; Du, S. High performance polymer electrolyte membrane fuel cells (PEMFCs) with gradient Pt nanowire cathodes prepared by decal transfer method. Int. J. Hydrogen Energy 2015, 40, 3068–3074. [Google Scholar] [CrossRef]
  18. Mert, S.O.; Ozcelik, Z.; Dincer, I. Comparative assessment and optimization of fuel cells. Int. J. Hydrogen Energy 2015, 40, 7835–7845. [Google Scholar] [CrossRef]
  19. Yuan, W.; Tang, Y.; Pan, M.; Li, Z.; Tang, B. Model prediction of effects of operating parameters on proton exchange membrane fuel cell performance. Renew. Energy 2010, 35, 656–666. [Google Scholar] [CrossRef]
  20. Larbi, B.; Alimi, W.; Chouikh, R.; Guizani, A. Effect of porosity and pressure on the PEM fuel cell performance. Int. J. Hydrogen Energy 2013, 38, 8542–8549. [Google Scholar] [CrossRef]
  21. Jeon, D.H.; Kim, K.N.; Baek, S.M.; Nam, J.H. The effect of relative humidity of the cathode on the performance and the uniformity of PEM fuel cell. Int. J. Hydrogen Energy 2011, 36, 12499–12511. [Google Scholar] [CrossRef]
  22. Ismail, M.S.; Hughes, K.J.; Ingham, D.B. Effects of anisotropic permeability and electrical conductivity of gas diffusion layers on the performance of proton exchange membrane fuel cells. Appl. Energy 2012, 95, 50–63. [Google Scholar] [CrossRef]
  23. Ahmed, A.; Mangi, F.H.; Kashif, M.; Chachar, F.A.; Ullah, Z. Parametric Analysis of a Serpentine Flow Pattern Proton Exchange Membrane Fuel Cell for Optimized Performance. Int. J. Heat Technol. 2020, 38, 69–76. [Google Scholar] [CrossRef]
  24. Khazaee, I.; Ghazikhani, M. Performance improvement of proton exchange membrane fuel cell by using annular shaped geometry. J. Power Sources 2011, 196, 2661–2668. [Google Scholar] [CrossRef]
  25. Perng, S.W.; Wu, H.W. A three-dimensional numerical investigation of trapezoid baffles effect on non-isothermal reactant transport and cell net power in a PEMFC. Appl. Energy 2015, 143, 81–95. [Google Scholar] [CrossRef]
  26. Fontana, É.; Mancusi, E.; Da Silva, A.; Mariani, V.C.; De Souza, A.A.U.; de Souza, S.M.G.U. Study of the effects of flow channel with non-uniform cross-sectional area on PEMFC species and heat transfer. Int. J. Heat Mass Transf. 2011, 54, 4462–4472. [Google Scholar] [CrossRef]
  27. Chowdhury, M.Z.; Genc, O.; Toros, S. Numerical optimization of channel to land width ratio for PEM fuel cell. Int. J. Hydrogen Energy 2018, 43, 10798–10809. [Google Scholar] [CrossRef]
  28. Khazaee, I.; Sabadbafan, H. Numerical study of changing the geometry of the flow field of a PEM fuel cell. Heat Mass Transf. 2016, 52, 993–1003. [Google Scholar] [CrossRef]
  29. Al-Baghdadi, M.A. Studying the effect of material parameters on cell performance of tubular-shaped PEM fuel cell. Energy Convers Manag. 2008, 49, 2986–2996. [Google Scholar] [CrossRef]
  30. Torkavannejad, A.; Sadeghifar, H.; Pourmahmoud, N.; Ramin, F. Novel architectures of polymer electrolyte membrane fuel cells: Efficiency enhancement and cost reduction. Int. J. Hydrogen Energy 2015, 40, 12466–12477. [Google Scholar] [CrossRef]
  31. Sierra, J.M.; Figueroa-Ramírez, S.J.; Díaz, S.E.; Vargas, J.; Sebastian, P.J. Numerical evaluation of a PEM fuel cell with conventional flow fields adapted to tubular plates. Int. J. Hydrogen Energy 2014, 39, 16694–16705. [Google Scholar] [CrossRef]
  32. Osanloo, B.; Mohammadi-Ahmar, A.; Solati, A. A numerical analysis on the effect of different architectures of membrane, CL and GDL layers on the power and reactant transportation in the square tubular PEMFC. Int. J. Hydrogen Energy 2016, 41, 10844–10853. [Google Scholar] [CrossRef]
  33. Mohammadi-Ahmar, A.; Osanloo, B.; Solati, A.; Ghasemi, J. Performance improvement of the circular tubular PEMFC by using different architectures and number of layers. Energy Convers Manag. 2016, 128, 238–249. [Google Scholar] [CrossRef]
  34. Mohammadi-Ahmar, A.; Solati, A.; Osanloo, B.; Hatami, M. Effect of number and arrangement of separator electrode assembly(SEA) on the performance of square tubular PEM fuel cells. Energy 2017, 137, 302–313. [Google Scholar] [CrossRef]
  35. Wang, L.; Husar, A.; Zhou, T.; Liu, H. A parametric study of PEM fuel cell performances. Int. J. Hydrogen Energy 2003, 28, 1263–1272. [Google Scholar] [CrossRef]
  36. Barbir, F. PEM Fuel Cells: Theory and Practice, 2nd ed.; Elsevier Academic Press: Amsterdam, The Netherlands, 2013. [Google Scholar]
  37. Zawodzinski, T.A., Jr.; Springer, T.E.; Davey, J.; Jestel, R.; Lopez, C.; Valerio, J.; Gottesfeld, S. A Comparative Study of Water Uptake By and Transport Through Ionomeric Fuel Cell Membranes. J. Electrochem. Soc. 1993, 140, 1981–1985. [Google Scholar] [CrossRef]
  38. U.S. Department of Energy. Transportation Fuel Cell Power Systems. 2000 Annual Progress Report; U.S. Department of Energy: Washington, DC, USA, 2000.
  39. COMSOL (COMSOL Multiphysics). Multiphysics 5.5 Documentation; COMSOL Inc.: Burlington, MA, USA, 2019. [Google Scholar]
  40. Um, S.; Wang, C.Y.; Chen, K.S. Computational fluid dynamics modeling of proton exchange membrane fuel cells. J. Electrochem. Soc. 2000, 147, 4485–4493. [Google Scholar] [CrossRef]
  41. Springer, T.E.; Zawodzinski, T.A.; Gottesfeld, S. Polymer electrolyte fuel cell model. J. Electrochem. Soc. 1991, 138, 2334–2342. [Google Scholar] [CrossRef]
  42. Yi, J.S.; Van Nguyen, T. Multicomponent transport in porous electrodes of proton exchange membrane fuel cells using the interdigitated gas distributors. J. Electrochem. Soc. 1999, 146, 38–45. [Google Scholar] [CrossRef]
  43. Nam, J.H.; Kaviany, M. Effective diffusivity and water-saturation distribution in single- and two-layer PEMFC diffusion medium. Int. J. Heat Mass Transf. 2003, 46, 4595–4611. [Google Scholar] [CrossRef]
  44. Chippar, P.; Kyeongmin, O.; Kang, K.; Ju, H. A numerical investigation of the effects of GDL compression and intrusion in polymer electrolyte fuel cells (PEFCs). Int. J. Hydrogen Energy 2012, 37, 6326–6338. [Google Scholar] [CrossRef]
Figure 1. Base model and flow patterns.
Energies 14 02127 g001
Figure 2. (ah) Computational region.
Energies 14 02127 g002aEnergies 14 02127 g002b
Figure 3. Comparison of simulation results and experimental results.
Energies 14 02127 g003
Figure 4. The results of four tubular structures with different flow patterns.
Energies 14 02127 g004
Figure 5. Molar concentration distribution diagram of oxygen(mol/m3) at V = 0.4 (v).
Energies 14 02127 g005aEnergies 14 02127 g005b
Figure 6. Molar concentration distribution diagram of water(mol/m3) at V = 0.4 (v).
Energies 14 02127 g006aEnergies 14 02127 g006b
Figure 7. Comparison of pressure drop under the four tubular structures and base model.
Energies 14 02127 g007
Figure 8. Cell net power curve of the four models and base model at different voltages.
Energies 14 02127 g008
Table 1. Geometrical parameters.
ParameterSymbolUnitsPlanarSCSPCCCP
Channel lengthLmm10050505021.8
GDL thicknessδGDLmm0.260.260.260.260.26
CL thicknessδCLmm0.0280.0280.0280.0280.028
Membrane thicknessδMmm0.1830.1830.1830.1830.183
GDL porosityεGDL-0.40.40.40.40.4
CL porosityεCL-0.40.40.40.40.4
Table 2. Operating conditions and electrochemical parameters.
ParameterSymbolValueUnits
Anode pressurepa3atm
Cathode pressurepc3atm
Faraday constantF96,485C/mol
Inlet fuel and air temperatureTin353K
Electrode electronic conductivityλe100S/m
Membrane ionic conductivity (humidified Nafion117)λm8.3S/m
Relative humidity of inlet fuel and air (fully humidified conditions)Rh100%-
Fuel/air stoichiometric ratioξac2/2-
Electrode thermal conductivityke1.3W/m·K
Membrane thermal conductivitykm0.455W/m·K
Transfer coefficient, anode sideαa0.5-
Transfer coefficient, cathode sideαc1-
H2 diffusivityDH2-H2O1.1 × 10−4m2/s
O2 diffusivityDO2-N23.23 × 10−5m2/s
H2O diffusivity at anodeDH2O-O27.35 × 10−5m2/s
H2O diffusivity at cathodeDH2O-N27.35 × 10−5m2/s
Membrane equivalent weigh-1100g/mol
Publisher’s Note: MDPI stays neutral with regard to jurisdictional claims in published maps and institutional affiliations.

