Article

Demographic, Social, Economic, and Regional Factors Affecting the Diffusion of Hybrid Electric Vehicles in Japan

1
Faculty of Economics, Toyo University, Tokyo 112-8606, Japan
2
Research Institute for Global Change, Japan Agency for Marine-Earth Science and Technology, Yokohama 236-0001, Japan
3
Faculty of Environmental Science, Nagasaki University, Nagasaki 852-8521, Japan
4
Center for Spatial Information Science, The University of Tokyo, Kashiwa 277-8568, Japan
5
Toyota Transportation Research Institute, Toyota 471-0024, Japan
*
Author to whom correspondence should be addressed.
Energies 2021, 14(8), 2130; https://doi.org/10.3390/en14082130
Submission received: 17 March 2021 / Revised: 7 April 2021 / Accepted: 8 April 2021 / Published: 11 April 2021
(This article belongs to the Special Issue Economic Analysis on Energy and Environmental Issues and Policy)

Abstract

:
The transportation sector is a major contributor to carbon dioxide emissions, and the resulting climate change. The diffusion of alternative fuel vehicles, including hybrid electric vehicles (HEV), is an important solution for these issues. This study aimed to evaluate the factors affecting the ownership ratio of HEVs, particularly passenger vehicles, and the regional differences in the purchase of HEVs in Japan. This study performed a fixed-effects regression analysis with panel data for 47 prefectures during the period 2005–2015 to evaluate the factors affecting the HEV ownership ratio and conducted three cluster analyses to investigate the regional differences in diffusion in terms of price categories, body types, and drive systems of HEVs. Some demographic and social factors were found to affect the ownership ratio in Japan, whereas economic factors, including prefecture-level subsidies for purchasing HEVs, were not. Regarding regional differences, prefectures in urban areas with higher income levels tend to purchase more expensive and large-sized HEVs. These results suggest that a strategy to sell the right vehicle to the right person and region is essential for further promoting HEVs in Japan.

1. Introduction

Increasing carbon dioxide (CO2) emissions and climate change have become global challenges. Transportation is a major contributor worldwide to energy-related greenhouse gas (GHG) emissions, accounting for 24% of global CO2 emissions [1]. In this context, various technologies for low-carbon transportation have been developed [2]. The spread of energy-sustainable transportation, such as alternative fuel vehicles (AFV), is one possible innovation to address this issue [3,4,5]. The most common types of AFVs today are different types of electric vehicles (EV), including hybrid electric vehicles (HEV), plug-in hybrid electric vehicles (PHEV), and battery electric vehicles (BEV), which use less fossil fuels than conventional gas or diesel vehicles.
Although registrations for EVs are increasing, a greater market share is essential for the decarbonization of society. A growing body of literature has investigated the adaptation factors in the market for EVs and classified some of the major obstacles to the widespread adoption of EVs into vehicle attributes, consumer characteristics, and external factors [5,6].
Vehicle attributes related to vehicle performance, battery cost, driving range, and charging time are the main factors affecting EV adoption [3,7,8,9]. Because of the limited driving range and charging time of BEVs, several studies have reported higher preferences for HEVs and PHEVs [10,11]. Consumers also have various preferences for the design characteristics of vehicles (e.g., body type and size class), and designing vehicles to meet the demands for different preferences affects the market share of EVs [7,12]. There is also a study on obsolete EV management practices regarding recycling issues [13].
Factors related to consumer characteristics are likewise important for adopting EVs. The common consumer characteristics include gender, age, income, education, car ownership, household structure, and environmentalism. The findings from previous studies on the impact of these characteristics have shown mixed results. Several studies have presented the positive effects of income and education level [14,15], whereas others have shown that these factors do not significantly affect EV purchases [5,16]. External factors, including fuel prices, incentive policies, and infrastructure, can also be important factors. Many countries have used financial incentives, such as subsidies and emission-based vehicle taxes, to encourage EV adoption [5]. Many studies have investigated the effects of policy incentives [17,18,19] and showed that, for example, subsidies for EV purchase and charger installation have positive effects on promoting EV purchase, with the effects of charger installation being more significant [19]. By contrast, some studies have indicated that the effects of subsidies are limited [17,20].
Using regression and cluster analysis, the present study investigated the factors affecting the ownership ratio of HEVs and the regional differences in consumers’ preferences for the purchase of HEVs. This study makes two primary contributions to the existing literature. First, a revealed preference approach was applied based on actual car registrations or HEV ownership. Previous studies on EV adoption have mostly used stated preference surveys to investigate the factors influencing EV adoption because of the low ownership ratio of BEVs. HEVs share similar features with BEVs, such as battery- and electric motor-based powertrains and lower environmental impacts. Although BEVs use a different charging method, technologically advanced batteries and the spread of charging stations can compensate for their battery-related disadvantages. The analysis included non-plug-in HEVs only. Second, this study also investigated regional differences in consumers’ preferences for vehicle attributes. Previous studies have shown regional differences in the adoption of EVs [21,22]. Regional differences in vehicles’ attributes may exist because of different weather and topologies.
Section 2 describes the materials and methods. Section 3 explains and discusses the results of affecting factors and regional differences in HEV adoption. Finally, Section 4 concludes this study and describes the implications and avenues for future research.

2. Materials and Methods

In this study, a fixed-effects regression model with the panel data for 47 prefectures in the period 2005–2015 was used to evaluate the factors affecting the ownership ratio of HEVs (passenger vehicles). A cluster analysis was then conducted to evaluate regional differences in the purchase of HEVs. R software (version 4.0.0) and its package (plm) were used for these analyses.

2.1. Panel Data Regression Analysis

A fixed-effects regression model using the panel data of 47 prefectures for 11 years (from 2005 to 2015) was conducted to identify the factors affecting the ownership ratio of HEVs (Equation (1)). With this model, the factors (independent variables) affecting the ownership ratio of HEVs can be clarified by controlling for prefecture and year fixed effects.
h y b r i d _ r a t i o i t = X i t 1 + α i + δ t + ε i t + C ,
where hybrid_ratioit is the ownership ratio of HEVs (passenger vehicles) of prefecture i in year t, β is the vector of coefficients, Xit is the vector of independent variables (i.e., subsidy, income, saving, population_per_household, vehicle_number, vehicle_per_household, university, aging, and male; see Table 1 for the description of these variables), αi is the prefecture fixed effect, δt is the year fixed effect, εit is the error term, and C is a constant.
hybrid_ratio, the dependent variable, is calculated by “the number of HEVs/the number of passenger vehicles”. These data were obtained from the Automobile Inspection and Registration Information Association [23]. Figure 1 depicts the time trend of the ownership ratio of HEVs. As shown in the figure, in Japan, the ratio of HEVs to the number of passenger vehicles increased during the study period, with a concurrent increase in variance.
The following independent variables (X) were selected: subsidy for the dummy variable that takes a value of one if a subsidy for purchasing HEVs exists in the prefecture in that year and zero otherwise, income for annual income per capita, saving for savings per household, population_per_household for the population per household, vehicle_number for the number of passenger vehicles, vehicle_per_household for the number of passenger vehicles per household, university for the ratio of university entrance, aging for the population aging rate, and male for the ratio of the male population. The number of observations was 517 (47 prefectures × 11 years). The definitions and sources of the independent variables are shown in Table 1, and the descriptive statistics are indicated in Table 2.
In some prefectures (Fukui, Miyagi, and Iwate), subsidies for purchasing HEVs were implemented during the study period (used as subsidy in the regression analysis). These subsidies were introduced to promote the purchase of HEVs. The information was obtained by inquiring from each prefecture. As described below, the subsidy schemes were different by prefecture, so a dummy variable was applied to the subsidies.
In Fukui Prefecture, the “Fukui eco-friendly car promotion subsidy” was implemented during the period FY 2003–2006. With the subsidy provided by cities under the prefecture, citizens, and companies within the prefecture could receive subsidies of one-fourth of the price difference between HEVs and non-HEVs (the upper limit is JPY 60,000 (USD 1 ≈ JPY 110 and EUR 1 ≈ JPY 130)).
In Miyagi Prefecture, the “subsidy to promote the use of clean energy vehicles” was implemented in FY 2009. This scheme provided a subsidy of JPY 100,000 for purchasing one HEV.
Finally, in Iwate Prefecture, the “Iwate subsidy to promote eco-friendly vehicles” was implemented in FY 2009. This scheme provided a subsidy of JPY 100,000 for purchasing a new HEV and for scrapping cars that were 13 years old or above, or of JPY 60,000 for purchasing a new HEV without scrapping such cars.
The coefficients for subsidy will be positive if the prefecture-level subsidy promoted the purchase of HEVs. It should be noted that although subsidies and tax deductions for purchasing HEVs existed at the national level in Japan to promote the purchase of HEVs, they were not included as an independent variable of the regression analysis; this model could not estimate the coefficients for national-level subsidies and tax deductions because of the prefecture fixed effect.

2.2. Cluster Analysis

A cluster analysis was then conducted to clarify the regional characteristics (or regional differences) in the possession of HEVs by prefecture. Hierarchy clustering using Ward’s method was applied. The variables used for the cluster analysis were the percentages of price categories, body types, and drive systems of HEVs (as of March 2018). With this analysis, similar prefectures in terms of the selected variables (the percentage of each category of each variable) can be found.
Vehicle price categories were based on the base grade at the time the vehicles were first sold. The prices were classified into the following six categories: less than JPY 2 million, JPY 2–2.5 million, JPY 2.5–3 million, JPY 3–3.5 million, JPY 3.5–4 million, and JPY 4 million or higher. Body types were classified into five types: sport utility vehicle (SUV), compact, sedan, minivan, and wagon. The drive systems were classified into four types: front-wheel drive, front-wheel/four-wheel drive, four-wheel drive, and rear-wheel drive. These data were obtained from the Automobile Inspection and Registration Information Association [23].

3. Results and Discussion

This section describes the results of the fixed-effects regression analysis of factors affecting the possession of HEVs and the cluster analysis of regional differences.

3.1. Factors Affecting the Possession of HEVs

The results of the panel data regression analysis are shown in Table 3. Column 1 shows the estimation using the pooled ordinary least square (OLS); Column 2 shows the estimation with the fixed-effects model considering only the prefecture fixed effect; and Column 3 shows the estimation with the fixed-effects model considering both prefecture and year fixed effects. Column 3 presents the main results of this study. Table 4 shows the coefficients of the year fixed effect corresponding to column 3 of Table 3.
From the result, population_per_household was positive and statistically significant at the 1% level. This indicates that the ownership ratio of HEVs increased with an increase in the population per household. This may be because households with more members would prefer normal-sized passenger vehicles to Kei cars (light cars, which do not have HEV options), which increased the proportion of HEVs. vehicle_number was also positive and statistically significant at the 1% level, indicating that the ownership ratio of HEVs increased with an increase in the number of vehicles. This can be interpreted that consumers who purchased new vehicles chose HEVs at a greater rate than those who purchased new vehicles in the past. However, vehicle_per_household was negative and statistically significant at the 1% level. This may be because households with multiple cars tend to buy Kei cars, which are not HEVs, as their second cars [28]. As a result, the ownership ratio of HEVs decreased with an increase in the number of vehicles per household.
The other factors, aging (negative) and male (positive), were statistically significant at the 1 and 5% levels, respectively. These results indicate that younger people and males tended to accept HEVs, as they were receptive to accepting new technology [29]. Targeting the younger generation and males is therefore reasonable to promote the diffusion of HEVs.
By contrast, economic variables, including subsidy, income, and saving, were not statistically significant. Regarding prefecture-level subsidy, the prefectures that introduced the subsidy and the length of time it was given were limited; the amount of the subsidy was also too small to be competitive with non-HEVs, so these did not motivate people to purchase HEVs. In terms of per capita annual income and per-household savings, the reason for their insignificance is that consumers with high income and savings may prefer to purchase high-priced luxury vehicles rather than HEVs.
Finally, the coefficients of the year fixed effect (Table 4) were positive and statistically significant at the 1% level, and they increased over time. This indicates that the trend of the ownership ratio of HEVs (Figure 1) was captured by the year fixed effect. However, the above results were obtained even after such effects were controlled by including the year fixed effect in the model.

3.2. Regional Characteristics in the Possession of HEVs

The panel data regression analysis showed that population_per_household, vehicle_number, and male were positive and statistically significant, whereas vehicle_per_household and aging were negative and statistically significant for the ownership ratio of HEVs. Economic variables, including subsidy, were not statistically significant. However, the regression analysis included only the factors influencing the diffusion of HEVs, in general, in Japan. To identify regional differences in the diffusion of HEVs, a cluster analysis was conducted for three selected variables.

3.2.1. Cluster Analysis of Vehicle Price Categories

Figure 2 shows the results of the cluster analysis for the percentage of vehicle price categories, and Figure 3 shows the weighted average of the percentage in each category by the identified cluster. Based on the cluster analysis, the prefectures were classified into three clusters: P-I, P-II, and P-III. Cluster P-I mainly included prefectures in urban areas with relatively high income levels, such as Tokyo (capital city and the most populated area), Kanagawa (the second most populated prefecture), Osaka (the third most populated prefecture), and Aichi (the fourth most populated prefecture). As shown in Figure 3, the proportion of HEVs in the cheapest category was lower in this cluster than in the other clusters, whereas the cluster held more expensive vehicles than in the others. For example, the proportion of HEVs over JPY 4 million was more than two percentage points higher in Cluster P-I (7.9%) than in the others (5.3–5.6%). In particular, the proportion of HEVs in the most expensive categories for Tokyo (13.5%; Tokyo belonged to Cluster P-I but was further away from the other prefectures in the cluster) was about 2.5 times the averages of Clusters P-II and P-III and twice the average of Cluster P-I. This means that prefectures with higher incomes tended to possess more expensive HEVs.
Clusters P-II and P-III were relatively similar in that the proportion of cheaper vehicles was equally high in both clusters compared with Cluster P-I. The prefectures in Cluster P-III had more HEVs in the second cheapest category than those in Cluster P-II.

3.2.2. Cluster Analysis of Body Types

Figure 4 shows the results of the cluster analysis for the percentage of vehicles’ body types, and Figure 5 depicts the weighted average of the percentage in each category by the identified cluster. Based on this cluster analysis, the prefectures were classified into three clusters: T-I, T-II, and T-III. The proportions of SUV- and wagon-type vehicles were similar for all three clusters; major differences were observed in the other body types of vehicles. For Clusters T-I and T-III, the percentages of the compact type were higher, whereas its percentages of the minivan type were lower than those for Cluster T-II. Comparing Clusters T-I and T-III, a large difference in sedan type, which occupies the highest percentage in every cluster, was observed; the proportion was higher for Cluster T-III than for Cluster T-I.
As for Cluster T-II, as mentioned above, the percentage of the minivan type is higher, whereas that of the compact type is lower than that of the other clusters. This cluster includes prefectures in urban areas with relatively high income levels similar to Cluster P-I in Section 3.2.1. Therefore, large vehicles, which are usually more expensive, are more popular in these areas.
From the analyses in Section 3.2.1 and in this section, prefectures in urban areas tended to possess expensive and large-sized vehicles, probably because of their high income levels. In other prefectures, cheaper and smaller vehicles are preferred. One reason is that the income levels in these prefectures are relatively lower than those in urban areas. In addition, public transportation is less developed in such regions, so households tend to have two or more vehicles, and they possess cheaper and smaller vehicles for their second car [28]. Therefore, a strategy to sell cheaper and smaller HEVs will help promote the diffusion of HEVs in less urban areas.

3.2.3. Cluster Analysis for Drive Systems

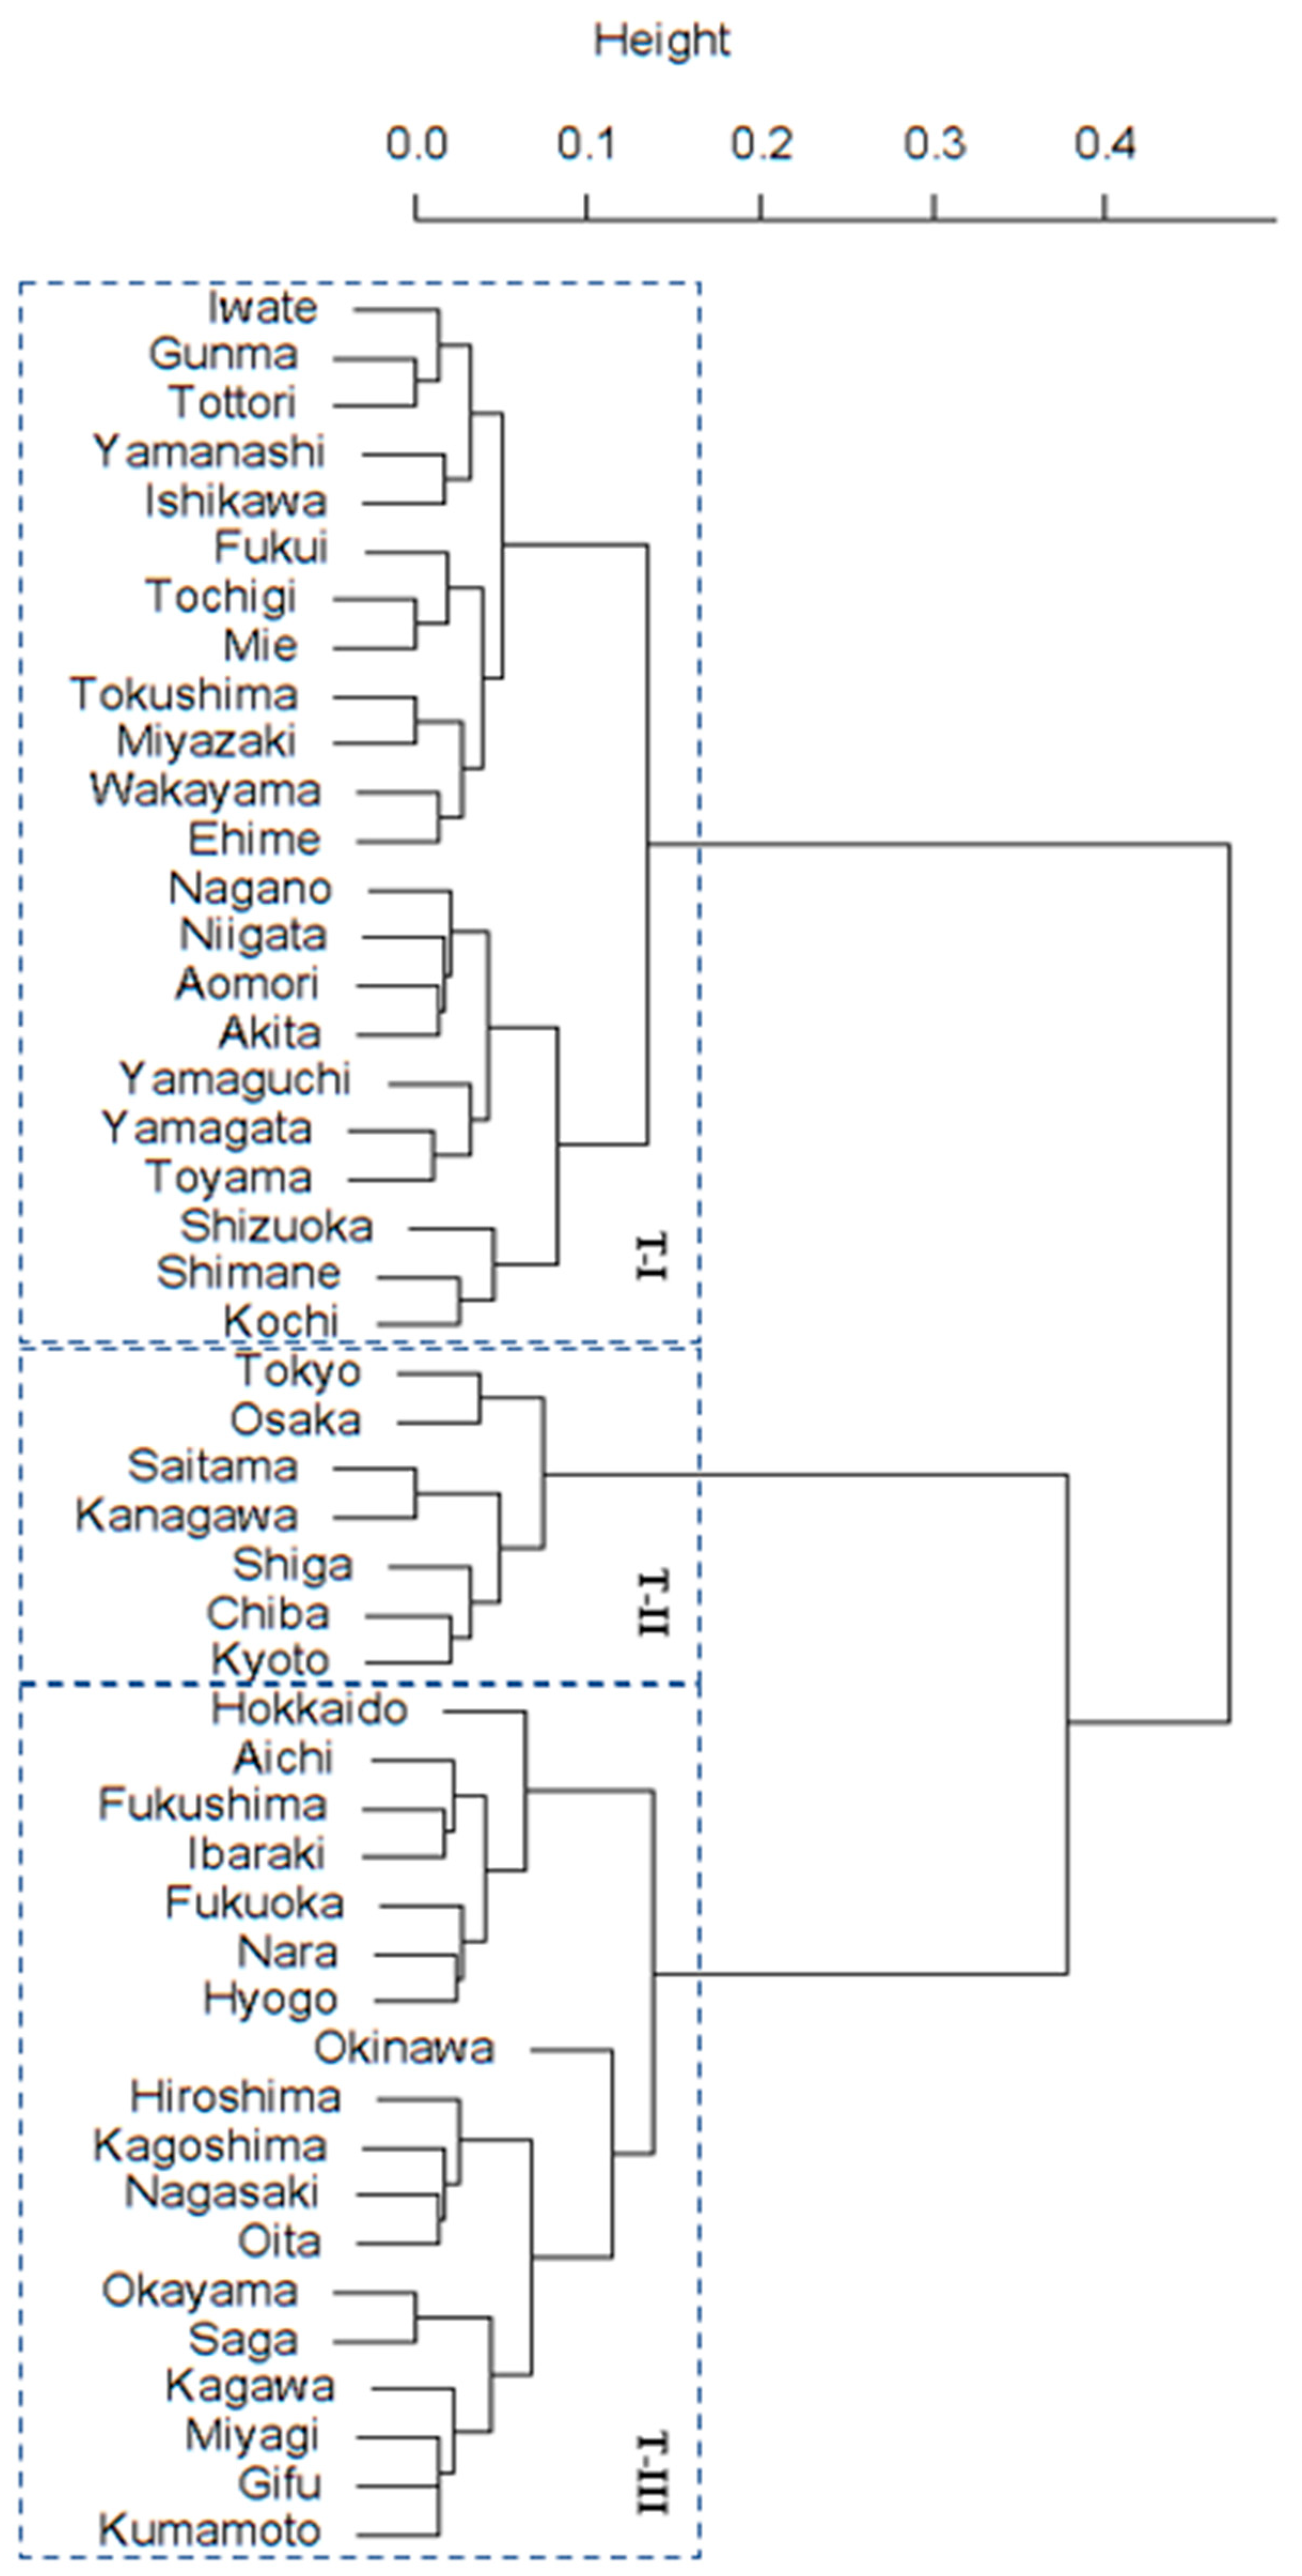
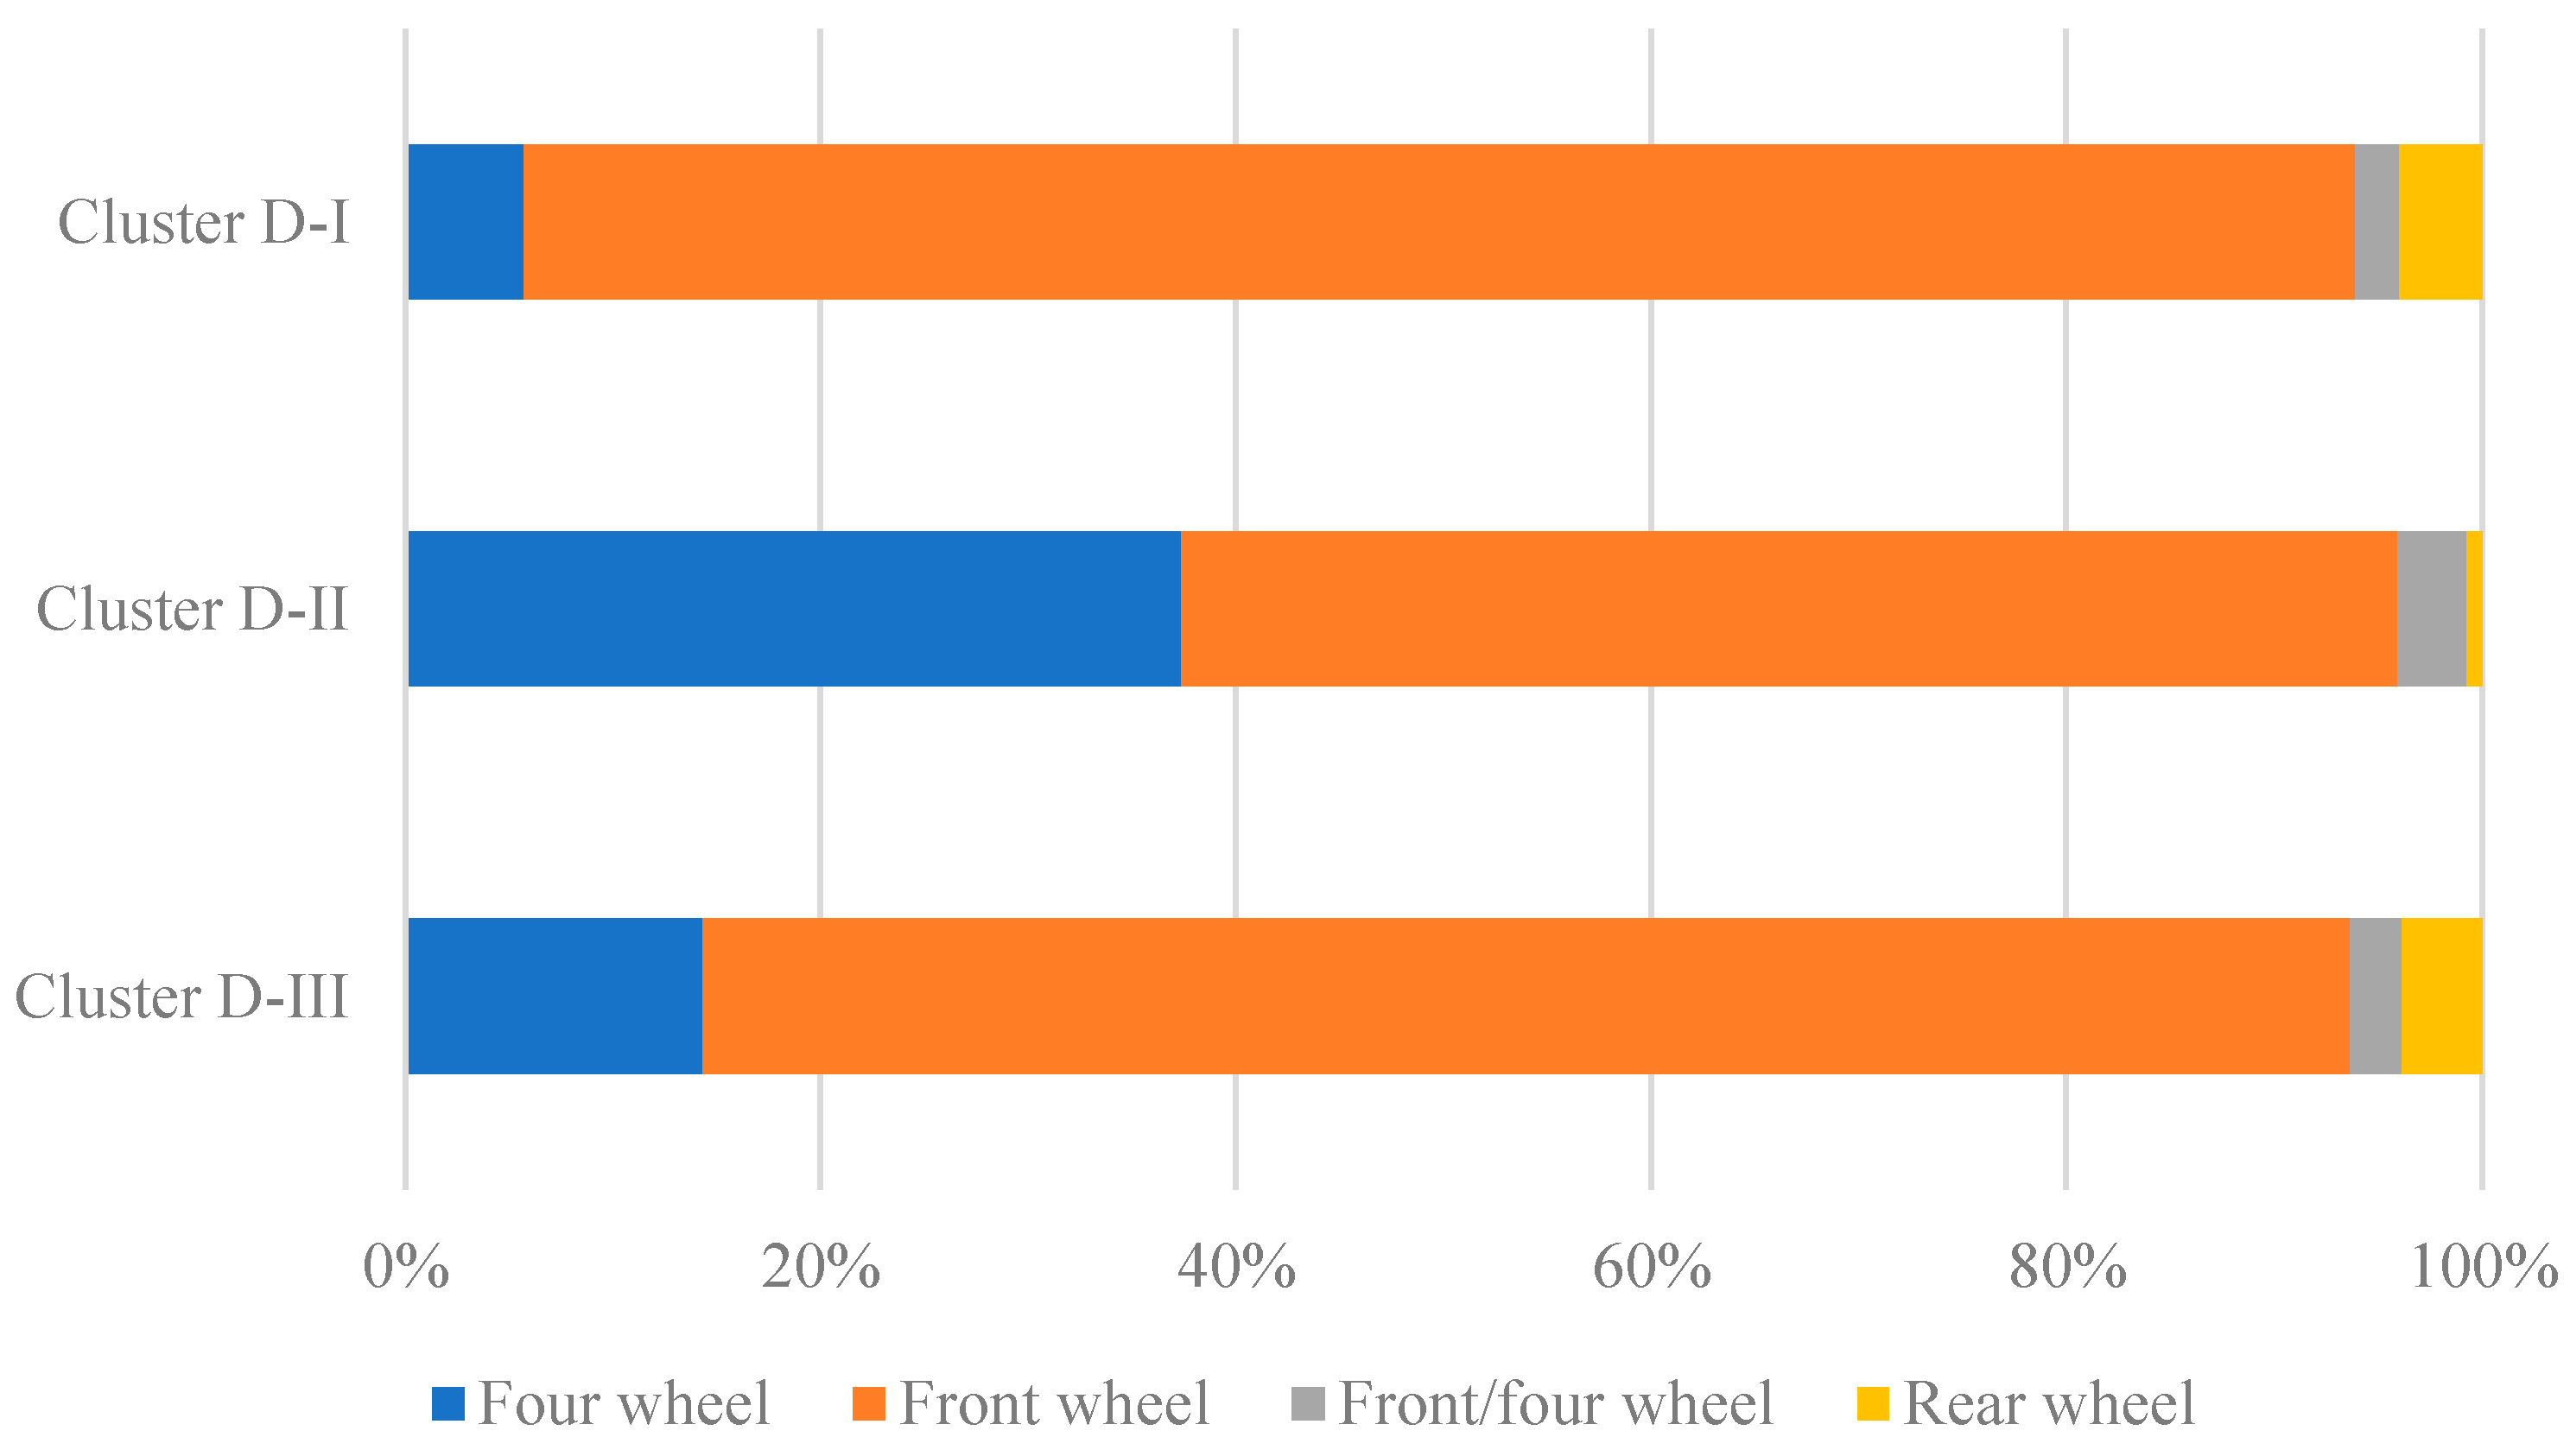
Lastly, Figure 6 shows the result of the cluster analysis for the proportion of vehicle drive systems, and Figure 7 depicts the weighted average of the percentage in each category by the identified cluster. As shown in Figure 7, most HEVs purchased were front-wheel or four-wheel drive systems.
Based on the cluster analysis, the prefectures were classified into three clusters: D-I, D-II, and D-III. The most interesting characteristic of the distribution was that the percentage of four-wheel drive vehicles was much higher for Cluster D-II (37.4%) than for the other clusters (5.7–14.3%). This cluster included Hokkaido and Aomori, which are located in the northern part of Japan (Hokkaido is the northernmost region). These areas are snowy, and the road surface is frozen in winter, so a stable four-wheel drive system is preferred. Furthermore, most of the prefectures included in Cluster D-III are located in the northern part of Japan, so the percentage of the four-wheel drive system was higher for Cluster D-III than for the prefectures in Cluster D-I.
From the cluster analysis described in Section 3.2.1, Section 3.2.2 and Section 3.2.3, it was found that there were apparent regional characteristics in the distribution of HEVs. Thus, spreading the same types of HEVs uniformly throughout the country is not appropriate. Considering regional differences will help further promote the diffusion of HEVs.

4. Conclusions

The Intergovernmental Panel on Climate Change highlighted the necessity for GHG emission reduction, particularly in the energy and transport sectors [30]. Considering the contribution of the transportation sector to fossil fuel consumption and CO2 emissions and the resulting climate change, understanding how AFVs can be diffused and developing technology for energy-sustainable transportation are urgent. This study evaluated the factors affecting the ownership ratio of HEVs (the high diffusion among AFVs) using a fixed-effects regression model, as well as the regional differences in the purchase of HEVs using cluster analysis. The main findings of this study can be summarized as follows. The regression analysis showed that demographic and social factors, such as population per household, population aging, and gender, affected the ownership ratio of these vehicles, but economic factors, such as prefecture-level subsidies for purchasing HEVs, income, and savings, had no effects. From the regional differences, the findings indicate that prefectures in urban areas tended to purchase more expensive and large-sized HEVs, whereas other areas preferred smaller and cheaper vehicles. Northern regions preferred four-wheel vehicles because of their meteorological conditions. These results suggest that economic incentives or subsidies were generally not effective in promoting HEVs, but considering regional differences is essential for the diffusion of HEVs. This means that a strategy to sell the right vehicle to the right person or region (e.g., targeting younger people/males, in general, and selling expensive/larger HEVs in urban areas and cheaper/smaller HEVs in less urban areas) is important to further promote HEVs in Japan.
To further reduce CO2 emissions and combat climate change in the transportation sector, it is essential to promote BEVs and fuel cell vehicles. Future studies need to evaluate relevant factors and regional differences in order to promote the diffusion of more environmentally friendly vehicles.

Author Contributions

Conceptualization, K.M. and H.K.; methodology, K.M. and H.K.; software, K.M. and Y.N.; validation, K.M.; formal analysis, K.M. and Y.N.; investigation, K.M., Y.N., S.E., and H.K.; data curation, Y.N.; writing—original draft preparation, Y.N. and S.E.; writing—review and editing, K.M. and H.K.; visualization, K.M. and Y.N.; supervision, K.M.; project administration, K.M.; funding acquisition, K.M. All authors have read and agreed to the published version of the manuscript.

Funding

This research was supported by the Integrated Research Program for Advancing Climate Models (grant number JPMXD0717935457) of the Ministry of Education, Culture, Sports, Science, and Technology of Japan and JSPS KAKENHI grant numbers 18K11754 and 18K11800.

Data Availability Statement

Data is available upon request.

Conflicts of Interest

The authors declare no conflict of interest.

Nomenclature

Abbreviation
AFVAlternative fuel vehicle
BEVBattery electric vehicle
CO2Carbon dioxide
EVElectric vehicle
HEVHybrid electric vehicle
OLSOrdinary least square
PHEVPlug-in hybrid electric vehicle
SUVSport utility vehicle
Variable
agingRatio of elderly people (over 65 years old)
hybrid_ratioOwnership ratio of HEVs (passenger vehicles)
incomeAnnual income per capita
maleRatio of males
population_per_householdNumber of people per household
savingSavings per household
subsidyPrefecture-level subsidy for purchasing HEVs
universityRatio of university entrance
vehicle_numberNumber of passenger vehicles
vehicle_per_householdNumber of passenger vehicles per household
CConstant
XVector of independent variables
βVector of coefficients
αPrefecture fixed effect
δYear fixed effect
εError term
iPrefecture
tYear

Appendix A

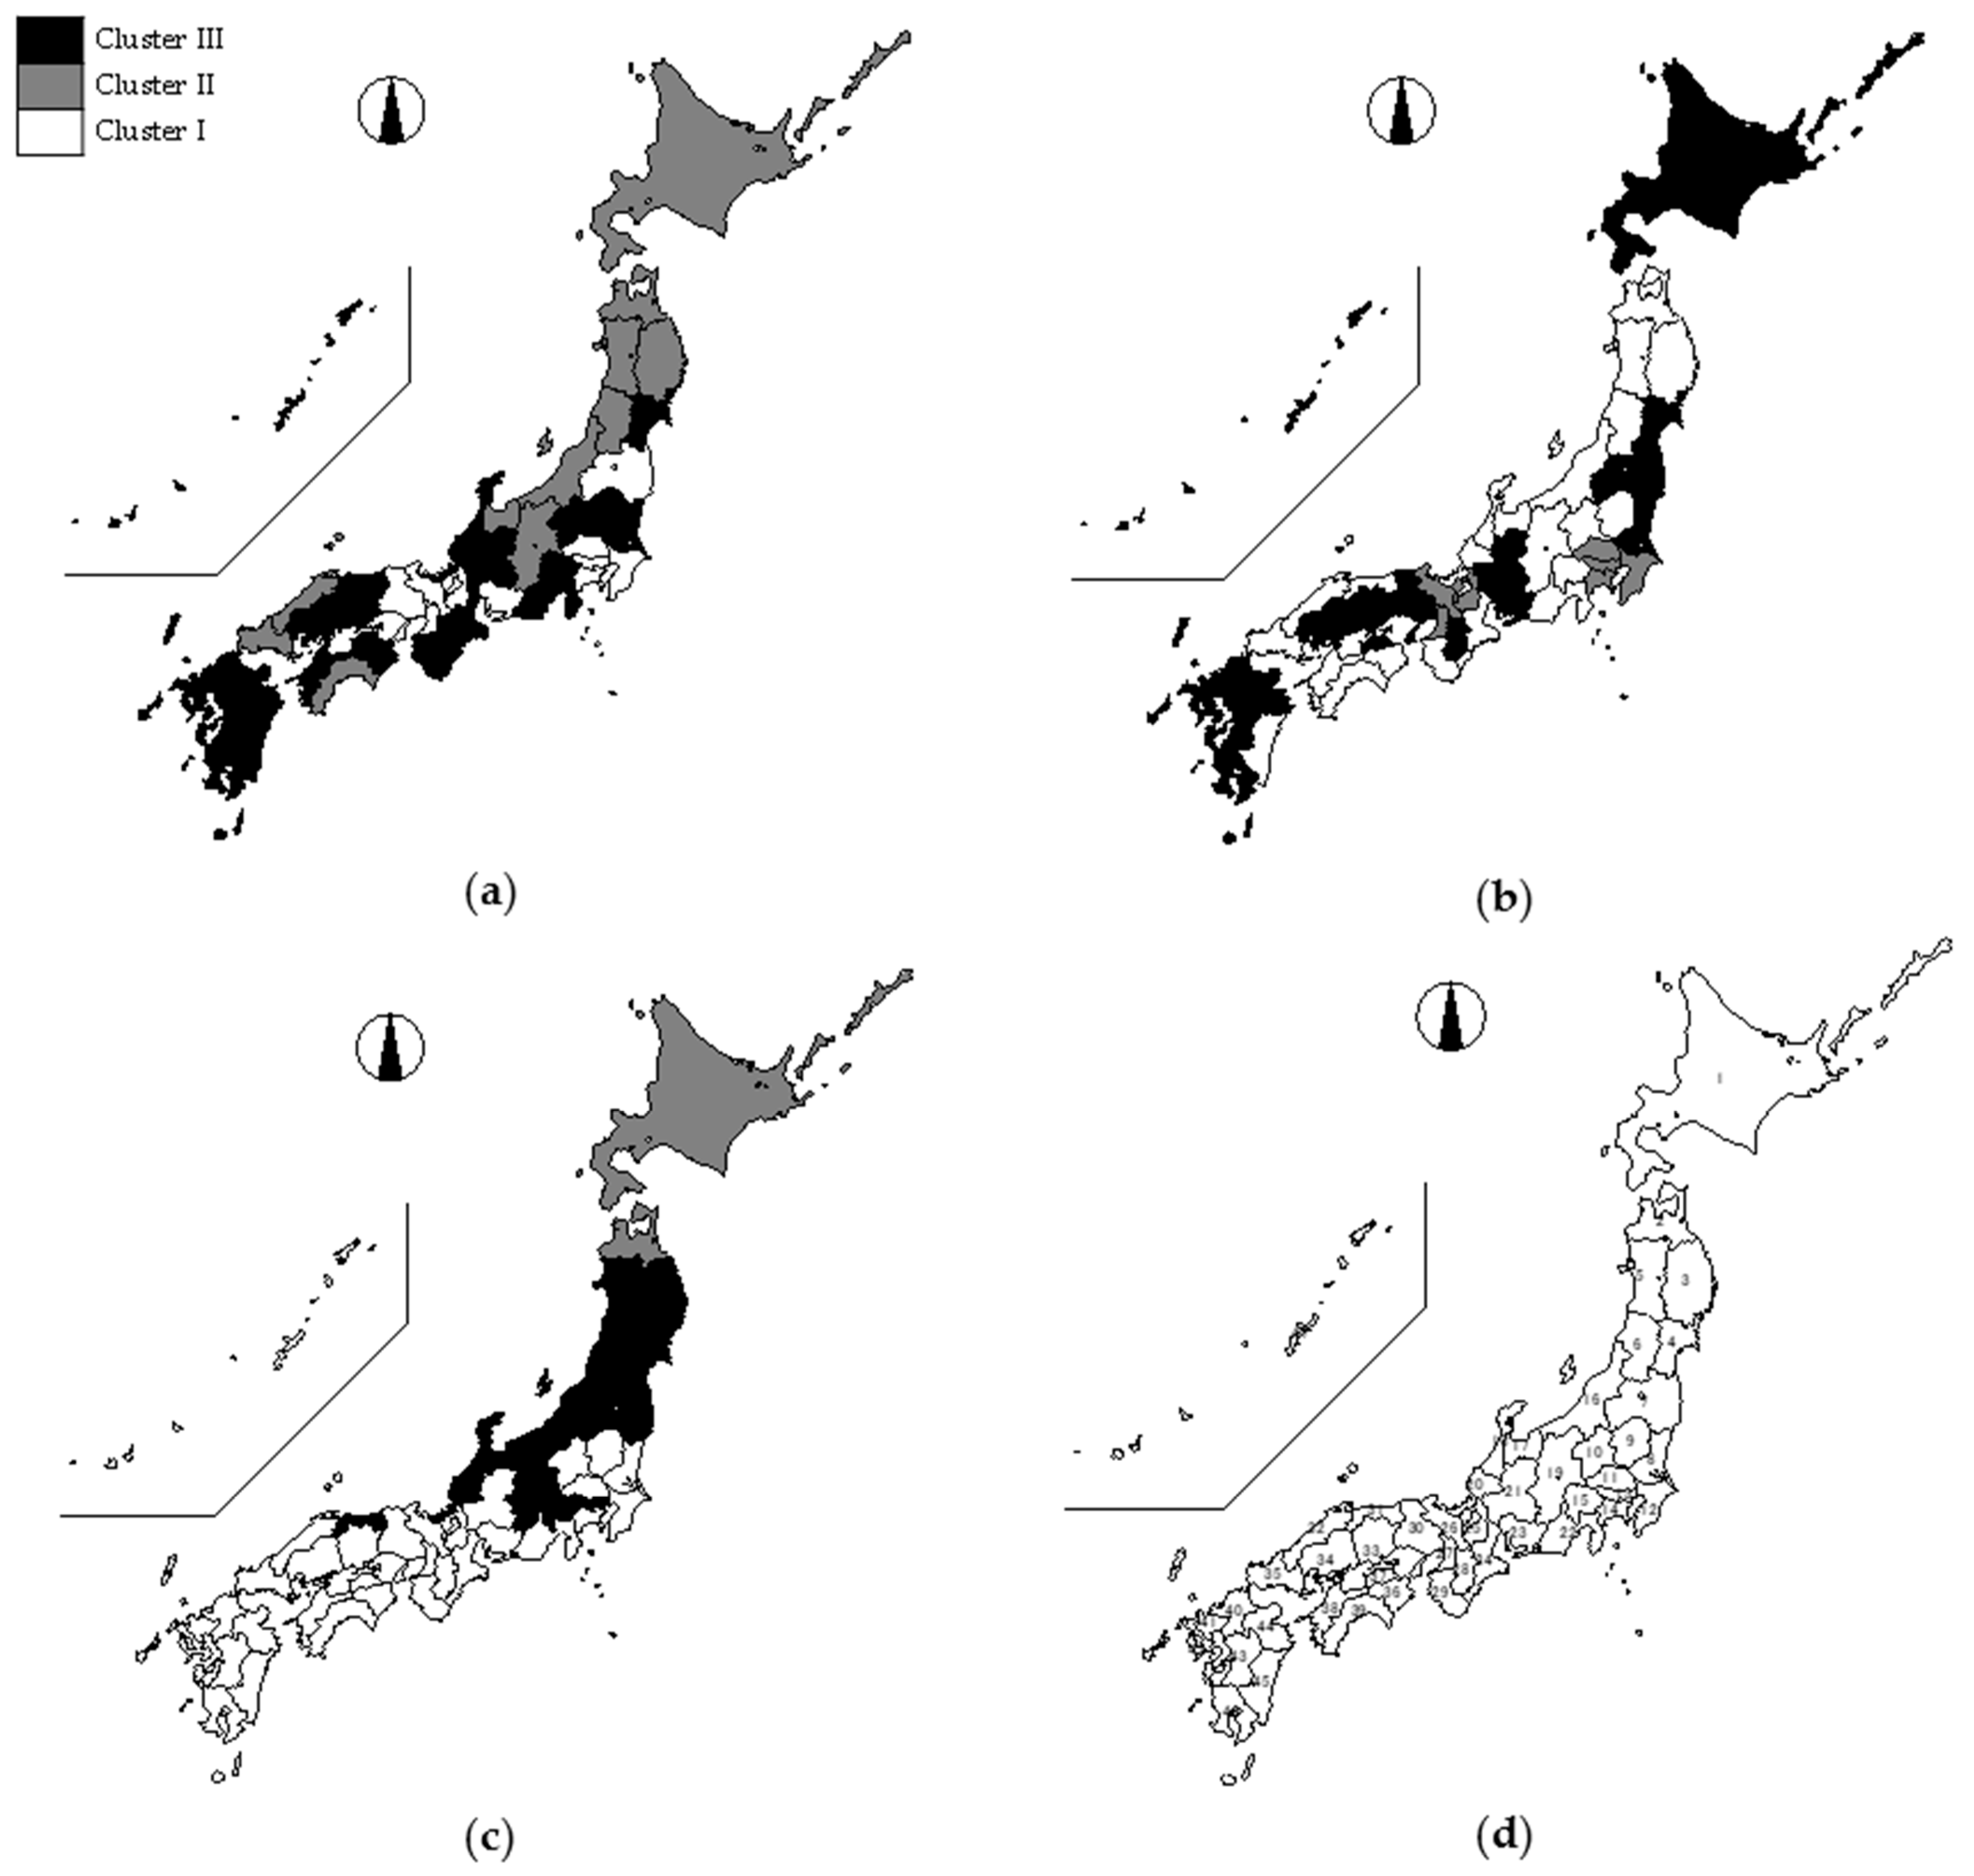
Figure A1 depicts the results of the cluster analysis on the maps. The figure is created based on the information in Figure 2, Figure 4, and Figure 6.
Figure A1. Maps of the results of the cluster analysis: (a) price category, (b) body type, and (c) drive system. (d) shows the name of the prefectures (1: Hokkaido, 2: Aomori, 3: Iwate, 4: Miyagi, 5: Akita, 6: Yamagata, 7: Fukushima, 8: Ibaraki, 9: Tochigi, 10: Gunma, 11: Saitama, 12: Chiba, 13: Tokyo, 14: Kanagawa, 15: Yamanashi, 16: Niigata, 17: Toyama, 18: Ishikawa, 19: Nagano, 20: Fukui, 21: Gifu, 22: Shizuoka, 23: Aichi, 24: Mie, 25: Shiga, 26: Kyoto, 27: Osaka, 28: Nara, 29: Wakayama, 30: Hyogo, 31: Tottori, 32: Shimane, 33: Okayama, 34: Hiroshima, 35: Yamaguchi, 36: Tokushima, 37: Kagawa, 38: Ehime, 39: Kochi, 40: Fukuoka, 41: Saga, 42: Nagasaki, 43: Kumamoto, 44: Oita, 45: Miyazaki, 46: Kagoshima, and 47: Okinawa).
Energies 14 02130 g0a1

References

  1. International Energy Agency. CO2 Emissions from Fuel Combustion: Overview; International Energy Agency: Paris, France, 2020. [Google Scholar]
  2. Wei, W.; Cao, M.; Jiang, Q.; Ou, S.J.; Zou, H. What influences Chinese consumers’ adoption of battery electric vehicles? A preliminary study based on factor analysis. Energies 2020, 13, 1057. [Google Scholar] [CrossRef] [Green Version]
  3. Higueras-Castillo, E.; Kalinic, Z.; Marinkovic, V.; Liébana-Cabanillas, F.J. A mixed analysis of perceptions of electric and hybrid vehicles. Energy Policy 2020, 136. [Google Scholar] [CrossRef]
  4. Brückmann, G.; Willibald, F.; Blanco, V. Battery Electric Vehicle adoption in regions without strong policies. Transp. Res. Part D Transp. Environ. 2021, 90. [Google Scholar] [CrossRef]
  5. Sierzchula, W.; Bakker, S.; Maat, K.; Van Wee, B. The influence of financial incentives and other socio-economic factors on electric vehicle adoption. Energy Policy 2014, 68, 183–194. [Google Scholar] [CrossRef]
  6. Coffman, M.; Bernstein, P.; Wee, S. Electric vehicles revisited: A review of factors that affect adoption. Transp. Rev. 2017, 37, 79–93. [Google Scholar] [CrossRef]
  7. Higgins, C.D.; Mohamed, M.; Ferguson, M.R. Size matters: How vehicle body type affects consumer preferences for electric vehicles. Transp. Res. Part A Policy Pract. 2017, 100, 182–201. [Google Scholar] [CrossRef]
  8. Hackbarth, A.; Madlener, R. Consumer preferences for alternative fuel vehicles: A discrete choice analysis. Transp. Res. Part D Transp. Environ. 2013, 25, 5–17. [Google Scholar] [CrossRef] [Green Version]
  9. Rasouli, S.; Timmermans, H. Influence of Social Networks on Latent Choice of Electric Cars: A Mixed Logit Specification Using Experimental Design Data. Netw. Spat. Econ. 2016, 16, 99–130. [Google Scholar] [CrossRef]
  10. Carley, S.; Krause, R.M.; Lane, B.W.; Graham, J.D. Intent to purchase a plug-in electric vehicle: A survey of early impressions in large US cites. Transp. Res. Part D Transp. Environ. 2013, 18, 39–45. [Google Scholar] [CrossRef]
  11. Ferguson, M.; Mohamed, M.; Higgins, C.D.; Abotalebi, E.; Kanaroglou, P. How open are Canadian households to electric vehicles? A national latent class choice analysis with willingness-to-pay and metropolitan characterization. Transp. Res. Part D Transp. Environ. 2018, 58, 208–224. [Google Scholar] [CrossRef]
  12. Hahn, J.S.; Lee, J.H.; Choi, K. Heterogeneous preferences of green vehicles by vehicle size: Analysis of Seoul case. Int. J. Sustain. Transp. 2018, 12, 675–685. [Google Scholar] [CrossRef]
  13. D’Adamo, I.; Rosa, P. A structured literature review on obsolete electric vehicles management practices. Sustainability 2019, 11, 6876. [Google Scholar] [CrossRef] [Green Version]
  14. Mohamed, M.; Higgins, C.D.; Ferguson, M.; Réquia, W.J. The influence of vehicle body type in shaping behavioural intention to acquire electric vehicles: A multi-group structural equation approach. Transp. Res. Part A Policy Pract. 2018, 116, 54–72. [Google Scholar] [CrossRef]
  15. Gallagher, K.S.; Muehlegger, E. Giving green to get green? Incentives and consumer adoption of hybrid vehicle technology. J. Environ. Econ. Manag. 2011, 61, 1–15. [Google Scholar] [CrossRef]
  16. Abotalebi, E.; Scott, D.M.; Ferguson, M.R. Why is electric vehicle uptake low in Atlantic Canada? A comparison to leading adoption provinces. J. Transp. Geogr. 2019, 74, 289–298. [Google Scholar] [CrossRef]
  17. Yao, J.; Xiong, S.; Ma, X. Comparative analysis of national policies for electric vehicle uptake using econometric models. Energies 2020, 13, 3604. [Google Scholar] [CrossRef]
  18. Helveston, J.P.; Liu, Y.; Feit, E.M.D.; Fuchs, E.; Klampfl, E.; Michalek, J.J. Will subsidies drive electric vehicle adoption? Measuring consumer preferences in the U.S. and China. Transp. Res. Part A Policy Pract. 2015, 73, 96–112. [Google Scholar] [CrossRef] [Green Version]
  19. Kwon, Y.; Son, S.; Jang, K. Evaluation of incentive policies for electric vehicles: An experimental study on Jeju Island. Transp. Res. Part A Policy Pract. 2018, 116, 404–412. [Google Scholar] [CrossRef]
  20. Diamond, D. The impact of government incentives for hybrid-electric vehicles: Evidence from US states. Energy Policy 2009, 37, 972–983. [Google Scholar] [CrossRef]
  21. Morton, C.; Anable, J.; Yeboah, G.; Cottrill, C. The spatial pattern of demand in the early market for electric vehicles: Evidence from the United Kingdom. J. Transp. Geogr. 2018, 72, 119–130. [Google Scholar] [CrossRef] [Green Version]
  22. Kester, J.; Sovacool, B.K.; Noel, L.; Zarazua de Rubens, G. Rethinking the spatiality of Nordic electric vehicles and their popularity in urban environments: Moving beyond the city? J. Transp. Geogr. 2020, 82. [Google Scholar] [CrossRef]
  23. Automobile Inspection & Registration Information Association. Trends in Vehicle Possession in Japan. Available online: https://www.airia.or.jp/publish/statistics/trend.html (accessed on 3 December 2019).
  24. Cabinet Office. Annual Report on Prefectural Accounts. Available online: https://www.esri.cao.go.jp/jp/sna/sonota/kenmin/kenmin_top.html (accessed on 4 February 2020).
  25. Statistical Bureau of Japan. Survey of household economy. Available online: https://www.stat.go.jp/english/data/joukyou/index.html (accessed on 4 February 2020).
  26. Statistical Bureau of Japan. Population Census. Available online: https://www.stat.go.jp/english/data/kokusei/index.html (accessed on 4 February 2020).
  27. Ministry of Education, Culture, Sports, Science and Technology. Report on Basic Research on School. Available online: https://www.mext.go.jp/b_menu/toukei/chousa01/kihon/1267995.htm (accessed on 4 February 2020).
  28. Shiraki, H.; Matsumoto, K.; Shigetomi, Y.; Ehara, T.; Ochi, Y.; Ogawa, Y. Factors affecting CO2 emissions from private automobiles in Japan: The impact of vehicle occupancy. Appl. Energy 2020, 259. [Google Scholar] [CrossRef]
  29. Acar, A.; Takahashi, H. A discussion of gender response on advertising research. Kwansei Gakuin Shogaku Kenkyu 2009, 60, 75–89. [Google Scholar]
  30. Edenhofer, O.; Pichs-Madruga, R.; Sokona, Y.; Seyboth, K.; Matschoss, P.; Kadner, S.; Zwickel, T.; Eickemeier, P.; Hansen, G.; Schlomer, S. (Eds.) Renewable Energy Sources and Climate Change Mitigation; Cambridge University Press: Cambridge, UK, 2011. [Google Scholar]
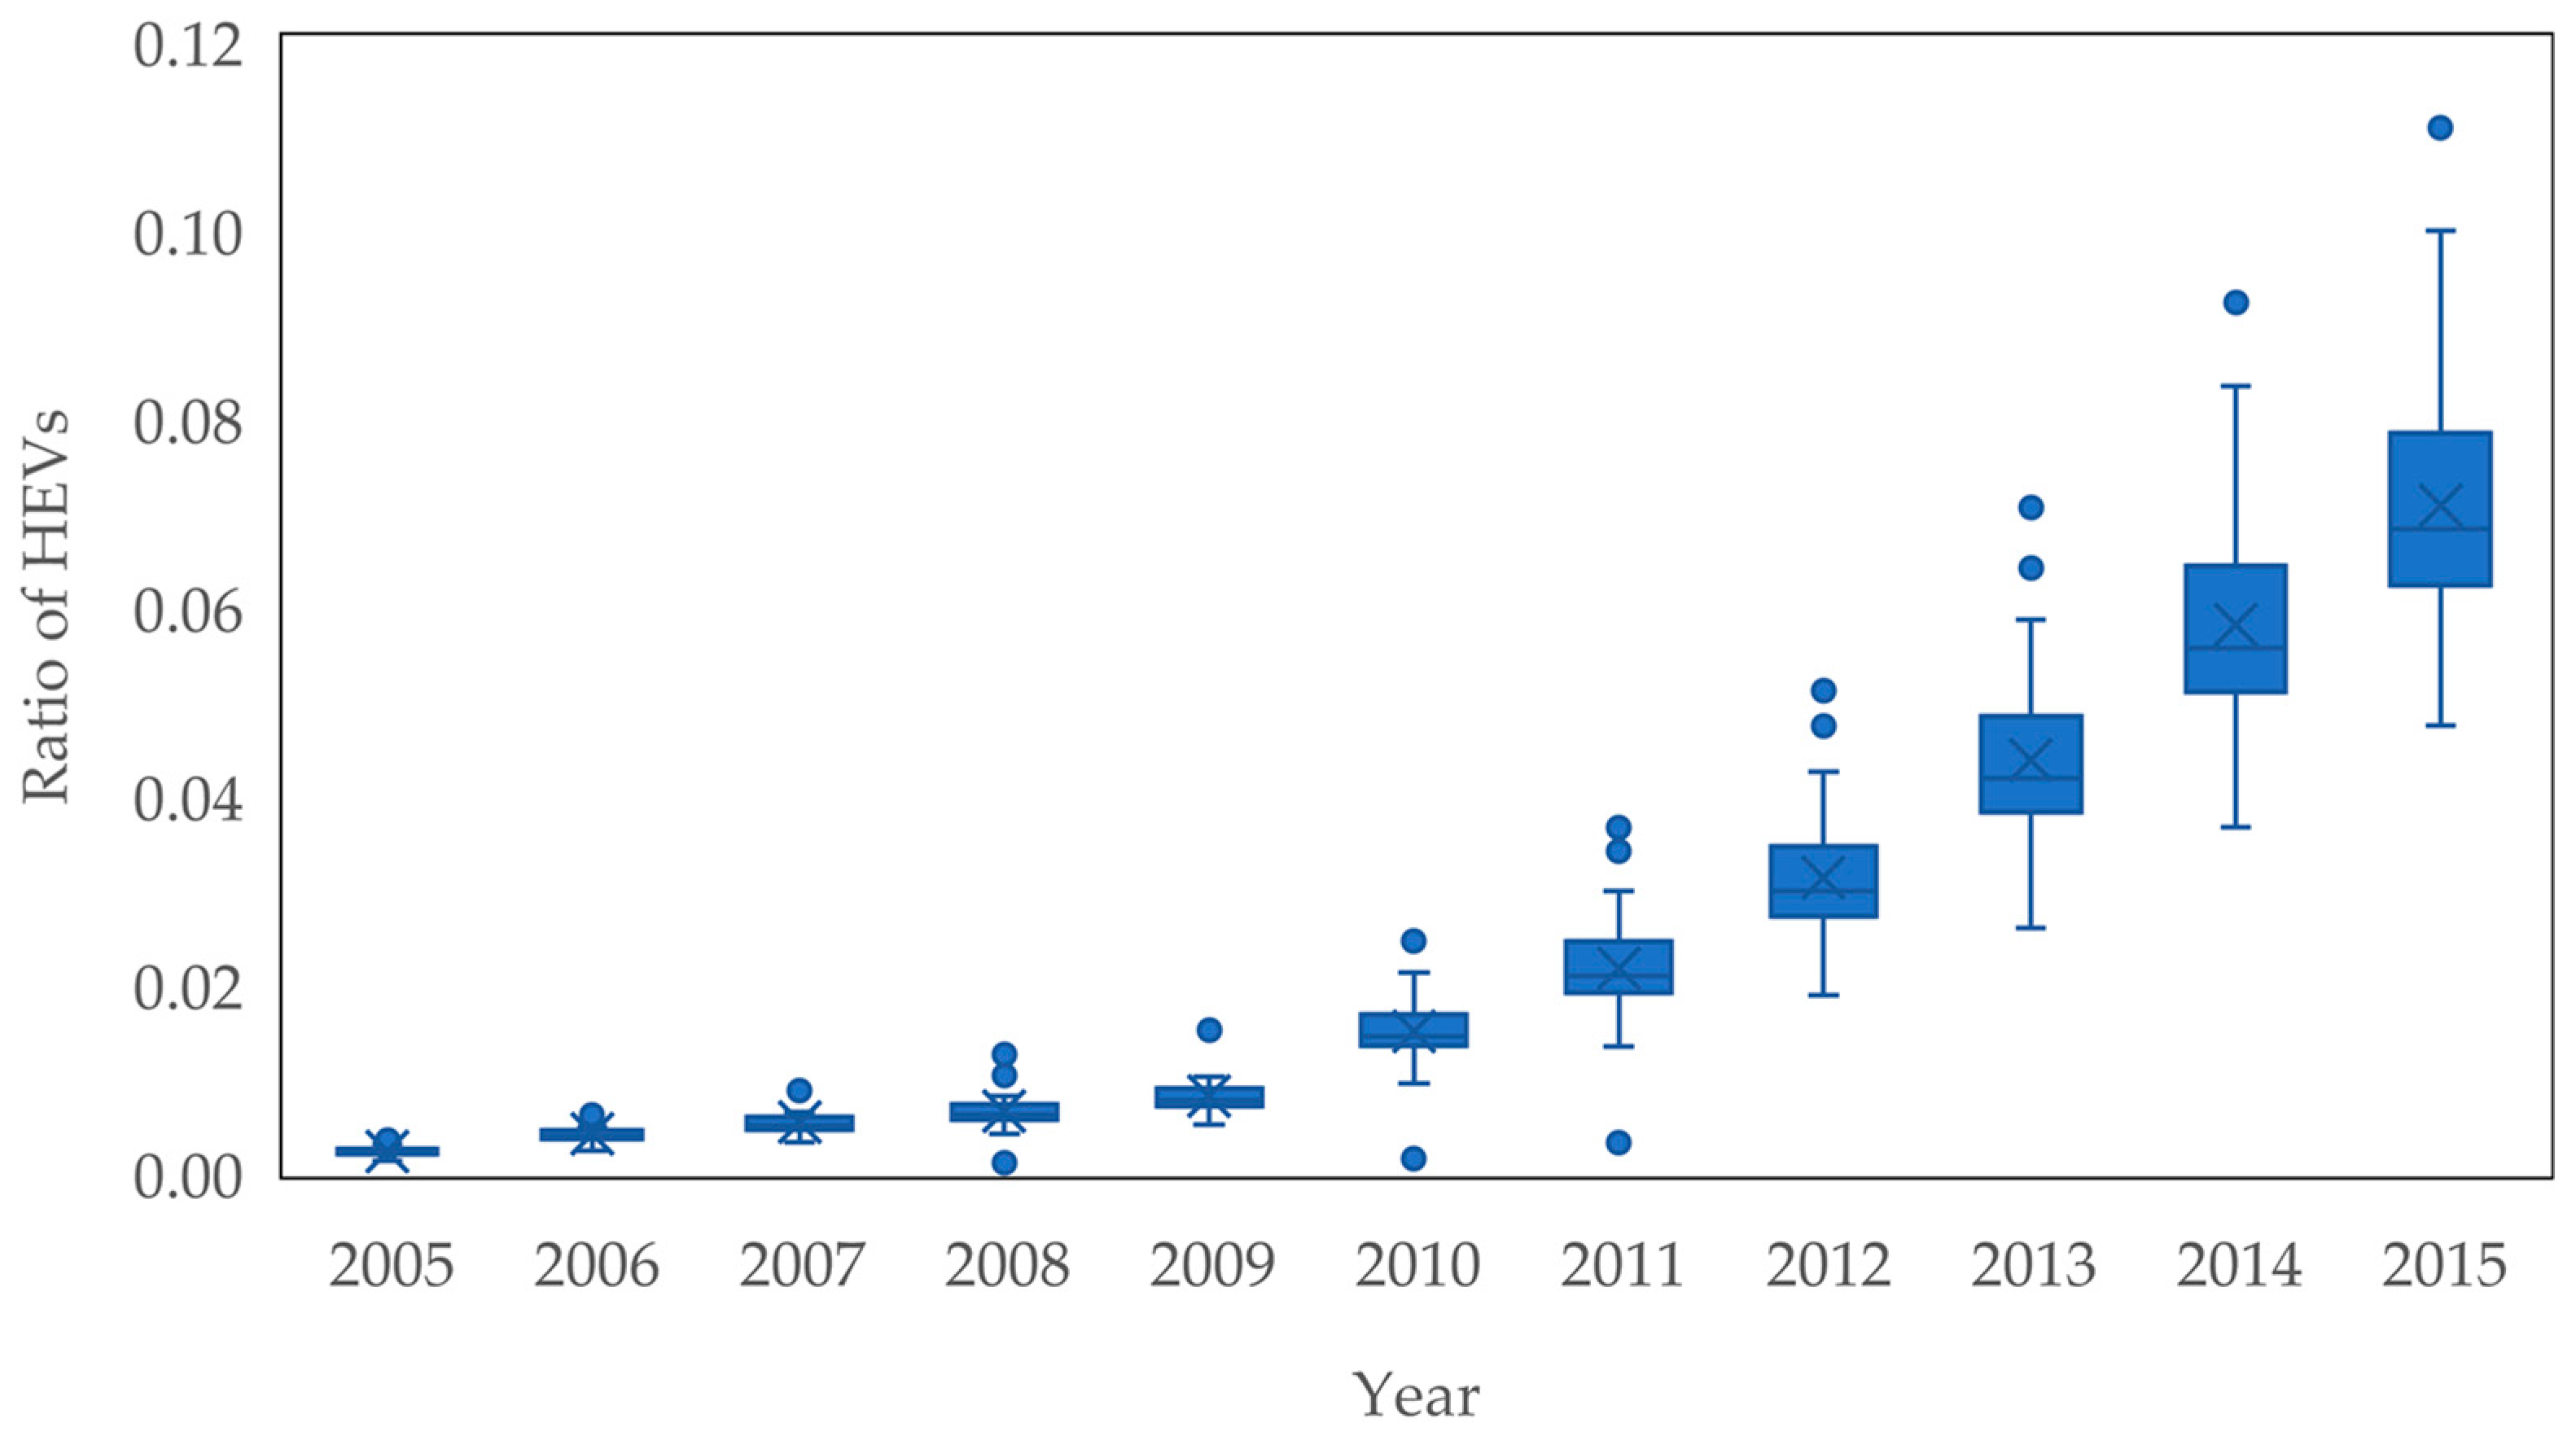
Figure 1. Trend of the ownership ratio of HEVs at the prefecture level. Each box shows the 75th percentile, median, and 25th percentile of the samples (from the top). The whiskers show the maximum and minimum values (excluding the outliers). The cross marks show the mean values, whereas the circles show the outlier points.
Energies 14 02130 g001
Figure 2. A dendrogram for the vehicle price categories. See Figure A1a for the mapping of the cluster analysis results.
Energies 14 02130 g002
Figure 3. Percentages of HEVs by vehicle price category (in JPY) for each cluster.
Energies 14 02130 g003
Figure 4. A dendrogram for vehicle body type. See Figure A1b for the mapping of the cluster analysis results.
Energies 14 02130 g004
Figure 5. Percentages of HEVs by vehicle body type for each cluster.
Energies 14 02130 g005
Figure 6. A dendrogram for the drive systems. See Figure A1c for the mapping of the cluster analysis results.
Energies 14 02130 g006
Figure 7. Percentages of HEVs by drive system for each cluster. Note that front-/four-wheel is a classification that could not distinguish between the front-wheel and four-wheel drive vehicle types.
Energies 14 02130 g007
Table 1. Selection of independent variables and their data sources.
Independent VariablesDefinitionSources
subsidyPrefecture-level subsidy for purchasing HEVs. A dummy variable that takes a value of one if a subsidy exists and zero otherwise.Website of and inquiry from each prefecture
income (thousand JPY)Annual income per capita[24]
saving (thousand JPY)Savings per household[25]
population_per_householdNumber of people per householdCalculated based on the data from [26]
vehicle_numberNumber of passenger vehicles[23]
vehicle_per_householdNumber of passenger vehicles per householdCalculated based on the data from [23] and [26]
universityRatio of university entrance (i.e., indicator of higher education)[27]
agingRatio of elderly people (over 65 years old)[26]
maleRatio of males[26]
Table 2. Descriptive statistics of the variables for the whole samples.
VariablesMeanS.D.Min.Max.
hybrid_ratio0.0240.0240.000940.11
subsidy0.0770.08801
income4359.75449.013365.246360.33
saving11910.893020.89351020390
populaion_per_household2.500.231.973.13
vehicle_number1239511.54892405.183105224064359
vehicle_per_household1.420.820.265.24
university0.500.0720.310.67
aging0.250.0340.160.34
male0.480.0100.470.51
Note: The number of observations is 517 (47 prefectures × 11 years).
Table 3. Results of the panel data regression analysis.
(1) Pooled OLS(2) One-Way Fixed Effects(3) Two-Way Fixed Effects
subsidy0.002980.000601−0.00196
(0.00737)(0.00405)(0.00190)
income4.32 × 10−71.40e × 10−5 ***−1.08 × 10⁻⁶
(2.34e × 10−6)(2.85 × 10⁻⁶)(1.50 × 10⁻⁶)
saving1.88 × 10−85.72 × 10⁻⁷ ***2.27 × 10⁻⁸
(2.97 × 10⁻⁷)(1.89 × 10⁻⁷)(9.03 × 10⁻⁸)
population_per_household−0.0342 ***0.01480.0603 ***
(0.00403)(0.0144)(0.00952)
vehicle_number2.38 × 10−9 **5.51 × 10⁻⁸ ***3.06 × 10⁻⁸ ***
(1.16 × 10⁻⁹)(1.50 × 10⁻⁸)(7.14 × 10⁻⁹)
vehicle_per_household−0.00130−0.0143−0.174 ***
(0.000876)(0.0250)(0.0133)
university0.0315 **−0.170 ***0.0221
(0.0140)(0.0214)(0.0160)
aging0.562 ***1.158 ***−0.176 ***
(0.0265)(0.0695)(0.0525)
male1.280 ***0.3280.636 **
(0.102)(0.549)(0.262)
Constant−0.666 ***−0.489 *−0.220 *
(0.0466)(0.273)(0.131)
R-squared0.6290.9090.981
Prefecture fixed effectNoYesYes
Year fixed effectNoNoYes
Note: The number of observations is 517. Standard errors are in parentheses. *** p < 0.01, ** p < 0.05, * p < 0.1.
Table 4. Coefficients of the year fixed effect corresponding to the two-way fixed effects.
Coefficients (Standard Errors) Coefficients (Standard Errors)
year20060.00509 (0.000935)year20110.0315 (0.00276)
year20070.00831 (0.00132)year20120.0448 (0.00313)
year20080.0103 (0.00171)year20130.0598 (0.00365)
year20090.0135 (0.00212)year20140.0780 (0.00413)
year20100.0222 (0.00246)year20150.0938 (0.00461)
Note: Year 2005 is the base year. All coefficients were statistically significant at the 1% level.
Publisher’s Note: MDPI stays neutral with regard to jurisdictional claims in published maps and institutional affiliations.