Article

Multifaceted Analyses of Four Different Prototype Lightweight Photovoltaic Modules of Novel Structure

1
Energy Conversion and Renewable Resources Research Centre Polish Academy of Sciences, The Szewalski Institute of Fluid-Flow Machinery Polish Academy of Sciences, Fiszera 14 Str., 80-231 Gdańsk, Poland
2
Xdisc S.A., Jagiellońska 82 Str., 03-301 Warsaw, Poland
3
Faculty of Power and Aeronautical Engineering, Warsaw University of Technology, Nowowiejska 24 Str., 00-665 Warsaw, Poland
4
Institute of Physics and Computer Science, Faculty of Applied Physics and Mathematics, Gdańsk University of Technology, G. Narutowicza 11/12 Str., 80-233 Gdańsk, Poland
*
Author to whom correspondence should be addressed.
Energies 2021, 14(8), 2239; https://doi.org/10.3390/en14082239
Submission received: 15 March 2021 / Revised: 13 April 2021 / Accepted: 14 April 2021 / Published: 16 April 2021
(This article belongs to the Section A2: Solar Energy and Photovoltaic Systems)

Abstract

:
Dynamic growth of photovoltaic capacity in Poland encourages many entities to invest in photovoltaic systems. However, in the case of buildings with low roof-bearing capacity it can be problematic or even impossible to mount conventional PV modules due to their relatively high weight. Hence, the use of lightweight PV modules is a potential solution. In this paper four different prototype silicon lightweight modules of novel structure manufactured by the Xdisc S.A have been investigated in terms of their electrical and thermal features. The measurements showed that all prototypes have efficiency exceeding 19.5% and power in range of 214 to 242 Wp at standard test conditions. Their area density is about 3.5 kg/m2 which is typical for lightweight modules. In turn, the Power-to-Weight Ratio exceeds 40 W/kg threshold and in one case reaches almost 58 W/kg. Thanks to the measurements, the prototypes could be modelled in PVsyst (PVsyst SA, Satigny, Switzerland). The performed simulations of an example PV system revealed that installations based on prototypes have comparable performance to a conventional installation. Nevertheless, at current prices they are less profitable than the standard system and it shows the need for future cost reductions in the manufacturing process. The proposed materials selection may be the starting point for search of inexpensive substitutes of these materials which still conserve modules high performance. A system based on the prototypes can still prove advantageous when simplicity and promptness outweigh higher initial costs.

1. Introduction

Nowadays, photovoltaic (PV) capacity in Poland is growing rapidly. While in 2010 the cumulated capacity was close to 0 MWp, currently it has exceeded 3.5 GWp [1]. Moreover, almost 2.5 GWp was installed in the previous year. Subsidies from the public funds (the “Mój Prąd” programme [2]) and increasing electricity prices encourage people and companies to invest in photovoltaic systems. Unfortunately, in the case of some large-area buildings, a problem arises due to a low roof load ability [3,4] which forecloses the mounting of conventional PV modules. Usually, this issue touches new modern warehouses and production facilities covered with membrane roofs which sometimes have a load capacity lower than 10 kg/m2 [5] while a standard PV module weighs 12–16 kg/m2 (a glass-glass module 14–17 kg/m2), and with racking a total weight can exceed 40 kg/m2 [6,7]. Additionally, old buildings erected in the People’s Republic of Poland may be unsuitable for solar system due to past regulations. Snowfall is the main factor that contributes to a building’s roof load bearing capacity. In Poland until 2006 the time during which the value of a given load should not be exceeded was only 5 years [8]. The amendment of the standard PN-EN 1991-1-3: 2005 Eurocode 1 has extended the snow load return period to 50 years. This resulted in an increase in the required snow loads and hence load bearing capacity. In the case of some buildings existing before the amendment, a recalculation of this parameter reduced their capacity significantly.
Nevertheless, there are four possible solutions to install the PV system anyway. One can utilize a low-ballast or aeronautical mounting system, but still the maximum permitted load may be exceeded because of the standard PV module weight [9,10]. The second option, more suitable for the old buildings, is a customized steel construction which transfers the load from the roof to walls. However, the cost of such a construction usually makes the investment unprofitable. Alternatively, the roofing can be replaced by building integrated photovoltaics (BIPV), but again it costs a lot. Furthermore, BIPV generates an excessive load which may not be well tolerated by older buildings’ structures [11]. Therefore, BIPV is a suitable choice only for newly built facilities. Finally, lightweight PV modules can be mounted. They usually weigh up to 7 kg/m2 [3] and do not require a racking system. This makes them suitable for even very low load roofs. It is worth mentioning that the main difference between BIPV and lightweight PV modules lies in their relation with a building. While BIPV replaces conventional materials in parts of the building envelope and cannot be removed without impact on the structural integrity, lightweight modules may be mounted using assembly like standard PV modules or directly fastened onto building construction materials using for instance tape. Hence, in the second case they can be considered as building attached photovoltaics (BAPV) [12].

1.1. State of the Art

The majority of lightweight modules consist of a polymeric sheet on both sides of encapsulated thin-film PV cells [11]. In some cases, aluminum or stainless steel is used as a backsheet [13,14]. Owing to the fact that glass and frame contribute about 69% and 11% to the weight of a conventional PV module [15], respectively, removing these components allows achieving a load as low as 2.7 kg/m2 [3]. In addition, using thin-film cell like amorphous or microcrystalline silicon provides flexibility to a module, which is desired, for instance, in military or transport applications. However, full dimension thin-film modules usually do not achieve efficiency higher than 10% [14,16,17]. Only CIGS modules have higher efficiency, but it is still lower than crystalline silicon modules [18]. Therefore, it seems reasonable to utilize monocrystalline silicon cells to fabricate a high efficiency lightweight module. Nevertheless, CIGS cells indicate many advantages in case of BIPV [19].
There are some commercial silicon lightweight modules, but their quality is questionable [3,20], even when they claim to comply with the IEC or UL certification. Therefore, in the literature some prototype solutions have been proposed.
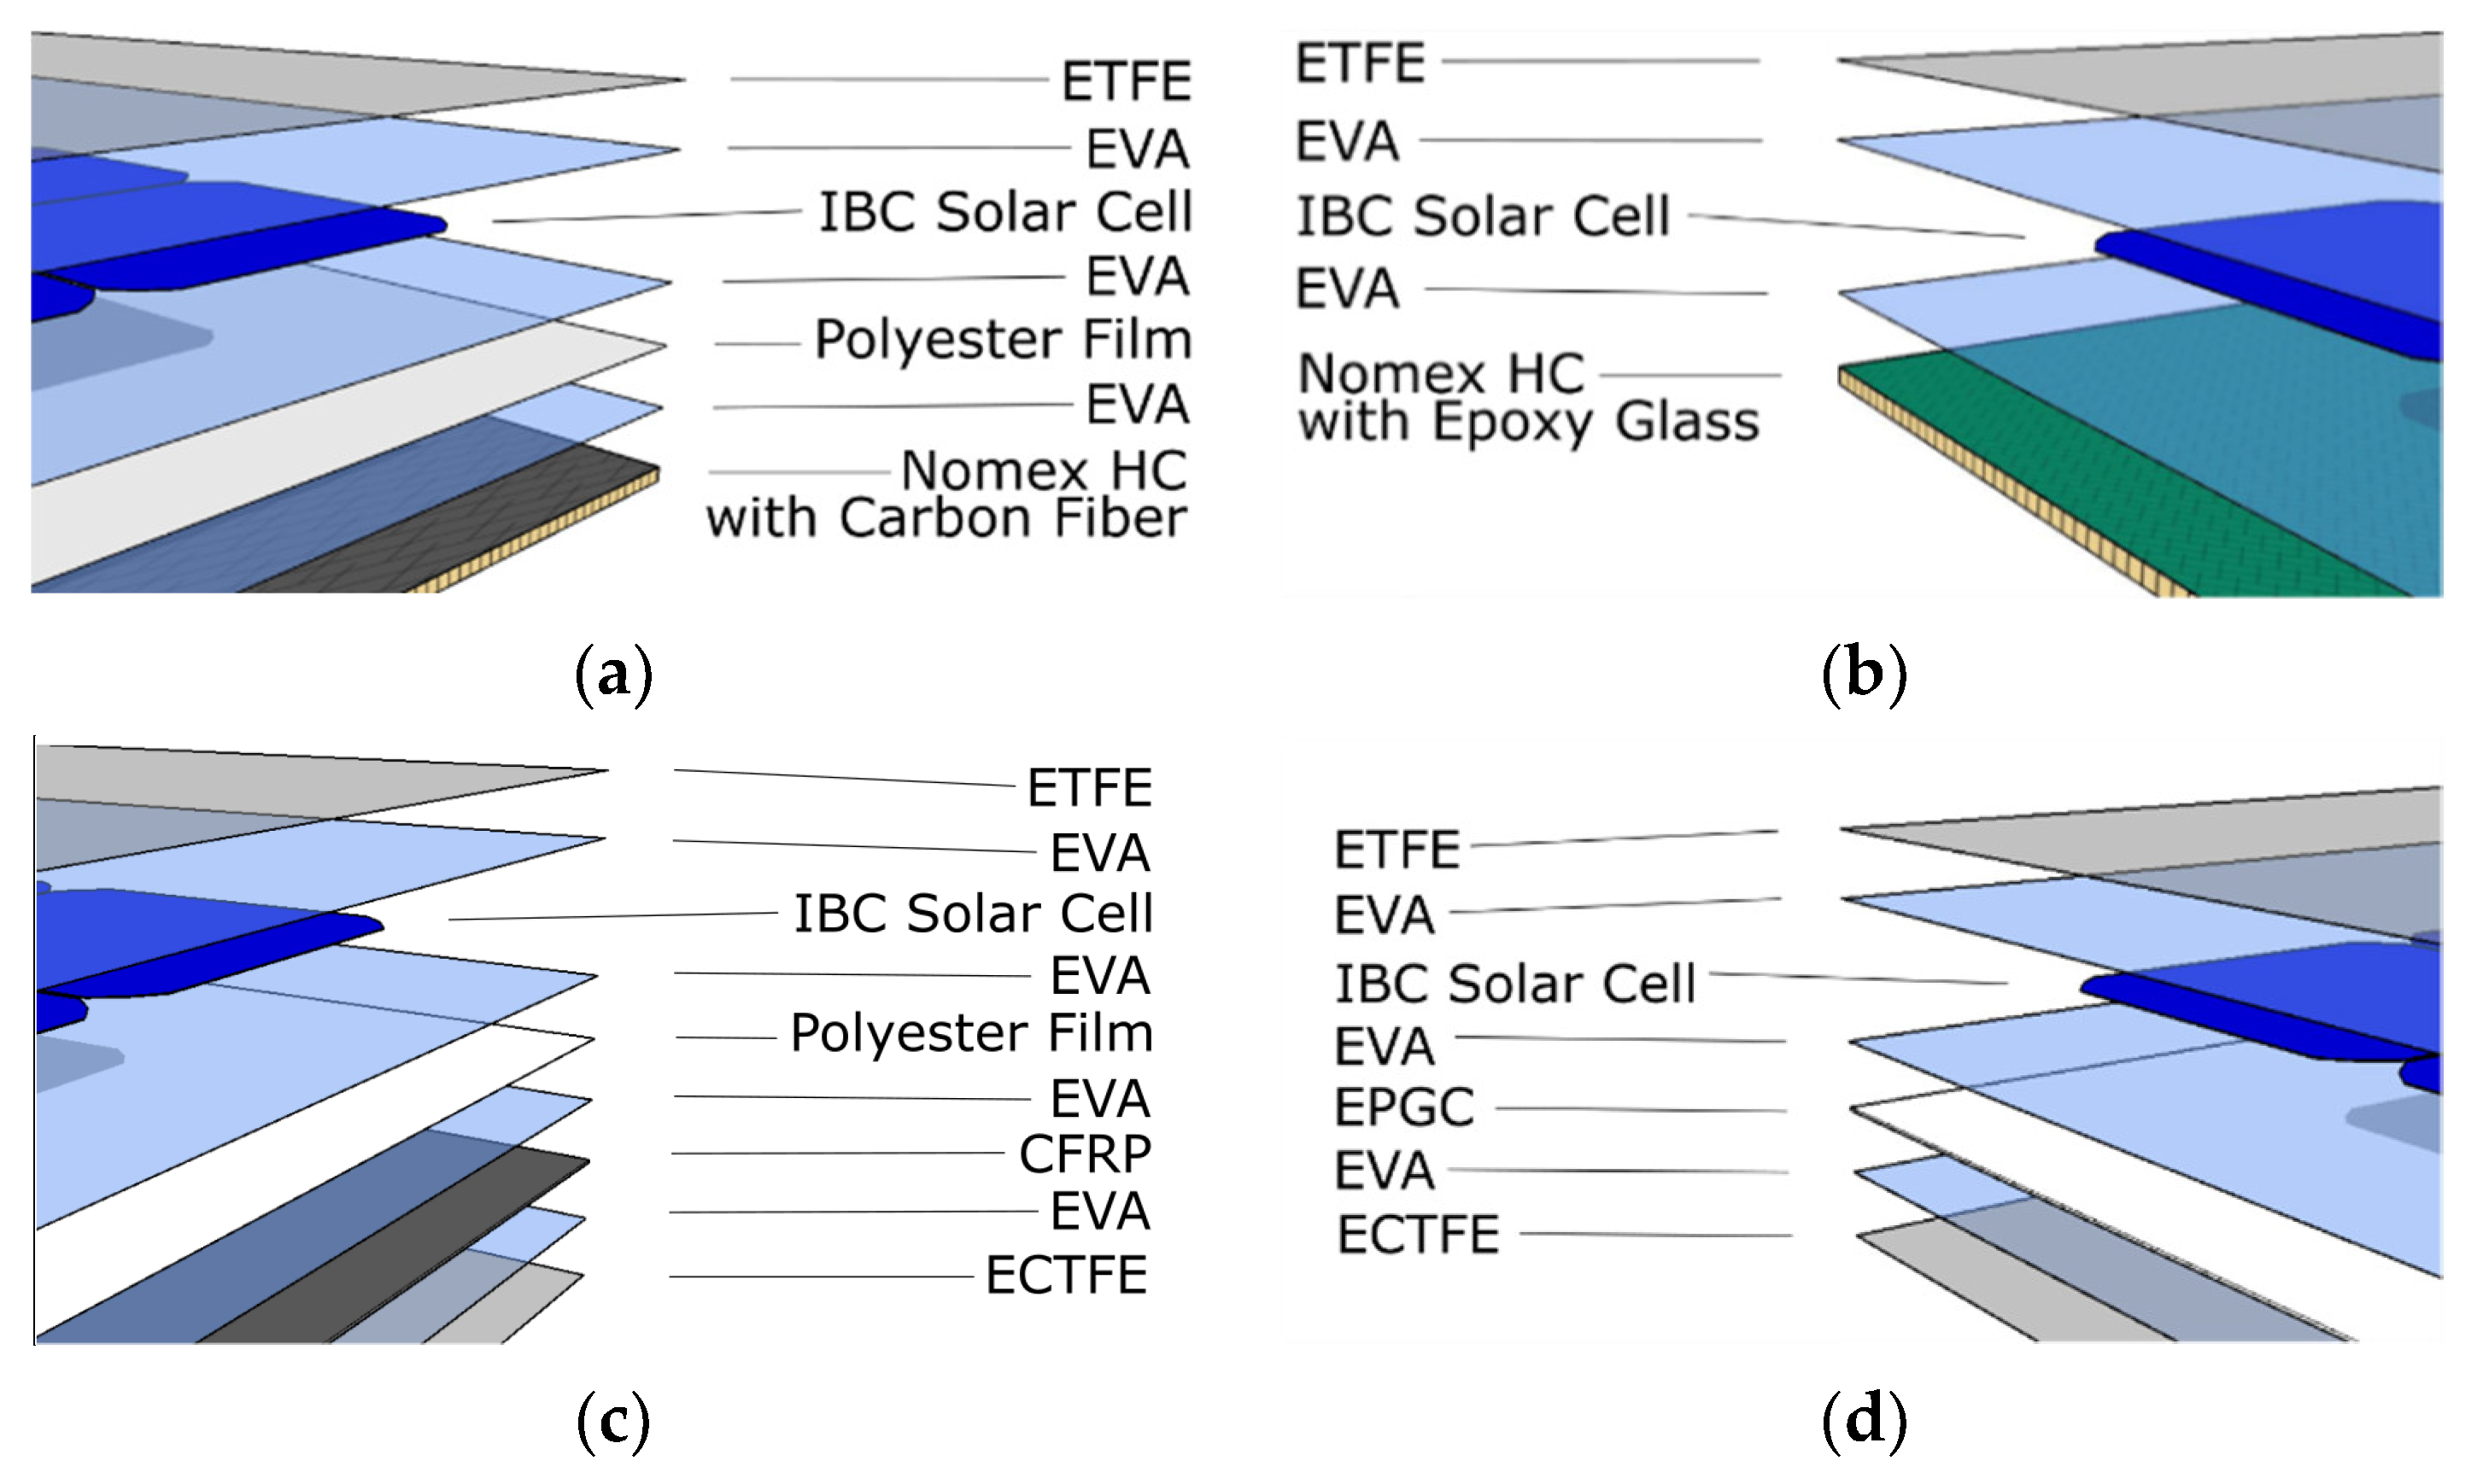
A.C. Martins et al. [3] have introduced a glass-free lightweight module (about 5 kg/m2) which was investigated by the IEC 61215-2:2016 hail test. The module structure consists of a composite sandwich backsheet (with an aluminum honeycomb core) and polymeric frontsheet with grade of glass scrim. The researchers examined the impact of backsheet bending stiffness and frontsheet thickness on the module resistance. It turned out that the smaller backsheet stiffness and thicker frontsheet, the higher module hail resistance. Later, the module structure has been slightly changed which resulted in higher weight (about 6 kg/m2). In a similar paper, a detailed manufacturing process of the module was described [21]. The device has undergone further tests. It successfully passed damp heat and thermal cycling tests [20] and also hail and mechanical load tests [11] as prescribed in the IEC 61215-2:2016. In the next paper [22] the researchers have investigated different frontsheet encapsulants to improve resistance of their module. After a series of the following tests: ultraviolet-visible, spectroscopy, differential scanning calorimetry, rheology, peel and tensile tests and hail test on mini modules, TPO (thermoplastic) and POE (elastomeric polyolefin) turned out to be the best composition. Subsequently, the authors proposed a mounting system for lightweight modules based on Velcro tape (placed along edges and diagonals) which complies with the static mechanical load test presented in the IEC 61215 [23].
In [24] the authors have fabricated and tested mini modules (1- and 4-cell) covered on both sides with an acrylic-film. It allowed to reduce the weight of the structure to 46% of a conventional module weight. The samples have met requirements of the IEC 61215 standard in case of the thermal cycling, humidity-freeze and damp heat tests, and also showed no changes in the PID test.
A different approach to lightweight module construction involves adding a lattice-like structure at the rear side [25]. Because of this, very thin laminates can be used without losing sufficient mechanical stiffness and hence a weight reduction to less than 6.5 kg/m2 may be achieved. The authors claim that their module is able to successfully pass the IEC 61215 standard mechanical load test.
Another concept of lightweight module structure was presented in [26]. Use of a polyester foam as a backsheet allowed to manufacture a full-dimension (60-cell) rigid module weighing 5.5 kg. Its power was equal to 256 kWp, which gives a Power-to-Weight ratio of about 46.6 Wp/kg. After a few months of outdoor monitoring no degradation or deterioration was observed. Cost of the module manufacturing is similar to a standard module. However, a full IEC test sequence has not been so far conducted.
To better evaluate lightweight modules in terms of their weight and area, S. Schindler et al. [27] have proposed novel indicators. The following parameters were suggested:
  • Power-to-Weight Ratio P2W [W/kg];
  • Area density AD [kg/m2];
  • Weight-to-Power Ratio W2P [kg/W];
  • Efficiency-to-Weight Ratio E2W [%/kg].
According to the authors’ analyses, a typical silicon lightweight module has P2W ratio equal to around 40 W/kg, while standard modules are in the range of 10–20 W/kg and thin film devices are below 10 W/kg. The best lightweight module has 60 W/kg. The usual E2W ratio of this module type varies between 1.5 and 3%/kg, reaching in one case 12%/kg. However, this indicator is misleading if we consider modules of different cell number (and hence size), and only efficiency should be compared instead. In case of lightweight modules, the values range from 12% to 21% with average 15%. When it comes to AD, the value for lightweight modules is below 5 kg/m2. While P2W and E2W ratios are better for lightweight modules than for standard ones, costs per m2 are significantly higher and more diversified. It varies from 60 to 110 €/m2. In comparison, standard modules cost between 40 and 60 €/m2.
In light of the above analyses, a module presented in [28] is characterized by a very high P2W indicator equal 130 W/kg. Due to utilizing a thinner HJT (heterojunction) cells, the module has gained high power and flexibility. The authors also claim that it is possible to achieve 250 W/kg. The module was implemented in different applications like boats and tents. However, it has not been tested according to any standard.

1.2. The Aim of the Study

In this paper, four prototype silicon lightweight modules manufactured by the Xdisc S.A. are presented. Their structures are based on unique material selection. These modules exhibit high values of indicators introduced in [27]. In addition, they have successfully passed most of the test sequences described in the IEC 61215 and IEC 71730 standards. Therefore, the prototypes yield great promise to be applied to low load capacity buildings. The aim of this work is to describe the prototypes’ properties and characteristics based on indoor and outdoor tests conducted in KEZO Research Centre PAS. Furthermore, by the means of performed measurements, simulations of the prototype PV system in PVsyst have been executed to conduct economic analyses in comparison with the standard solar system for a low load capacity building. They have showed that the most promising prototype, namely the prototype 4, has the above-mentioned indicators better than average and even though the PV system based on it is less profitable than PV system based on conventional modules, when simplicity and swiftness of installation are key factors, the prototype system can be the best solution regardless of higher initial costs.

2. Materials and Methods

2.1. Samples

The object of the study was four prototype silicon lightweight modules manufactured by the Xdisc S.A. The samples were marked from 1 to 4. All prototypes are frameless and glass-free. Thanks to mounting tabs they can be installed using a tape as well as a standard racking for different roof types. Figure 1 presents the visual appearance of each prototype. Prototypes 1 (P1) and 2 (P2) are fabricated with the Nomex aramid honeycomb cores making them rigid, whereas prototypes 3 (P3) and 4 (P4) are made with a carbon fiber reinforced polymer core and a glass epoxy rigid laminate core, respectively, making them semi-flexible. Detailed prototypes structures are shown in Figure 2 and their basic properties are summarized in Table 1.

2.2. Manufacturing Process

The manufacturing process of all prototypes begins with respective substrate cutting on a CNC machine to a requested size and shape. Other materials like EVA, ETFE (frontsheet), and polyester film are prepared in a ROBUST LQL15 automatic foil cutting machine. Bus ribbons are cut to size on a ribbon cutting machine—ECOCUT 01B. Integrated back contact (IBC) solar cells are soldered manually due to lack of automatic machinery at the current production stage. Each cell passes visual quality check by the operator. Honeycomb structure substrates for prototype 1 and 2 are placed on a heating plate in a vacuum chamber to remove internal gasses. This is done in 100 °C for the time of 1340 s. All mentioned materials are delivered to a layup station where they are placed on the 3 mm thick aluminum carrier plates covered with non-sticky ETFE glass fiber sheet. Layers are lined up in order presented in Figure 2 starting from rear side. Additional fine ETFE mesh is placed on the top to texturize the frontsheet during lamination. Due to lower thermal conductivity of prototype 1 and 2 substrates, they have to be laminated active side down. The lamination proceeds according to sequences described in Table 2.
After the process, laminates cool down for approximately 15 min. Next, the laminates are examined by visual inspection and taken through electroluminescence and surface tension test. Then, laminates are trimmed, and junction boxes are fastened. Finally, ready modules go through flash-test at STC.

2.3. IEC Standards Tests

The prototypes were subjected to the IEC 61215 and the IEC 61730 standards full test sequences performed by the Midsummer AB (Elektronikhöjden 6, 175 43 Järfälla, Sweden). Prototypes 2 and 4 successfully passed tests, while prototype 3 passed conditionally. The prototype 1 failed thermal cycling, humidity-freeze, robustness of termination, and wet leakage current tests from the IEC 61215 standard and also accessibility, cut susceptibility, impulse voltage, and dielectric withstand tests from the IEC 61730 standard due to too low resistance between inner circuit and external parts or test fixture. After conducting these tests, prototypes have been slightly modified. The manufacturer utilized cells of lower power and thinner ribbons to reduce costs. In the case of prototypes 1 and 3, a layer of thin PET insulation foil was added to the modules’ structures to improve resistance. Additionally, substrate design was modified by implementation of non-conducting parts near the PV module terminals.

2.4. Measurements and Equipment

The sequence of tests, as shown in Figure 3, was conducted. To properly model prototypes in PVsyst electrical parameters at different irradiance level, temperature coefficients, absorptivity, and thermal loss factors had to be specified and input to the software. Next, results of the simulation were utilized to perform economic analysis.

2.4.1. Electrical Parameters Determination

Because of slight changes in prototype structures, including the decrease of cells’ power, the maximum power of the samples at different conditions had to be determined. As a light source, a steady-state large area solar simulator (LASS) LA150200 by Eternal Sun was used. The device is of AAA class in accordance with the IEC 60904-9: 2007 standard. It can work in 3 modes: PV-1000, PV-800, and PV-200, where the number corresponds to the irradiance level in the spectral range of a silicon cell. An I-V curve tracer system attached to the simulator consists of two digital multimeters Keysight Agilent 34410A, a source meter Keithley 2401, an electronic load EA-EL 9750-50 and a PC unit. It allows to determine current-voltage (I-V) curves and the following parameters:
  • Power output Pmax;
  • Short-circuit current Isc;
  • Open-circuit voltage Voc;
  • Current at MPP (Maximum Power Point) Impp;
  • Voltage at MPP Vmpp;
  • Fill factor FF;
  • Efficiency η.
During the power determination, the temperature of every prototype was measured in the middle of its rear side by a resistance temperature detector Platinum 100 Ohms (Pt100). In case of prototypes 1 and 2 the sensor was placed on the front side because of expected low thermal conductivity of their backsheets. To minimize a mismatch factor, a silicon reference cell (by ReRa Solutions) was used for irradiance measurements.
For every kind of prototype an I-V characteristic was measured at STC (Standard Test Conditions) in compliance with the IEC 61215 standard. The same measurement was repeated, adjusting irradiance to 800 and 200 W/m2. Due to inability of temperature coefficients determination, values from the IEC tests were taken.

2.4.2. Thermography

The absorptivity was assumed on the basis of the emissivity (according to Kirchhoff’s law), determined during the thermography investigation of test installations (using a Flir GF320 IR camera).
In three regions of Poland of different insolation, the prototype PV systems have been installed. These locations are Jabłonna, Świdnik, and Browina. According to Köppen–Geiger climate classification system, Jabłonna experiences a warm temperate climate denoted by Cfb, while Świdnik and Browina have snow humid climate denoted by Dfb [29]. In each location, some of the prototype modules are mounted on a flat roof model (slope 3.6°) and some on pitched roofs models with different roofing (slope 28°). The azimuth of all installations is 0°, which corresponds to the south direction. There are 28 modules in Jabłonna (7 of each prototype) and 21 modules in Świdnik and Browina each (prototypes 1, 2, and 4). An optimizer is attached to every module to enable a performance analysis of individual devices. In each location there are sensors measuring ambient temperature, wind velocity and irradiance. The systems have worked from September 2020 and after a few months of outdoor exposure no degradation or deterioration has been observed despite periods of frost and intense snowfall. However, this type of design is particularly vulnerable to humidity ingress, decolorization, etc., and long-term monitoring is planned. The test systems were built to compare real yields of prototype installations with results obtained from simulations in PVsyst basing on actual measured meteorological data. However, due to relatively short period of data collection no reliable simulation can be performed for now. Therefore, the abovementioned comparison will be a subject of the next paper.
In September, on a sunny day, the system in Jabłonna was investigated using thermography. Over the test, ambient conditions fluctuated in ranges specified in Table 3. The condition was stable enough to regard measurements as reliable.
For all prototypes after determination of reflected temperature, the emissivity was ascertained in the following manner. A piece of black tape of known emissivity was stuck on a central cell of one module. Then, the tape temperature and the cell temperature next to the tape sticking point were measured by the camera. Next, the value of emissivity was varied until the camera displayed cell temperature close to the tape temperature.

2.4.3. Thermal Parameters Determination

The thermal parameters were determined based on temperature measurements of the front and rear side of each prototype while warming it up under a constant heat flux. As a heat source, the abovementioned simulator was used. The temperature was measured by Omega K-type thermocouples connected to a Moxa ioLogik e1262 data acquisition system and then to a computer with appropriate software. Before starting the test, the ambient temperature Ta in the laboratory was being stabilized for about 1 h with the simulator operating in the PV-1000 mode. This temperature levelled at 30 °C. All prototypes were kept in the room, which allowed them to achieve thermal equilibrium with the surroundings. Next, every sample was placed on a table set at an angle of 0° to the horizontal and thermocouples were attached to it. A 10 cm long spiral section of a thermocouple was fixed to the front surface with a polyester tape in such a way that the center of the spiral was placed in the middle of the cell. In turn, a 10 cm straight section of the thermocouple was fixed to the rear surface with the polyester tape, so that it corresponded to the diagonal of the cell on which the upper thermocouple was attached. An additional thermocouple for measuring the ambient temperature was located approximately 50 cm under the table with a prototype. To minimize the impact of shading caused by the front tape during the measurements, the sample circuit was in open circuit. Next, the test table with the module was placed under the simulator. The temperature of the front and rear sides as well as the ambient temperature were measured with an interval of 1 s until they reached a steady state reading. Over the whole test, a wind generator attached to the table was turned on to stabilize the temperature of the rear surface of the module as well as the ambient temperature. Thanks to this, the influence of air movements caused by the simulator was limited. The above procedure was performed for each prototype.
All tests have been performed by the authors in the Energy Conversion and Renewable Resources Research Centre of Polish Academy of Sciences.

3. Results and Discussion

3.1. Electrical Characteristics Results

Results of I-V measurements are summarized in Table 4. Every module was tested three times and the presented results are average values (except measurements at 800 W/m2; due to technical problems there were only 2 measurement series). Shunt (indicated as Rsh) and series (indicated as Rs) resistance were estimated by the software based on the curve slopes. In the last two rows of every table, a standard uncertainty (indicated as u(x)) and an expanded uncertainty (indicated as U(x)) for each parameter are given. A standard uncertainty of measurements has been determined according to [30,31]. To obtain expanded uncertainties, the standard uncertainties have been multiplied by a coverage factor equal 2. This factor provides a level of confidence of 95%, assuming a normal probability distribution of measurements. The standard uncertainties are expressed in % with two decimal places and the expanded uncertainties with one decimal place rounded. Because the highest value of the expanded uncertainty is equal to 4.1%, it can be stated that the measurements are reliable.
All prototypes indicate relatively high efficiency, exceeding 19.5% at STC. Unfortunately, the analysis of I-V characteristic of the prototype 3 (see: Figure 4) shows meaningful deviations in its shape, probably because of the presence of microcracks. Therefore, the power of the prototype 3 is significantly lower than that of prototype 4, despite having the same number of cells. Presumably, without defects its power would be also equal to around 240 Wp. The I-V characteristics of the other prototypes do not show any deviations. Omitting the prototype 3 issue, the power of modules is more or less 4–6% lower than the sum of individual cells’ power declared by SunPower. It suggests the manufacturing process should be improved, owning to the fact that a typical cell-to-module loss does not exceed 3%. A similar conclusion can be also drawn from the study of shunt resistance values, which are relatively low. By comparison, all prototypes indicate average series resistance. The improvements should include i.a. PV cells initial sorting, since SunPower sells given cell type in power range. Additionally, more accurate soldering of PV cells and more precise control after soldering by additional EL test are advisable. By comparison, all prototypes indicate average series resistance. Above all, the prototypes present satisfactory FF which proves modules to be up to standards. Both shunt and series resistance grow when irradiance declines. In turn, the power of all prototypes drops linearly with the decrease of irradiance, which is in line with expectations.
Relying on performed tests, the following values of abovementioned indicators were calculated as presented in Table 5.
All prototypes indicate a typical for lightweight modules area density of approximately 3.5 kg/m2 with Power-to-Weight Ratio, exceeding well beyond the 40 W/kg threshold and reaching in one case almost 58 W/kg.

3.2. Thermal Characteristics Results

Based on the measured temperature values, graphs showing the change in temperature of the front and rear side of individual modules within 30 min of placing a given prototype under the simulator were plotted (see: Figure 5a). The temperature of all samples stabilized after approximately 10–15 min, which is expected according to the literature [32,33,34,35]. Comparing the individual modules, it can be seen that the prototypes 1 and 2 reached the steady state temperature of the front side exceeding 80 °C, which is about 7–8 °C higher than the other two prototypes. In comparison, the opposite trend occurred with the rear surface. Prototypes 3 and 4 heated up to significantly higher temperatures, reaching a maximum of 62.2 and 68.9 °C, respectively, while prototype 1 and 2 stabilized at around 50 °C. High temperature difference between the front and rear surfaces of prototype 1 and 2 indicates their poor conductivity, which is an expected result of the backsheet design of both samples. Due to slight changes in the ambient temperature during the tests, the temperatures of the prototypes related to this temperature are presented in Figure 5b. On this basis, the time constant τ, understood as the time after which a temperature is equal to:
Tτ = T1 + 0.632 [(T2Ta2) − (T1Ta1)]
is reached, was determined for each samples’ front and rear sides, and is presented in Table 6. Index 1 denotes the initial state and index 2 denotes the end state.
The comparison of the time constants shows that both sides of prototype 1 warmed up the slowest, and at the same time the difference between the time constants for the front and rear surfaces is the largest of all modules, so prototype 1 has the highest heat capacity. Prototype 4 has the shortest time constants, while the smallest difference between the time constant for the front and rear surfaces occurs for prototype 3. On this basis, it can be concluded that prototype 4 reacts most quickly to changes. Assuming repeatability of the conducted measurements, the reasons for the different behavior of the modules should be sought in their material properties. Prototypes 1 and 2 have insulating characteristics due to the honeycomb backsheet structure. As a result, it leads to an increase in the temperature of the front surface and a relatively low temperature of the rear side. Therefore, although the rate of increase of the front surface temperature of all modules is similar, these two prototypes have reached a steady state later, so their time constants are also greater. It is worth noting, however, that the time constants for the front do not differ as much as the time constants for the rear.
Based on the measurements, the following assumptions were made to calculate thermal parameters of prototypes:
  • One-dimensional model of heat transfer;
  • Negligible heat transfer by module radiation;
  • Module uniformity i.e., without division into layers;
  • Consistency of the incident irradiance reaching the surface of each module;
  • The same value of the convective heat transfer coefficient for the front and back surface;
  • The same value of frontsheet transmissivity for all modules (assumed 0.93).
The convective heat transfer coefficient was determined using an energy balance equation. Energy dissipated from module surfaces to ambient air is equal to energy supplied by incident irradiance [36]:
α (Tfront + Trear − 2Ta) = G ε t,
where α is the convective heat transfer coefficient, G is irradiance on the module generated by the solar simulator (full spectrum), ε is an absorption coefficient (absorptivity), and t is a transmissivity of solar radiation. A thermal conductivity coefficient was calculated comparing a heat flux conducted from the front to the rear surface and a heat flux dissipated to air form the rear surface:
k/d (TfrontTrear) = α (TrearTa),
where k is the thermal conductivity coefficient, d is the module thickness. The specific heat capacity c was evaluated by subtracting the integrated heat rejected from the module and the integrated heat supplied by the simulator during the stabilization process. From here, thermal effusivity e and diffusivity h could be calculated. Table 7 shows the results of calculations of convective heat transfer coefficient, heat conductivity coefficient, specific heat capacity, thermal effusivity, and diffusivity of each module. It should be emphasized that calculations are based on some simplifications and may in fact differ slightly from the actual values.
Prototypes 1 and 2 have the largest specific heat capacity and the lowest heat conductivity coefficient, which results in a high temperature difference between their front and rear sides, as well as longer time constants. Since prototype 2 has the lowest thermal effusivity and diffusivity, it has the worst thermal characteristics. Prototype 4 has the best heat conductivity coefficient which is why it has the smallest temperature difference between both sides. It also has the lowest specific heat capacity and therefore the lowest time constant. It has the best thermal effusivity and diffusivity, consequently it has the best thermal characteristics.

3.3. Simulation in PVsyst

To compare performance of PV systems based on prototype and conventional modules, simulations in PVsyst 7.1.0 were performed. As a place of assembly, a theoretical hall with membrane roof of 5°-slope in Warsaw was considered. Due to low roof bearing capacity the PV array is of west-east orientation (azimuth 90° and −90°). An installed capacity of 50 kWp, a microinstallation limit in accordance with Polish regulations, was assumed. Such an installation allows for net-metering with factor of 0.7 i.e., 70% of electric energy injected into the grid can be later consumed without any additional charges. It was considered the hall draws relatively constant power of 30 kW during a two-shift operation. Therefore, a high rate (approx. 90%) of electricity delivered by PV system is used on site. The system architecture is based on SolarEdge optimizers. The inverter model is SE40K-EU and the optimizer models are P320 for the prototypes 1 and 2 and P370 for the others. The systems consist of 230, 234, 206, and 207 modules for the prototypes from 1 to 4, respectively. The conventional reference installation contains 147 generic half-cut monocrystalline modules of 340 Wp. It is supposed that the power of prototype 4 would be equal to 241 Wp if there were no defects. In order to adequately reflect the meteorological conditions in the location, weather data from the Meteonorm 7.3 database was imported. This database is an average of weather data from the period of 1991–2010. When introducing prototypes to the program database, the values of electrical and thermal parameters measured and calculated during previous tests were used. The temperature coefficients were taken from the previously described IEC standards tests. In addition, the following assumptions were made for the analysis:
  • Solar radiation model: Perez-Ineichen;
  • PV module model: single-diode;
  • Lower temperature for absolute voltage limit: −20 °C;
  • Albedo: 0.7 for January, February and December; 0.2 for the other months;
  • Soiling losses: 3%;
  • Roof-parallel mounting;
  • No horizon line;
  • Thermal loss coefficient: 20 W/(m2∙K) for a reference system; according to the tests for the prototypes systems;
  • LID (Light Induced Degradation) loss: 2% for the reference modules; 0% for the prototypes (as declared by the cell supplier);
  • AC wiring: 16 mm2; DC wiring: 6 mm2;
  • Spectral correction: default for monocrystalline technology;
  • Prototypes are equipped with edge junction boxes.
As shown in Table 8, the capacity of all systems is similar, while the annual yields of the prototypes installations are lower from 0.6 to 0.8 MWh compared to the reference. It corresponds to 1–1.7% worse normalized yields. Hence, simulations proved that the prototypes have comparable performance to a conventional system. It is worth to mention that due to the idealization (especially with no far or near shading), all normalized yields are higher than typical in Polish conditions for W-E PV systems.
When analyzing detailed losses diagrams generated by PVsyst, one can notice the main divergence between the prototypes and the conventional modules lies in the IAM (Incident Angle Modifier) factor, the LID effect, and losses due to temperature and low irradiance. The first aspect comes from difference in front surfaces characteristics in favor of the standard module. The vital advantage of prototypes is that they are LID-free. However, other factors indicate worse values for the prototypes. The loss due to temperature is greater, presumably because of lower temperature coefficients and very poor heat transfer from the backside caused by mounting manner. In turn, the irradiance loss may be higher because, thanks to the measurements, prototypes are modelled more precisely at vast irradiance levels, so in reality no difference could occur.

3.4. Economic Analysis

Currently, prices of all prototypes are extremely high and equal 630, 582, 778, and 487 € per unit, respectively. Their costs depend mainly on cells and cores which are custom-made. However, if mass production were launched, according to the manufacturer costs would decrease significantly, especially in case of prototypes 3 and 4. Likely, it would require the use of less powerful cells, resulting in more or less 9.5% total power drop. Additionally, the removal of mounting tabs is planned. Other optimization steps include the using an edge junction box instead of the rear one and a reduction of border area. Finally, it should lead to a price of 179 € and power of 220 Wp (at worst) for the prototype 4, which seems to be the most promising. Therefore, for the economic analysis the optimized prototype 4 was chosen. It is expected that a PV system based on it will have about 2% lower normalized yield than presented in Table 8 for the original prototype 4. When it comes to the conventional installation, due to low load bearing roof capacity an additional steel construction which transfers the load from the roof to walls is needed. Therefore, it was estimated that mounting 25 modules requires about 1 t of steel profiles. Steel price fluctuates but it equals at present approx. 735 € per ton. In addition, the following assumptions were made for this purpose:
  • Discount rate: 5%;
  • Initial electricity price: 100 €/MWh;
  • Electricity price change: 3%/a (as inflation rate);
  • Financing: own resources;
  • OPEX: negligible (except the inverter replacement after 12 year);
  • PV modules power drop: 0.5%/a;
  • Analyzed period: 20 years;
  • Depreciation: 7% for the PV system, 10% for the hall reinforcement;
  • Residual value: 20% of initial value;
  • Income tax: 9%;
  • All prices are net values;
  • 90% of generated electricity consumed on site, the rest with factor of 70% due to net-metering.
CAPEX was calculated based on average costs of PV system in Poland in 2020 [37] as shown in Table 9. Mounting hardware for prototype system is limited only to acrylic two-sided tape. Labor cost in case of the prototype system was estimated as 40% less than in case of the conventional system [4]. Other costs depend on the number of modules because of wiring length and electric apparatus, etc.
Total cost of the prototype installation is 18% more expensive per kWp installed than the conventional. Calculations show that both installations are profitable (see: Table 10). NPV for the conventional installation comes to 25,532 € and for the prototype to 15,899 €. For NPV of the prototype installation to be on par, prototype module cost has to be 129 €. Nevertheless, sometimes there could be no possibility of mounting the conventional system. It is also worth noticing that simplicity and swiftness of mounting in some cases could be a great advantage, exceeding economic incentive.

4. Conclusions

Four prototype silicon lightweight modules dedicated for roofs with low bearing capacity manufactured by the Xdisc S.A have been investigated. They are characterized by novel material selection. Their electrical and thermal properties were determined. All prototypes have efficiency exceeding 19.5% at STC. Power of the modules is from 4% to 6% lower than aggregate of individual cells, which leaves room for manufacturing process improvement. Despite this, the prototypes present satisfactory FF. The area density of all prototypes is about 3.5 kg/m2 which is typical for lightweight modules. Their Power-to-Weight Ratio exceeds 40 W/kg threshold and reaches in one case almost 58 W/kg. Prototypes 1 and 2 have the largest specific heat capacity (360, 317 [J/(kg∙K)]) and the lowest heat conductivity coefficient (0.091, 0.064 [W/(m∙K)]), which results in a high temperature difference between their front and rear sides (29.6, 31.5 [K]). Therefore, their time constant is over 2 and 3 min for front and rear surface, respectively. Prototype 4 has the best heat conductivity coefficient (0.34 [W/(m∙K)]) which is why it has the smallest temperature difference between both sides (7 [K]). It also has the lowest specific heat capacity (209 [J/(kg∙K)]). Hence, its time constant is about 2 min.
Based on simulations of an example PV system on the hall of low bearing capacity performed in PVsyst, it can be seen that at current prices the prototype system is less profitable than the conventional system. NPV after 15 years is 15,899 and 25,532 €, respectively. Hence, the major weakness is manufacturing cost. Therefore, future development should focus on cost reduction, so mainly on finding reasonable substitutes of currently used materials. However, when simplicity and swiftness of installation are key factors, the prototype system could prove advantageous and be the best solution regardless of higher CAPEX. Moreover, in some cases lightweight modules are the only possible option.

Author Contributions

Conceptualization, K.M., P.Z., J.T., M.B. and P.G.; methodology, K.M., P.Z. and M.B.; formal analysis, K.M., P.Z. and S.B.; investigation, K.M. and P.Z.; resources, J.T. and S.B.; data curation, K.M. and P.Z.; writing—original draft preparation, K.M. and P.Z.; writing—review and editing, J.T., M.B., P.G. and S.B.; visualization, K.M. and P.Z.; supervision, P.G.; funding acquisition, J.T. All authors have read and agreed to the published version of the manuscript.

Funding

This work was financially supported by Polish National Centre for Research and Development under grant POIR.01.01.01-00-0050/17.

Institutional Review Board Statement

Not applicable.

Informed Consent Statement

Not applicable.

Data Availability Statement

The data presented in this study are available on request from the corresponding author. The data are not publicly available due to the prototypes’ manufacturer privacy policy.

Acknowledgments

The authors would like to thank Jörg Verstraete for the language help.

Conflicts of Interest

The authors declare no conflict of interest.

References

  1. Perzyński, M. Moc Zainstalowana Fotowoltaiki w Polsce przekroczyła 3600 MW. Available online: https://biznesalert.pl/polska-fotowoltaika-moc-zainstalowana-pse/ (accessed on 22 January 2021).
  2. Available online: https://mojprad.gov.pl/ (accessed on 12 January 2021).
  3. Martins, A.C.; Chapuis, V.; Virtuani, A.; Perret-Aebi, L.-E.; Ballif, C. Hail Resistance of Composite-Based Glass-Free Lightweight Modules for Building Integrated Photovoltaics Applications. In Proceedings of the 33rd European Photovoltaic Solar Energy Conference and Exhibition, Amsterdam, The Netherlands, 25–29 September 2017; pp. 2604–2608. [Google Scholar]
  4. Holton, E.; Halbe, A.; Garney, A.; Whitbeck, J.; Sharpe, K.; Metacarpa, D.; Haldar, P. Cost and market analysis of integrative lightweight PV systems for low-slope commercial rooftops. In Proceedings of the 2014 IEEE 40th Photovoltaic Specialist Conference, PVSC 2014, Denver, CO, USA, 8–13 June 2014. [Google Scholar]
  5. Zhang, F.; Deng, H.; Margolis, R.; Su, J. Analysis of distributed-generation photovoltaic deployment, installation time and cost, market barriers, and policies in China. Energy Policy 2015, 81, 43–55. [Google Scholar] [CrossRef] [Green Version]
  6. Ferroni, F.; Hopkirk, R.J. Energy Return on Energy Invested (ERoEI) for photovoltaic solar systems in regions of moderate insolation. Energy Policy 2016, 94, 336–344. [Google Scholar] [CrossRef] [Green Version]
  7. Binkley, A. Solar Technology Reference Guide; NAIOP Research Foundation: Herndon, VA, USA, 2012. [Google Scholar]
  8. PN-B-02010:1980. Obciążenia w Obliczeniach Statycznych-Obciążenie Śniegiem; Polish Committee for Standardization: Warsaw, Poland.
  9. Halbe, A.; Sharpe, K.; Housser, G.; Metacarpa, D.; Haldar, P. Demonstration of PV Modules with Lightweight Mounting Systems on Commercial Rooftops. In Proceedings of the 2015 IEEE 42nd Photovoltaic Specialist Conference (PVSC), New Orleans, LA, USA, 14–19 June 2015; pp. 1–4. [Google Scholar]
  10. Housser, G.; Halbe, A.; Sharpe, K.; Haldar, P.; Babineau, F. Lightweight, zero-penetration, pre-formed support molds adapted for rigid thin-film solar modules. In Proceedings of the 2015 IEEE 42nd Photovoltaic Specialist Conference, PVSC 2015, New Orleans, LA, USA, 14–19 June 2015. [Google Scholar]
  11. Martins, A.C.; Chapuis, V.; Virtuani, A.; Ballif, C. Robust Glass-Free Lightweight Photovoltaic Modules With Improved Resistance to Mechanical Loads and Impact. IEEE J. Photovolt. 2019, 9, 245–251. [Google Scholar] [CrossRef]
  12. Berger, K.; Cueli, A.B.; Boddaert, S.; Del Buono, S.; Delisle, V.; Fedorova, A.; Frontini, F.; Hendrick, P.; Inoue, S.; Ishii, H.; et al. International definitions of BIPV; Rep. IEA-PVPS T9-18 2018; IEA Photovoltaic Power Systems Programme: Munich, Germany, 2018. [Google Scholar]
  13. Izu, M.; Ovshinsky, H.C.; Whelan, K.; Fatalski, L.; Ovshinsky, S.R.; Glatfelter, T.; Younan, K.; Hoffman, K.; Banerjee, A.; Yang, J.; et al. Lightweight flexible rooftop PV module. In Proceedings of the 1994 IEEE 1st World Conference on Photovoltaic Energy Conversion-WCPEC (A Joint Conference of PVSC, PVSEC and PSEC), Waikoloa, HI, USA, 5–9 December 1994; Volume 1, pp. 990–993. [Google Scholar]
  14. Zubillaga, O.; Arrizabalaga, I.; Cano, F.; Garice, S.; Hoces, I.; Imaz, N.; Imbuluzqueta, G.; Roman, E.; Seoane, J.M.V.; de Yurrita, N. Glass-Free PV Module Encapsulation with Aluminum and Transparent Fibre Reinforced Organic Matrix Composite Material. In Proceedings of the 27th European Photovoltaic Solar Energy Conference and Exhibition, Frankfurt, Germany, 24–28 September 2012. [Google Scholar]
  15. Olson, C.; Geerligs, B.; Goris, M.; Bennett, I.; Clyncke, J. Current and Future Priorities for Mass and Material in Silicon PV Module Recycling. In Proceedings of the 28th European Photovoltaic Solar Energy Conference and Exhibition, Paris, France, 30 September–4 October 2013; pp. 1–5. [Google Scholar]
  16. Myong, S.Y.; Jeon, L.S.; Kwon, S.W. Superstrate type flexible thin-film Si solar cells using flexible glass substrates. Thin Solid Film. 2014, 550, 705–709. [Google Scholar] [CrossRef]
  17. Haug, F.J.; Terrazzoni-Daudrix, V.; Söderström, T.; Niquille, X.; Bailat, J.; Ballif, C. Flexible Microcrystalline Silicon Solar Cells on Periodically Textured Plastic Substrates. In Proceedings of the 21st European Photovoltaic Solar Energy Conference, Dresden, Germany, 4–8 September 2006. [Google Scholar]
  18. Ghosh, A. Potential of building integrated and attached/applied photovoltaic (BIPV/BAPV) for adaptive less energy-hungry building’s skin: A comprehensive review. J. Clean. Prod. 2020, 276, 123343. [Google Scholar] [CrossRef]
  19. Biyik, E.; Araz, M.; Hepbasli, A.; Shahrestani, M.; Yao, R.; Shao, L.; Essah, E.; Oliveira, A.C.; del Caño, T.; Rico, E.; et al. A key review of building integrated photovoltaic (BIPV) systems. Eng. Sci. Technol. Int. J. 2017, 20, 833–858. [Google Scholar] [CrossRef]
  20. Martins, A.C.; Chapuis, V.; Sculati-Meillaud, F.; Virtuani, A.; Ballif, C. Light and durable: Composite structures for building-integrated photovoltaic modules. Prog. Photovoltaics: Res. Appl. 2018, 26, 718–729. [Google Scholar] [CrossRef]
  21. Martins, A.C.; Chapuis, V.; Virtuani, A.; Li, H.-Y.; Perret-Aebi, L.-E.; Ballif, C. Thermo-mechanical stability of lightweight glass-free photovoltaic modules based on a composite substrate. Sol. Energy Mater. Sol. Cells 2018, 187, 82–90. [Google Scholar] [CrossRef]
  22. Lisco, F.; Virtuani, A.; Ballif, C. Optimisation of the Frontsheet Encapsulant for Increased Resistance of Lightweight Glass-Free Solar PV Modules. In Proceedings of the 37th European Photovoltaic Solar Energy Conference and Exhibition, Lisbon, Portugal, 7–11 September 2020. [Google Scholar]
  23. Lisco, F.; Martins, A.C.; Virtuani, A.; Ballif, C. Glass-Free Lightweight Solar Modules for Integrated Photovoltaics: The Use of Velcro as an Alternative Mounting System. In Proceedings of the 37th European Photovoltaic Solar Energy Conference and Exhibition, Lisbon, Portugal, 7–11 September 2020; pp. 1108–1111. [Google Scholar]
  24. Kajisa, T.; Miyauchi, H.; Mizuhara, K.; Hayashi, K.; Tokimitsu, T.; Inoue, M.; Hara, K.; Masuda, A. Novel lighter weight crystalline silicon photovoltaic module using acrylic-film as a cover sheet. Jpn. J. Appl. Phys. 2014, 53, 92302. [Google Scholar] [CrossRef]
  25. Nussbaumer, H.; Klenk, M.; Keller, N. Small Unit Compound Modules: A New Approach for Light Weight PV Modules. In Proceedings of the 32nd European Photovoltaic Solar Energy Conference and Exhibition, Munich, Germany, 20–24 June 2016; pp. 56–60. [Google Scholar]
  26. Schindler, S.; Götz, D.; Dassler, D. Lightweight PV Module Approach—Field Test Study and Yield Evaluation. In Proceedings of the 36th European Photovoltaic Solar Energy Conference and Exhibition, Marseille, France, 9–13 September 2019; pp. 54–57. [Google Scholar]
  27. Schindler, S.; Götz, D.; Schneider, J. Beyond Watt per Module and Costs per Watt–New Weight Related Parameters for Photovoltaic Modules. In Proceedings of the 35th European Photovoltaic Solar Energy Conference and Exhibition, Brussels, Belgium, 24–27 September 2018; pp. 1790–1793. [Google Scholar]
  28. Abramov, A.D.; Andronikov, K.; Emtsev, D.; Orekhov, I.; Shakhray, E.; Terukov, E.; Terukova, S.Y. Super Lightweight Flexible HJT Solar Panels. In Proceedings of the 35th European Photovoltaic Solar Energy Conference and Exhibition, Brussels, Belgium, 24–27 September 2018; pp. 1227–1229. [Google Scholar]
  29. Chen, D.; Chen, H.W. Using the Köppen classification to quantify climate variation and change: An example for 1901–2010. Environ. Dev. 2013, 6, 69–79. [Google Scholar] [CrossRef]
  30. Müllejans, H.; Zaaiman, W.; Galleano, R. Analysis and mitigation of measurement uncertainties in the traceability chain for the calibration of photovoltaic devices. Meas. Sci. Technol. 2009, 20, 075101. [Google Scholar] [CrossRef]
  31. Dirnberger, D.; Kraling, U. Uncertainty in PV Module Measurement—Part I: Calibration of Crystalline and Thin-Film Modules. IEEE J. Photovoltaics 2013, 3, 1016–1026. [Google Scholar] [CrossRef]
  32. Kurz, D.; Nawrowski, R. Thermal Time Constant of PV Roof Tiles Working under Different Conditions. Appl. Sci. 2019, 9, 1626. [Google Scholar] [CrossRef] [Green Version]
  33. Marańda, W.; Piotrowicz, M. Extraction of Thermal Model Parameters for Field-Installed Photovoltaic Module. In Proceedings of the 2010 27th International Conference on Microelectronics, MIEL 2010-Proceedings, Nis, Serbia, 16–19 May 2010. [Google Scholar]
  34. Teubner, J.; Buerhop, C.; Pickel, T.; Hauch, J.; Camus, C.; Brabec, C.J. Quantitative assessment of the power loss of silicon PV modules by IR thermography and its dependence on data-filtering criteria. Prog. Photovoltaics: Res. Appl. 2019, 27, 856–868. [Google Scholar] [CrossRef]
  35. Marańda, W.; Piotrowicz, M. Efficiency of maximum power point tracking in photovoltaic system under variable solar irradiance. Bull. Pol. Acad. Sci. Tech. Sci. 2014, 62, 713–721. [Google Scholar] [CrossRef]
  36. Kaldellis, J.K.; Kapsali, M.; Kavadias, K.A. Temperature and wind speed impact on the efficiency of PV installations. Experience obtained from outdoor measurements in Greece. Renew. Energy 2014, 66, 612–624. [Google Scholar] [CrossRef]
  37. Rynek Fotowoltaiki w Polsce; Institute for Renewable Energy: Warsaw, Poland, 2020.
Figure 1. Front overview of prototype modules: (a) P1; (b) P2; (c) P3; (d) P4.
Energies 14 02239 g001
Figure 2. Prototypes layers in detail: (a) P1; (b) P2; (c) P3; (d) P4.
Energies 14 02239 g002
Figure 3. Summarization of methodology.
Energies 14 02239 g003
Figure 4. I-V characteristics.
Energies 14 02239 g004
Figure 5. Module (a) front, rear, and ambient temperatures (b) front and rear temperature related to ambient temperature during tests.
Energies 14 02239 g005
Table 1. Prototypes basic properties.
ParameterUnitPrototype 1Prototype 2Prototype 3Prototype 4
Width (including mounting tabs)mm850850853853
Lengthmm1300130014601460
Thicknessmm~6~6~3~4
Area (including mounting tabs)m21.081.081.161.16
Weightkg3.763.724.354.29
Area densitykg/m23.473.433.743.68
Cells configuration-6 × 106 × 106 × 116 × 11
Cell type-IBC
Cell nominal powerWp3.79
Cell manufacturer-SunPower
Number of bypass diodes-3
Frontsheet (ETFE)-Aluminium Feron translux EC100
Encaplsuant (EVA)-STR PHOTOCAP 15585P HLT
Substrate-Mikanit Nomex HC with Carbon FibreMikanit Nomex HC with Epoxy GlassMasterplatex CFRP 1000Izo-Erg TSE-5/130
Insulation foil-Aluminium Feron Px 1000-Aluminium Feron Px 1000-
Table 2. Sequence of lamination process.
StepTemperature [°C]Pressure above Membrane [mbar]Pressure below Membrane [mbar]Time [s]
Prototype 1 and 2
Prestart132---
1132<50<50300
2136500<5040
3135750<50900
41351000100035
Prototype 3 and 4
Prestart125---
1135<50<50220
2143500<5040
3143870<50800
41431000100035
Table 3. Ambient conditions during thermography investigation.
ParameterBeginningEnd
Ambient temperature20.5 °C21.8 °C
Wind velocity0.5–1.1 m/s0–0.5 m/s
Wind directionS-S-WS-S-W
Cloud cover1/8–2/81/8–2/8
Irradiance in a plane of the flat roof655–666 W/m2696–698 W/m2
Irradiance in a plane of the tilted roof790–810 W/m2866–875 W/m2
Table 4. Results of electrical parameters measurements for each prototype at different irradiance level with standard and expanded uncertainty.
1000 W/m2
No.Isc [A]Voc [V]Impp [A]Vmpp [V]Pmax [W]FF [%]Ƞ [%]Rsh [Ω]Rs [mΩ]
P16.542.36.135.821778.920.0211484
P26.442.06.035.521478.919.7230484
P36.547.16.140.024279.520.8301516
P46.547.05.641.023175.819.8302531
u(x)1.510.151.580.221.520.401.52--
U(x)3.00.33.20.43.00.83.0--
800 W/m2
No.Isc [A]Voc [V]Impp [A]Vmpp [V]Pmax [W]FF [%]Ƞ [%]Rsh [Ω]Rs [mΩ]
P15.242.34.936.017579.720.2231548
P25.141.84.835.517179.619.8491560
P35.246.94.940.019479.920.8287607
P45.246.84.541.018576.419.9422613
u(x)1.610.161.680.221.620.451.62--
U(x)3.20.33.40.43.20.93.2--
200 W/m2
No.Isc [A]Voc [V]Impp [A]Vmpp [V]Pmax [W]FF [%]Ƞ [%]Rsh [Ω]Rs [mΩ]
P11.3140.61.2234.9438019.67761755
P21.2940.31.2134.6428019.310241751
P31.2945.11.2138.9478120.213891923
P41.2944.81.1039.9447618.812121976
u(x)1.970.172.030.231.991.101.99--
U(x)3.90.34.10.53.02.24.0--
Table 5. Lightweight modules indicators calculated for each prototype.
ParameterUnitPrototype 1Prototype 2Prototype 3Prototype 4
P2WW/kg57.757.455.653.8
ADkg/m23.473.433.743.68
W2Pkg/W0.01730.01740.01800.0186
E2W%/kg5.335.304.784.62
Table 6. Front and rear temperature related to ambient temperature at the end of the measurement and time constant for each prototype.
ParameterUnitPrototype 1Prototype 2Prototype 3Prototype 4
FrontRearFrontRearFrontRearFrontRear
T2Ta°C55.626.053.622.145.833.246.539.5
τs141227122190119134101128
Table 7. Thermal parameters of each prototype.
ParameterUnitPrototype 1Prototype 2Prototype 3Prototype 4
gkg/m23.473.433.743.68
absorptivity-0.900.800.920.91
αW/(m2∙K)16.816.317.816.1
kW/(m∙K)0.0910.0640.130.34
cJ/(kg∙K)360317229209
eW∙s1/2/(m2∙K)140110190260
hmm2/s0.440.350.461.8
Table 8. Results of simulation in PVsyst for PV systems based on each prototype.
ParameterUnitPrototype 1Prototype 2Prototype 3Prototype 4
CapacitykWp49.9849.9149.9849.85
Annual yieldMWh/a45.244.444.644.6
Normalized yieldkWh/kWp905890893896
Performance Ratio (PR)%84.983.383.884.0
Table 9. Net prices in € per kWp of PV system.
ItemConventionalPrototype 4
PV modules458813
Inverter9090
Mounting hardware9038
Labour12675
Reinforcement870
Others117124
Sum9681140
Table 10. Results of economic analysis for conventional and prototype (optimized prototype 4) PV systems.
ItemUnitConventionalPrototype 4
CapacitykWp49.9849.94
YieldMWh/a45.243.7
CAPEX48,38156,944
NPV25,53215,899
Publisher’s Note: MDPI stays neutral with regard to jurisdictional claims in published maps and institutional affiliations.

