
Optimal Design of Off-Road Utility Terrain Vehicle Air Filter Intake


Abstract
:1. Introduction
2. Materials and Methods
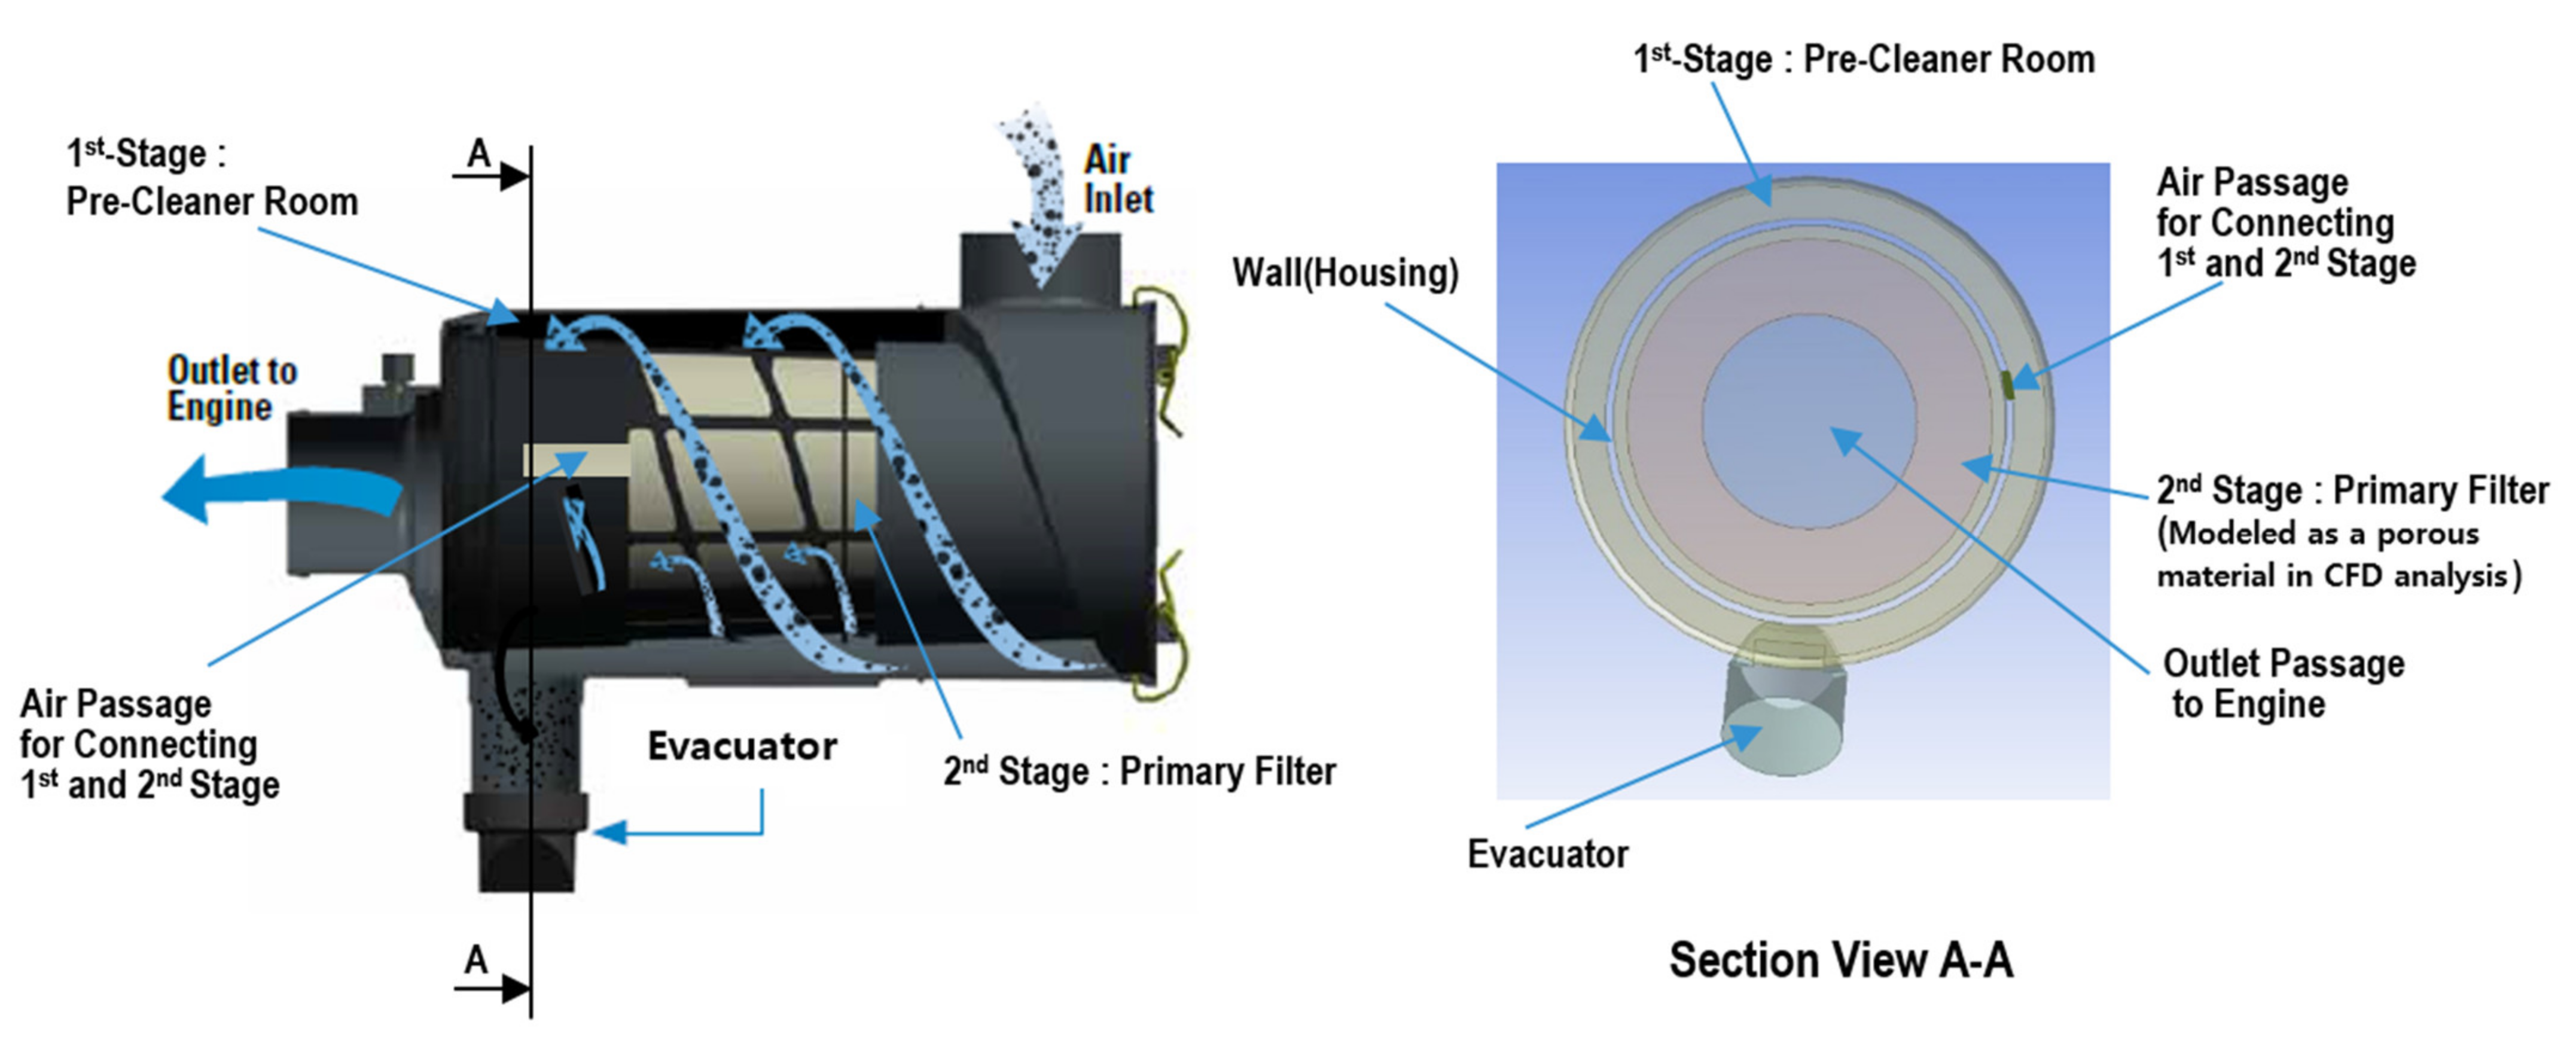
2.1. Intake System and Dust Parameters
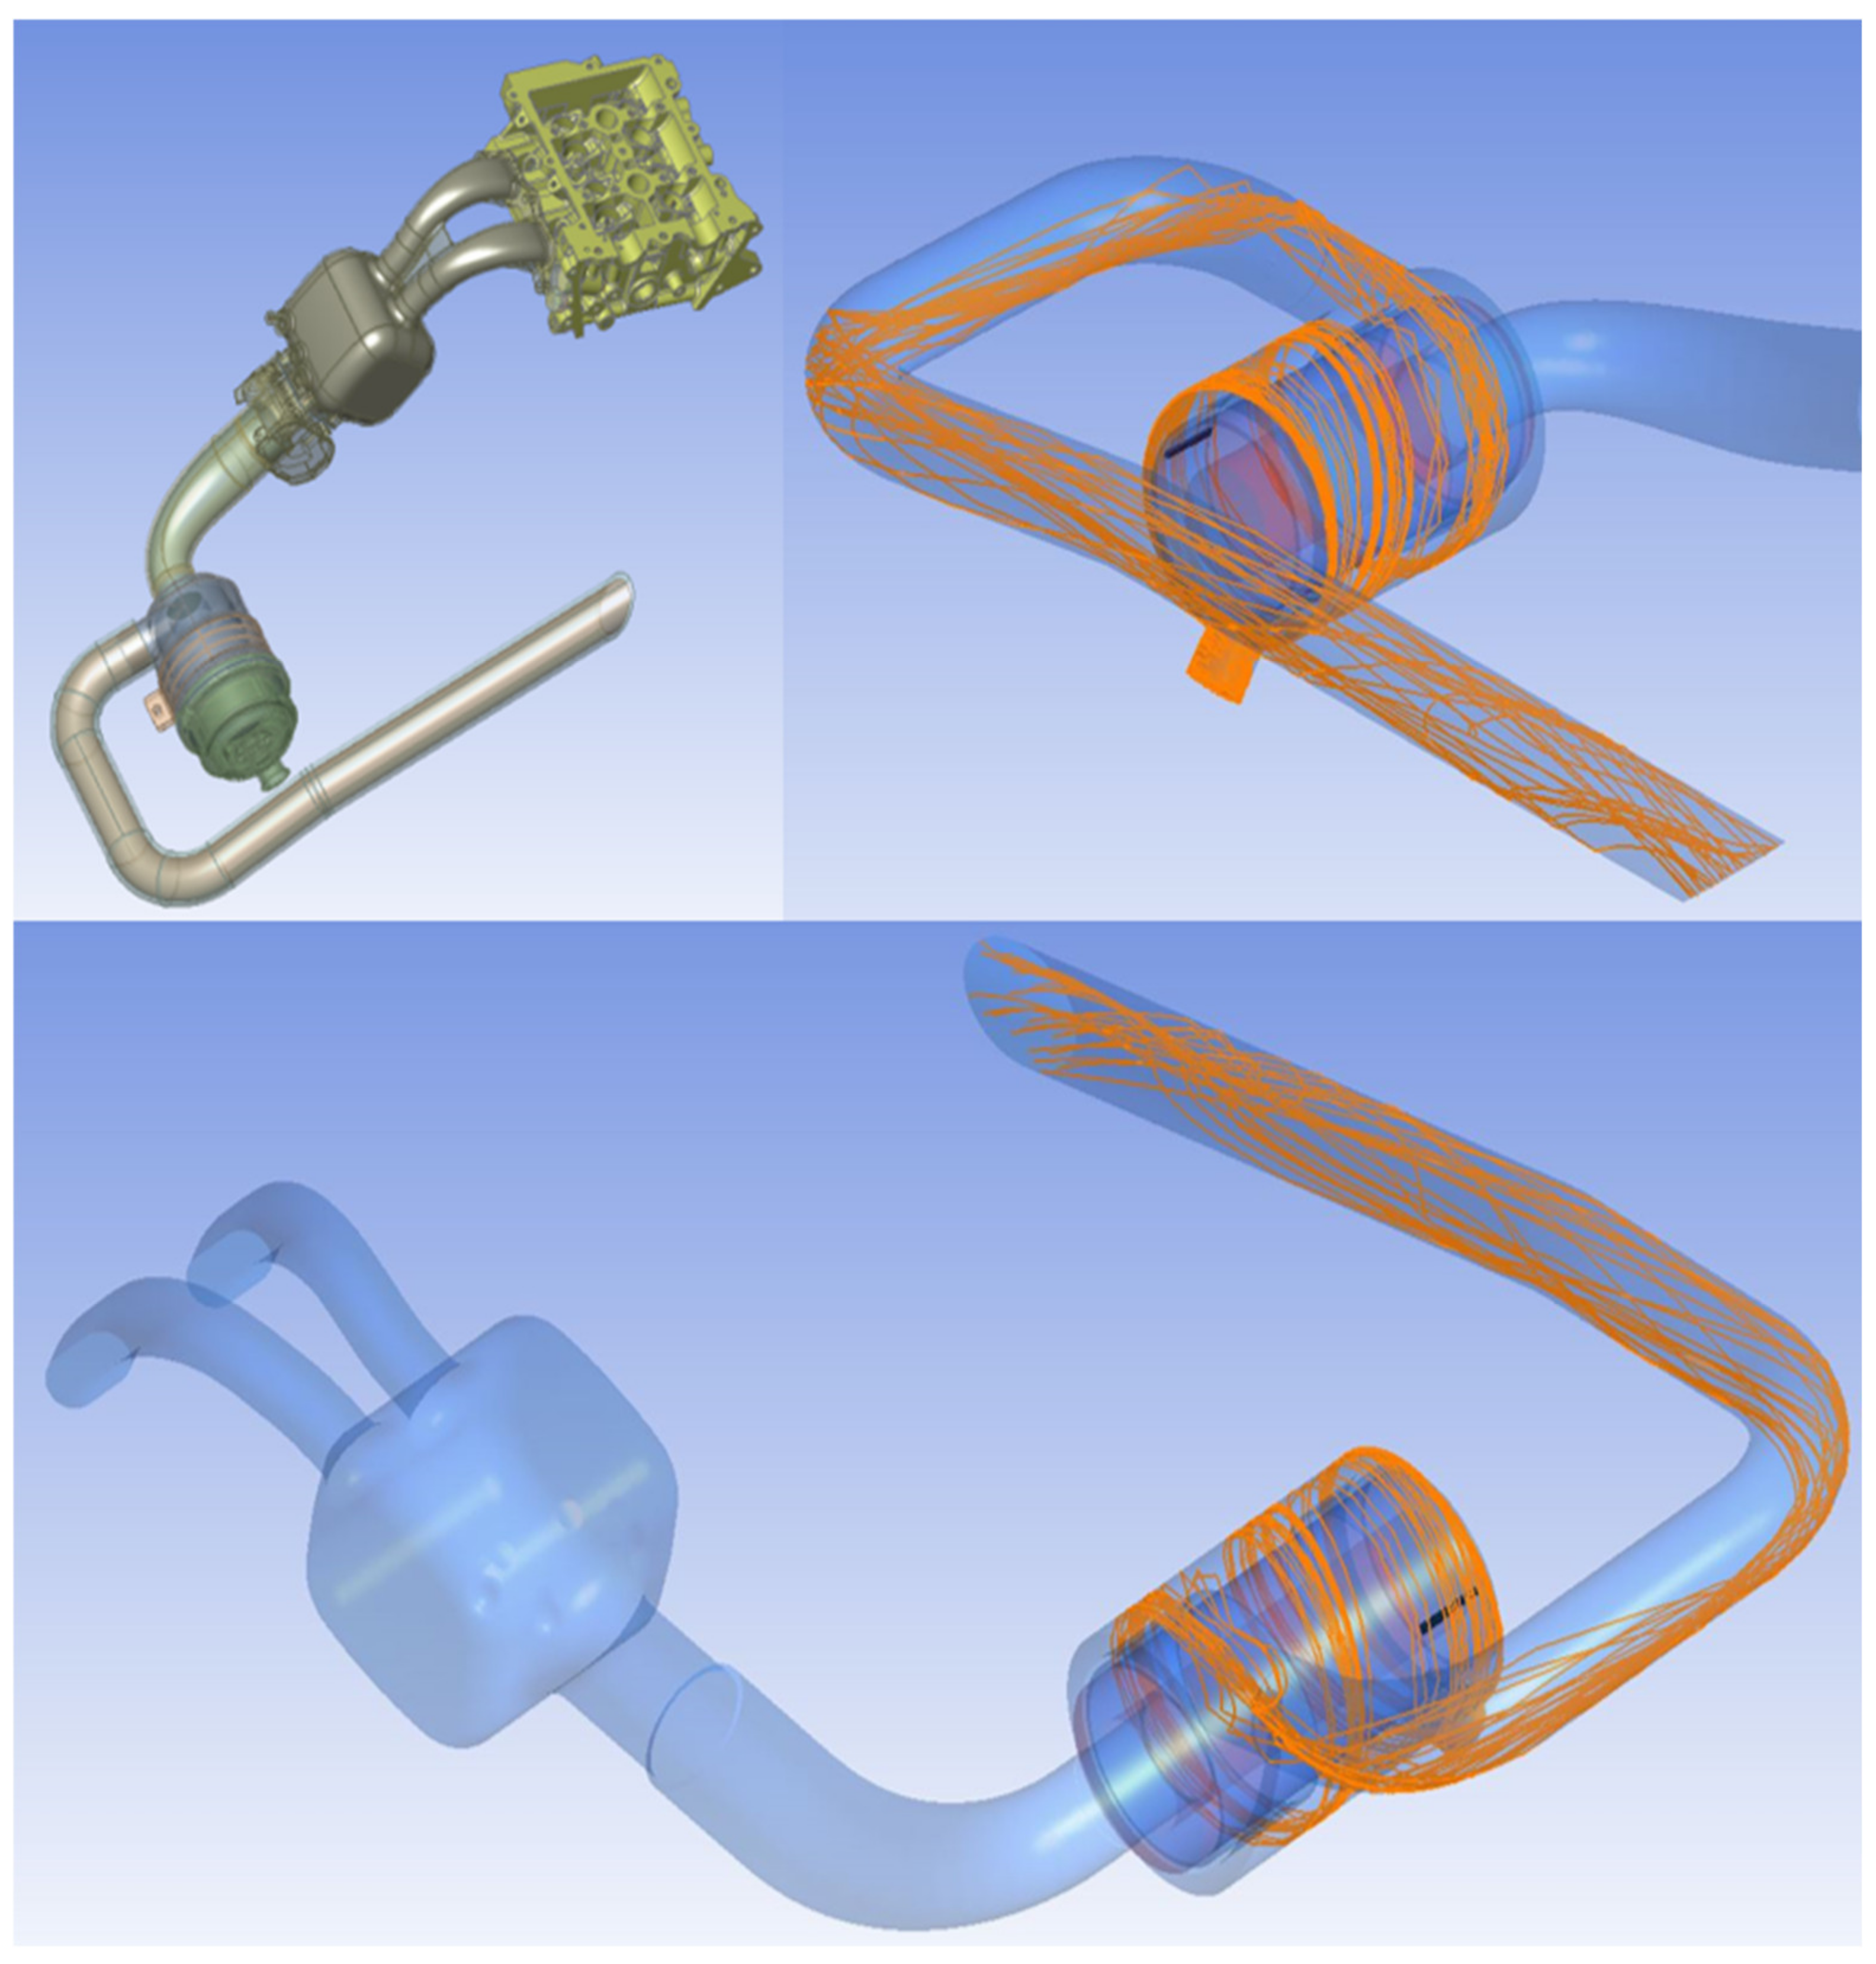
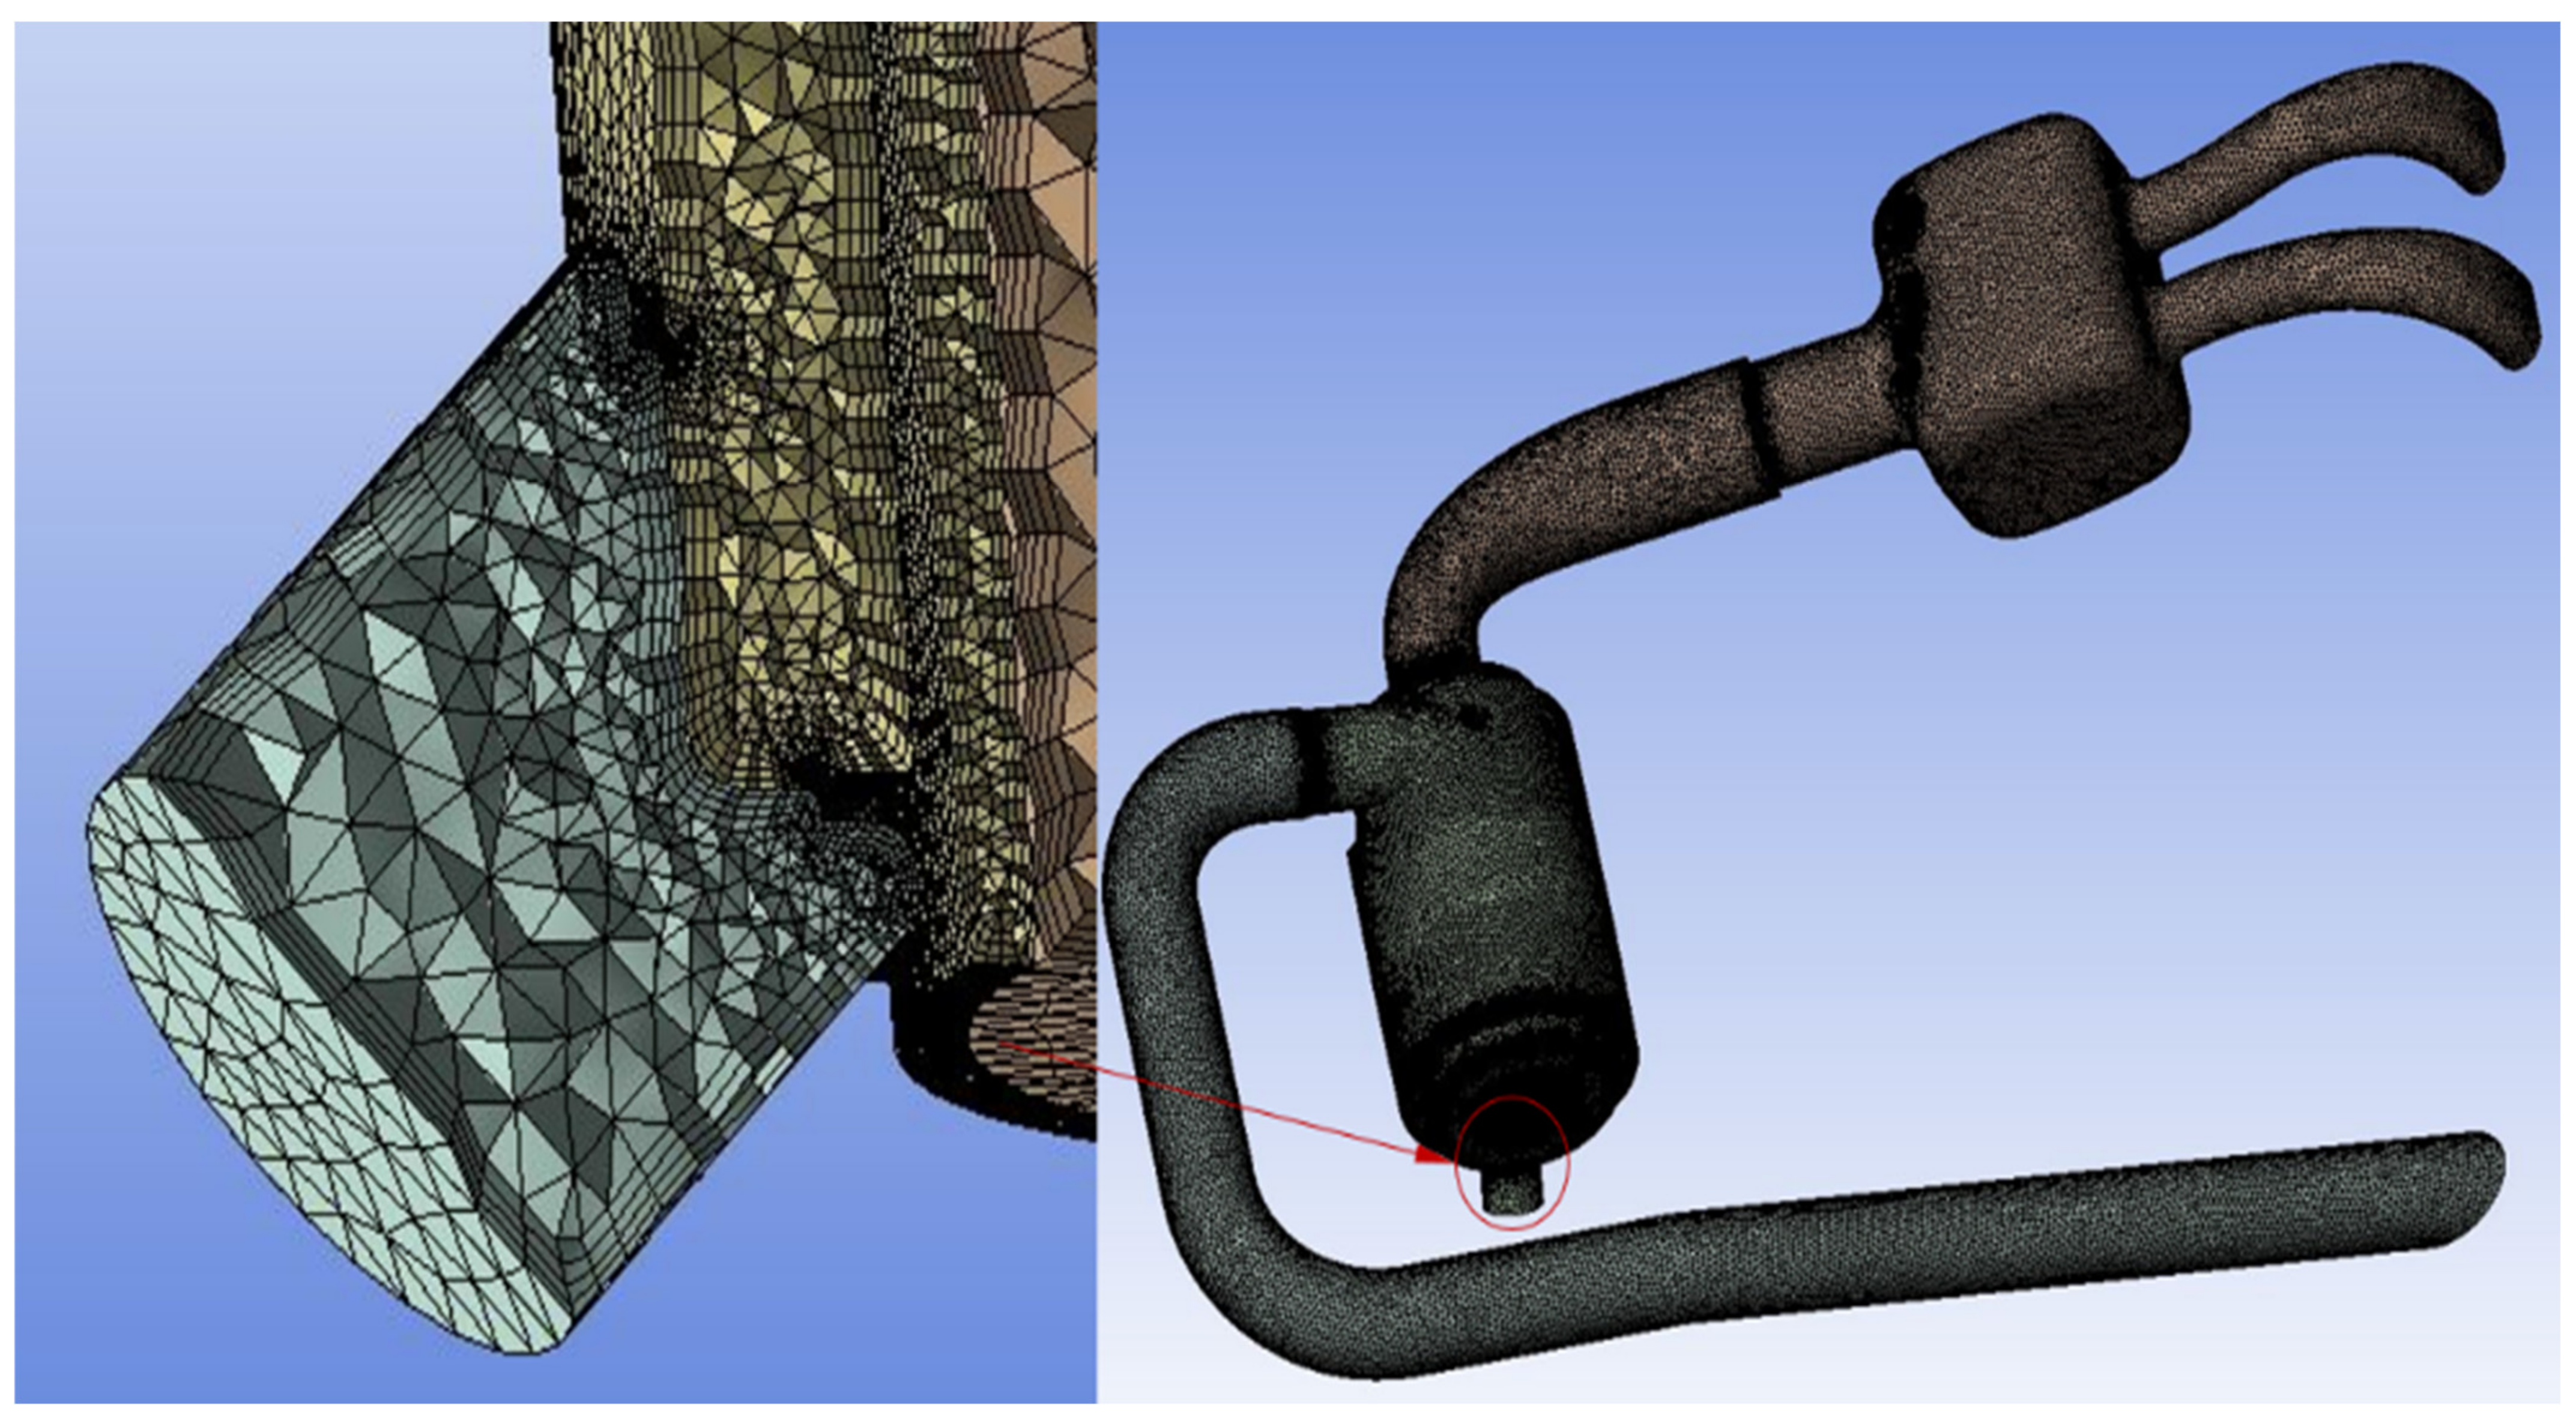
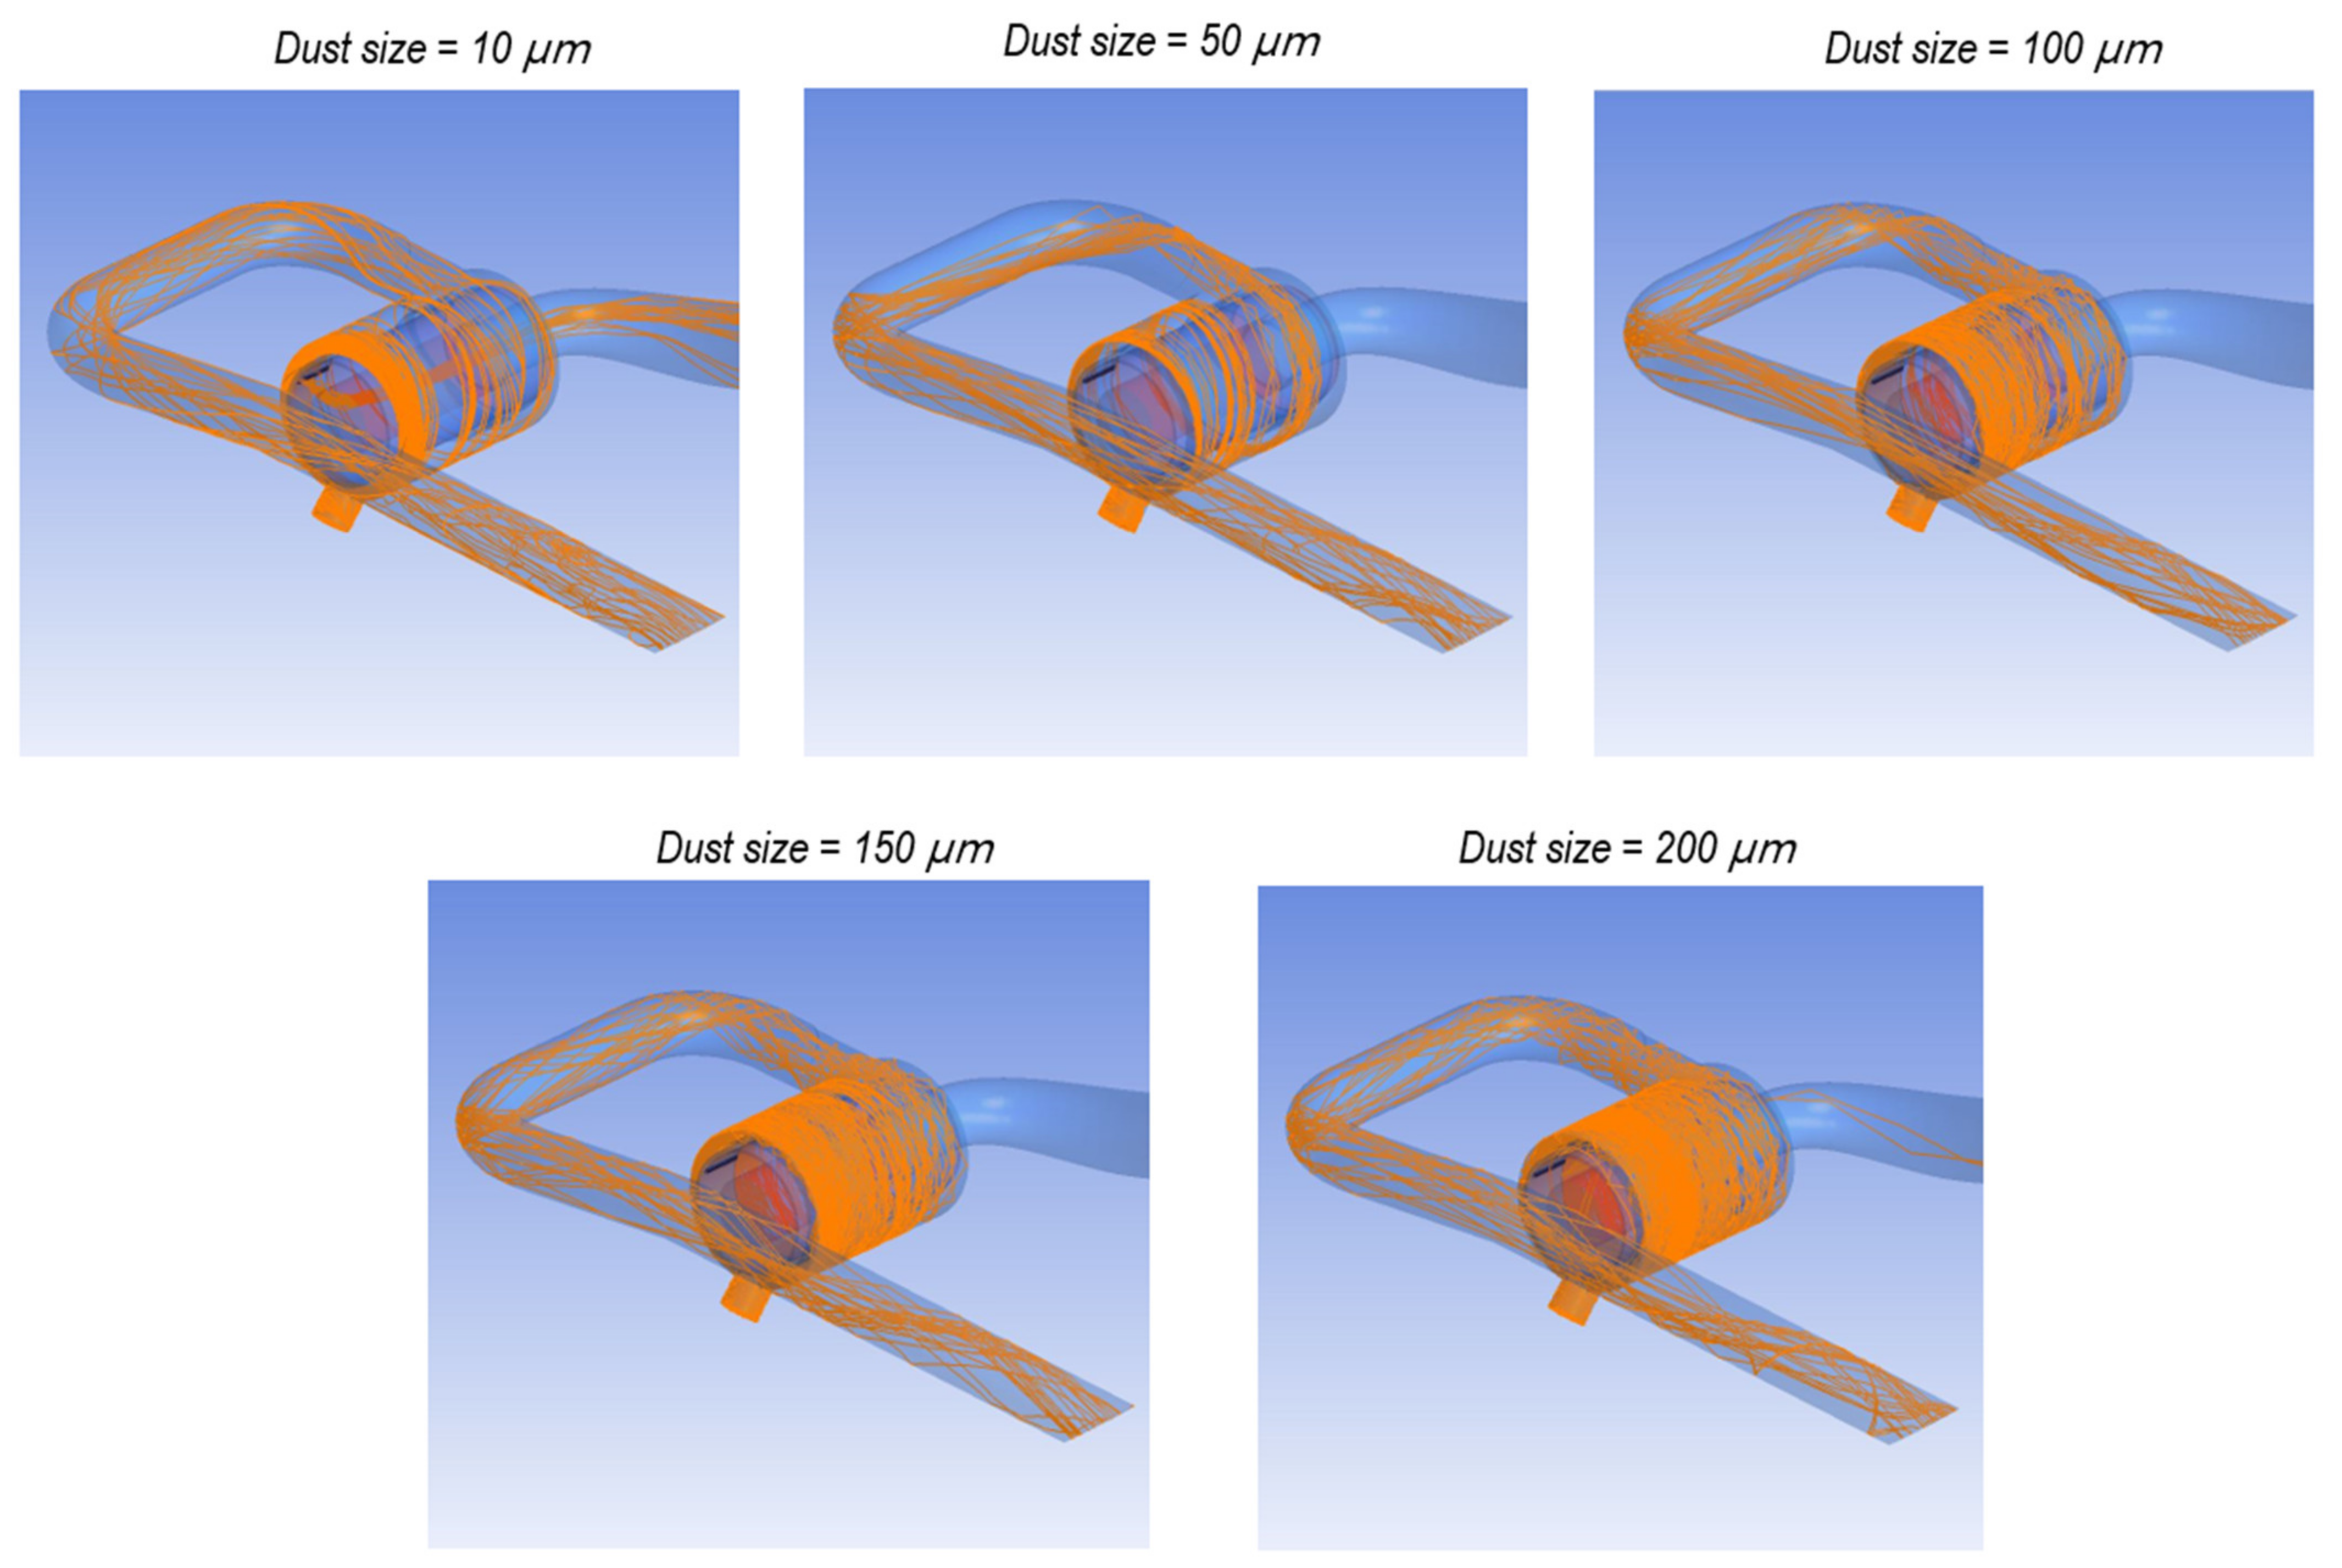
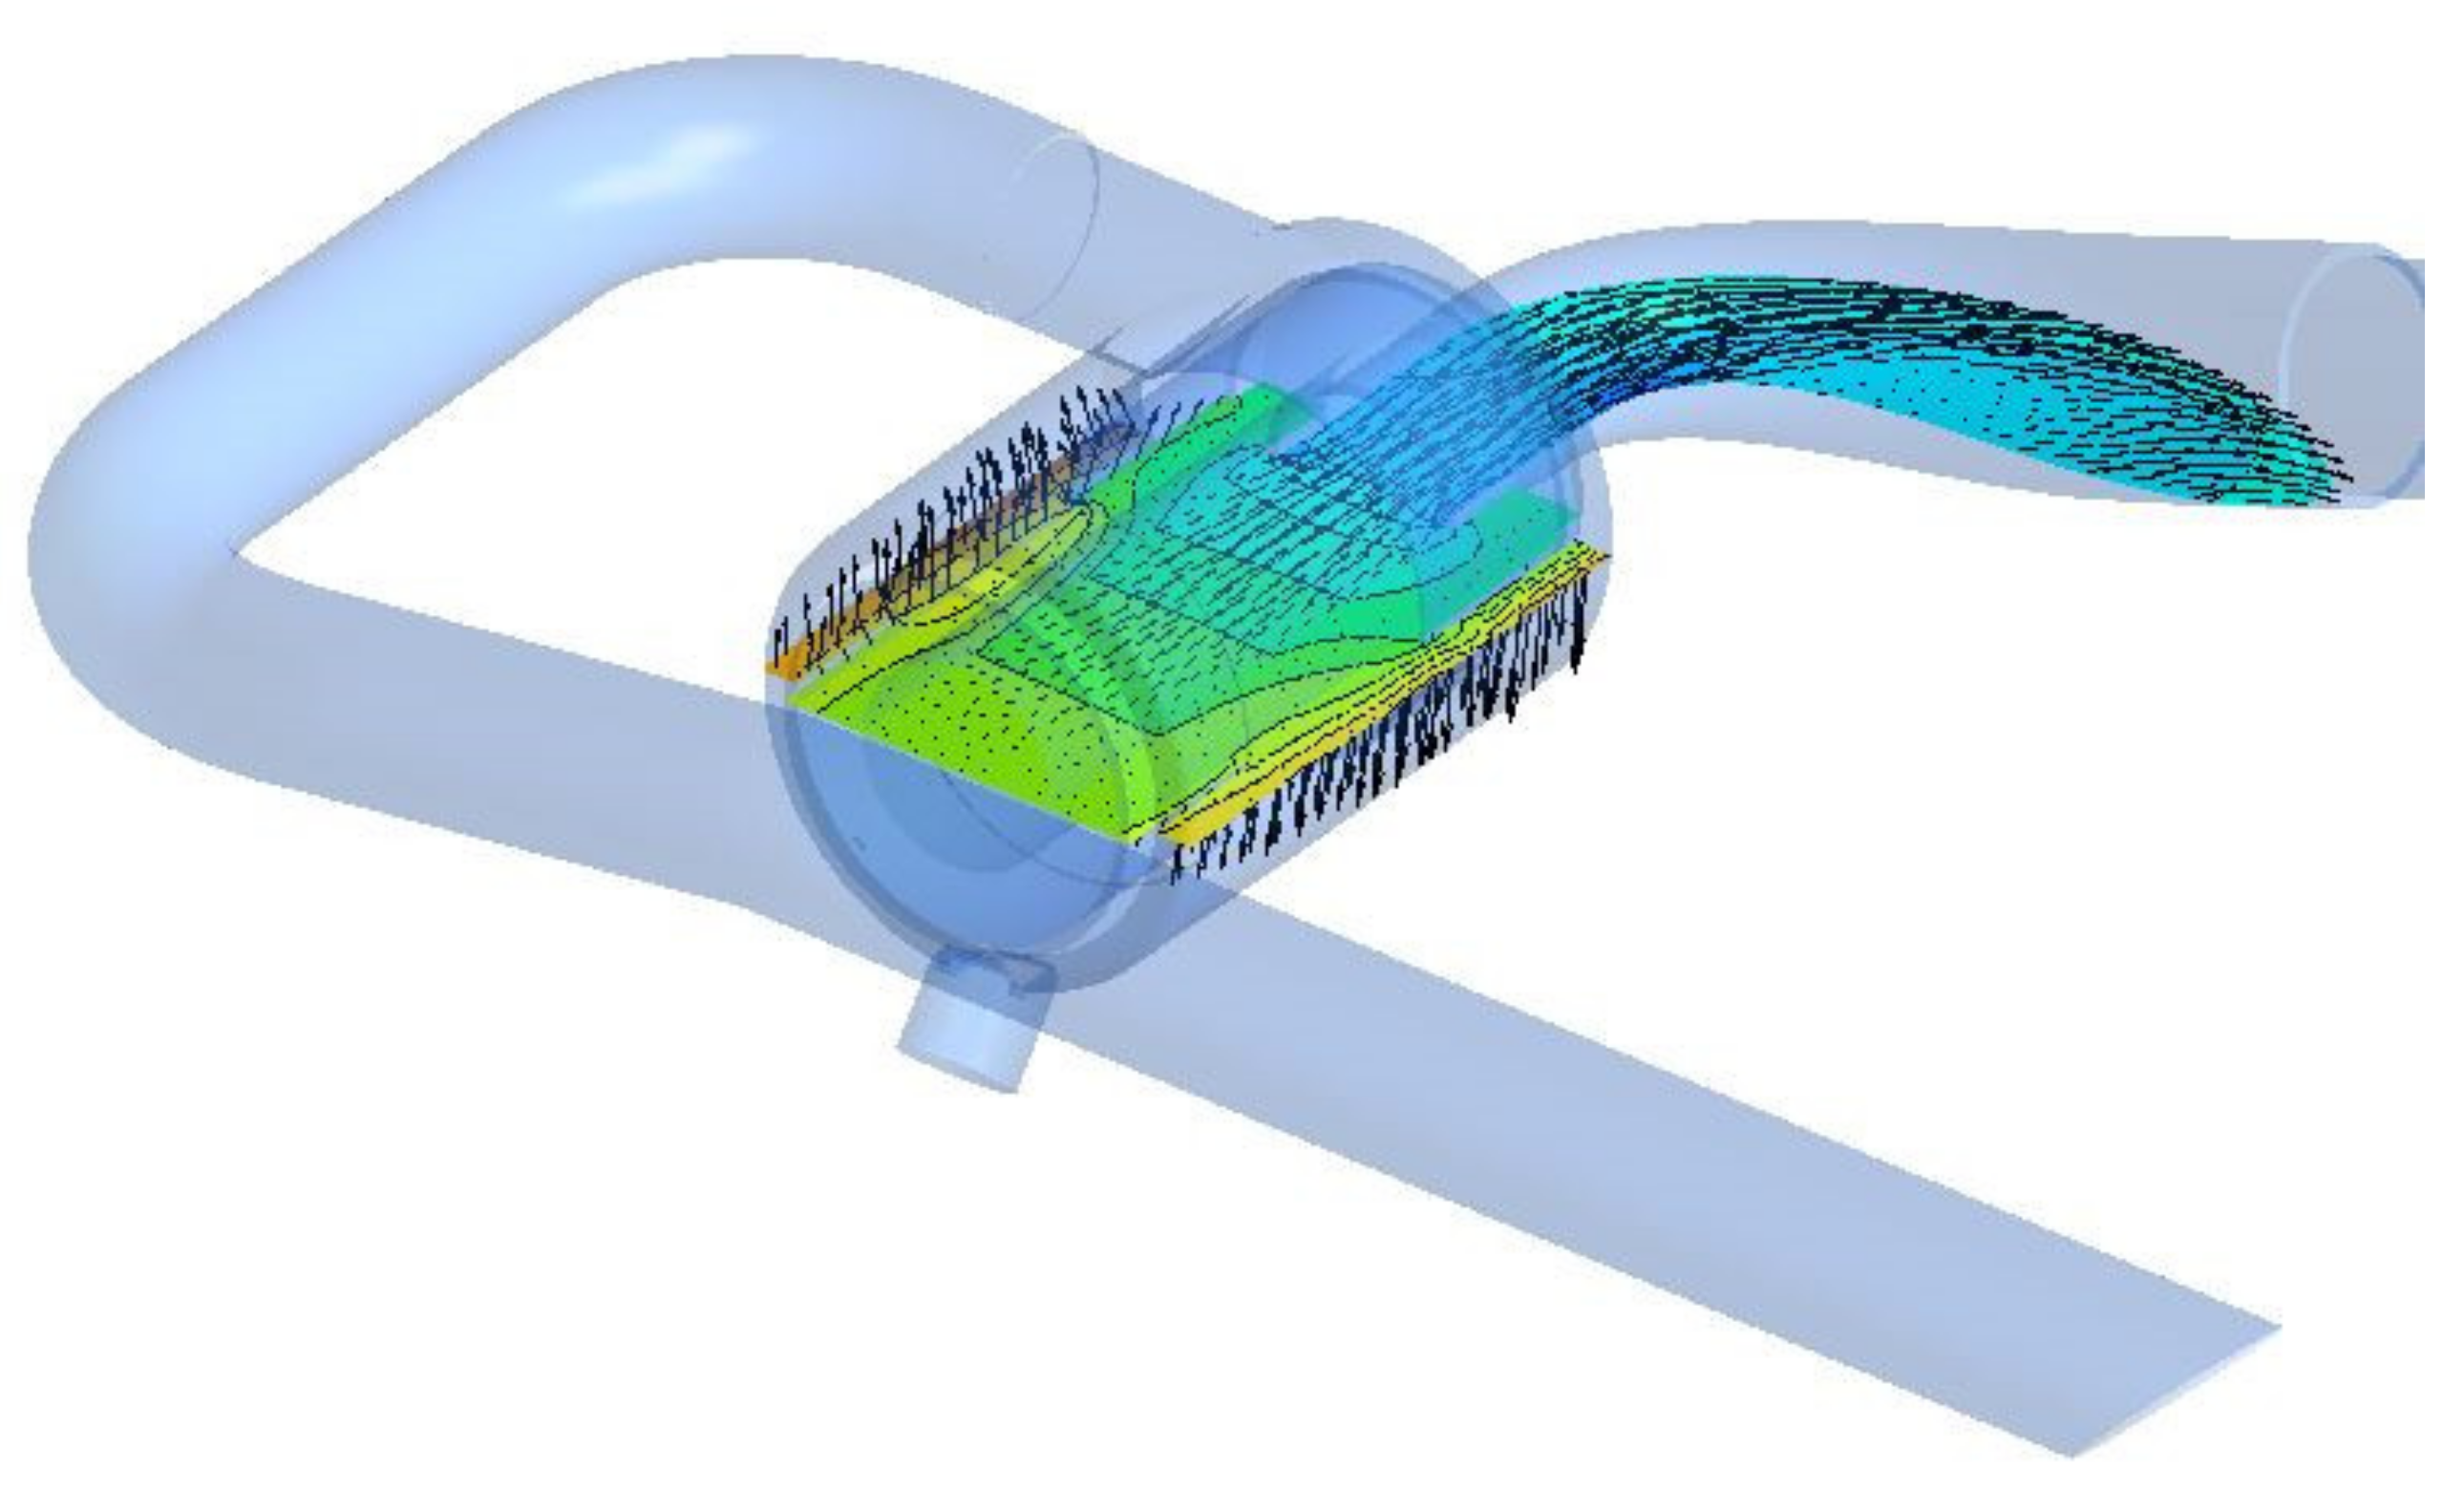
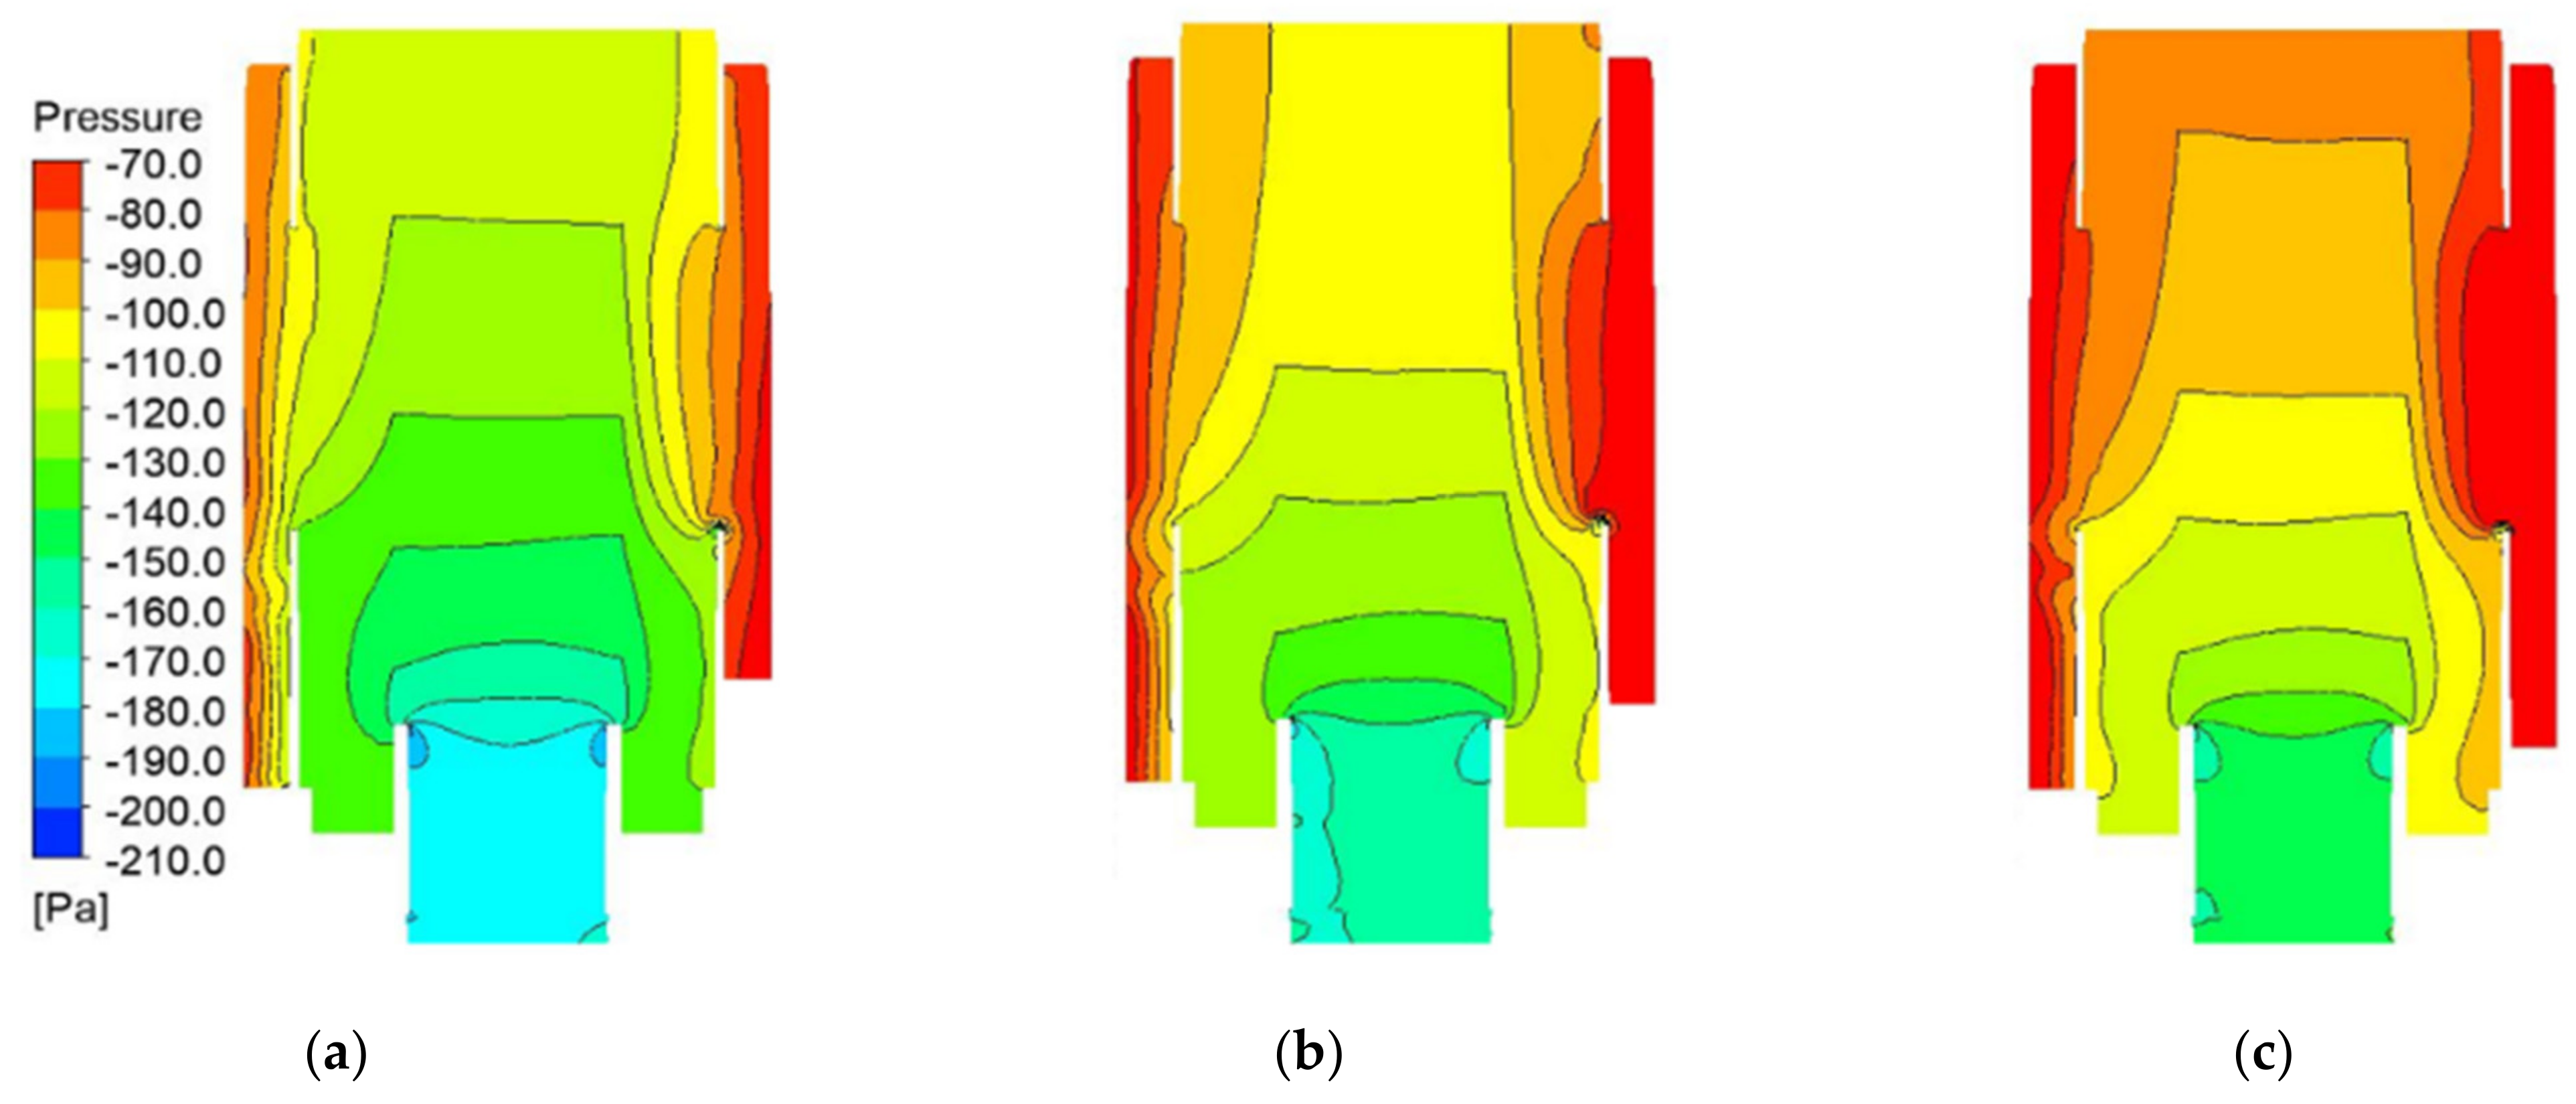
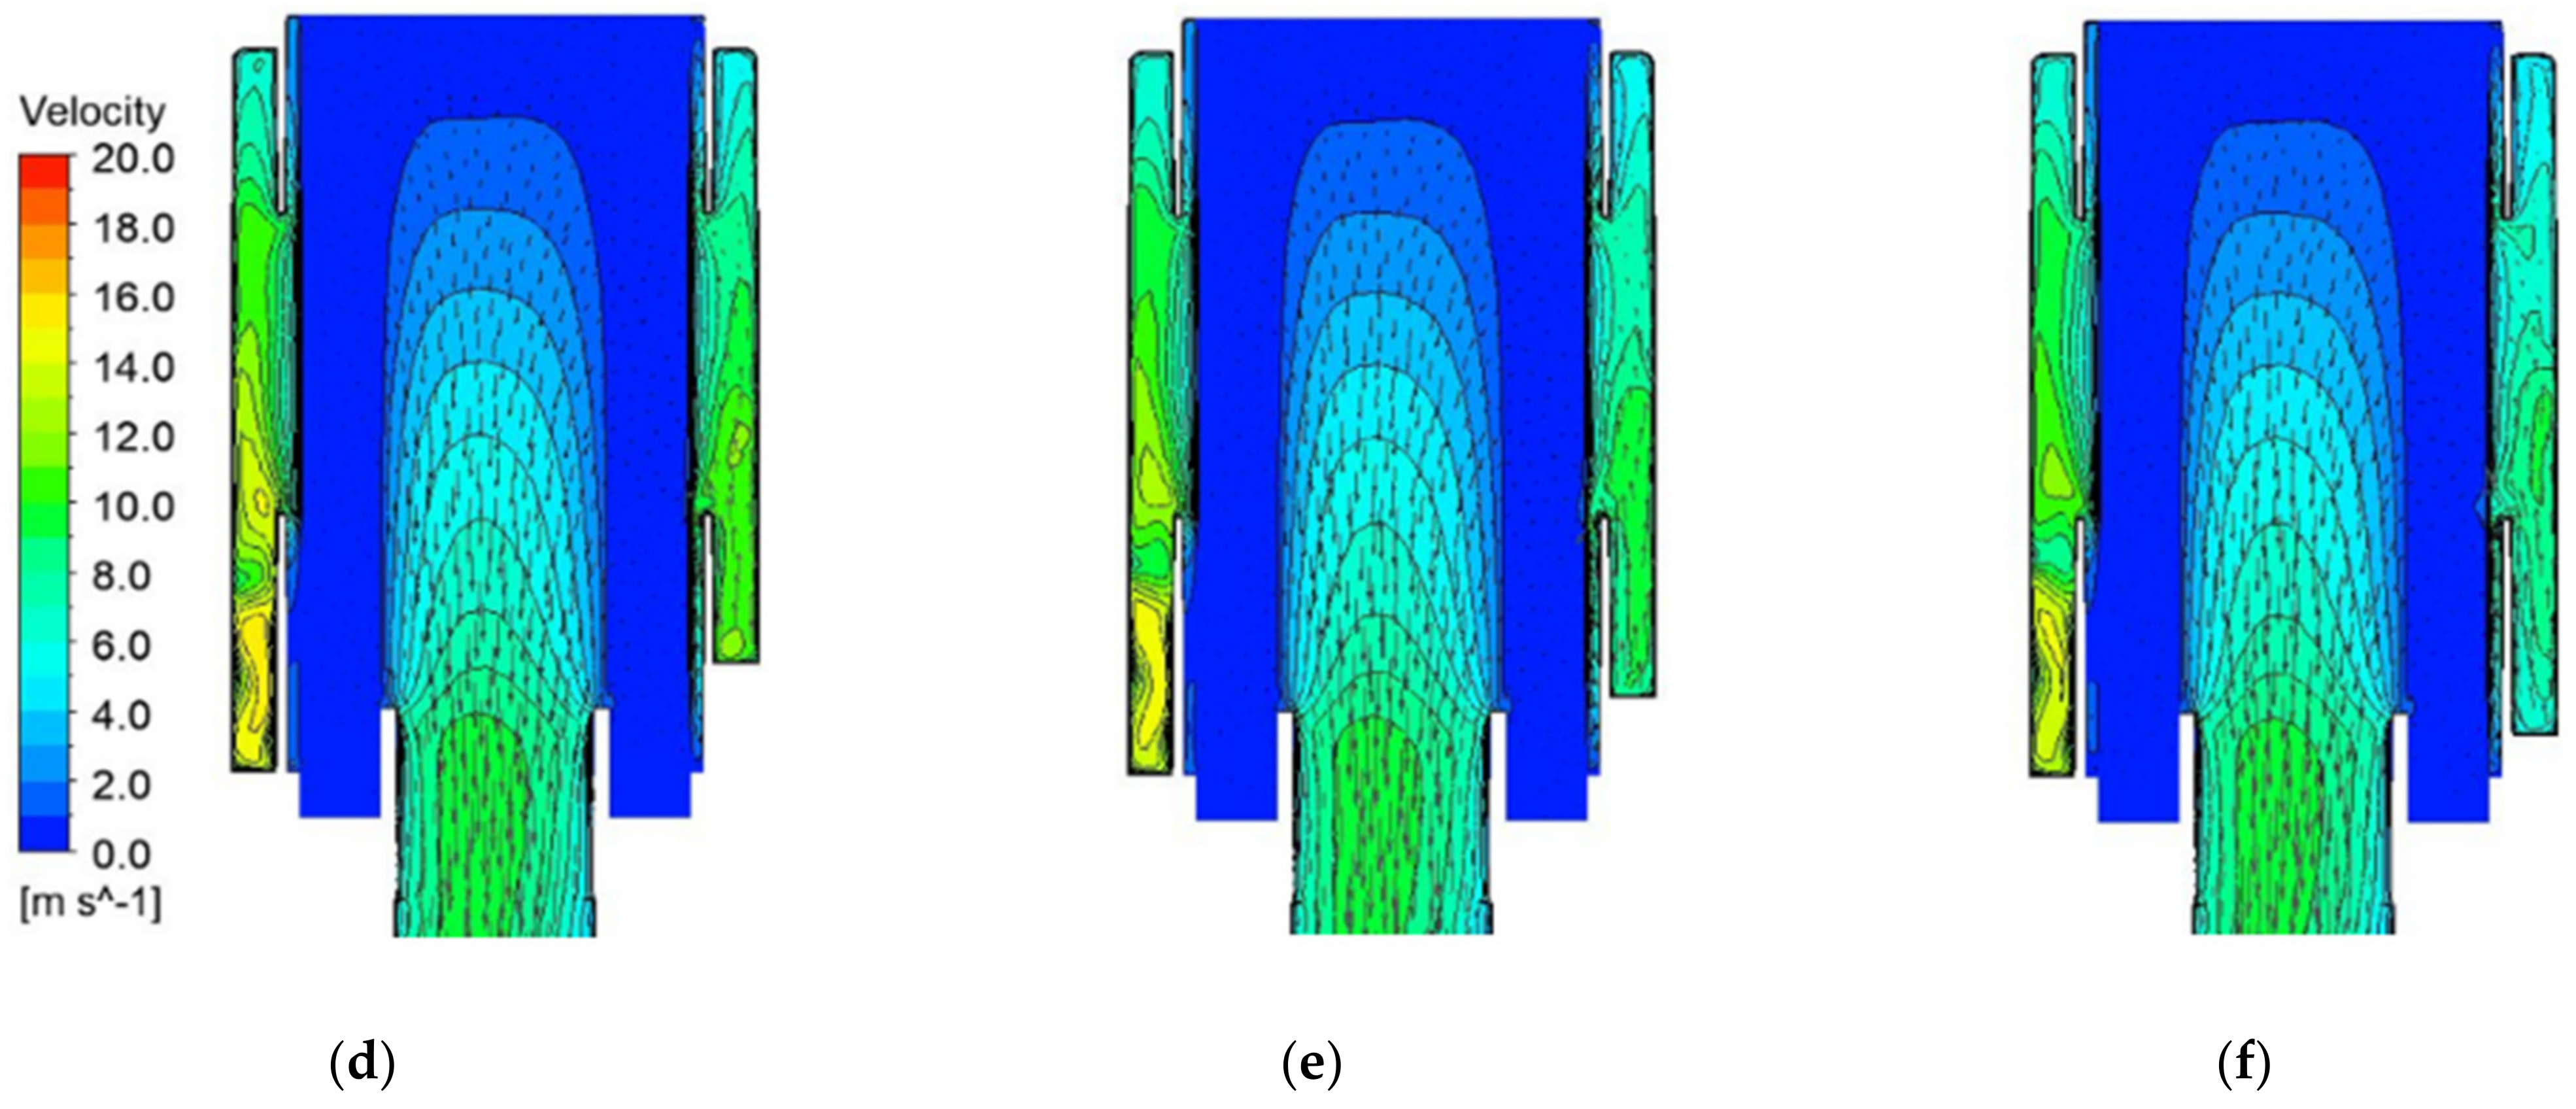
2.2. Numerical Analysis
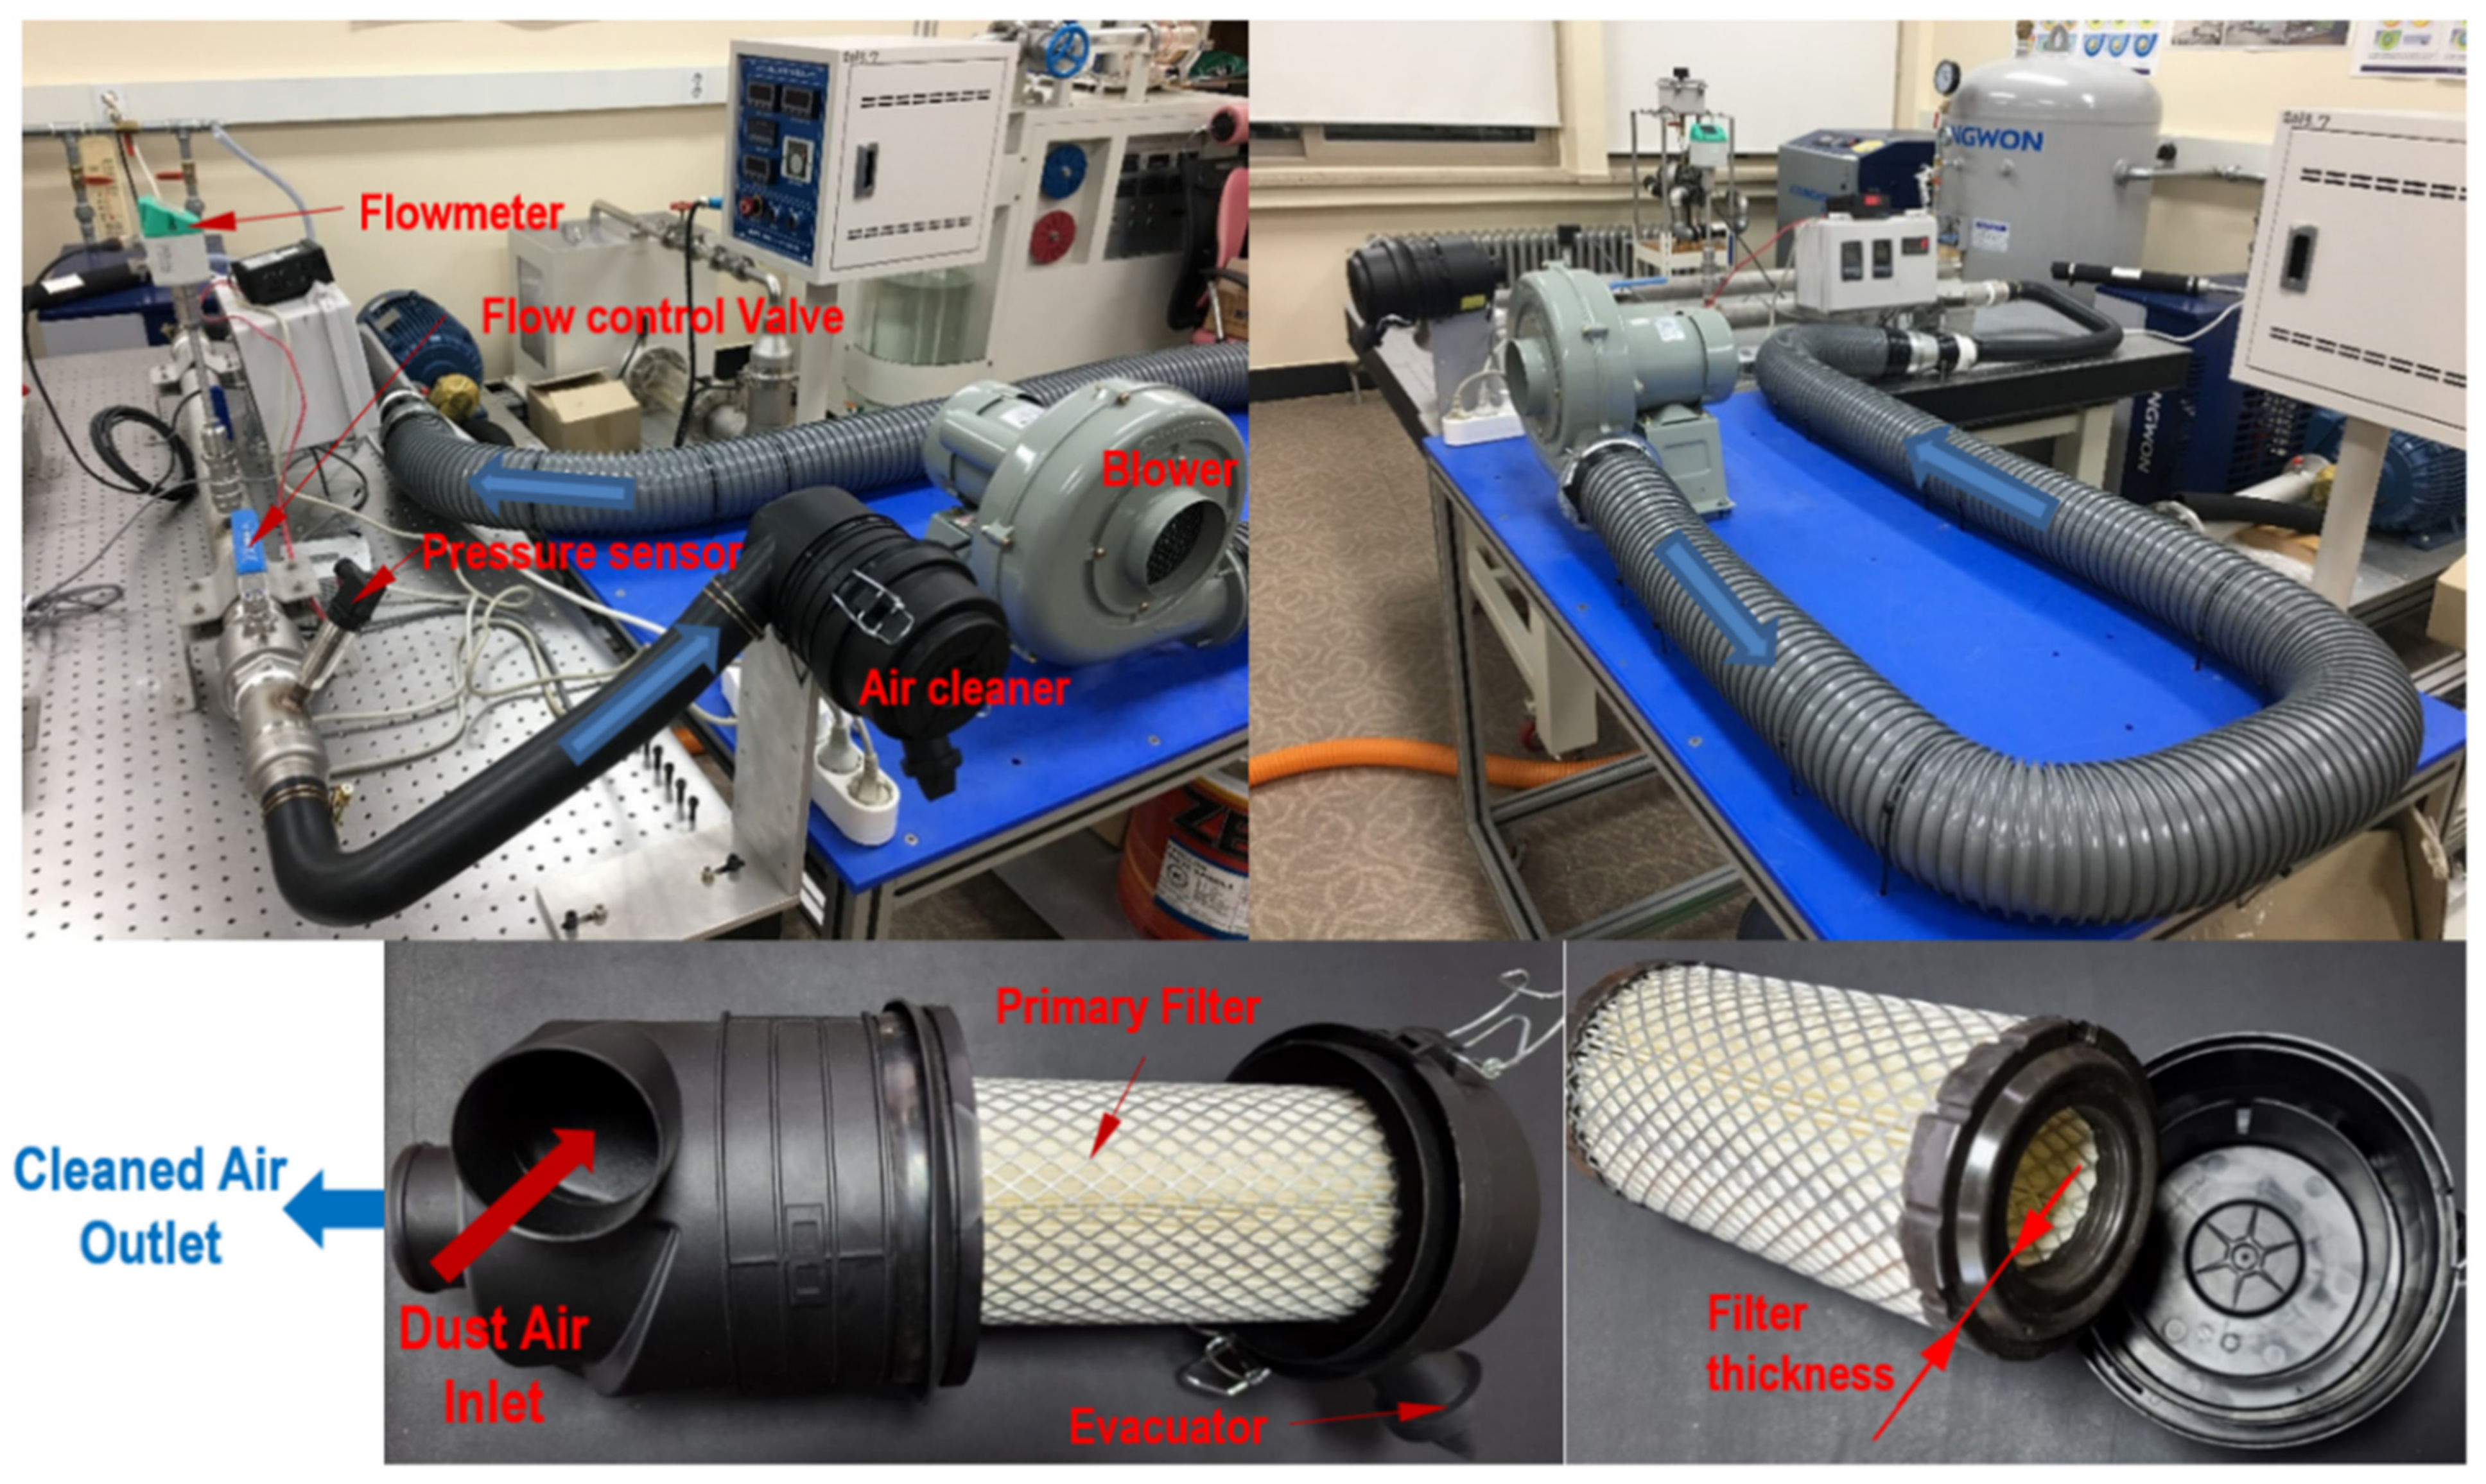
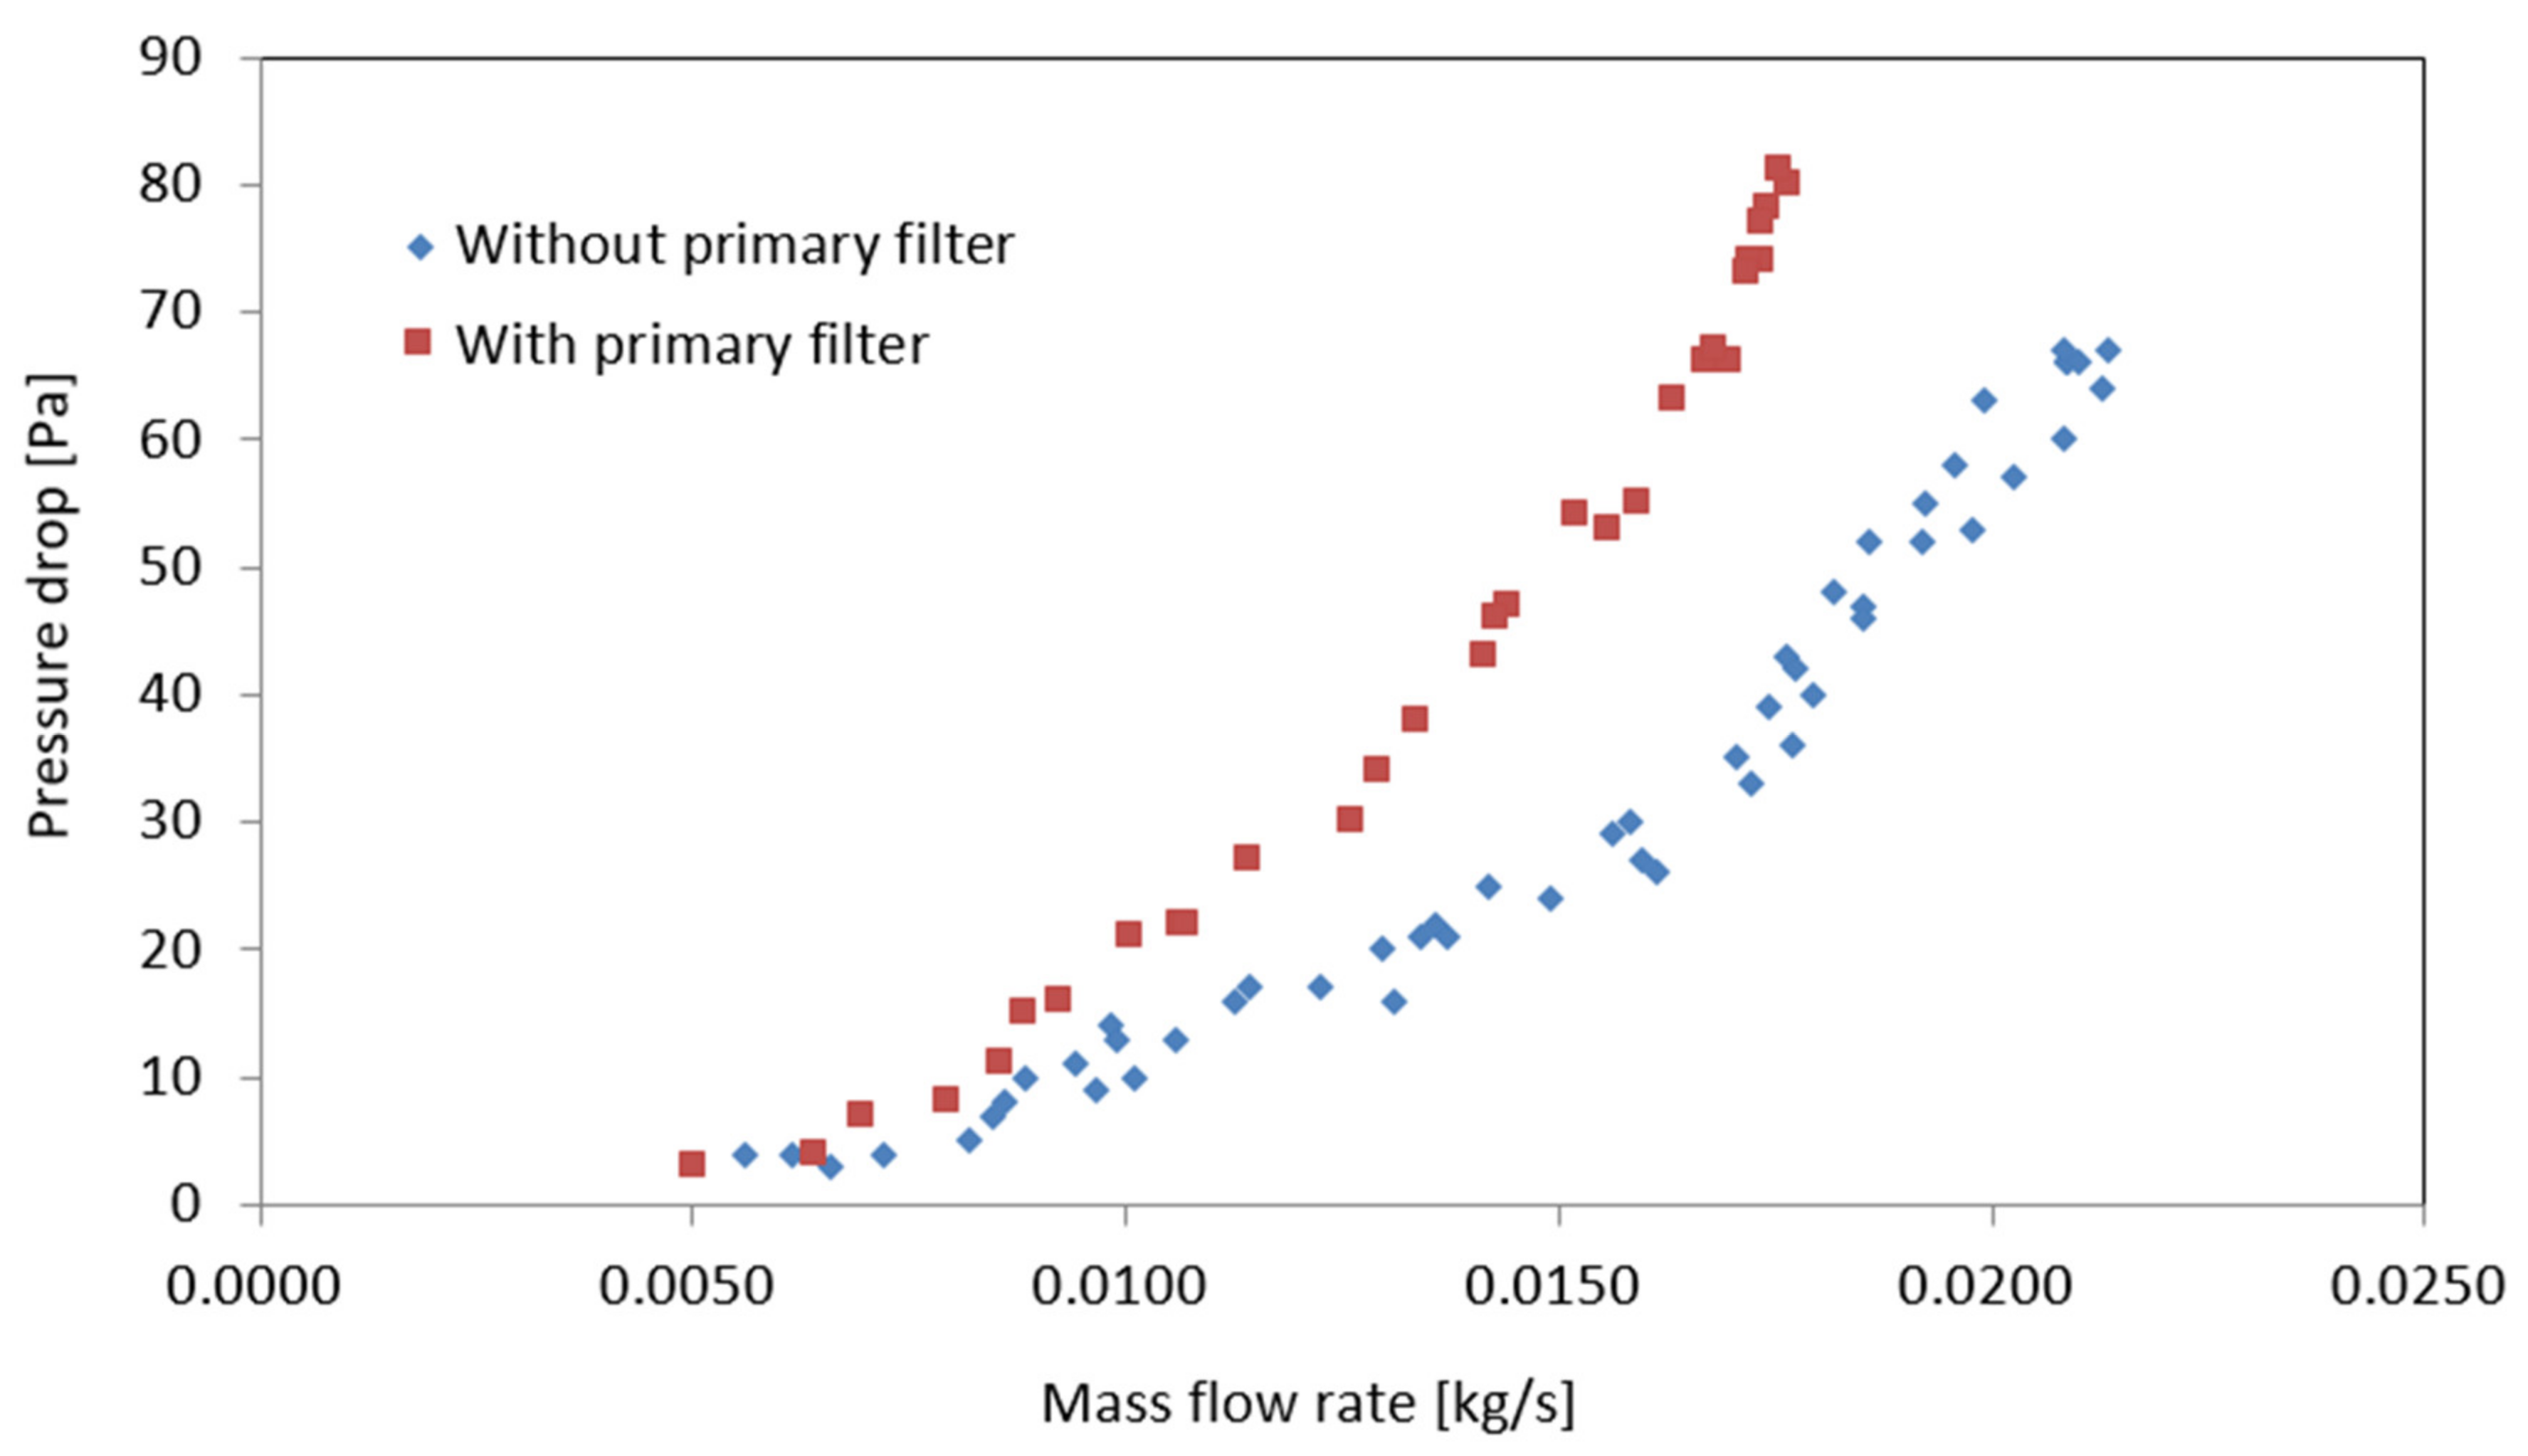
2.3. Rig Test to Determine Flow Characteristics of Primary Filter
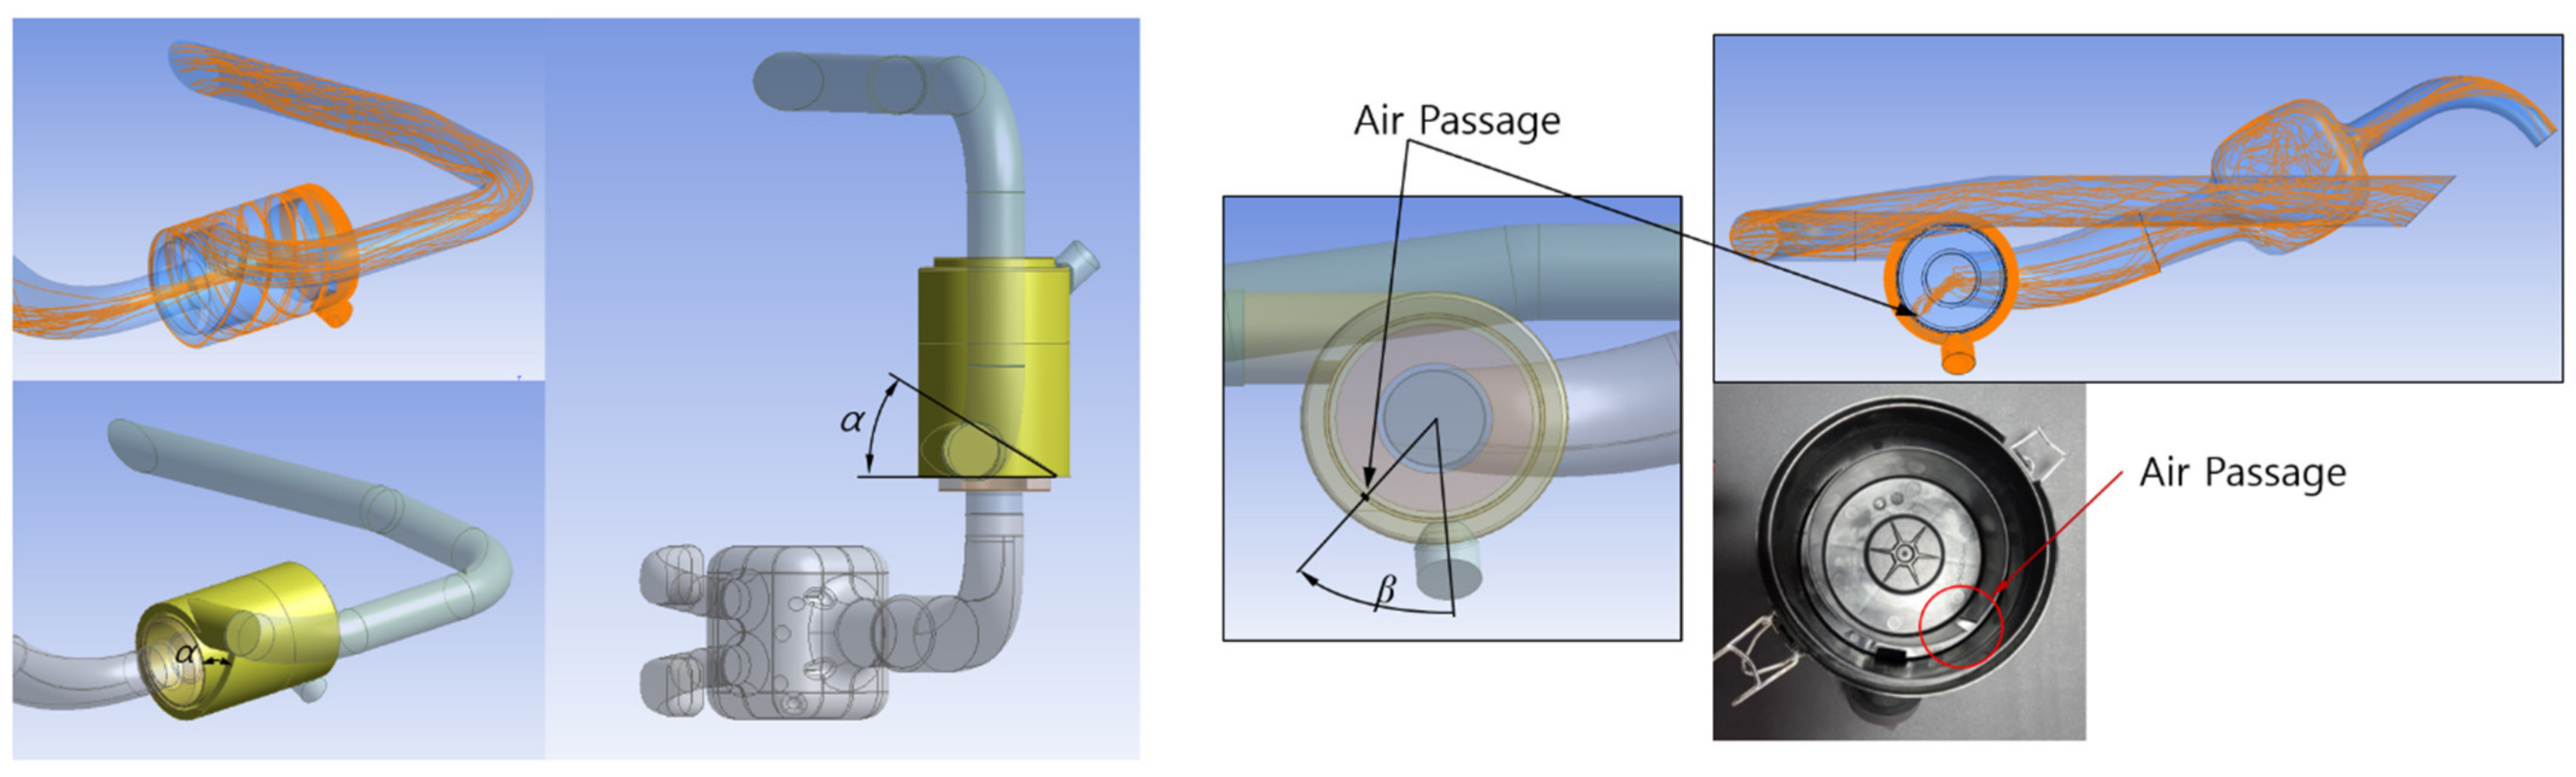
2.4. Objective Function for Design Optimization
3. Results and Discussion
4. Conclusions
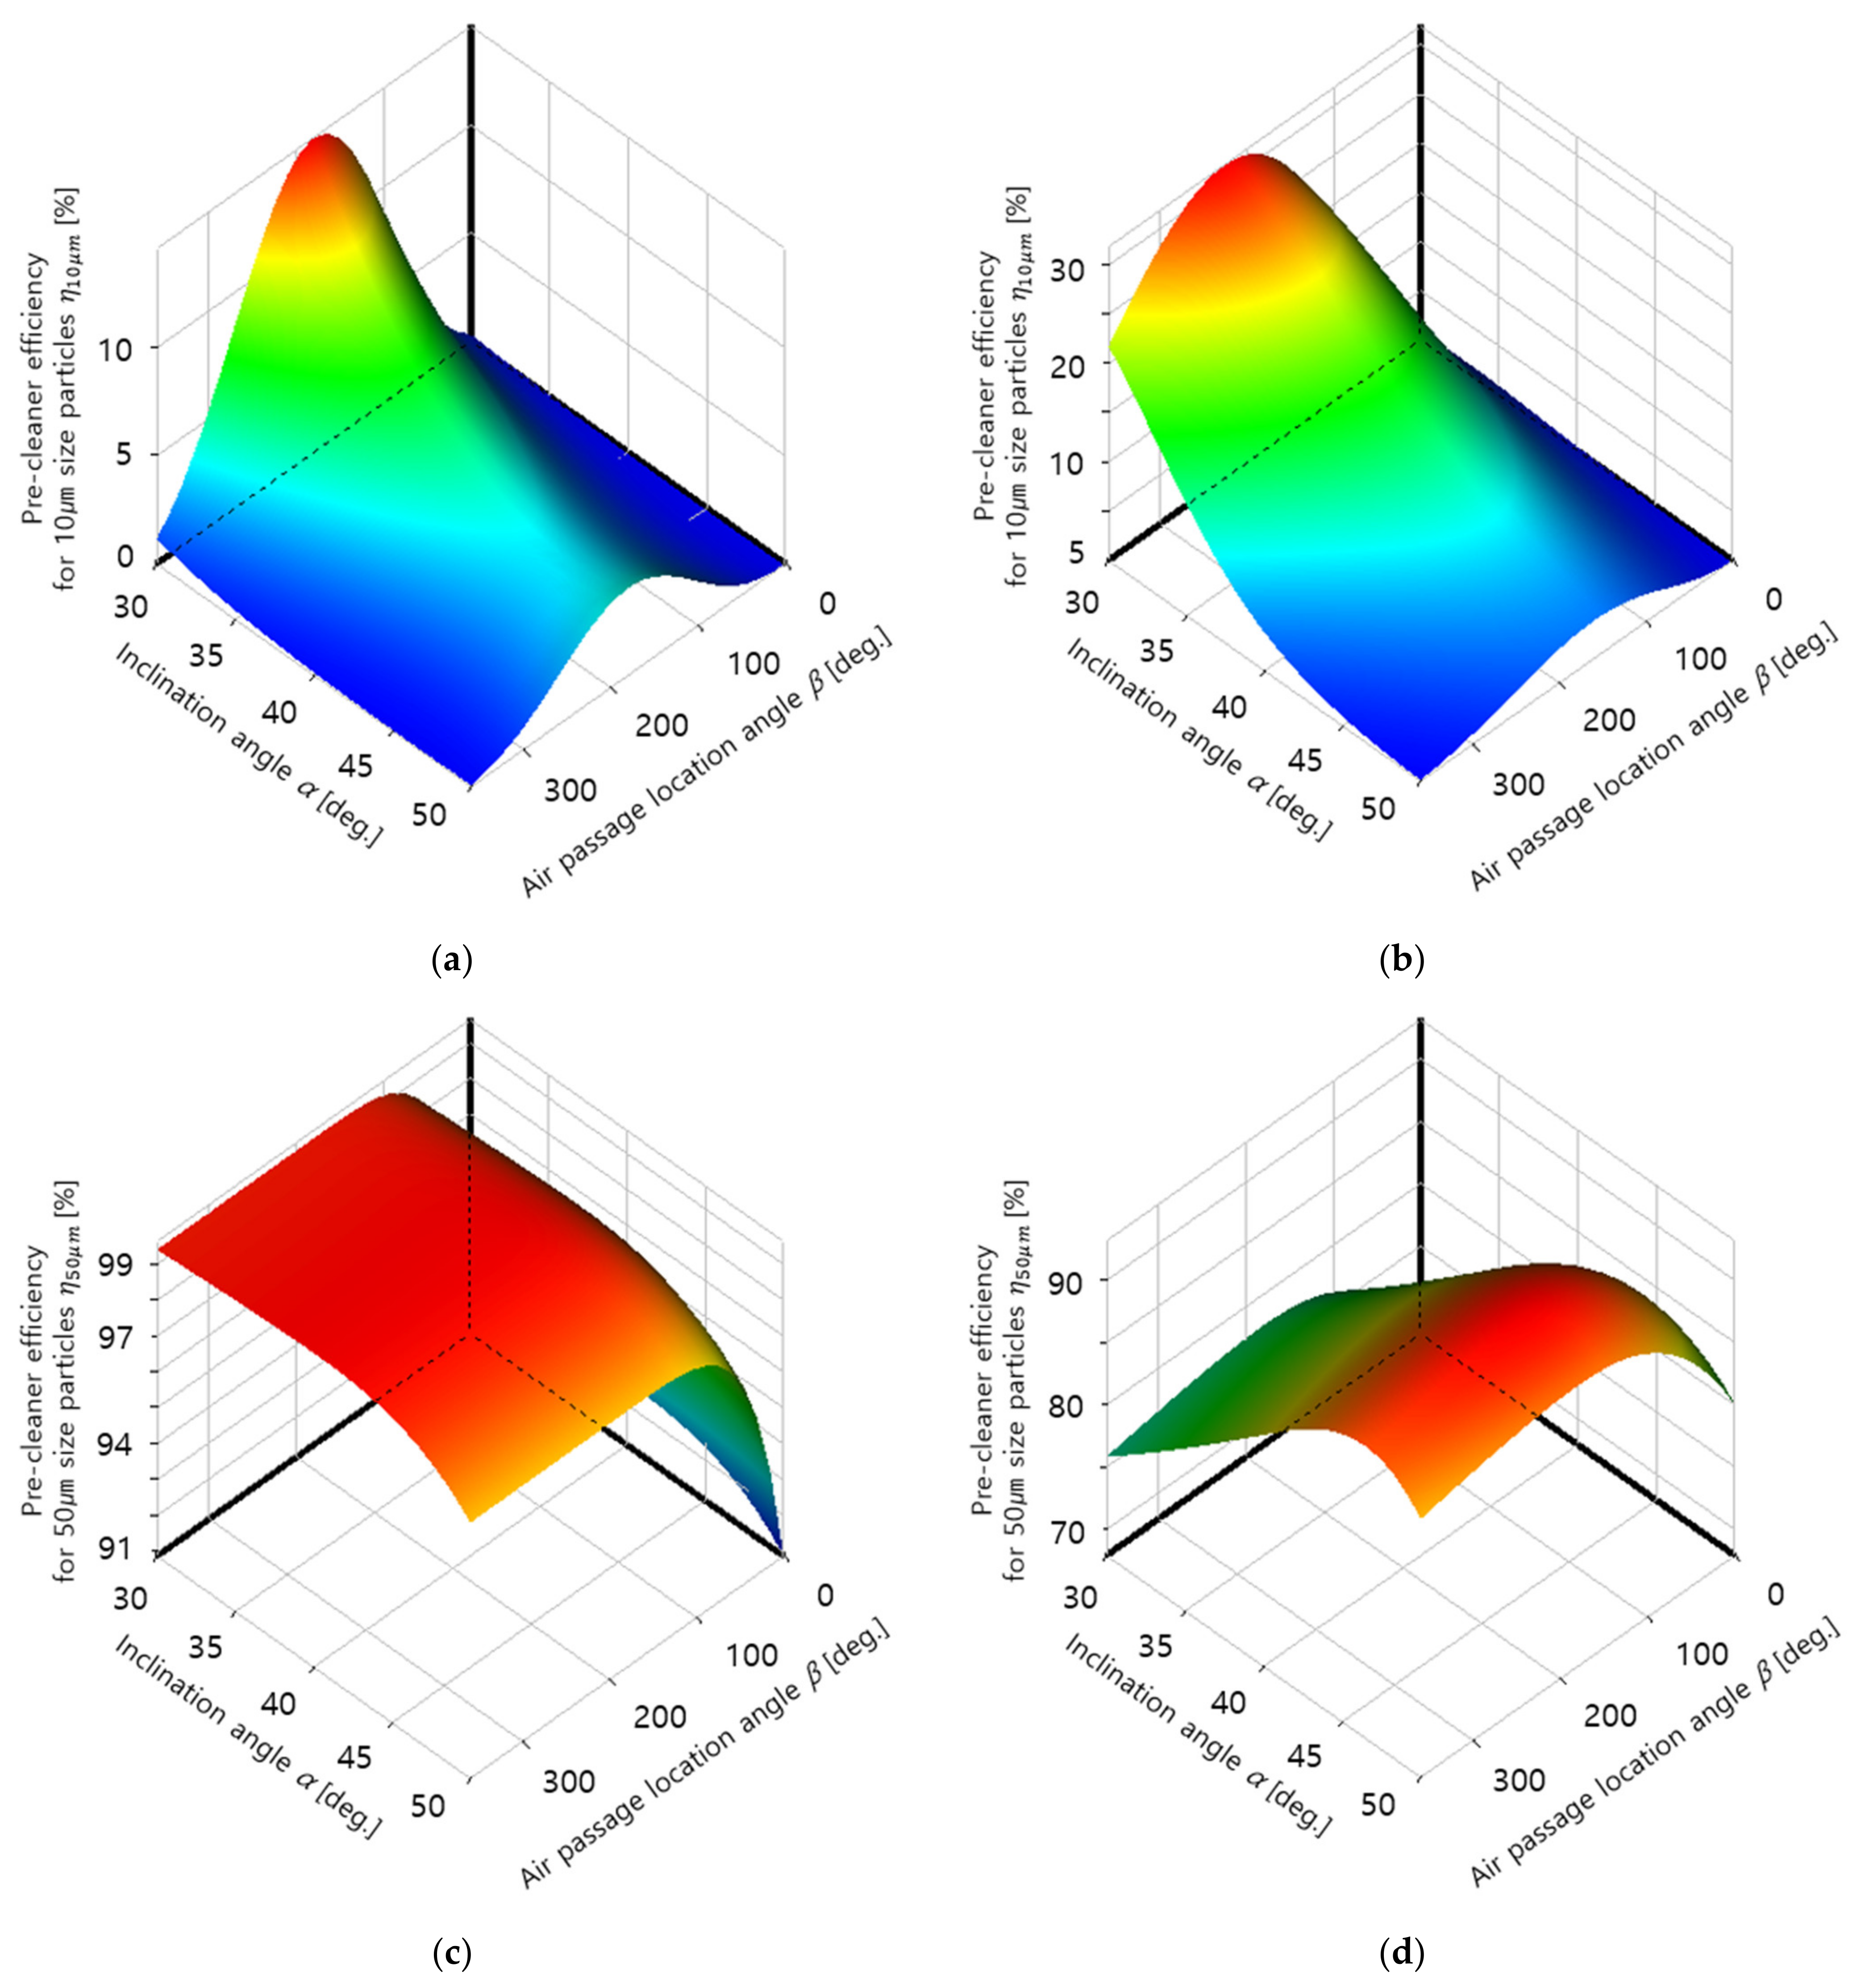
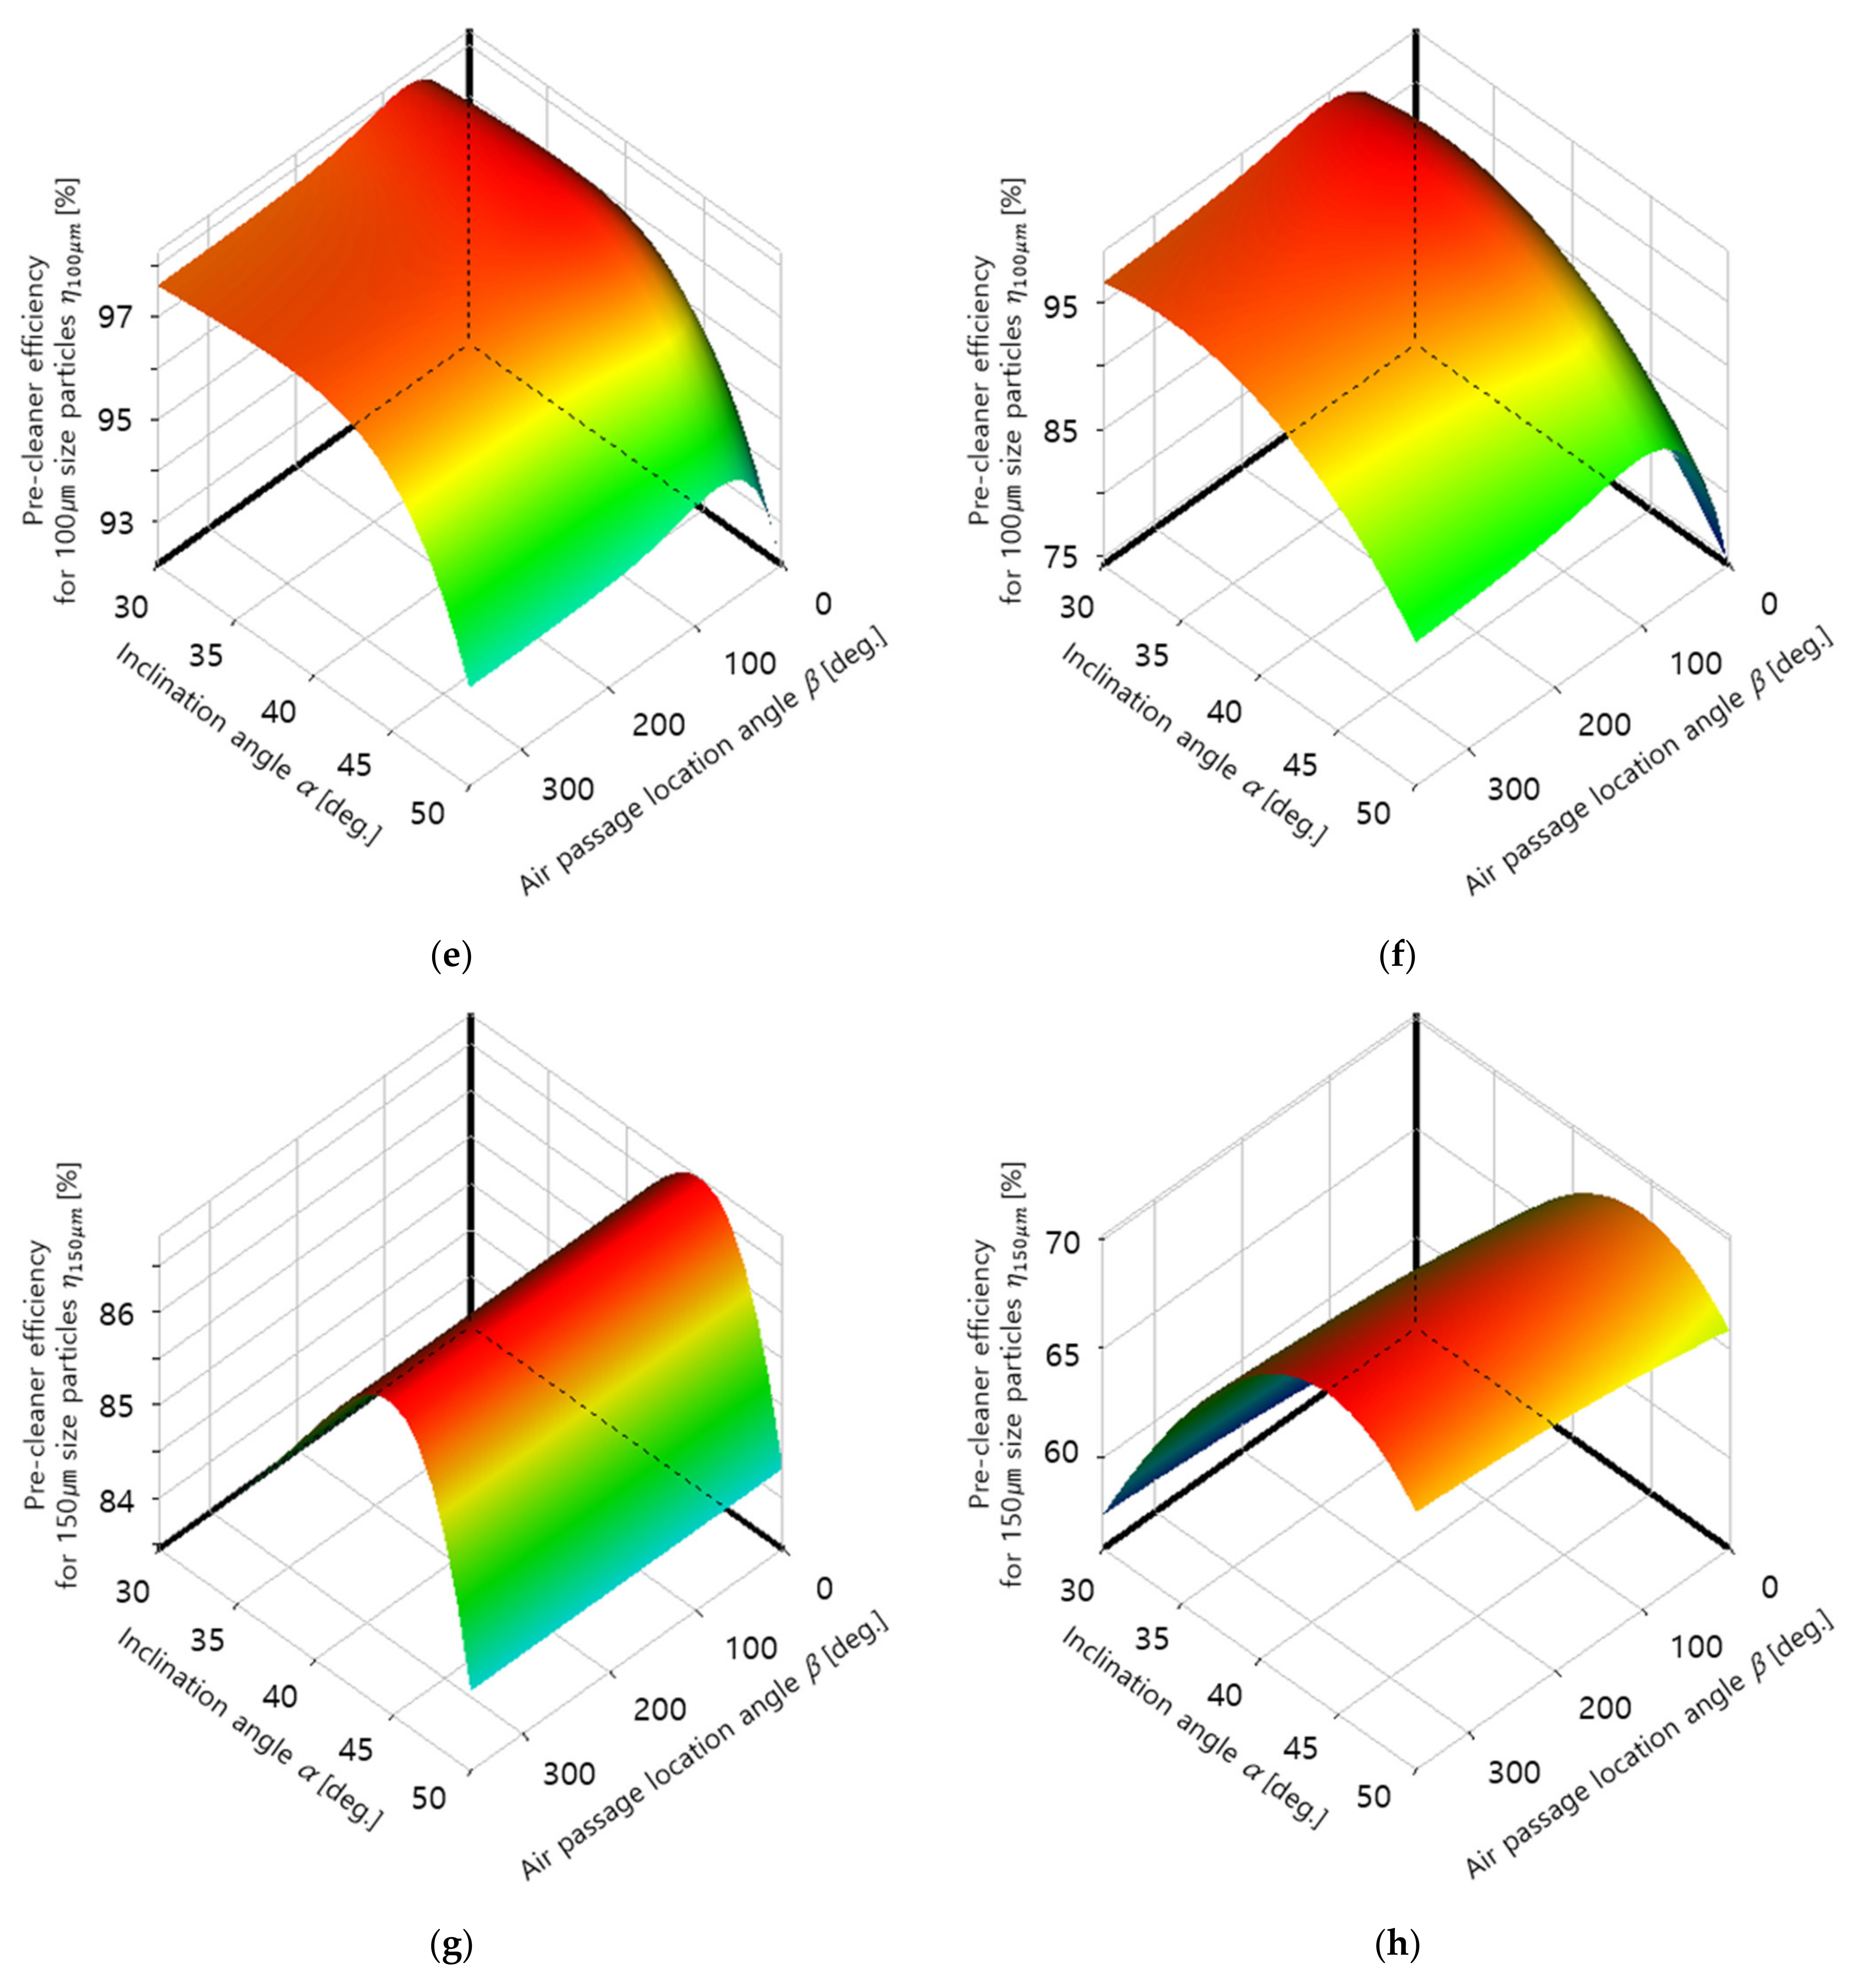
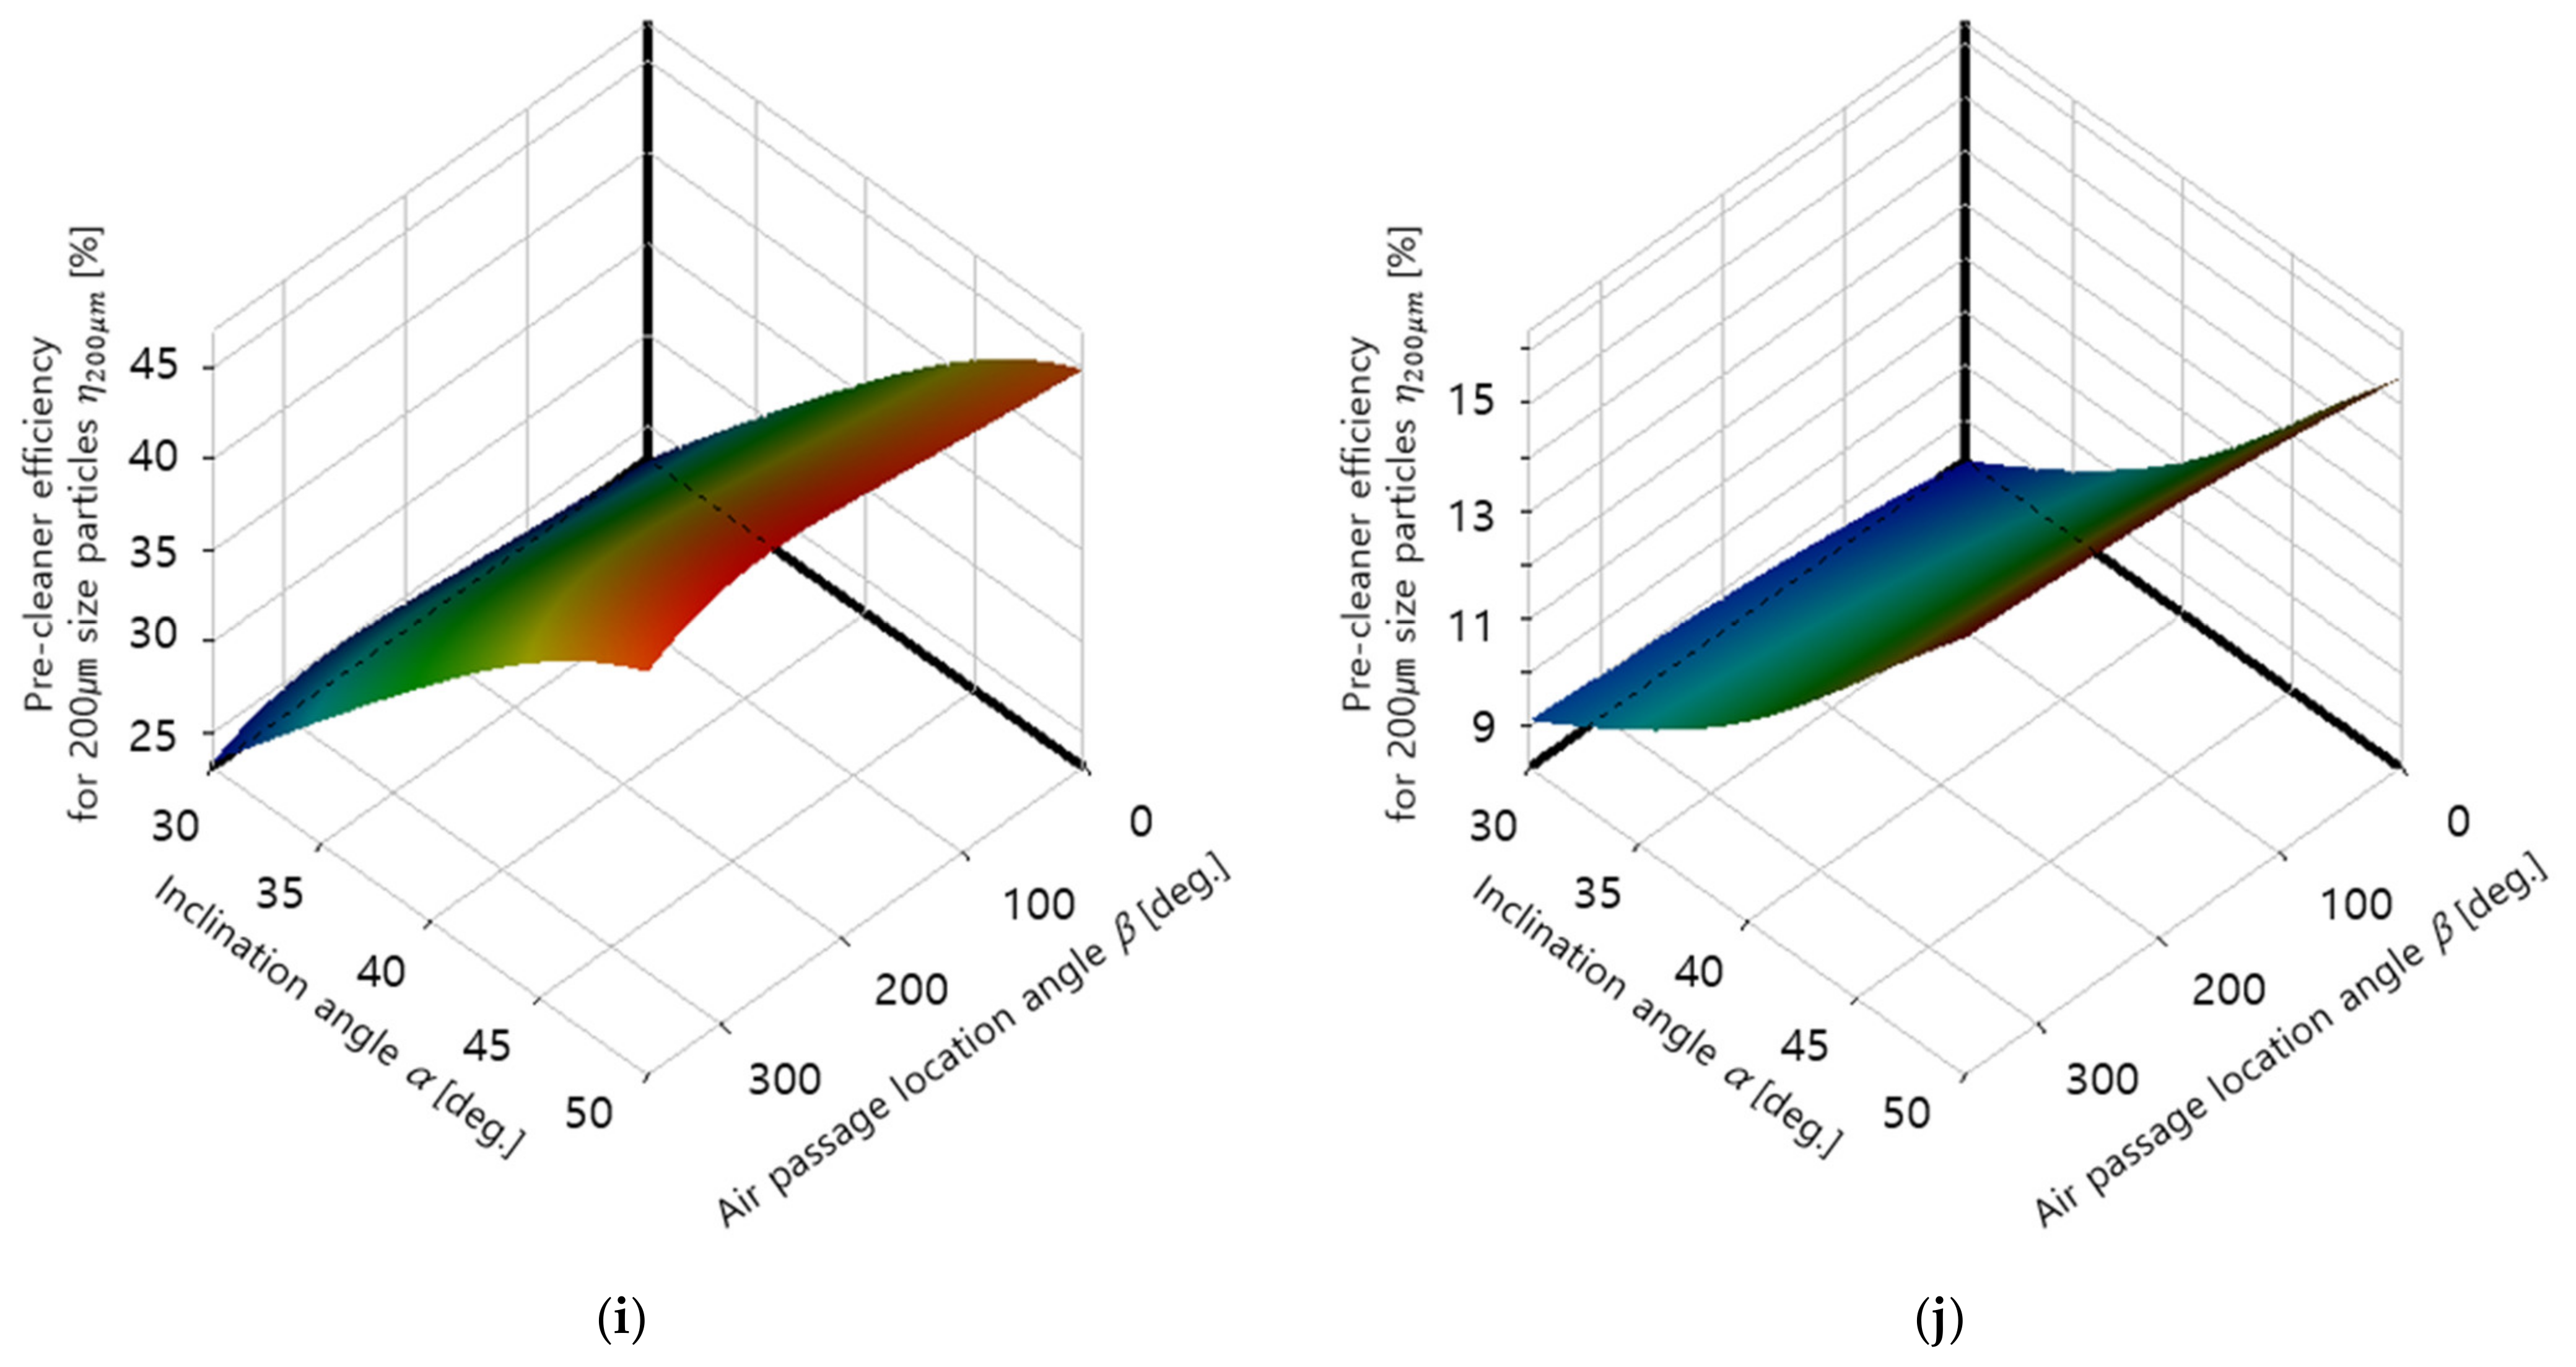
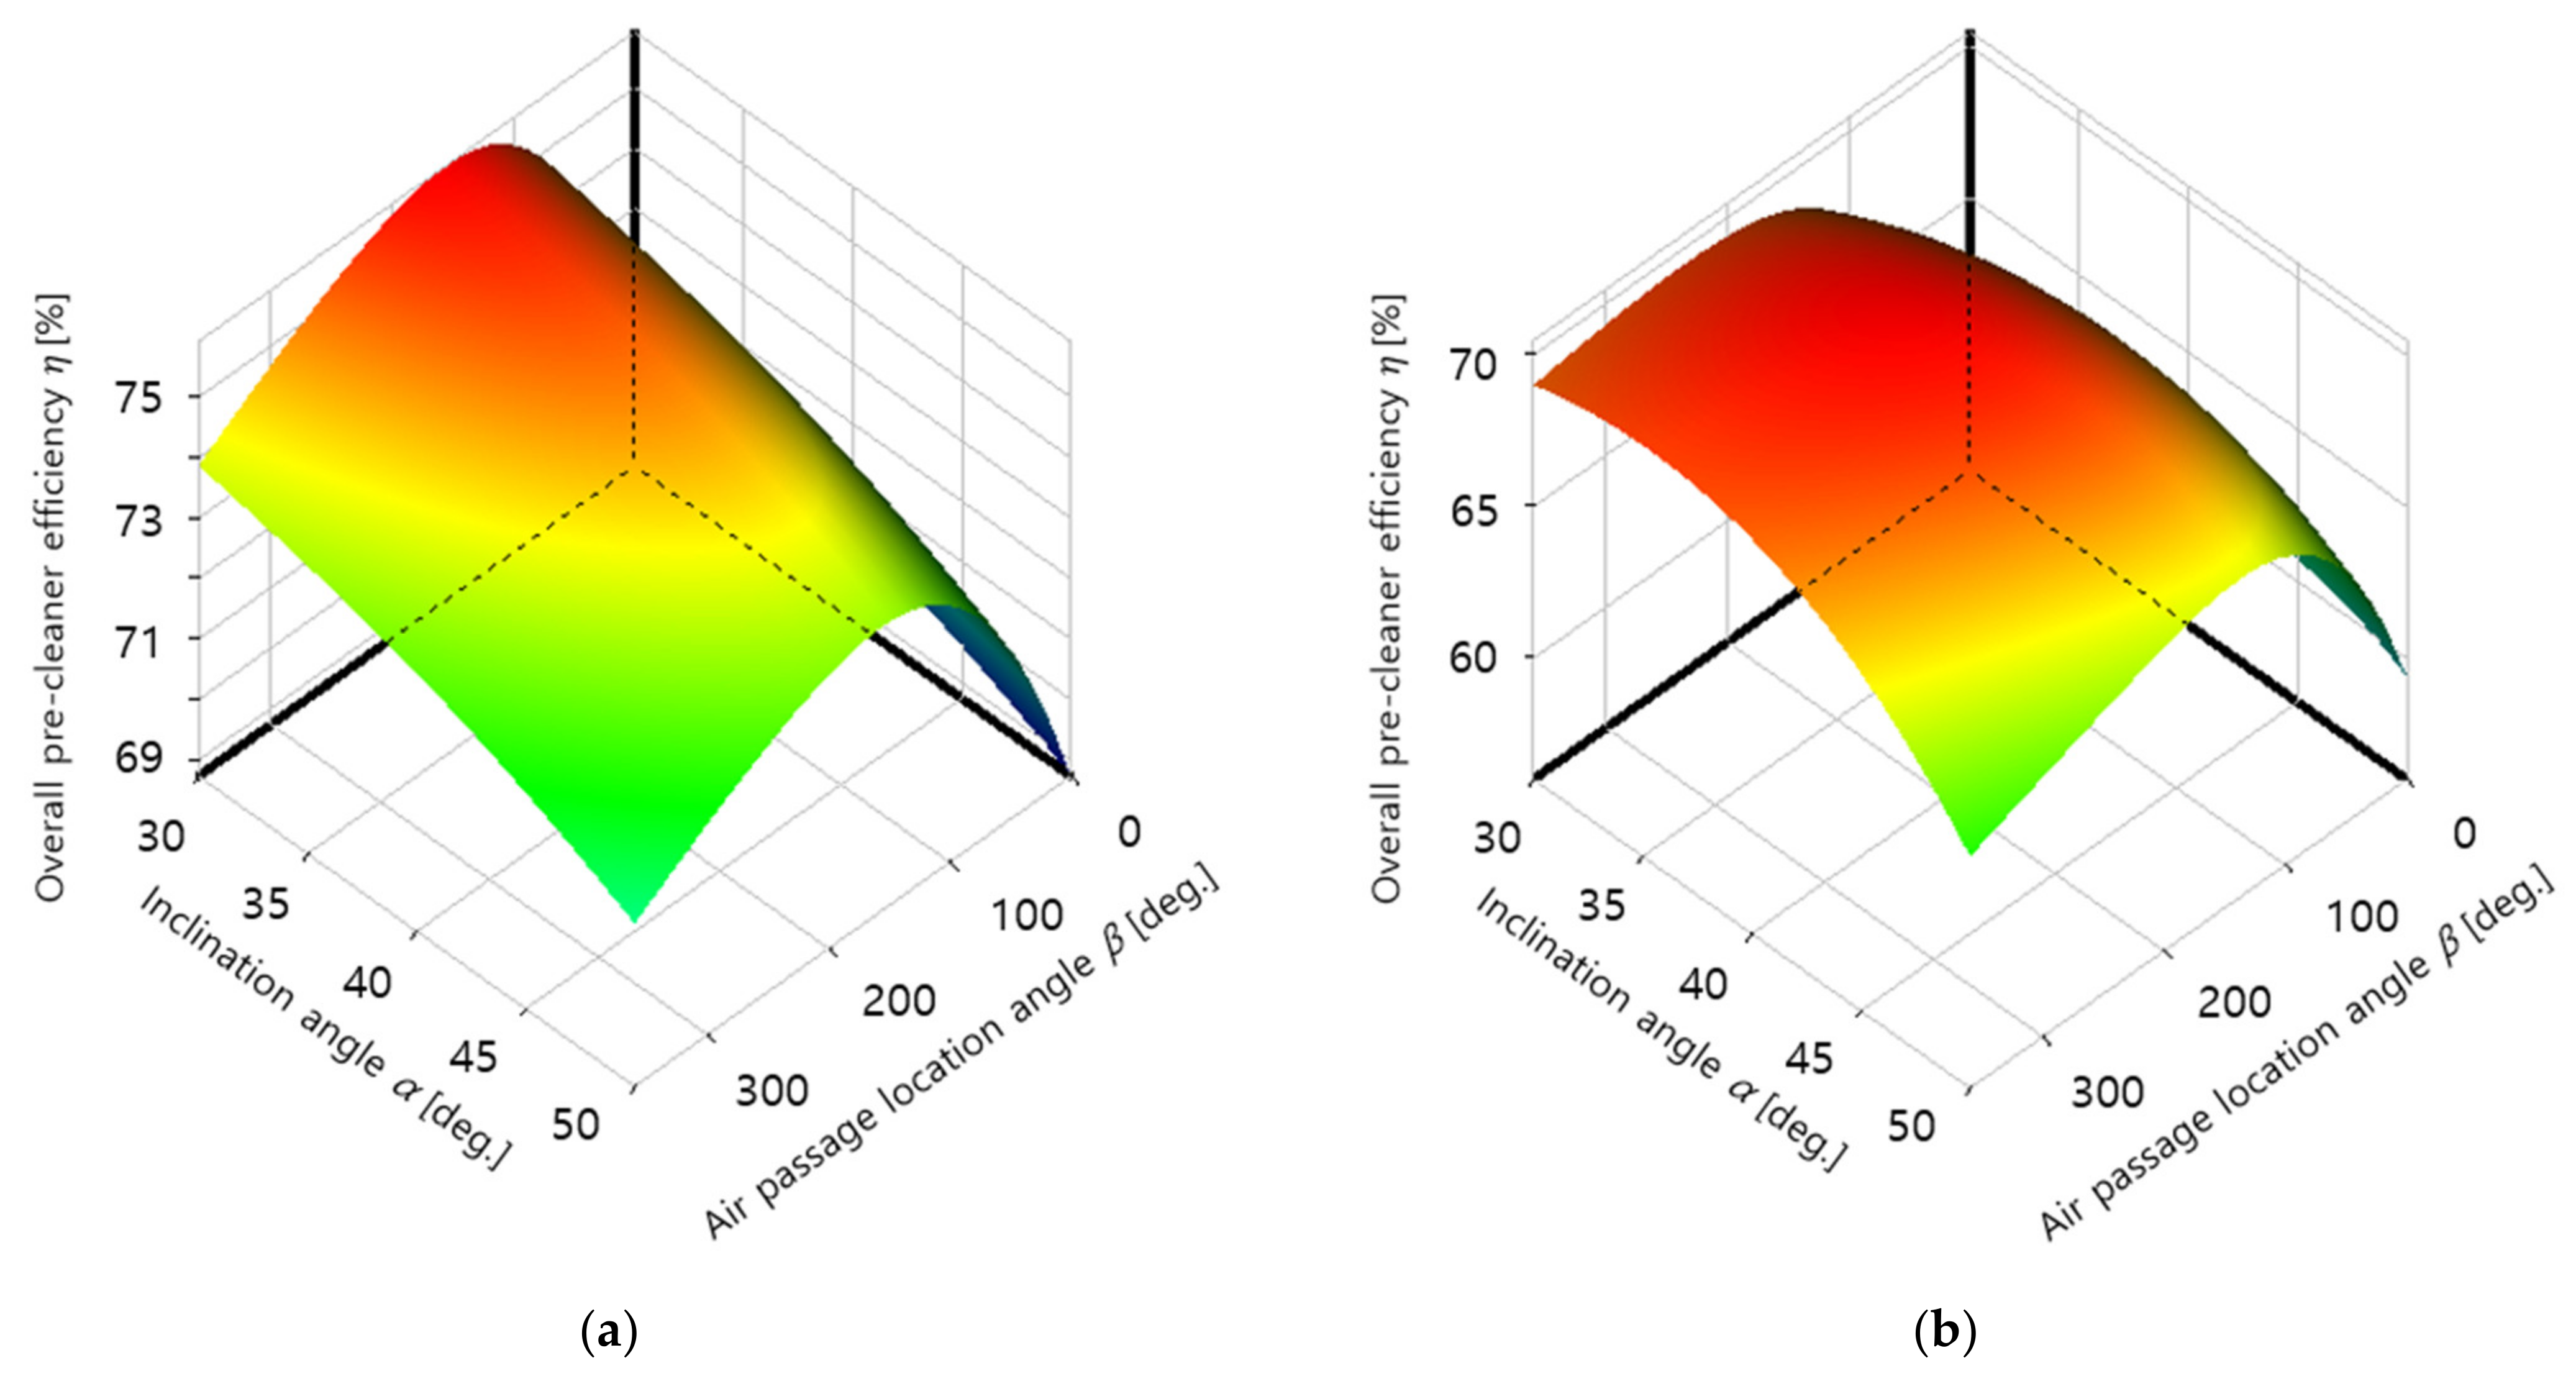
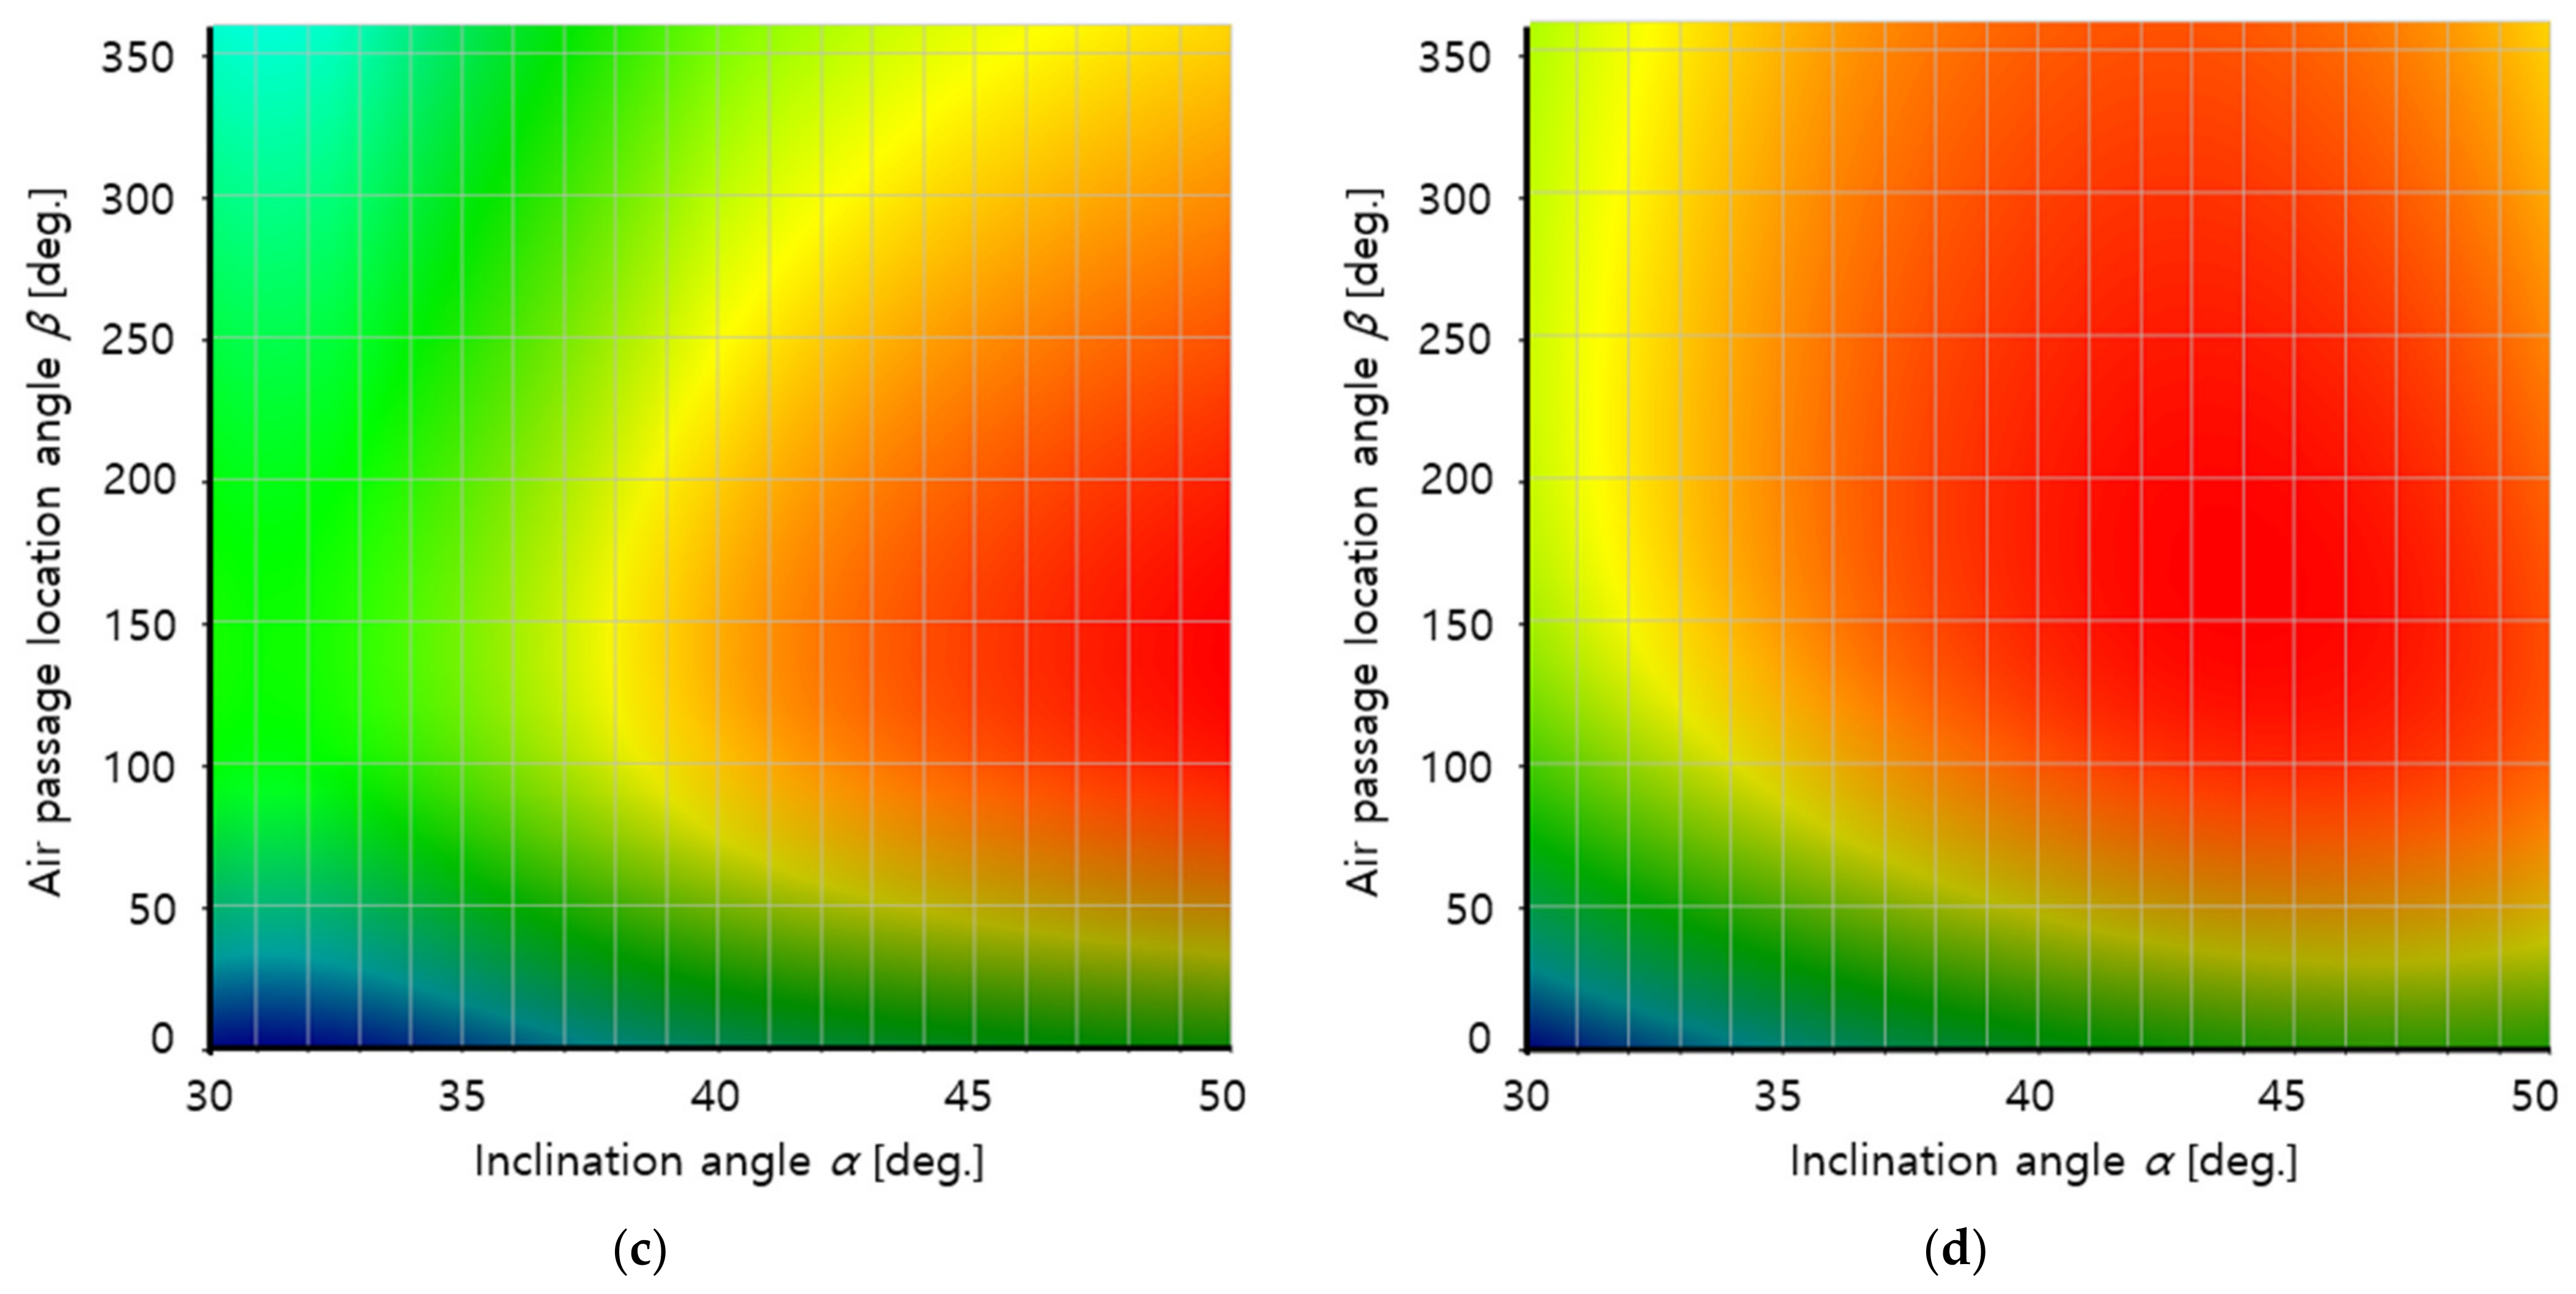
- The overall pre-cleaner efficiency , which represents the dust particle filtering capacity of the pre-cleaner, was defined for optimization. The analysis results showed that was maximized for the target filter at α = 30° and β = 156° for 4500 rpm, which is the operating condition commonly used by UTVs, and at α = 37° and β = 233° for 6000 rpm, which can produce the maximum UTV engine output.
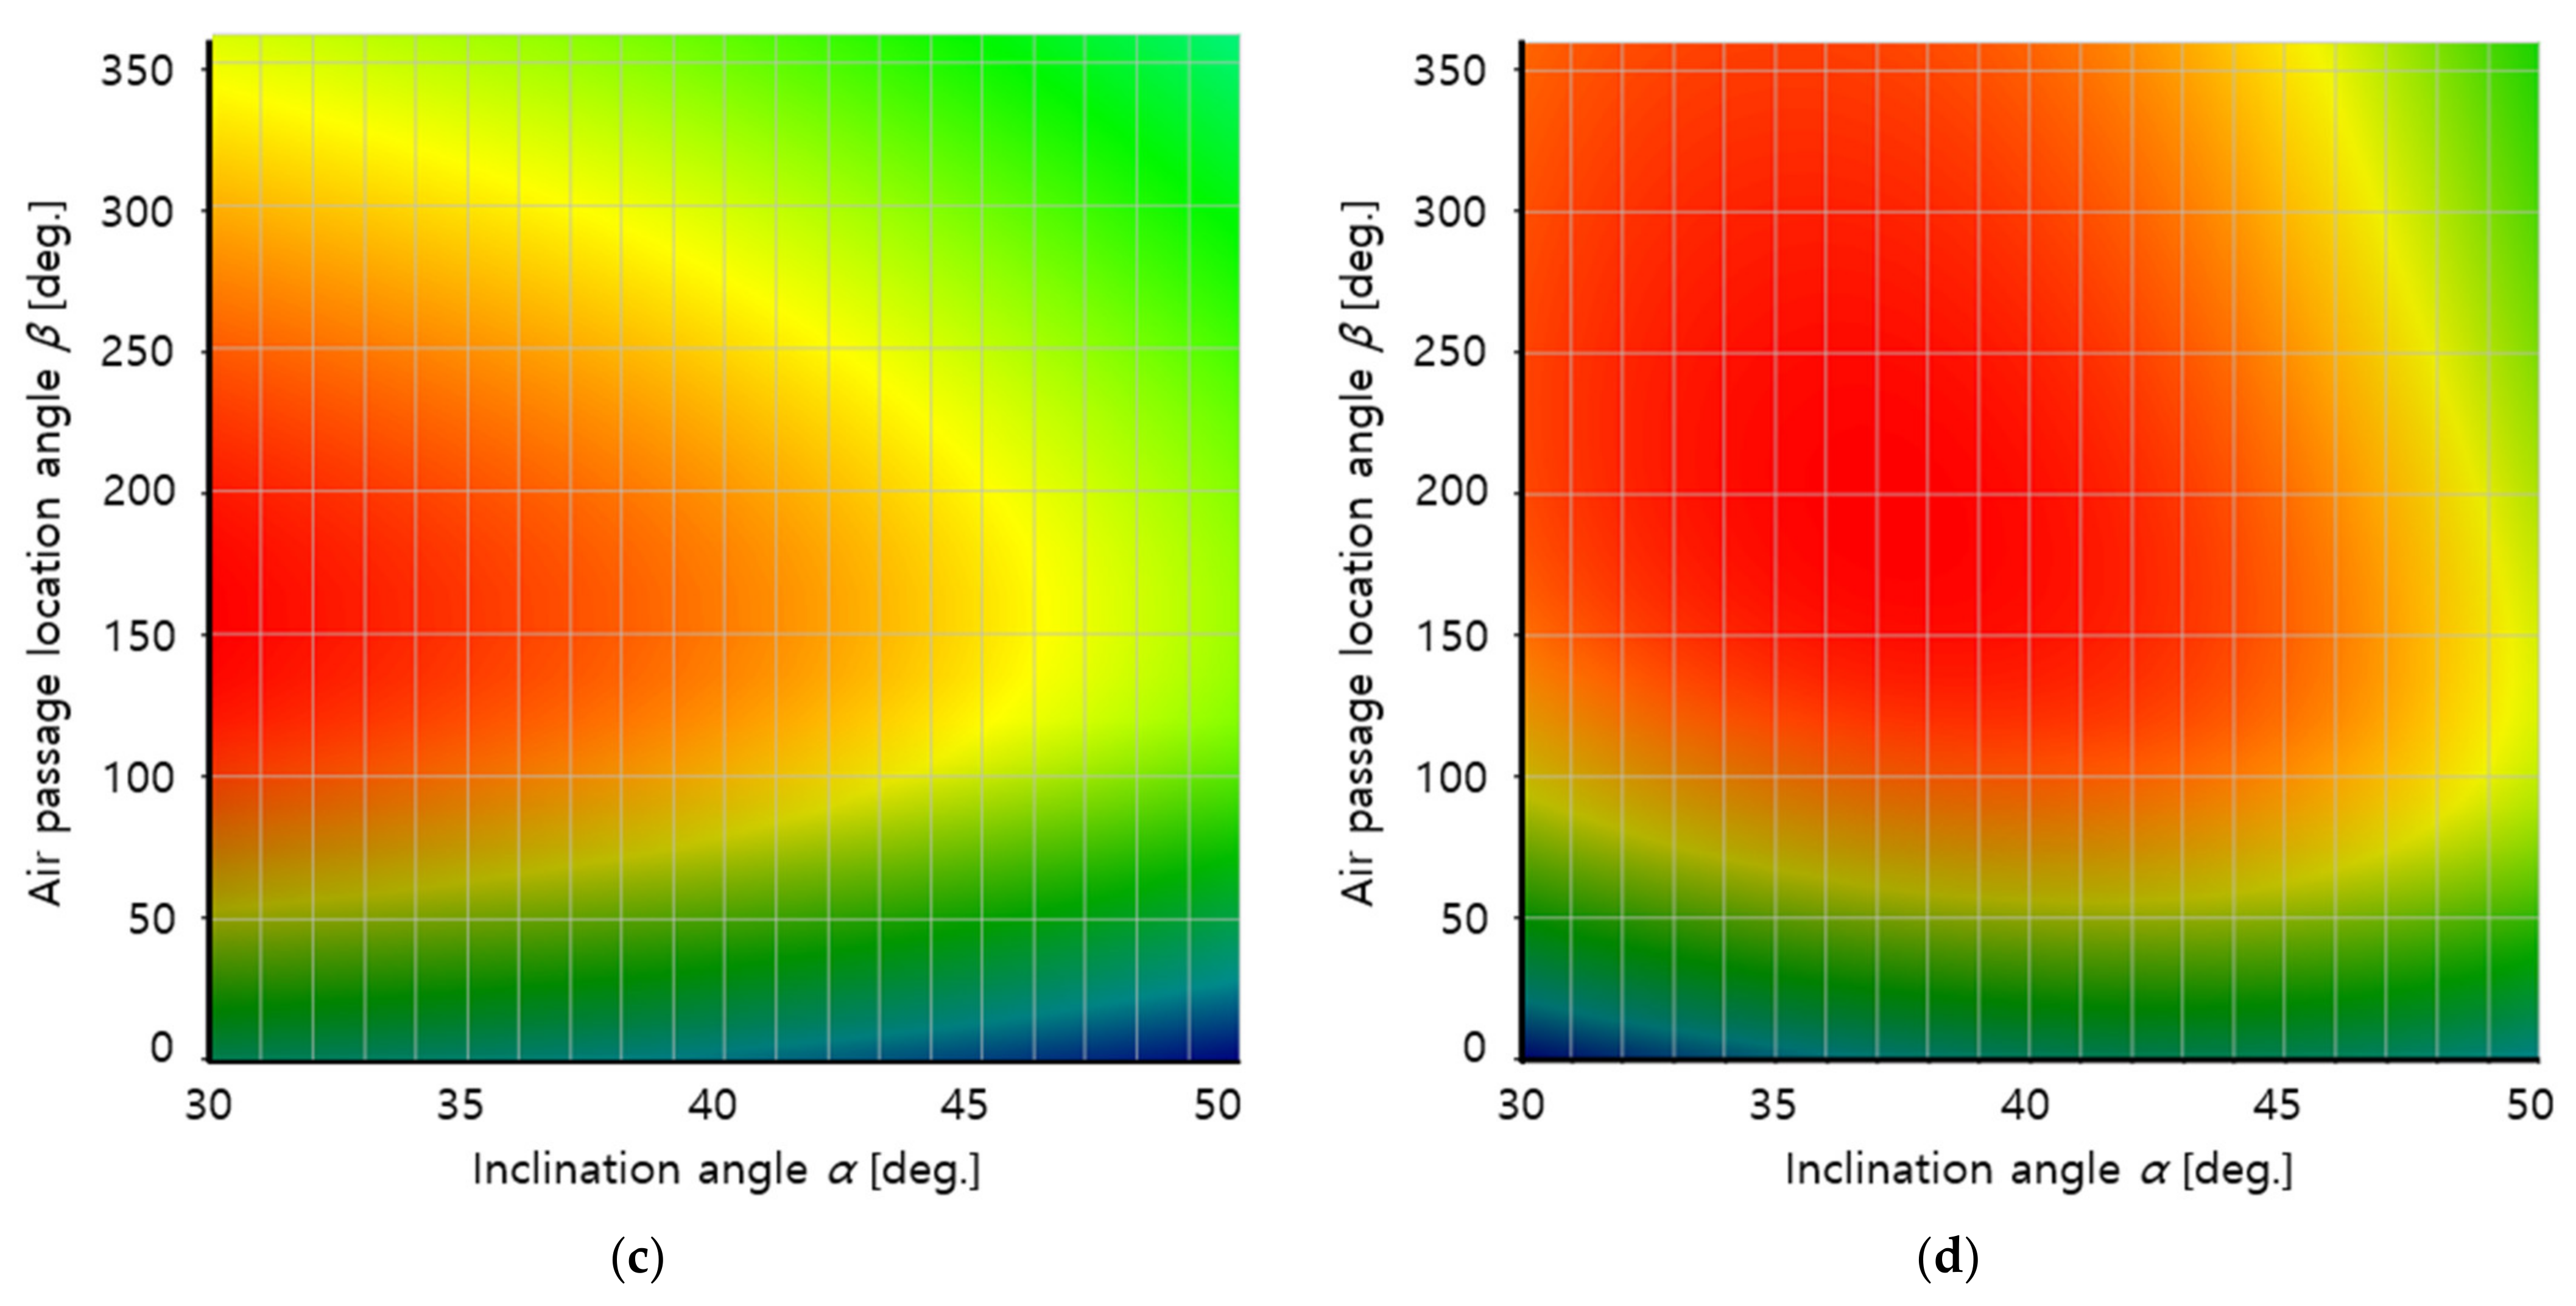
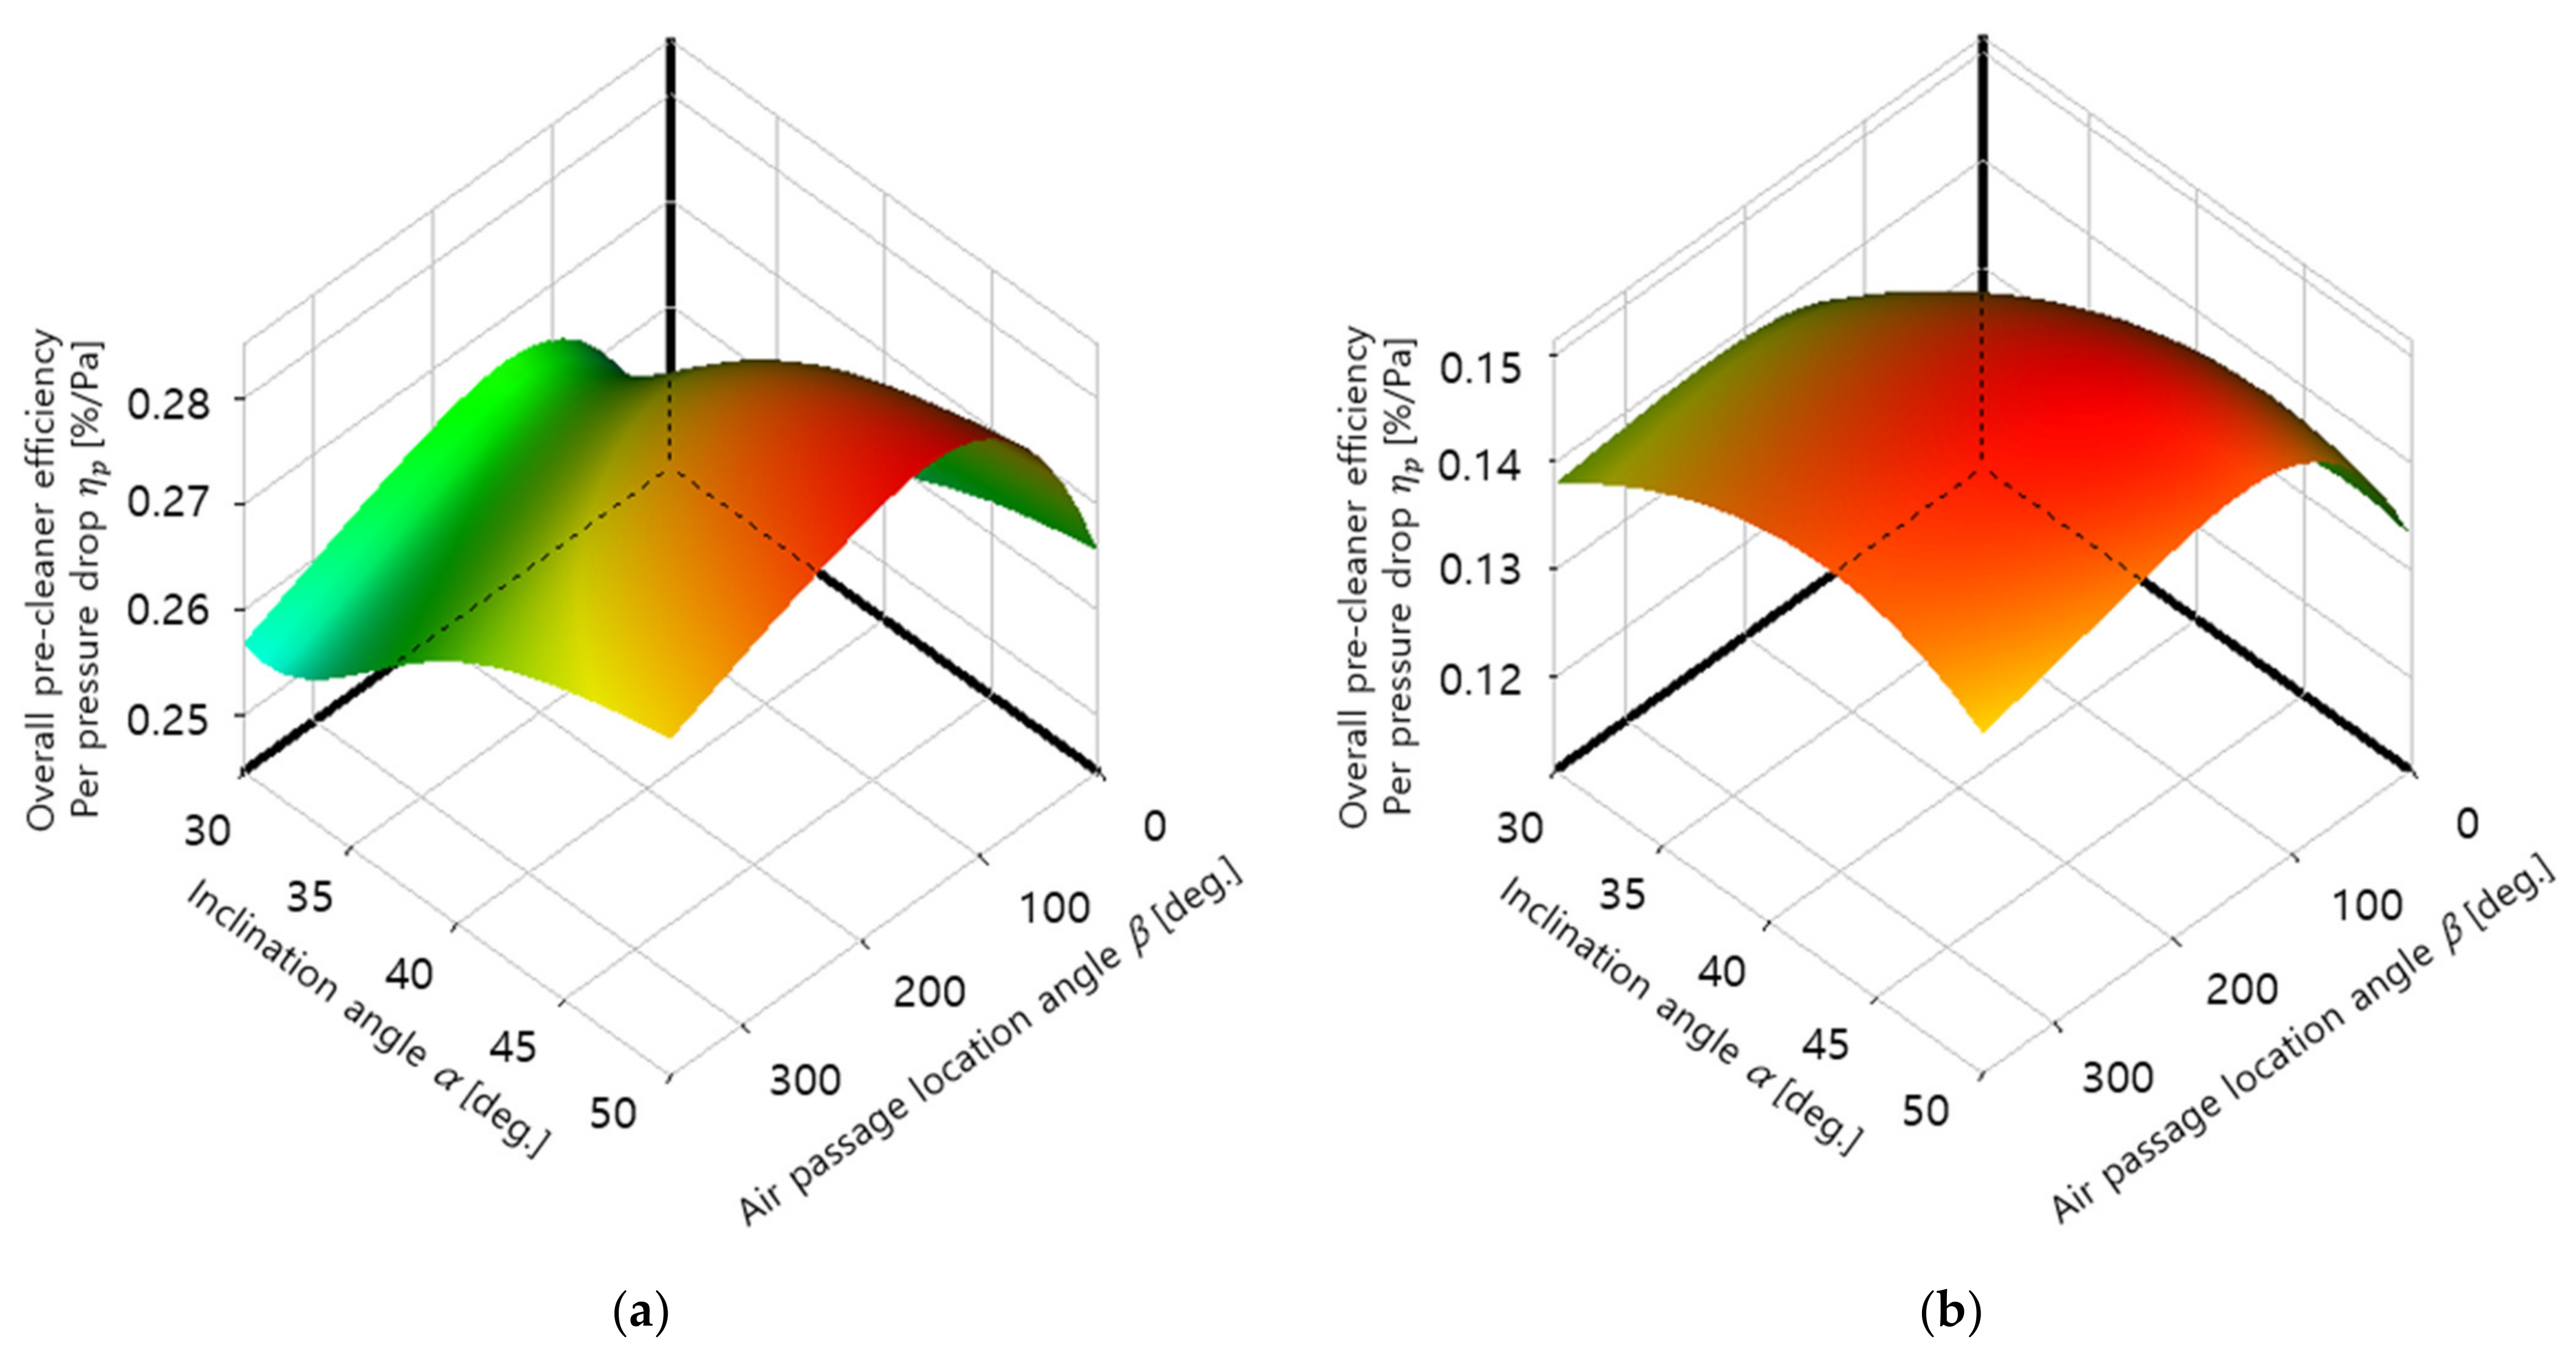
- The overall pre-cleaner efficiency per pressure drop was defined considering both the dust particle filtering capacity of the filter and the degradation of filter functionality due to the increase in flow resistance. The results indicated that the target filter has the largest at α = 50° and β = 163° for 4500 rpm and at α = 44° and β = 164° for 6000 rpm.
Author Contributions
Funding
Acknowledgments
Conflicts of Interest
References
- Maddineni, A.K.; Das, D.; Damodaran, R.M. Numerical investigation of pressure and flow characteristics of pleated air filter system for automotive engine intake application. Sep. Purif. Technol. 2019, 212, 126–134. [Google Scholar] [CrossRef]
- Mahesh, J. Parametric Study and CFD Analysis of Air Filter. Asian J. Converg. Technol. 2019, 5, 1–9. [Google Scholar]
- Allam, S.; Elsaid, A.M. Parametric study on vehicle fuel economy and optimization criteria of the pleated air filter designs to improve the performance of an I.C diesel engine: Experimental and CFD approaches. Sep. Purif. Technol. 2020, 241, 116680. [Google Scholar] [CrossRef]
- Dziubak, T.; Szwedkowicz, S. Experimental research on nonwoven filter fabric for intake air filtration in the IC engine of an off-road vehicle. Arch. Motoryz. 2014, 66, 3–22. [Google Scholar]
- Song, H.S.; Yang, B.M.; Cho, H.M. A Study on the Optimum Shape of Automobile Air Cleaner Diffuser. Int. J. Appl. Eng. Res. 2017, 12, 3377–3381. [Google Scholar]
- Ramasamy, D.; Zamri, M.; Mahendran, S.; Vijayan, S. Design Optimization of Air Intake System (AIS) of 1.6L Engine by Adding Guide Vane. In Proceedings of the International MultiConference of Engineers and Computer Scientists 2010 Vol II, IMECS 2010, Hong Kong, China, 17–19 March 2010. [Google Scholar]
- Engine Air Filtration for Light, Medium, & Heavy Dust Conditions. Available online: https://www.donaldson.com/content/dam/donaldson/engine-hydraulics-bulk/catalogs/air-intake/north-america/F110027-ENG/Air-Intake-Systems-Product-Guide.pdf (accessed on 5 April 2021).
- Xiongbo, D.; Yiqun, L.; Jingping, L.; Lai, M.-C.; Jansons, M.; Guo, G.; Zhang, S.; Tang, Q. Experimental and numerical investigation of the effects of low-pressure, high-pressure and internal EGR configurations on the performance, combustion and emission characteristics in a hydrogen-enriched heavy-duty lean-burn natural gas SI engine. Energy Convers. Manag. 2019, 195, 1319–1333. [Google Scholar]
- Xiongbo, D.; Lai, M.-C.; Jansons, M.; Guo, G.; Liu, J. A review of controlling strategies of the ignition timing and combustion phase in homogeneous charge compression ignition (HCCI) engine. Fuel 2021, 285, 119142. [Google Scholar]
- Yun, J.E. 1-D transient emission analysis of LPG engine catalytic converter with secondary air injection during cold start period of CVS-75 mode. Int. J. Automot. Technol. 2013, 14, 343–353. [Google Scholar] [CrossRef]
- International Standards Organization (ISO). ISO 12103-1:2016, Road Vehicles—Test Contaminants for Filter Evaluation; ISO: Geneva, Switzerland, 2016. [Google Scholar]
- Atac, O.F.; Yun, J.E.; Noh, T.H. Aerodynamic Design Optimization of a Micro Radial Compressor of a Turbocharger. Energies 2018, 11, 1827. [Google Scholar] [CrossRef] [Green Version]
- ANSYS, Inc. ANSYS CFX-Solver Theory Guide, Release R1; ANSYS: Canonsburg, PA, USA, 2020. [Google Scholar]
- Al-Sarkhi, A.; Chambers, F.W. Optimization technique for design of automotive air filter housings with improved fluid dynamic performance and filtration. Part Sci. Technol. 2004, 22, 235–252. [Google Scholar] [CrossRef]
- Coates, M.S.; Chan, H.K.; Fletcher, D.F.; Raper, J.A. Effect of Design on the Performance of Dry Power Inhaler Using Computational Fluid Dynamics. Part 2: Air Inlet Size. J. Pharm. Sci. 2006, 95, 1382–1392. [Google Scholar] [CrossRef] [PubMed]
- Zhang, Z.; Chen, Q. Comparison of the Eulerian and Lagrangian Methods for Predicting Particle Transport in Enclosed Spaces. Atmos. Environ. 2007, 41, 5236–5248. [Google Scholar] [CrossRef]
- ANSYS, Inc. ANSYS CFX Tutorials, Release R1; ANSYS: Canonsburg, PA, USA, 2020. [Google Scholar]
- ANSYS, Inc. ANSYS Design Exploration, Release R1; ANSYS: Canonsburg, PA, USA, 2020. [Google Scholar]


| Chemical | Mass Fraction (%) |
|---|---|
| 68 to 76 | |
| 10 to 15 | |
| 2 to 5 | |
| 2 to 4 | |
| 2 to 5 | |
| 1 to 2 | |
| 0.5 to 1 | |
| 2 to 5 |
| Particle Size Range (µm) | Weight (%) 1 | |
|---|---|---|
| Fine (On-Road) | Course (Off-Road) | |
| 0–5 | 39 | 12 |
| 5–10 | 18 | 12 |
| 10–20 | 16 | 14 |
| 20–40 | 18 | 23 |
| 40–80 | 9 | 30 |
| 80–200 | 0 | 9 |
| Item | Condition |
|---|---|
| Fluid and particles | Air (continuous fluid) and (particle transport solid) |
| No. of meshes | 4,125,298 |
| Turbulence model | Shear Stress Transport (SST) |
| Inlet boundary conditions | Air temperature = 25 °C Air pressure = 1 bar |
| Outlet boundary conditions | Air mass flow = 0.0255 kg/s @ 4500 rpm 0.0340 kg/s @ 6000 rpm |
| Particle tracking | One-way coupled |
| Particle size distribution |
Publisher’s Note: MDPI stays neutral with regard to jurisdictional claims in published maps and institutional affiliations. |
© 2021 by the author. Licensee MDPI, Basel, Switzerland. This article is an open access article distributed under the terms and conditions of the Creative Commons Attribution (CC BY) license (https://creativecommons.org/licenses/by/4.0/).
Share and Cite
Yun, J.-E. Optimal Design of Off-Road Utility Terrain Vehicle Air Filter Intake. Energies 2021, 14, 2269. https://doi.org/10.3390/en14082269
Yun J-E. Optimal Design of Off-Road Utility Terrain Vehicle Air Filter Intake. Energies. 2021; 14(8):2269. https://doi.org/10.3390/en14082269
Chicago/Turabian StyleYun, Jeong-Eui. 2021. "Optimal Design of Off-Road Utility Terrain Vehicle Air Filter Intake" Energies 14, no. 8: 2269. https://doi.org/10.3390/en14082269
APA StyleYun, J.-E. (2021). Optimal Design of Off-Road Utility Terrain Vehicle Air Filter Intake. Energies, 14(8), 2269. https://doi.org/10.3390/en14082269