Article

Experimental Analysis of the Mechanical Properties and Resistivity of Tectonic Coal Samples with Different Particle Sizes

School of Resources and Geosciences, China University of Mining and Technology, Xuzhou 221116, China
*
Author to whom correspondence should be addressed.
The first two authors contributed equally to this work.
Energies 2021, 14(8), 2303; https://doi.org/10.3390/en14082303
Submission received: 23 March 2021 / Revised: 6 April 2021 / Accepted: 15 April 2021 / Published: 19 April 2021
(This article belongs to the Section L: Energy Sources)

Abstract

:
Because of its weak cementation and abundant pores and cracks, it is difficult to obtain suitable samples of tectonic coal to test its mechanical properties. Therefore, the research and development of coalbed methane drilling and mining technology are restricted. In this study, tectonic coal samples are remodeled with different particle sizes to test the mechanical parameters and loading resistivity. The research results show that the particle size and gradation of tectonic coal significantly impact its uniaxial compressive strength and elastic modulus and affect changes in resistivity. As the converted particle size increases, the uniaxial compressive strength and elastic modulus decrease first and then tend to remain unchanged. The strength of the single-particle gradation coal sample decreases from 0.867 to 0.433 MPa and the elastic modulus decreases from 59.28 to 41.63 MPa with increasing particle size. The change in resistivity of the coal sample increases with increasing particle size, and the degree of resistivity variation decreases during the coal sample failure stage. In composite-particle gradation, the proportion of fine particles in the tectonic coal sample increases from 33% to 80%. Its strength and elastic modulus increase from 0.996 to 1.31 MPa and 83.96 to 125.4 MPa, respectively, and the resistivity change degree decreases. The proportion of medium particles or coarse particles increases, and the sample strength, elastic modulus, and resistivity changes all decrease.

1. Introduction

The local and regional tectonic movements during coalification and post-coalification could cause severe deformation on coal-bearing sequences. Consequently, tectonically deformed coal or tectonic coal has been damaged, squeezed, and deformed by tectonic activity [1,2,3,4,5,6,7]. It is characterized by weak cementation and a broken structure rich in pores and cracks [8,9,10]. Hence, tectonic coal could display variations on rank, mineralogical, elemental and porosity characteristic than un affected coal, which could have influence on coal bed methane potential and coal out-burst risk [1,5,6,11,12,13]. At present, research on tectonic coal has focused on gas disaster prevention and coalbed methane mining, but there are few studies on its mechanical properties [14]. The lack of knowledge on its basic mechanical properties has restricted the tectonic coal technology and coalbed methane mining, so research on the mechanical properties of tectonic coal is necessary [15].
The lack of in situ samples has limited research on the mechanical properties of tectonic coals. The replacement of briquettes has become a standard method used by most scholars. In earlier days, the specific gravity and pore characteristics of briquettes and raw coal indicated that their parameter changes were consistent, and briquettes could be used instead of raw coal for research [16]. Later, Tu [17], Sobczyk [18,19], and Wang [20] used briquettes to study the destruction of tectonic coal seams and the evolution of gas disasters and influencing factors. However, the size of the tectonic coal particles required for the preparation of the briquettes was different. Its particle size and gradation are directly related to the mechanical properties. Therefore, studying the effects of particle size on the mechanical properties of tectonic coal has become a priority [21,22]. Research on the influence of particle size on the mechanical properties of briquettes has mainly been conducted in China. According to the different research materials, the research can be divided into the following categories. Some studies have used ordinary pulverized coal to study the impact of particle size on briquettes. For example, Denggao et al. [23] researched the influences of coal particle size on briquettes and found that the ratio of raw material particle size affected the quality and mechanical properties of the briquettes. Bin et al. [24] and Lunjian et al. [25] studied the relationship between the particle size of pulverized coal and the strength of briquettes and found that the best gradation of pulverized coal composition was coarse particles first, then fine particles, and medium particles last. Some researchers used similar materials with adhesives to begin their research. Zhang Jinshan et al. [26] used sodium humate and coal particles of different sizes to make briquettes and tested their mechanical properties. A few scholars used tectonic coal for study, but their purpose was to prevent coal and gas outbursts. Jiang et al. [27,28] studied the influence of pulverized coal particle size on the strength of coal and gas outbursts and concluded that the smaller the coal particle size, the greater the coal and gas outburst strength. However, research on the influence of particle size on the mechanical properties of tectonic coal is still lacking.
The introduction of electrical resistivity has been helpful for the in-depth exploration of the failure performance of tectonic coal. Lei et al. [29] conducted an experiment on the resistivity change of tectonic coal under uniaxial conditions and found that the physical parameters of tectonic coal changed under stress, and the resistivity changed accordingly. Wang Enyuan et al. [30,31] and Wang Yungang et al. [32] also proved this point by testing the resistivity of loaded coal samples. Since then, different scholars have researched various aspects. Chen et al. [33] studied the failure process of different coal rock samples and obtained the full stress–strain process resistivity change characteristics of coal rock. Qiu Haisheng [34] used an acoustic emission-resistivity system to test the acoustic-electric signal of a compressed coal sample, indicating that the resistivity change was directly related to the coal resistivity change and internal pore development. Li [35] tested the resistivity change of coal with different loading modes and found that the resistivity curve showed a “V”-shaped change during the loading process. Li [36] also studied the anisotropy of resistivity in a loaded coal sample. These experiments showed that the electrical resistivity test can reflect the dynamic changes in the internal structure in tectonic coal mechanical experiments. However, the law of electrical resistivity affected by particle size still needs further development.
In general, this study used tectonic coal particles to prepare samples with different particle sizes and gradations and subjected them to uniaxial compression failure under the testing of resistivity changes to obtain mechanical property parameters. We compared and analyzed the experimental results and acquired the mechanical properties and resistivity changes of coal samples with different particle sizes and gradations.

2. Experimental Design and Methods of Tectonic Coal with Different Particle Sizes

2.1. Tectonic Coal Source

The raw materials used in the preparation of tectonic coal samples are taken from the 11-2 coal seam 1216 (1) working face of the Zhangji coal mine in the Huainan mining area (as shown in Figure 1).

2.2. Experimental Design

2.2.1. Tectonic Coal Sample Preparation

The undisturbed tectonic coal particles were screened and divided into three main particle groups: coarse particles Φ1 (1 mm~5 mm), medium particles Φ2 (0.25 mm~1 mm), and fine particles Φ3 (0~0.25 mm) (as shown in Figure 2a).
Ten kinds of grading schemes were set up for experimental research (as shown in Figure 2b). GD100, GD010, and GD001 are single-particle gradations. Their particle size is decreasing. The others are composite-particle gradations, and the proportions of particles of different sizes are different. Furthermore, GF111, GF114, and GF118 are the sequence with the fine-particle proportion increasing, GF111, GF141, and GF181 are the sequence with the medium-particle proportion increasing, and GF111, GF411, and GF811 are the sequence with the coarse-particle proportion increasing.
The other conditions for preparing the tectonic coal samples (forming pressure of 25 MPa, additive water of 10%, and forming time of 30 min) are consistent. After natural drying at room temperature, both ends of the sample were polished to obtain a cylindrical sample with a diameter of 50 mm and a smooth upper and lower surface. There were three samples for each grading scheme to avoid accidental test errors, a total of 30 samples were used in this study.

2.2.2. Parameters and Experimental Design

Physical Property Parameters

The parameters selected include mass, height, density, the nonuniformity coefficient Cu, the curvature coefficient Cc, and the converted particle size ϕ. The converted particle size ϕ is calculated by
ϕ = m m i ϕ i ¯
m is the total mass of the tectonic coal sample in g; mi is the mass of each particle size component in g; ϕi is the average particle size of each group in mm; ϕ is the converted particle size in mm.

Stress–Strain Curve and Mechanical Parameters

The stress–strain curve of a uniaxial test was selected. The selection of mechanical parameters included uniaxial compressive strength (Rc), compaction modulus e, elastic modulus E, postpeak modulus M, and brittleness index k [37]. The loading rate of the uniaxial test was 0.5 mm/s, and the recording interval was 1 s.

Resistivity

Resistivity was tested by the Brace method [38,39]. The specific operation arranged copper electrodes at both ends of the sample with an insulating layer to prevent instrument interference. During loading, the resistance was tested at the same time to obtain the resistance curve of the tectonic coal sample during the loading process. The parameter resistivity is calculated by
r = Δ U L I S ,
r is the sample’s resistivity in Ω·m; ΔU is the voltage drop in V; I is the current in A; L is the length in m; and S is the cross-sectional area of the sample in m2. The obtained resistivity is the uniform resistivity, also called the apparent resistivity. The LCR digital bridge sets the test signal as 10 kHz, the test signal level as 0.3 Vrms, the test speed as 5 kHz, and the resistance record interval as 10 s.

2.2.3. Experimental System

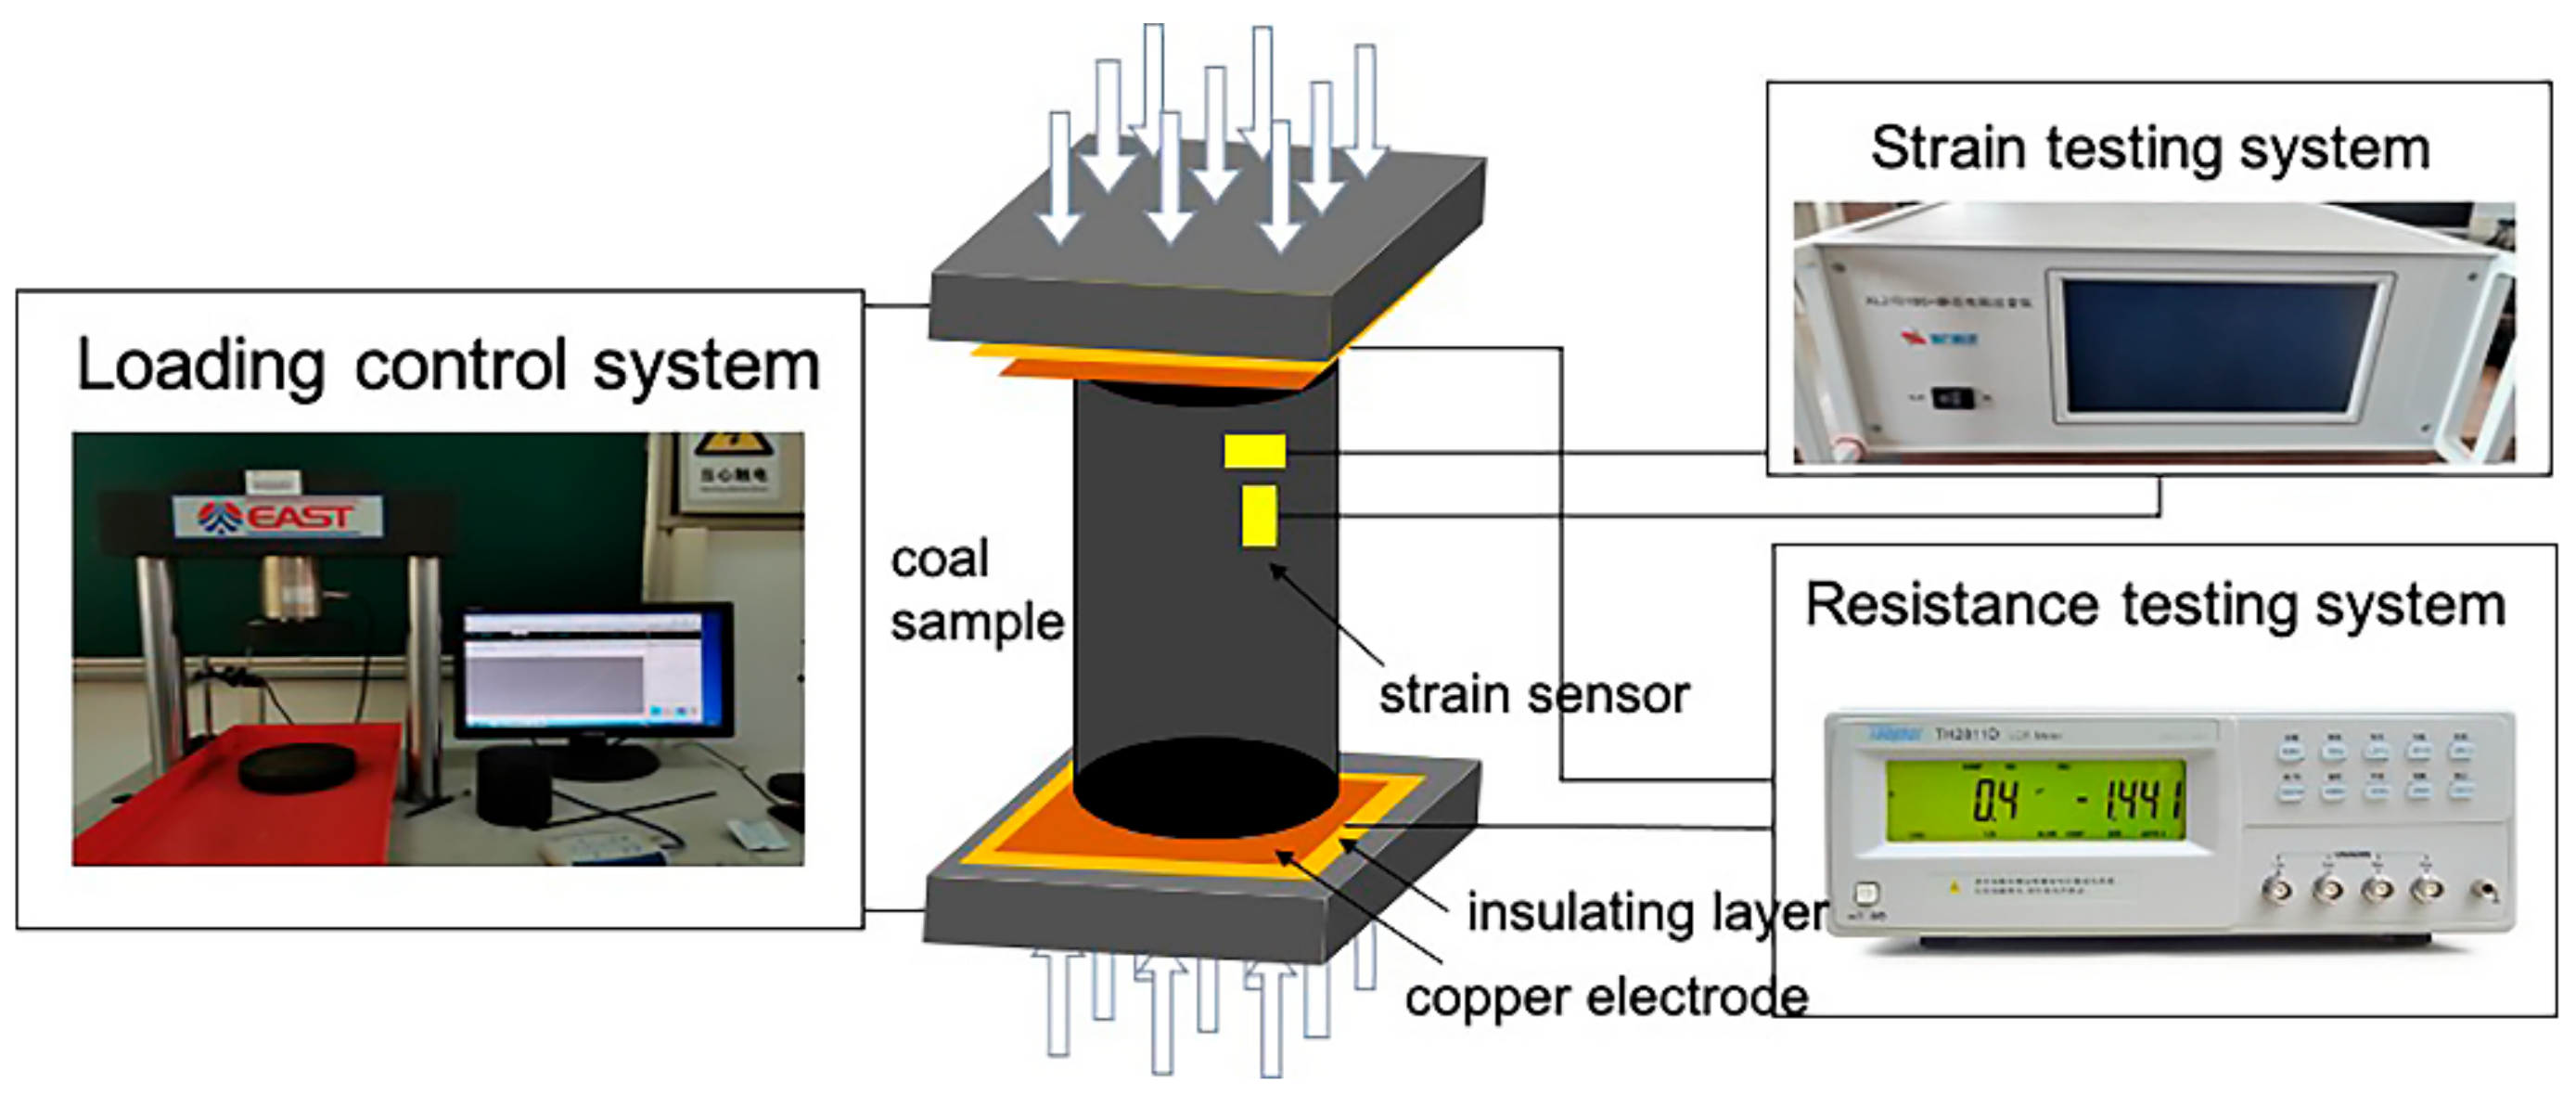
The practical experimental system has three parts: the loading control system, the resistivity test system, and the strain test system (as shown in Figure 3). The loading system consists of a computer-controlled servo press (Jinan Dongfang Testing Instrument Model YAW-300Y) and a test bench, which can set the target stress, loading rate, record time, and loading process displacement. The maximum test range is 150 MPa. The resistivity test system consists of an LCR bridge (Tonghui TH2811D). The test frequencies are 300 Hz, 1 kHz, and 10 kHz, and the test accuracy can reach 0.1 Ω. The strain test system includes a static resistance strain gauge (Xie Li XL2101B5+), which can be collected 100,000 times continuously.

3. Results of Different Particle Size Tectonic Coal Sample Tests

3.1. Physical Parameters

The rank of tectonic coal is gas coal. The vitrinite accounts for about 56.8%~63.7% of the microscopic components, the inertinite accounts for about 26%, and the liptinite accounts for about 16%. An industrial analysis of the tectonic coal included air-dry base moisture (Mad), average ash yield (Ad), average volatile yield (Vdaf), sulfur (St.d), carbon content (C), hydrogen content (H), oxygen content (O), and nitrogen content (N) (as shown in Table 1) [40].
The density of remodeled tectonic coal samples ranges between 1.29 and 1.4 g·cm−3, consistent with the geological data. The initial resistivity is between 0.0264 and 0.0688 MΩ·m, tested as the background value (as shown in Table 2)

3.2. Stress–Strain Curves

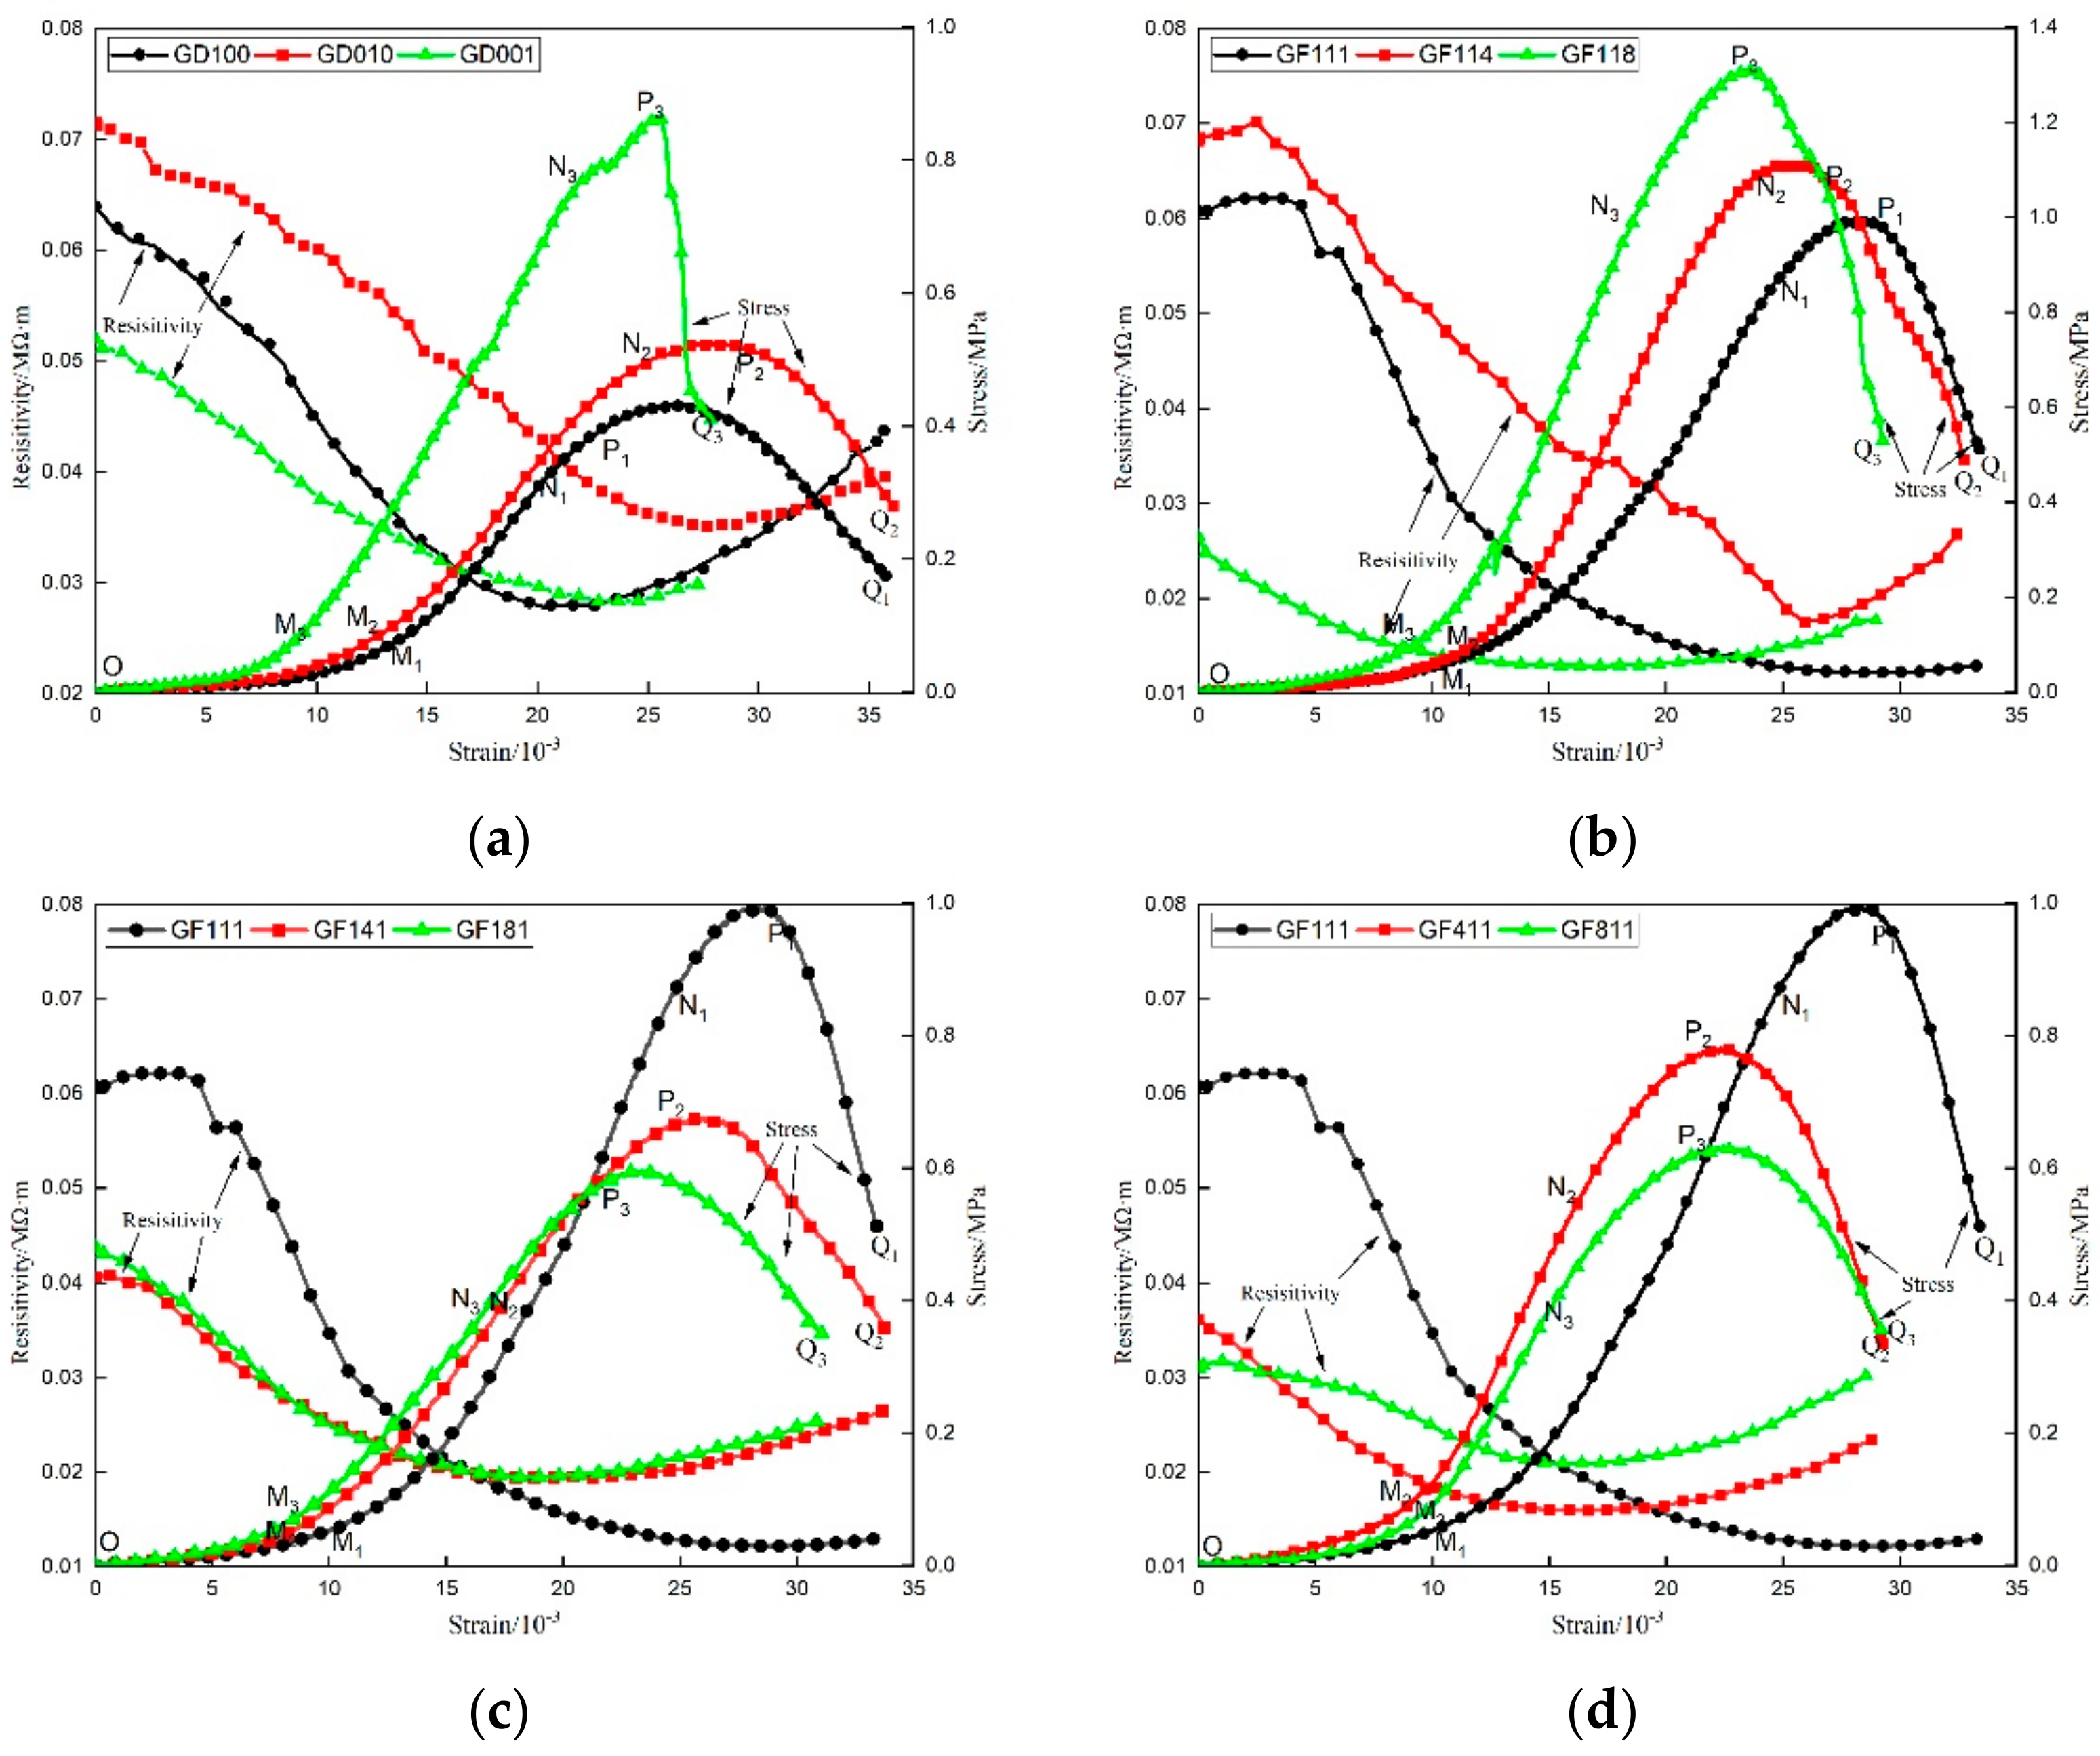
The stress–strain curves of different particle size tectonic coal samples are different, and they are grouped in figures (as shown in Figure 4).
The shape of the stress–strain curve of tectonic coals of different particle sizes changes with the particle size and gradation. In single-particle gradation, the particle size decreases cause the slope value of the curve rises, and the peak value is distinct. In composite-particle gradation, the proportion of fine particles increases, causing the slope value of the curve to rise and the upward trend to be distinct. The proportion of medium particles or coarse particles increases, causing the slope value of the curve to fall. The inflection points also move forward, and the peaks become less noticeable. Although the tectonic coal sample strength is low, all experimental tectonic coal sample stress–strain curves show the same stage characteristics as intact coal [17,29,35]. The stress–strain curve of tectonic coal samples with different particle sizes should contain four stages according to their common characteristics.
1.
Compaction stage (OM). The stress–strain curve rises with a small slope. The pores of the sample are closed immediately under force, and the coal particles rearrange their location. The deformation at this stage is plastic deformation, and the damage to the coal cannot recover.
2.
Closure stage (MN). The stress–strain curve continues to rise, and the slope increases. The sample is further stressed, the pores are further closed, and the deformations begin to develop. According to the characteristics of deformation, the sample enters elastic deformation.
3.
Fracturing stage (NP). The stress–strain curve rises and reaches a peak, and the slope begins to decrease. After the pore closure phase is over, the stress continues to rise, the sample becomes incompressible, plastic deformation begins to occur, tiny cracks develop, the skeleton begins to move, and cracks appear. The specimen begins to deform and fail.
4.
Postpeak stage (PQ). The stress–strain curve drops. The sample fails, the pores increase, and crack formation quickly develops and penetrates.

3.3. Resistivity Curve

The tectonic coal resistivity curves of different particle sizes presented earlier declining and later rising trends. Nevertheless, due to the influence of particle size gradation, the range of decrease and increase is not consistent (as shown in Figure 4). Correspondingly, the resistivity curve can be divided into four stages.
  • In the compaction stage (OM), the resistivity curve declines fast with an extensive range.
  • In the closure stage (MN), the resistivity curve declines steadily. The range is still relatively large. At the end of the stage, the rate of decline decreases.
  • In the fracturing stage (NP), the resistivity curve turns from decline to increase, and the slope value changes from negative to positive.
  • In the postpeak stage (PQ), the resistivity curve continues to rise, and the slope value increases.
The resistivity of tectonic coal is related to the evolution of the pores [41,42]. The initial rapid decrease in the resistivity curve (as shown in Figure 4) is ascribed to compressed tectonic coal, rearranged particles, and most compacted or closed pores. When the curve approaches the yield point, the coal skeleton particles can no longer be compressed and closed. Meanwhile, the resistivity reaches the minimum. After failure, the pores and cracks of the tectonic coal sample develop, increasing porosity and resistivity.

4. Discussion of Mechanical Properties and Resistivity

4.1. Discussion of Mechanical Properties

4.1.1. Uniaxial Compressive Strength

The proportion and uniaxial compressive strength of tectonic coal samples of different particle sizes can be visualized by a ternary phase diagram (as shown in Figure 5). The size of the symbol describes the strength of the sample. The proportion of fine particles (0~0.25 mm) increases from 33.33% to 100%. The sample’s uniaxial compressive strength increases first and then decreases, while the proportion of medium-particles (0.25 mm~1 mm) or coarse-particles (1 mm~5 mm) increases from 33.33% to 100%, and the strength of the sample continuously decreases. There are several findings: In the single-particle gradation, the smaller the particle size, the higher the tectonic coal sample’s uniaxial compressive strength. A proportion of medium or coarse particle increase makes the tectonic coal sample’s uniaxial compressive strength decrease. The tectonic coal sample with the highest uniaxial compressive strength accounts for the largest proportion of fine particles, but the proportion of fine particles increases to 100%, and the strength decreases.
The above findings indicate that the particle size and relative position affect the sample structure. The single-particle gradation sample’s uniaxial compressive strength is mainly affected by the particle size. The structure composed of fine particles has a better holding effect and higher strength than the structure composed of medium or coarse particles. The composite-particle gradation sample’s uniaxial compressive strength is mainly affected by the proportion of different particle sizes. When fine particles are the main component of the structure, medium and coarse particles are distributed in it, and the structure has the best holding effect and the highest strength. This is consistent with the law of pulverized coal forming [23,25].

4.1.2. Modulus

The tectonic coal sample’s stress–strain curve has significant stage characteristics, reflected in the modulus parameters (as shown in Table 3).
  • In the compaction stage, the compression modulus of all tectonic coal samples is less than 10 MPa and far less than their elastic modulus. At this stage, the compaction deformation of the sample cannot recover after the pressure is relieved, and the main damage form is the fracture and fragmentation of the particles.
  • In the elastic stage, the elastic modulus of the sample is affected by the particle size and gradation. Under single-particle gradation conditions, the larger the particle size is, the greater the elastic modulus. Under the composite-particle gradation condition, the proportion of fine particles increases as the elastic modulus increases. When it is close to 100%, the elastic modulus decreases. The proportion of medium or coarse particles increases, and the elastic modulus decreases.
  • In the postpeak stage, there is a drop phenomenon in the stress–strain curve. Moreover, the postpeak modulus of the tectonic coal sample is related to particle size. The smallest particle size sample of single-particle gradation has the largest modulus and the most apparent drop effect.
The brittleness index reflects the tectonic yield performance obtained by the postpeak modulus and elastic modulus. According to existing research [43], the more the brittleness index approaches 1, the greater the brittle failure of the rock after yielding. The greater the brittleness index, the greater the ductility of the rock after yielding. The brittleness index of the tectonic coal in this study is affected by the particle size and gradation. Under single-particle gradation conditions, the smaller the particle size, the closer the brittleness index is to 1, and the greater the brittleness of the tectonic coal sample. In the composite-particle gradation condition, the increase in each particle’s proportion makes the brittleness index close to 2, but the degree of proximity is different, and the increase in fine particle proportion minimizes this degree of proximity.

4.1.3. Relationship between Mechanical Property Parameters and Particle Size

As the particle size changes, the mechanical properties of tectonic coal also change (as shown in Table 4). Under single-particle gradation, as the tectonic coal particle size decreases, the strength and elastic modulus increase, and the sample yields close to brittleness. Under composite-particle gradation, the proportion of fine particles increases, while the strength and elastic modulus first increase and then slightly decline. The proportion of medium or coarse particles rises, and the strength and elastic modulus decrease.
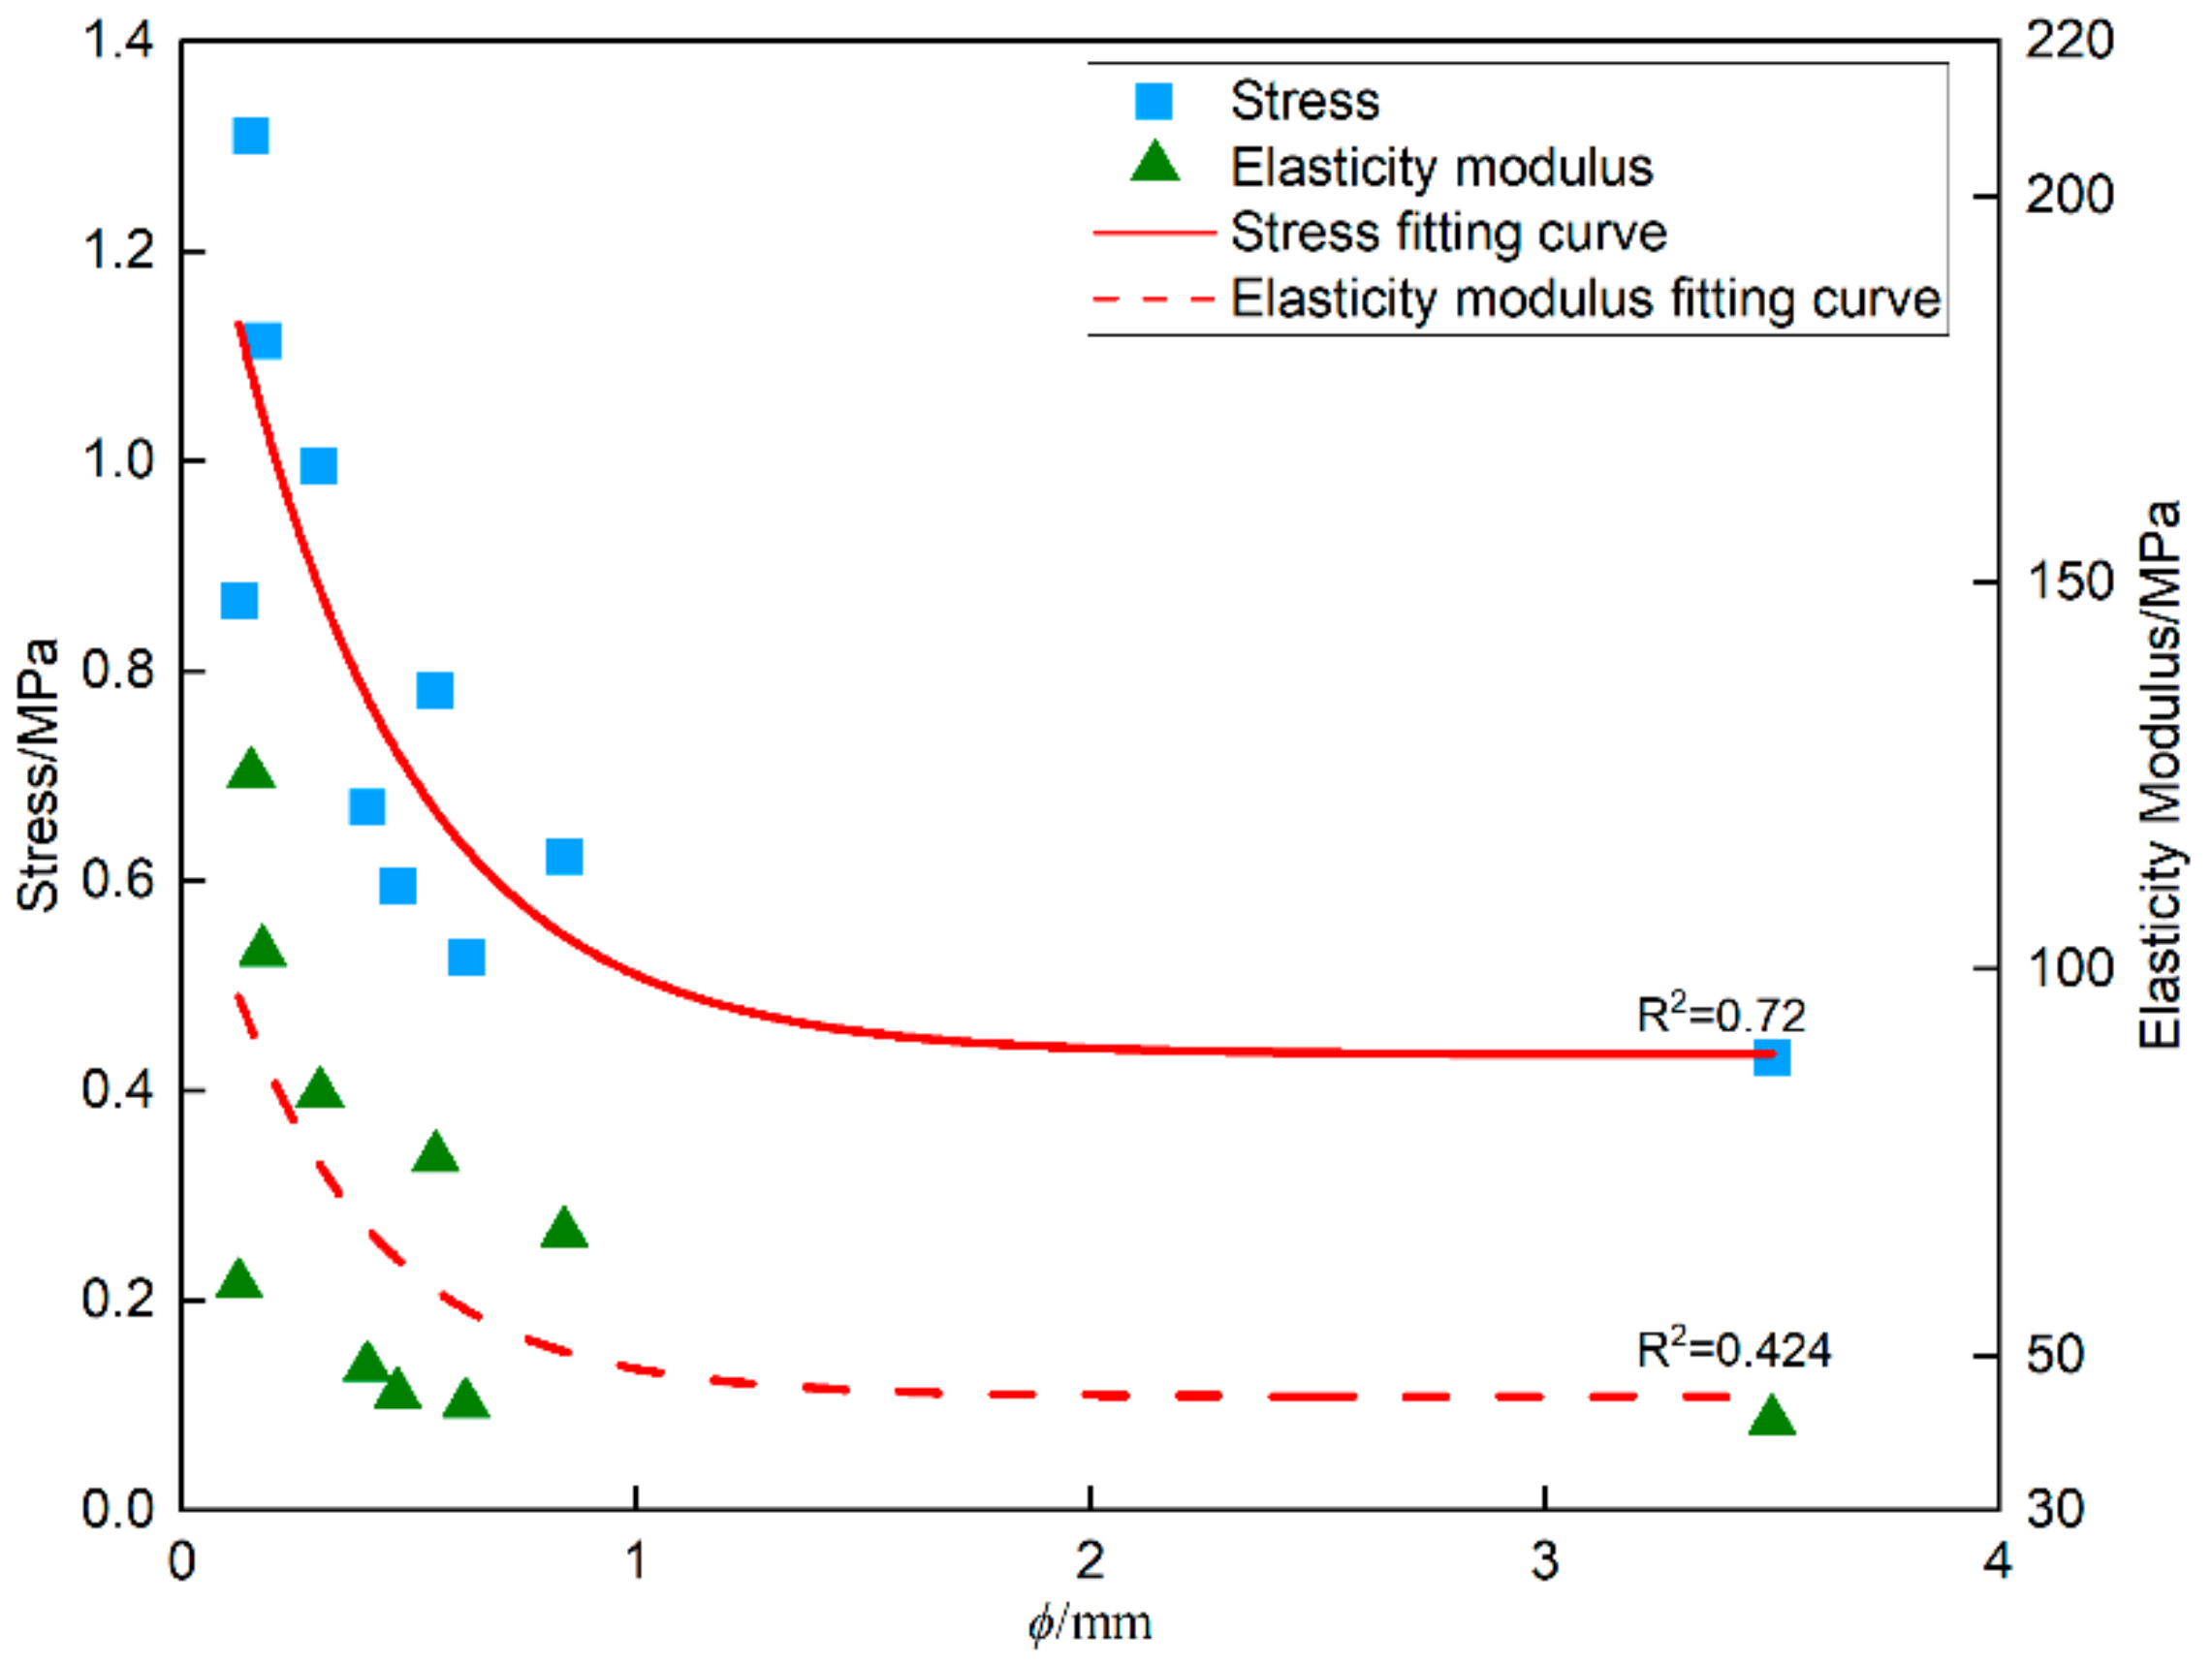
The relationship between the converted particle size, uniaxial compressive strength, and elastic modulus shows that as the particle size increases, the tectonic coal sample strength and elastic modulus decrease. The decreasing trend of the strength and elastic modulus of the tectonic coal sample also decreases. When the particle size exceeds 1 mm, the curve gradually tends to be flat (as shown in Figure 6).

4.2. Discussion of Resistivity Change

The relative resistivity 𝜆 can indicate changes in resistivity, which is calculated by
λ = r / r 0 ,
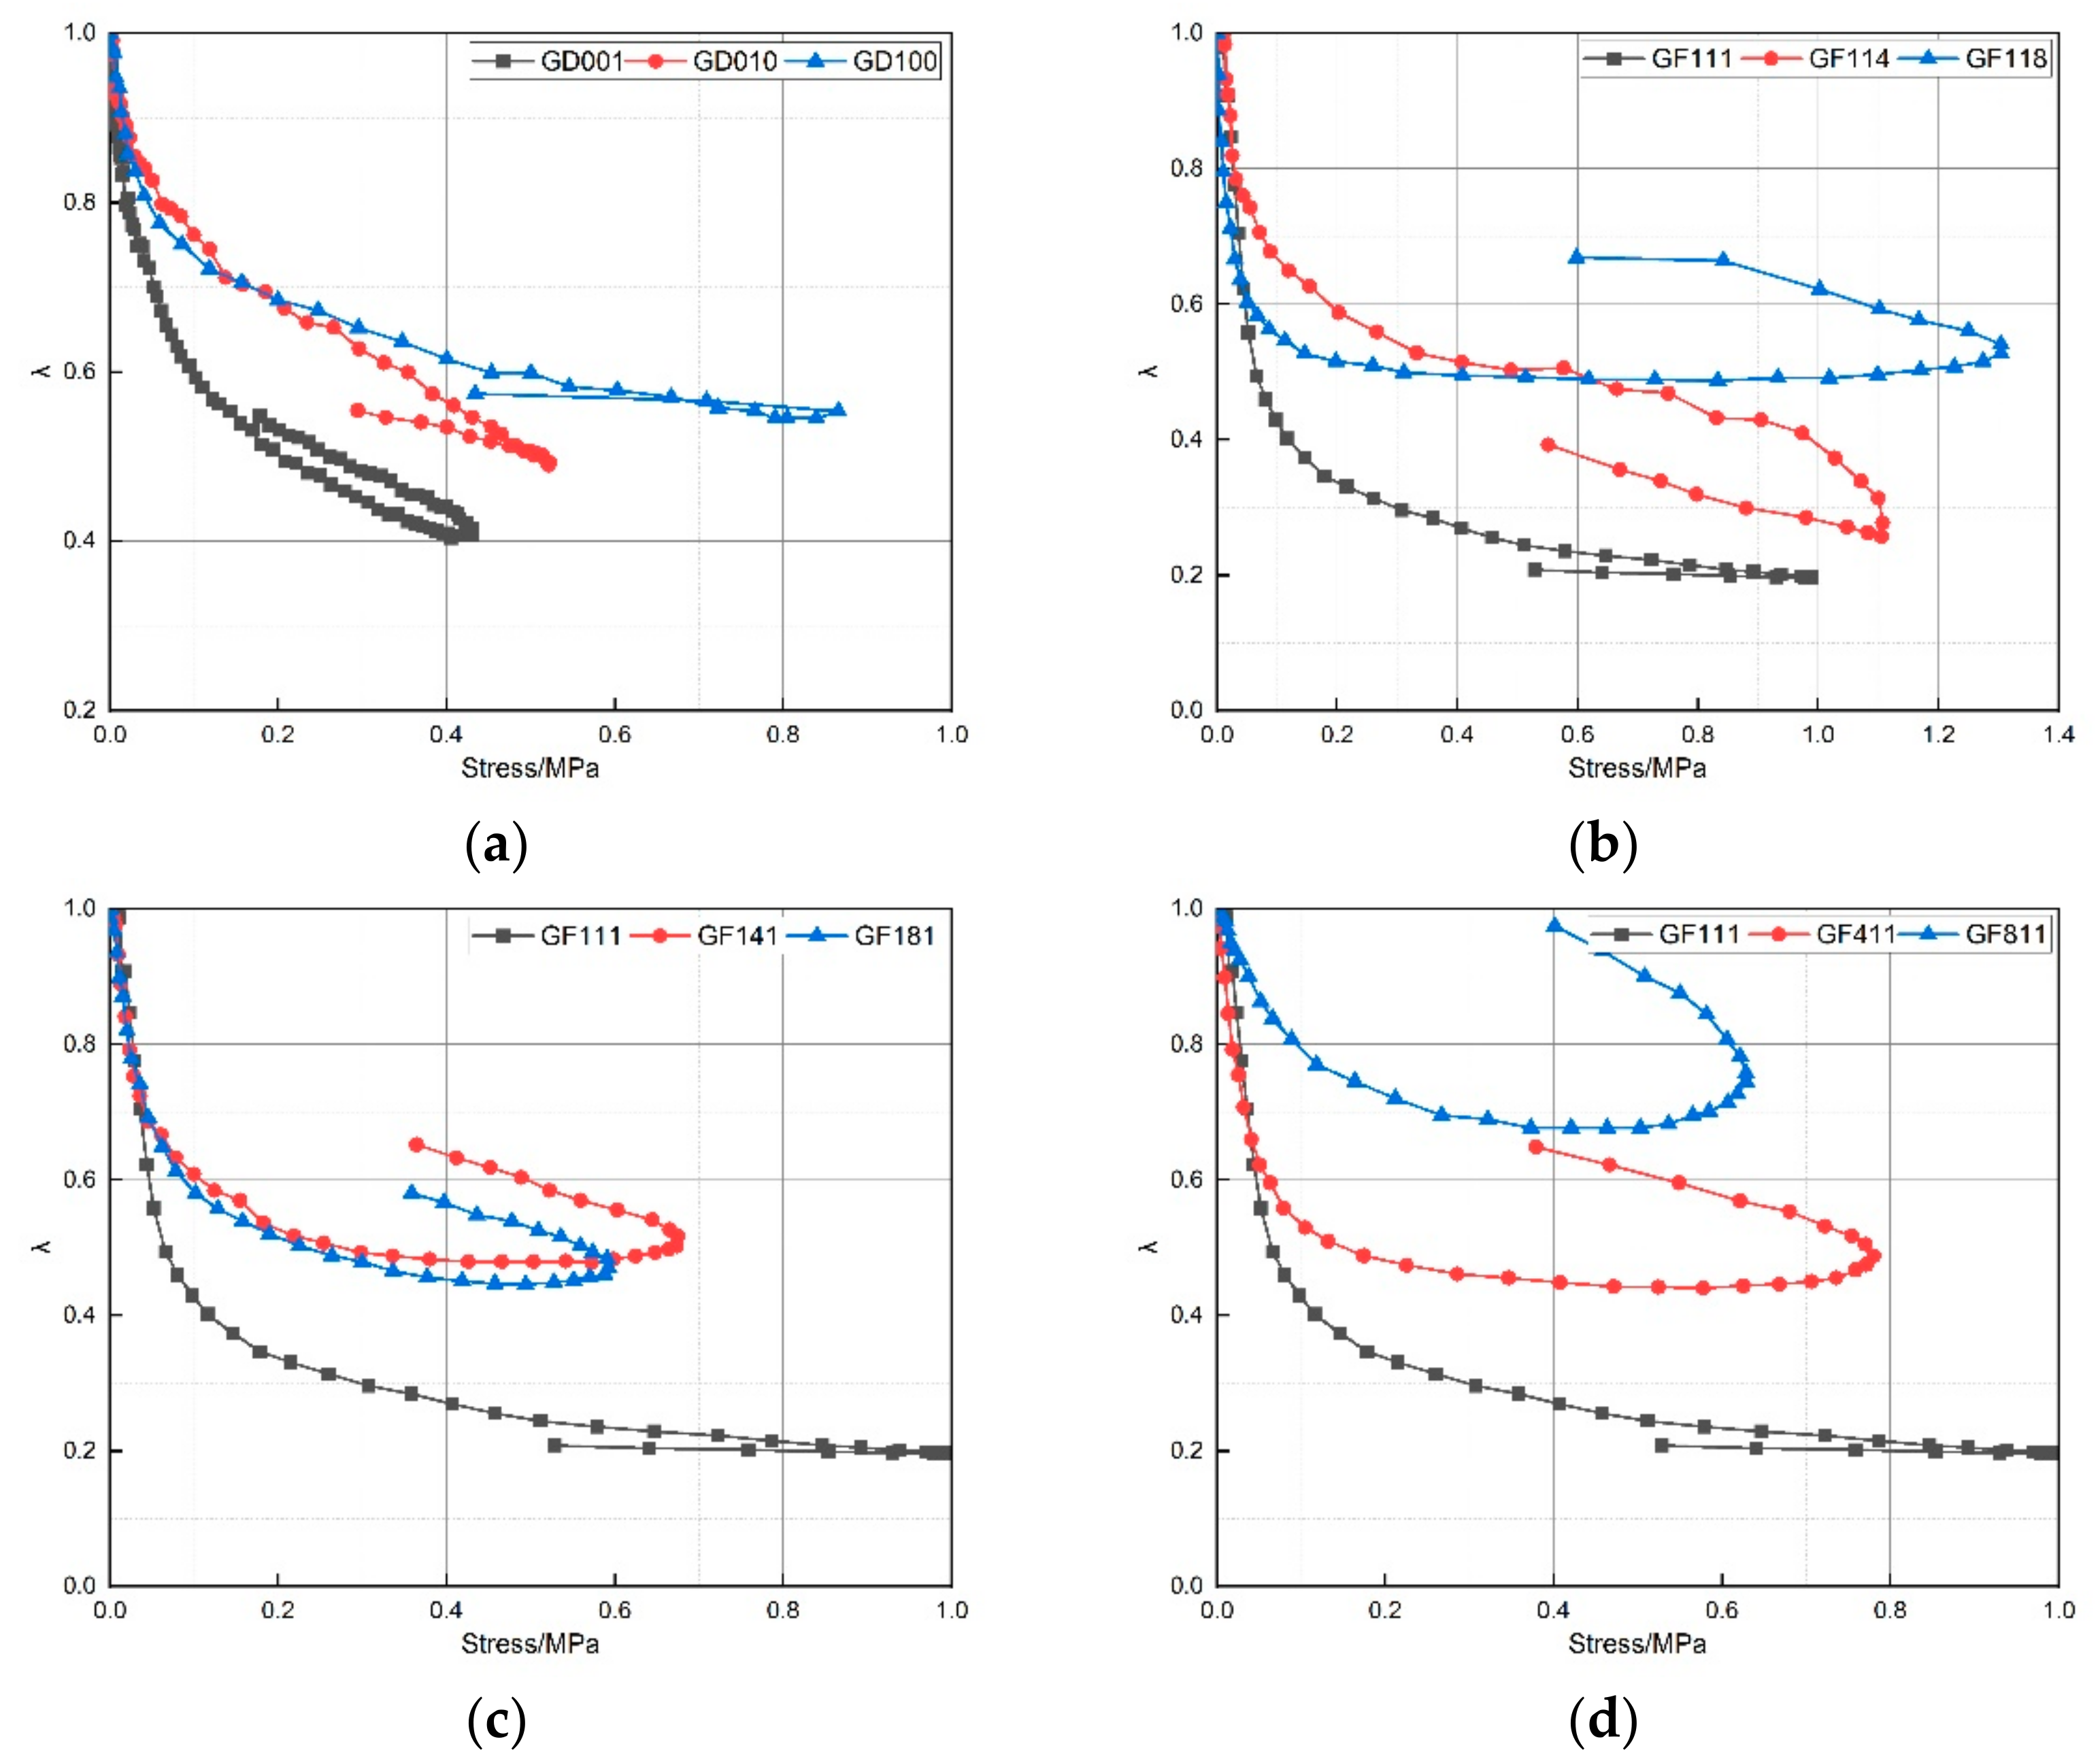
r is the loading resistivity of the tectonic sample in MΩ·m and r0 is the background value of resistivity in MΩ·m. The relative resistivity–stress curves of tectonic coals of different particle sizes all have the same characteristics. They drop rapidly, tend to flatten, and then rise in the opposite direction (as shown in Figure 7). The shape of the curve is different due to the different particle sizes and gradations. In the single-particle gradation, as the tectonic coal particle size decreases, the resistivity curve descending range decreases, and the rising slope decreases. In composite-particle gradation, as the proportions of fine, medium, or coarse particles of tectonic coal increase, the resistivity curve’s decreasing range decreases, and the rising slope increases.
The change in resistivity reflects the damage of the sample [42,44]. It is apparent that the tectonic coal sample structure is mainly damaged in the compaction stage and the destruction stage.
We define d1 = 𝜆0 − 𝜆min as the resistivity change in the compaction stage, d2 = 𝜆end − 𝜆min as the resistivity change in the destruction stage, and D = d1 + d2 as the degree of resistivity change during uniaxial compression and draw them into a bar graph (as shown in Figure 8). The resistivity change of tectonic coal is affected by the particle size. In single-particle gradation, the particle size of tectonic coal decreases, the resistivity change decreases, and the proportion of change in the compaction stage increases. In composite-particle gradation, the proportion of particles of different particle sizes in tectonic coal increases. The total resistivity change decreases, but the proportion of change in the destruction stage increases.

5. Conclusions

After testing the mechanical properties and resistivity changes of remodeled samples of tectonic coals with different particle sizes in the Huainan area and analyzing the effect of particle size on the mechanical properties and resistivity, three conclusions were drawn.
  • The stress–strain curve of tectonic coal samples with different particle sizes can be divided into four stages, and their shape is affected by particle size and proportion. In single-particle gradation, the stress–strain curve slope increases as the tectonic coal particle size decreases and the peak value becomes more evident. In composite-particle gradation, as the fine particle proportion of tectonic coal increases, the curve slope increases. As the proportion of medium particles or coarse particles increases, the curve slope decreases.
  • The particle size and proportion of tectonic coal significantly impact the mechanical properties of tectonic coal. The samples composed of more fine particles have a higher value of mechanical parameters. As the converted particle size increases, the elastic modulus and strength first decrease and then tend to flatten. In single-particle gradation, the tectonic coal particle size changes from large to small, the sample strength and elastic modulus increase, and the yield performance approaches brittleness. As the proportion of fine particles increases in composite-particle gradation, the strength and elastic modulus first rise and then decrease slightly, yielding close ductility. As the proportion of medium or coarse particles increases, the strength and elastic modulus decrease, and their yield performances are close to ductility.
  • The tectonic coal sample resistivity change is affected by the tectonic coal particle size and gradation. As the particle size decreases in single-particle gradation, the sample’s resistivity change decreases, and the proportion of resistivity change in the compaction stage increases. In composite-particle gradation, the proportion of fine, medium, or coarse particles increases, leading to the sample’s resistivity change decreasing, but the proportion of the resistivity change in the destruction stage increases.

Author Contributions

Conceptualization, C.Z. and L.C.; methodology, C.Z., J.G.; validation, C.Z., J.G., Z.J. and S.Z.; formal analysis, C.Z., J.G.; resources, L.C.; data curation, C.Z.; writing—original draft preparation, C.Z.; writing—review and editing, L.C.; visualization, C.Z.; supervision, L.C.; project administration, L.C.; funding acquisition, L.C. All authors have read and agreed to the published version of the manuscript.

Funding

This study is supported by the National Natural Science Foundation of China No. 41727801, No. 42030810, and the Priority Academic Program Development of Jiangsu Higher Education Institutions.

Institutional Review Board Statement

Not applicable.

Informed Consent Statement

Not applicable.

Data Availability Statement

The author of the paper declares that all data come from the original experiment.

Acknowledgments

Thanks for the support of National Natural Science Foundation of China, grant number 41727801 and 42030810. Thanks for the editors and reviewers in the process of publishing paper. Thanks for the laboratory of the School of Resources and Geosciences.

Conflicts of Interest

The authors declare no conflict of interest.

References

  1. Fowler, P.; Gayer, R.A. The Association between Tectonic Deformation, Inorganic Composition and Coal Rank in the Bituminous Coals from the South Wales Coalfield, United Kingdom. Int. J. Coal Geol. 1999, 42, 1–31. [Google Scholar] [CrossRef]
  2. Frodsham, K.; Gayer, R.A. The Impact of Tectonic Deformation upon Coal Seams in the South Wales Coalfield, UK. Int. J. Coal Geol. 1999, 38, 297–332. [Google Scholar] [CrossRef]
  3. Ju, Y.; Li, X. New Research Progress on the Ultrastructure of Tectonically Deformed Coals. Prog. Nat. Sci. 2009, 19, 1455–1466. [Google Scholar] [CrossRef]
  4. Karayiğit, A.İ.; Mastalerz, M.; Oskay, R.G.; Gayer, R.A. Coal Petrography, Mineralogy, Elemental Compositions and Palaeoenvironmental Interpretation of Late Carboniferous Coal Seams in Three Wells from the Kozlu Coalfield (Zonguldak Basin, NW Turkey). Int. J. Coal Geol. 2018, 187, 54–70. [Google Scholar] [CrossRef]
  5. Karayiğit, A.İ.; Mastalerz, M.; Oskay, R.G.; Buzkan, İ. Bituminous Coal Seams from Underground Mines in the Zonguldak Basin (NW Turkey): Insights from Mineralogy, Coal Petrography, Rock-Eval Pyrolysis, and Meso-and Microporosity. Int. J. Coal Geol. 2018, 199, 91–112. [Google Scholar] [CrossRef]
  6. Li, W.; Liu, H.; Song, X. Multifractal Analysis of Hg Pore Size Distributions of Tectonically Deformed Coals. Int. J. Coal Geol. 2015, 144, 138–152. [Google Scholar] [CrossRef]
  7. Liu, H.; Jiang, B. Geochemical Alteration and Mineralogy of Coals under the Influence of Fault Motion: A Case Study of Qi’nan Colliery, China. Minerals 2019, 9, 389. [Google Scholar] [CrossRef] [Green Version]
  8. Deng, X.; Hu, Q.; Wei, S. Genesis and Property Classification of Tectonic Coal. J. Eng. Geol. 2014, 22, 1008–1014. [Google Scholar] [CrossRef]
  9. Ju, Y.; Jiang, B.; Hou, Q.; Wang, G. The new structure-genetic classification system in tectonically deformed coals and its geological significance. J. China Coal Soc. 2004, 29, 513–517. [Google Scholar]
  10. Yu, S.; Bo, J.; Ming, L.; Chenliang, H.; Shaochun, X. A Review on Pore-Fractures in Tectonically Deformed Coals. Fuel 2020, 278, 118248. [Google Scholar] [CrossRef]
  11. Chen, H.; Jiang, B.; Chen, T.; Xu, S.; Zhu, G. Experimental Study on Ultrasonic Velocity and Anisotropy of Tectonically Deformed Coal. Int. J. Coal Geol. 2017, 179, 242–252. [Google Scholar] [CrossRef]
  12. Hou, S.; Wang, X.; Wang, X.; Yuan, Y.; Pan, S.; Wang, X. Pore Structure Characterization of Low Volatile Bituminous Coals with Different Particle Size and Tectonic Deformation Using Low Pressure Gas Adsorption. Int. J. Coal Geol. 2017, 183, 1–13. [Google Scholar] [CrossRef]
  13. Jiang, B.; Qu, Z.; Wang, G.G.X.; Li, M. Effects of Structural Deformation on Formation of Coalbed Methane Reservoirs in Huaibei Coalfield, China. Int. J. Coal Geol. 2010, 82, 175–183. [Google Scholar] [CrossRef]
  14. Cheng, Y.; Pan, Z. Reservoir Properties of Chinese Tectonic Coal: A Review. Fuel 2020, 260, 116350. [Google Scholar] [CrossRef]
  15. Sang, S.; Zhou, X.; Liu, S.; Wang, H.; Cao, L.; Liu, H.; Li, Z.; Zhu, S.; Liu, C.; Huang, H.; et al. Research advances in theory and technology of the stress release applied extraction of coalbed methane from tectonically deformed coals. J. China Coal Soc. 2020, 45, 2531–2543. [Google Scholar] [CrossRef]
  16. Xu, J.; Xian, X.; Du, Y.; Zhang, G. An Experimental Study on the Mechanical Property of the Gas-filled Coal. J. Chongqing Univ. 1993, 5, 42–47. [Google Scholar]
  17. Tu, Q. Study on Apparent Physical Structure of Tectonic Coal and Spallation Development Mechanism of Coal and Gas Outburst. Ph.D. Thesis, China University of Mining and Technology, Xuzhou, China, 2019. [Google Scholar]
  18. Sobczyk, J. A Comparison of the Influence of Adsorbed Gases on Gas Stresses Leading to Coal and Gas Outburst. Fuel 2014, 115, 288–294. [Google Scholar] [CrossRef]
  19. Skoczylas, N.; Dutka, B.; Sobczyk, J. Mechanical and Gaseous Properties of Coal Briquettes in Terms of Outburst Risk. Fuel 2014, 134, 45–52. [Google Scholar] [CrossRef]
  20. Wang, C.; Yang, S.; Yang, D.; Li, X.; Jiang, C. Experimental Analysis of the Intensity and Evolution of Coal and Gas Outbursts. Fuel 2018, 226, 252–262. [Google Scholar] [CrossRef]
  21. Yuan, M.; Xu, J.; Li, B.; Wang, Z.; Du, Y.; Xu, S. Experimental Study on Influence of Particle Size on Mechanical Properties and Permeability of Briquette Coal Containing Gas. Saf. Coal Mines 2016, 47, 24–27. [Google Scholar] [CrossRef]
  22. Pang, L.; Yang, Y.; Wu, L.; Wang, F.; Meng, H. Effect of Particle Sizes on the Physical and Mechanical Properties of Briquettes. Energies 2019, 12, 3618. [Google Scholar] [CrossRef] [Green Version]
  23. Ji, D.; Wang, Z.; Zhang, L.; Ma, Y. The examination study of the size-composition of the fine-coal briquetting. J. China Coal Soc. 2005, 30, 100–103. [Google Scholar]
  24. Tian, B.; Xu, D.; Yang, F.; Pang, Y.; Xu, R.; Lin, X.; Wang, Y. Briquetting Pressure and Fine Coal Particle Distribution Affected to Performances of Cool Pressed Briquette. Coal Sci. Technol. 2013, 41, 125–128. [Google Scholar] [CrossRef]
  25. Chen, L.; Yang, H.; Zhao, Y.; Li, X.; Sun, T. The influence of raw coal gradation on the strength of briquette. Min. Saf. Environ. Prot. 2001, 1, 6–7. [Google Scholar]
  26. Zhang, J.; Guo, Z.; Yang, J.; Sun, C.; Sheng, J.; Xu, Z. Orthogonal Experiment Analysis of Briquette for Influencing Factors. Coal Technol. 2016, 35, 287–288. [Google Scholar] [CrossRef]
  27. Xu, J.; Liu, D.; Peng, S.; Wu, X.; Lu, Q. Experimental Research on Influence of Particle Diameter on Coal and Gas Outburst. Chin. J. Rock Mech. Eng. 2010, 29, 1231–1237. [Google Scholar]
  28. Xu, J.; Ye, G.; Li, B.; Cao, Y.; Zhang, M. Experimental study of mechanical and permeability characteristics of moulded coals with different binder ratios. Rock Soil Mech. 2015, 36, 104–110. [Google Scholar] [CrossRef]
  29. Meng, L.; Liu, M.; Wang, Y. Study on the rules of electrical resistivity variation of tectonic coal in uniaxial compression experiment. J. China Coal Soc. 2010, 35, 2028–2032. [Google Scholar] [CrossRef]
  30. Wang, E.; Chen, P.; Li, Z.; Shen, R.; Xu, J.; Zhu, Y. Resistivity response in complete stress-strain process of loaded coal. J. China Coal Soc. 2014, 39, 2220–2225. [Google Scholar] [CrossRef]
  31. Chen, P.; Wang, E.; Zhu, Y. Experimental study on resistivity variation regularities of loading coal. J. China Coal Soc. 2013, 38, 548–553. [Google Scholar] [CrossRef]
  32. Wang, Y.; Jia, Z.; Liu, Y. Revised coal or rock under load damage mechanics model of coupled stress & electricity. J. Henan Polytech. Univ. Nat. Sci. 2011, 30, 11–14. [Google Scholar] [CrossRef]
  33. Chen, P.; Wang, E.; Chen, X.; Liu, Z.; Li, Z.; Shen, R. Regularity and Mechanism of Coal Resistivity Response with Different Conductive Characteristics in Complete Stress–Strain Process. Int. J. Min. Sci. Technol. 2015, 25, 779–786. [Google Scholar] [CrossRef]
  34. Qiu, H. Study on Variation of Coal Rock Loaded Resistivity during Fracturing Process. World Sci. Tech. R D 2016, 38, 245–248. [Google Scholar] [CrossRef]
  35. Li, X.; Zhang, Q.; An, Z.; Chen, X.; Zhang, F. Experimental Research on Electrical Resistivity Variation of Coal under Different Loading Modes. Arab. J. Geosci. 2020, 13, 1068. [Google Scholar] [CrossRef]
  36. Li, X.; An, Z.; Zhang, Q.; Chen, X.; Ye, X.; Jia, S. Analysis of Resistivity Anisotropy of Loaded Coal Samples. Adv. Mater. Sci. Eng. 2020, 2020, 1–13. [Google Scholar] [CrossRef]
  37. Liu, E.; Shen, Z. Study on Brittleness of Geomaterials. Chin. J. Rock Mech. Eng. 2005, 19, 51–55. [Google Scholar] [CrossRef]
  38. Brace, W.F.; Orange, A.S. Electrical Resistivity Changes in Saturated Rock under Stress. Science 1966, 153, 1525–1526. [Google Scholar] [CrossRef] [PubMed]
  39. Chen, G.; Lin, Y. Stress–Strain–Electrical Resistance Effects and Associated State Equations for Uniaxial Rock Compression. Int. J. Rock Mech. Min. Sci. 2004, 41, 223–236. [Google Scholar] [CrossRef]
  40. China University of Mining and Tchnology. Evaluation of Coal-Bed Methane Resources in Coal Mine Area; China University of Mining and Tchnology: Xuzhou, Jiangsu, China, 2007. [Google Scholar]
  41. Jiang, W.; Liu, Y. Study on variation of electrical resistivity under uniaxial pressure environment for rocks. J. Geol. 2009, 33, 299–302. [Google Scholar]
  42. Li, S.; Xu, X.; Liu, Z.; Yang, W.; Liu, B.; Zhang, X.; Wang, Z.; Nie, L.; Li, J.; Xu, L. Electrical Resistivity and Acoustic Emission Response Characteristics and Damage Evolution of Sandstone during Whole Process of Uniaxial Compression. Chin. J. Rock Mech. Eng. 2014, 33, 14–23. [Google Scholar] [CrossRef]
  43. Tarasov, B.; Potvin, Y. Universal Criteria for Rock Brittleness Estimation under Triaxial Compression. Int. J. Rock Mech. Min. Sci. 2013, 59, 57–69. [Google Scholar] [CrossRef]
  44. Wu, G.; Wang, K.; Zhao, M.; Nie, Z.; Huang, Z. Analysis of Damage Evolution of Sandstone under Uniaxial Loading and Unloading Conditions Based on Resistivity Characteristics. Adv. Civ. Eng. 2019, 2019, 9286819. [Google Scholar] [CrossRef]
Figure 1. Huainan mining area structure outline map.
Energies 14 02303 g001
Figure 2. Pictures of tectonic coal particles and grading schemes of samples. (a) Tectonic coal particle. (b) Grading schemes of tectonic coal samples.
Energies 14 02303 g002
Figure 3. Experimental system of tectonic coal test.
Energies 14 02303 g003
Figure 4. Stress–strain curves and resistivity–strain curves of tectonic coal samples with different particle sizes. (a) Curves of GD100, GD010, and GD001. (b) Curves of GF111, GF114, and GF118. (c) Curves of GF111, GF141, and GF181. (d) Curves of GF111, GF411, and GF811.
Energies 14 02303 g004
Figure 5. Ternary phase diagram of the uniaxial compressive strength and particle size of tectonic coal.
Energies 14 02303 g005
Figure 6. Relationship between converted particle size, uniaxial compressive strength, and elastic modulus.
Energies 14 02303 g006
Figure 7. Relative resistivity–stress curves of different tectonic coal samples. (a) Relative resistivity curves of GD100, GD010, and GD001 (b) Relative resistivity curves of GF111, GF114, and GF118 (c) Relative resistivity curves of GF111, GF141, and GF181 (d) Relative resistivity curves of GF111, GF411, and GF811.
Energies 14 02303 g007
Figure 8. The bar of relative resistivity change.
Energies 14 02303 g008
Table 1. Basic parameters of tectonic coal *.
ItemsMadAdVdafSt.dCHON
Content (%)2.3019.7036.920.5284.415.398.851.34
* The data came from the mining area survey report and represents the average value of the coal seam.
Table 2. Physical parameters of different particle tectonic coal samples.
NumberParticleGradeCuCcϕ/mmDensity/g·cm−3Resistivity/MΩ·m
GD100Φ11:0:02.431.423.5001.400.0688
GD010Φ20:1:02.150.320.6251.310.0681
GD001Φ30:0:160.040.1251.290.0523
GF111Φ1Φ2Φ31:1:111.330.060.3041.370.0598
GF114Φ1Φ2Φ31:1:460.060.1771.340.0681
GF118Φ1Φ2Φ31:1:860.050.1521.330.0264
GF141Φ1 Φ2Φ31:4:14.890.220.4091.320.0408
GF181Φ1Φ2Φ31:8:12.880.270.4741.340.0447
GF411Φ1Φ2Φ34:1:117.220.310.5591.400.0369
GF811Φ1Φ2Φ38:1:1160.560.8411.390.0308
Table 3. Modulus of tectonic coal with different particle sizes.
NumberCompaction Modulus
e/MPa
Elastic Modulus
E/MPa
Postpeak Modulus
M/MPa
Brittleness Indexk
GD1001.7541.63−35.932.16
GD0101.5843.82−41.312.06
GD0013.7159.28−525.161.11
GF1113.9083.96−143.411.59
GF1143.76102.33−126.731.81
GF1186.37125.40−147.821.85
GF1415.0148.60−45.912.06
GF1815.5945.08−41.652.08
GF4119.7575.68−96.091.79
GF8115.1065.95−62.972.05
Table 4. Changes in the mechanical parameters of tectonic coal samples with different particle sizes.
Mechanical ParametersParticle Size Large→SmallProportion of Different Particle Less→More
Coarse (1 mm~5 mm)Medium (0.25 mm~1 mm)Fine (0~0.25 mm)
StrengthIncreaseLess decreaseMost decreaseIncrease first then slightly decrease
Elastic modulusIncreaseDecreaseDecreaseIncrease first then decrease
Yield performanceApproach brittlenessSecond approach ductilityMost approach ductilityLeast approach ductility
Publisher’s Note: MDPI stays neutral with regard to jurisdictional claims in published maps and institutional affiliations.