
Analysis of Changes in the Aggregate Exergy Efficiency of China’s Energy System from 2005 to 2015


Abstract
1. Introduction
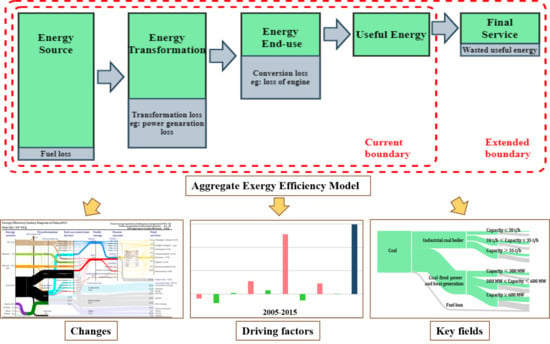
- The current boundary of SEA is extended to the final service to observe changes of the aggregate exergy efficiency from the energy source to the final service.
- A driving factor analysis method considering all stages of the whole energy system is developed to systemically decompose what factors drive aggregate exergy efficiency.
- A deep analysis of the “dual structure” problem in China was conducted to provide deep understandings of efficiency improvements in developing countries like China.
2. Literature Review
2.1. Energy Efficiency Model of Energy Systems
- (1)
- Top-down energy intensity model. The useful output is measured by the gross domestic product (GDP). Energy intensity is the reciprocal of energy efficiency and is defined as the energy consumption per unit of GDP. Energy intensity can provide a top-down approach to connect energy consumption with economic development. Since the data are easy to obtain and easy to calculate, the energy intensity is the most used indicator to evaluate the overall energy efficiency performance at the macrolevel, such as a country [19,20,21], an economic-sector like industry [22], or a region [23,24].
- (2)
- Bottom-up thermodynamic efficiency model. The useful output and the energy input are both measured by thermodynamic units, including the first-law energy efficiency and the second-law energy efficiency (also known as “exergy efficiency”). The thermodynamic efficiency model can provide a bottom-up view to observe the technology progress underlying energy systems. In the thermodynamic efficiency model, the energy system is divided into different stages, and then the technical energy efficiency of each stage is calculated one by one, and finally, the overall energy efficiency is obtained by aggregation [9]. For example, Nakicenovic [25] evaluated the global first-law energy efficiency and exergy efficiency in 1990. Liu et al. [26] analyzed the first-law and exergy efficiency of the Chinese urban residential sector.
2.2. Societal Exergy Analysis
2.3. LMDI Decomposition Method Based on Energy Allocation Analysis
3. Method and Data
3.1. The Societal Exergy Analysis of the Energy System
3.1.1. Stage Division of the Energy System
3.1.2. Exergy Input of the Energy System
3.1.3. Exergy Efficiency of the Process
3.1.4. Aggregate Exergy Efficiency
3.2. LMDI Decomposition Method of Driving Factor Analysis
- (1)
- First, a novel LMDI decomposition identity including all nine driving factors is established.
- = the aggregate exergy efficiency from the energy source to the final service.
- = the exergy delivered to final service n, when energy flow of energy source i passes through transformation sector j, end-use device k, and passive system m.
- = the total exergy input. It is the sum of the chemical exergy input from different energy source i excluding the exergy flowing to non-energy use.
- = the sum of exergy used for direct-fuel use and power & heat generation.
- = the exergy input of energy source i.
- = the exergy flowing into sector i (or j, k, m, n) in stage X. X represents different stages shown in Figure 3, which are the energy source, transformation, end-use conversion device, passive system, and final service.
- = the exergy flowing out of stage X.
- = energy source utilization coefficient.
- = energy source structure.
- = transformation structure.
- = power and heat generation efficiency.
- = end-use structure.
- = end-use conversion efficiency.
- = passive structure.
- = passive efficiency
- = service structure.
- (2)
- Then, assuming that the aggregate exergy efficiency changes from time 0 to time T. The change rate of these nine driving factors is characterized in the following expression:
- = change rate of the aggregate final service efficiency from time 0 to time T.
- = relative contribution of driving factor Y from time 0 to time T. Y represents different driving factors described in step (1).
- (3)
- Finally, relative contributions of nine driving factors are quantitatively decomposed by the following formula:
3.3. Further Analysis of “Dual Structure” Problem in China
4. Results
4.1. The Aggregate Exergy Efficiency of China from 2005 to 2015
- (1)
- The aggregate exergy efficiency of China from the energy source to final service was just 3.7% in 2005, 4.2% in 2010, and 4.8% in 2015. This shows an increasing trend; however, it is still at a very low level. This means that just less than 5% of exergy input ultimately provided final services, and significant potential for future improvement was identified.
- (2)
- Losses mainly occurred in the end-use conversion stage and the power and heat generation sector. The average exergy efficiency was 16% (2005), 19% (2010), and 21% (2015) for the end-use conversion stage and 30% (2005), 34% (2010), and 35% (2015) for the power and heat generation sector. Among these two technical sectors, fuel was upgraded into higher quality energy, such as electricity and mechanical work. Due to the thermodynamic limit, an irreversible loss would inevitably occur, mainly as a result of combustion and heat transfer losses. On the other hand, limited by inappropriate operation and unpredicted conditions in practice, the actual operating efficiency of these conversion devices never reaches the theoretical design value, resulting in more losses. Thankfully, with the continuous promotion of efficiency improvement in these fields in China, the technical design and operation level of conversion devices have constantly been improving to reduce the loss.
- (3)
- There is considerable potential for the improvement of passive systems. We found that just 32% (2005), 34% (2010), and 34% (2015) of the exergy input of passive systems were delivered to final services. In contrast to conversion devices, passive systems do not actively convert energy to another form, instead, they hold useful energy in order to provide a level of final service. The efficiency of a conversion device is related to how they convert fuel into useful energy; however, the efficiency of a passive system is based on avoiding unintended losses of useful energy in order to provide final services, e.g., reducing the friction or drag of a car, and or increasing the seal or insulation of a house. For example, in China, over 80% of useful energy of building passive systems were lost without providing needed services. Several factors inhibit the deployment of more efficient technical solutions in buildings: the variety of building designs, the existence of a large number of old buildings with poor seal and insulation, improper setting of cooling or heating temperature, and so on.
4.2. LMDI Decomposition Results of Driving Factors
4.2.1. Energy Source
4.2.2. Power and Heat Generation Sector
4.2.3. End-Use Conversion Device
4.2.4. Passive System
4.2.5. Final Service
4.3. Further Decomposition Results of “Dual Structure” Problem in China
5. Discussion
5.1. International Comparison
5.2. Improvement of Model Resolution
5.3. Uncertainty and Limitation
6. Conclusions
- The overall energy efficiency performance of China’s energy system is still at a low level. Significant potential for future efficiency improvement exists and deserves to be explored, especially in the context of carbon neutrality and sustainable development.
- Energy efficiency improvements in technology devices, including end-use conversion devices and power and heat generation, will continue to make a considerable contribution to the aggregate improvements. Attention should be paid to the improvement of the conversion of fuel into more useful energy, such as optimizing thermodynamic designs, reducing heat transfer and combustion losses, and improving the equipment operation levels.
- Sufficient attention should be paid to the role of passive systems. The efficiency of a passive system depends on how well unintended losses of useful energy providing final services can be addressed, such as reducing the friction or drag of a car and promoting the seal and insulation of a house.
- For key energy-consuming fields, it is also a good idea to replace low-efficiency equipment directly with high-efficiency equipment.
Author Contributions
Funding
Institutional Review Board Statement
Informed Consent Statement
Data Availability Statement
Conflicts of Interest
Nomenclature
| SEA | Societal Exergy Analysis |
| exergy efficiency | |
| LMDI | Logarithmic Mean Divisia Index |
| the first-law energy efficiency | |
| LHV | Low Heating Value |
| exergy factor | |
| exergy | |
| quality factor | |
| useful output | |
| S | structure factor |
| D | the change rate of driving factor |
Appendix A

| Energy Source | EJ | Transformation | EJ | Conversion Device | EJ | Useful Energy | EJ | Passive System | EJ | Final Service | EJ |
|---|---|---|---|---|---|---|---|---|---|---|---|
| Oil | 14.5 | Direct-energy use | 43.3 | Diesel engine | 4.1 | Motion | 3.8 | Car | 0.5 | Passenger transport | 0.1 |
| Biomass | 5.5 | Power & heat generation | 30.5 | Otto engine | 2.2 | Heat | 4.5 | Truck | 0.9 | Freight transport | 0.7 |
| Natural gas | 3.6 | Non-energy use | 2.8 | Aircraft engine | 0.4 | Cooling/light/sound and others | 0.2 | Plane | 0.2 | Sustenance | 0.1 |
| Coal | 49.9 | Fuel loss | 1.6 | Agro-motor | 0.6 | Combustion loss | 13.6 | Ship | 0.2 | Communication | 0.1 |
| Hydro | 4.1 | Other engine | 0.2 | Heat transfer loss | 24.1 | Train | 0.1 | Structure | 1.5 | ||
| Nuclear | 0.6 | Electric motor | 4.5 | Other loss | 6.3 | Factory | 5.1 | Hygiene | 0.1 | ||
| Others | 0.1 | Oil burner | 4.6 | Hot water | 0.2 | Thermal comfort | 0.1 | ||||
| Biomass burner | 5.0 | Heated/cooled space | 1.1 | Illumination | 0.02 | ||||||
| Gas burner | 2.7 | Appliance | 0.04 | ||||||||
| Coal burner | 23.7 | Illuminated space | 0.1 | Passive loss | 5.7 | ||||||
| Electric heater | 0.6 | ||||||||||
| Heat exchanger | 0.7 | ||||||||||
| Cooler | 1.3 | ||||||||||
| Electronics | 0.7 | ||||||||||
| Light device | 1.2 |
| Energy Source | EJ | Transformation | EJ | Conversion Device | EJ | Useful Energy | EJ | Passive System | EJ | Final Service | EJ |
|---|---|---|---|---|---|---|---|---|---|---|---|
| Oil | 19.5 | Direct-energy use | 54.8 | Diesel engine | 5.7 | Motion | 6.4 | Car | 0.8 | Passenger transport | 0.3 |
| Biomass | 7.2 | Power & heat generation | 45.5 | Otto engine | 3.1 | Heat | 6.1 | Truck | 1.3 | Freight transport | 1.0 |
| Natural gas | 6.8 | Non-energy use | 3.5 | Aircraft engine | 0.7 | Cooling/light/sound and others | 0.5 | Plane | 0.3 | Sustenance | 0.2 |
| Coal | 69.1 | Fuel loss | 7.0 | Agro-motor | 0.5 | Combustion loss | 17.0 | Ship | 0.4 | Communication | 2.5 |
| Hydro | 6.9 | Other engine | 1.0 | Heat transfer loss | 30.2 | Train | 0.1 | Structure | 0.2 | ||
| Nuclear | 0.7 | Electric motor | 7.7 | Other loss | 9.8 | Factory | 8.1 | Hygiene | 0.1 | ||
| Others | 0.6 | Oil burner | 6.3 | Hot water | 0.3 | Thermal comfort | 0.2 | ||||
| Biomass burner | 6.0 | Heated/cooled space | 1.5 | Illumination | 0.03 | ||||||
| Gas burner | 4.4 | Appliance | 0.1 | ||||||||
| Coal burner | 27.9 | Illuminated space | 0.2 | Passive loss | 8.6 | ||||||
| Electric heater | 1.1 | ||||||||||
| Heat exchanger | 1.0 | ||||||||||
| Cooler | 2.4 | ||||||||||
| Electronics | 1.1 | ||||||||||
| Light device | 1.9 |
| Energy Source | EJ | Transformation | EJ | Conversion Device | EJ | Useful Energy | EJ | Passive System | EJ | Final Service | EJ |
|---|---|---|---|---|---|---|---|---|---|---|---|
| Oil | 24.5 | Direct-energy use | 72.0 | Diesel engine | 7.0 | Motion | 10.6 | Car | 1.9 | Passenger transport | 0.5 |
| Biomass | 9.1 | Power & heat generation | 60.6 | Otto engine | 5.2 | Heat | 8.4 | Truck | 1.9 | Freight transport | 1.5 |
| Natural gas | 12.5 | Non-energy use | 6.9 | Aircraft engine | 1.1 | Cooling/light/sound and others | 0.8 | Plane | 0.5 | Sustenance | 0.2 |
| Coal | 85.0 | Fuel loss | 5.6 | Agro-motor | 0.7 | Combustion loss | 21.8 | Ship | 0.4 | Communication | 0.2 |
| Hydro | 10.2 | Other engine | 1.0 | Heat transfer loss | 38.4 | Train | 0.3 | Structure | 3.7 | ||
| Nuclear | 1.5 | Electric motor | 10.9 | Other loss | 13.5 | Factory | 11.3 | Hygiene | 0.2 | ||
| Wind | 1.7 | Oil burner | 6.1 | Hot water | 0.6 | Thermal comfort | 0.3 | ||||
| Others | 0.6 | Biomass burner | 7.6 | Heated/cooled space | 2.3 | Illumination | 0.04 | ||||
| Gas burner | 8.3 | Appliance | 0.2 | ||||||||
| Coal burner | 35.1 | Illuminated space | 0.4 | Passive loss | 13.1 | ||||||
| Electric heater | 0.9 | ||||||||||
| Heat exchanger | 1.2 | ||||||||||
| Cooler | 3.1 | ||||||||||
| Electronics | 2.2 | ||||||||||
| Light device | 2.9 |
| Conversion Sector | |||||
|---|---|---|---|---|---|
| 2005 | 2010 | 2015 | |||
| Power and heat generation | Coal | 94% | 32% | 36% | 38% |
| Oil | 94% | 22% | 14% | 6% | |
| Natural gas | 96% | 18% | 17% | 24% | |
| Biomass | 90% | 23% | 23% | 23% | |
| Nuclear and renewable energy | 100% | 34% | 38% | 40% | |
| End-use conversion device | Motion | ||||
| Diesel engine | 95% | 25% | 28% | 34% | |
| Otto engine | 99% | 23% | 25% | 30% | |
| Aircraft engine | 99% | 37% | 41% | 44% | |
| Agro-motor | 95% | 25% | 28% | 34% | |
| Other engine | 53% | 14% | 16% | 18% | |
| Electric motor | 93% | 42% | 46% | 51% | |
| Heat | |||||
| Oil burner | 25% | 11% | 13% | 15% | |
| Biomass burner | 20% | 4% | 4% | 4% | |
| Gas burner | 21% | 6% | 7% | 7% | |
| Coal burner | 31% | 14% | 16% | 18% | |
| Electric heater | 30% | 24% | 25% | 25% | |
| Heat exchanger | 15% | 13% | 13% | 13% | |
| Other | |||||
| Cooler | 6% | 5% | 6% | 7% | |
| Electronics | 30% | 6% | 7% | 8% | |
| Light device | 90% | 12% | 13% | 14% | |
| Passive System | Passive Efficiency | ||
|---|---|---|---|
| 2005 | 2010 | 2015 | |
| Vehicle | |||
| Car | 9.8% | 10.0% | 10.3% |
| Truck | 54.5% | 55.6% | 57.2% |
| Plane | 50.2% | 50.2% | 50.2% |
| Ship | 36.8% | 36.8% | 36.8% |
| Train | 46.7% | 47.6% | 49.0% |
| Factory | |||
| Driven System | 41.8% | 42.6% | 43.9% |
| Steam System | 34.0% | 34.7% | 35.7% |
| Furnace | 39.0% | 39.8% | 41.0% |
| Building | |||
| Hot Water System | 20.4% | 20.6% | 21.0% |
| Heated/Cooled Space | 3.8% | 3.9% | 3.9% |
| Appliance | 32.7% | 33.4% | 34.4% |
| Illuminated Space | 5.4% | 5.5% | 5.6% |
| 2005 | 2010 | 2015 | |
|---|---|---|---|
| Industrial coal boiler | 24% | 21% | 21% |
| Coal-fired power & heat generation | 50% | 51% | 51% |
| Capacity of Industrial Coal Boiler (t/h) | 2005 | 2010 | 2015 | |||
|---|---|---|---|---|---|---|
| Structure | Exergy Efficiency | Structure | Exergy Efficiency | Structure | Exergy Efficiency | |
| Capacity ≤ 20 | 81% | 15% | 62% | 16% | 50% | 17% |
| 20 < Capacity ≤ 35 | 7% | 20% | 8% | 21% | 10% | 21% |
| Capacity > 35 | 12% | 24% | 30% | 25% | 40% | 25% |
| Capacity of Coal-Fired Plants (MW) | 2005 | 2010 | 2015 | |||
|---|---|---|---|---|---|---|
| Structure | Exergy Efficiency | Structure | Exergy Efficiency | Structure | Exergy Efficiency | |
| Capacity < 300 | 54% | 33% | 27% | 35% | 21% | 36% |
| 300 ≤ Capacity < 600 | 41% | 34% | 36% | 37% | 36% | 39% |
| Capacity ≥ 600 | 5% | 38% | 37% | 39% | 43% | 40% |
References
- IPCC. Climate Change 2014: Synthesis Report; IPCC: Geneva, Switzerland, 2014. [Google Scholar]
- Energy Efficiency 2019; International Energy Agency: Paris, France, 2019.
- National Development and Reform Commission. Energy Conservation, Energy Efficiency and High-Quality Development. Available online: https://www.ndrc.gov.cn/fzggw/wld/zy/lddt/202006/t20200630_1232504.html (accessed on 21 January 2021).
- Federal Ministry for Economic Affairs and Energy of Gemany. Energy Efficiency. Available online: https://www.bmwi.de/Redaktion/EN/Dossier/energy-efficiency.html (accessed on 21 January 2021).
- Cullen, J.M.; Allwood, J.M. The efficient use of energy: Tracing the global flow of energy from fuel to service. Energy Policy 2010, 38, 75–81. [Google Scholar] [CrossRef]
- Patterson, M.G. What is energy efficiency? Concepts, indicators and methodological issues. Energy Policy 1996, 24, 377–390. [Google Scholar] [CrossRef]
- Li, M.-J.; Tao, W.-Q. Review of methodologies and polices for evaluation of energy efficiency in high energy-consuming industry. Appl. Energy 2017, 187, 203–215. [Google Scholar] [CrossRef]
- Dewulf, J.; Van Langenhove, H.; Muys, B.; Bruers, S.; Bakshi, B.R.; Grubb, G.F.; Paulus, D.M.; Sciubba, E. Exergy: Its potential and limitations in environ-mental science and technology. Environ. Sci. Technol. 2008, 42, 2221–2232. [Google Scholar] [CrossRef] [PubMed]
- Utlu, Z.; Hepbasli, A. A review on analyzing and evaluating the energy utilization efficiency of countries. Renew. Sustain. Energy Rev. 2007, 11, 1–29. [Google Scholar] [CrossRef]
- Haas, R.; Nakicenovic, N.; Ajanovic, A.; Faber, T.; Kranzl, L.; Müller, A.; Resch, G. Towards sustainability of energy systems: A primer on how to apply the concept of energy services to identify necessary trends and policies. Energy Policy 2008, 36, 4012–4021. [Google Scholar] [CrossRef]
- Brockway, P.E.; Barrett, J.R.; Foxon, T.J.; Steinberger, J.K. Divergence of Trends in US and UK Aggregate Exergy Efficiencies 1960–2010. Environ. Sci. Technol. 2014, 48, 9874–9881. [Google Scholar] [CrossRef]
- Serrenho, A.C.; Sousa, T.; Warr, B.; Ayres, R.U.; Domingos, T. Decomposition of useful work intensity: The EU (European Un-ion)-15 countries from 1960 to 2009. Energy 2014, 76, 704–715. [Google Scholar] [CrossRef]
- Brockway, P.E.; Steinberger, J.K.; Barrett, J.R.; Foxon, T.J. Understanding China’s past and future energy demand: An exergy effi-ciency and decomposition analysis. Appl. Energy 2015, 155, 892–903. [Google Scholar] [CrossRef]
- BP Statistical Review of World Energy; BP: London, UK, 2020.
- The 11th Five Year Plan of China; People’s Government of China: Beijing, China, 2006.
- The 12th Five Year Plan of China; People’s Government of China: Beijing, China, 2011.
- The 13th Five Year Plan of China; People’s Government of China: Beijing, China, 2016.
- Wang, W.; Li, Z.; Lyu, J.; Ni, W. Eliminating Outdated Capacity to Promote Energy Conservation in China’s Coal-Fired Power Industry. Engineering 2019, 5, 194–196. [Google Scholar] [CrossRef]
- Ma, C.; Stern, D.I. China’s changing energy intensity trend: A decomposition analysis. Energy Econ. 2008, 30, 1037–1053. [Google Scholar] [CrossRef]
- Liao, H.; Fan, Y.; Wei, Y. What induced China’s energy intensity to fluctuate: 1997–2006? Energy Policy 2007, 35, 4640–4649. [Google Scholar] [CrossRef]
- Zhao, X.; Ma, C.; Hong, D. Why did China’s energy intensity increase during 1998–2006: Decomposition and policy analysis. Energy Policy 2010, 38, 1379–1388. [Google Scholar] [CrossRef]
- Wang, J.; Hu, M.; Rodrigues, J.F.D. The evolution and driving forces of industrial aggregate energy intensity in China: An ex-tended decomposition analysis. Appl. Energy 2018, 228, 2195–2206. [Google Scholar] [CrossRef]
- Zhang, P.; Shi, X.; Sun, Y.; Cui, J.; Shao, S. Have China’s provinces achieved their targets of energy intensity reduction? Reassess-ment based on nighttime lighting data. Energy Policy 2019, 128, 276–283. [Google Scholar] [CrossRef]
- Li, Y.; Sun, L.; Feng, T.; Zhu, C. How to reduce energy intensity in China: A regional comparison perspective. Energy Policy 2013, 61, 513–522. [Google Scholar] [CrossRef]
- Nakićenović, N.; Gilli, P.V.; Kurz, R. Regional and global exergy and energy efficiencies. Energy 1996, 21, 223–237. [Google Scholar] [CrossRef]
- Liu, Y.; Li, Y.; Wang, D.; Liu, J. Energy and exergy utilizations of the Chinese urban residential sector. Energy Convers. Manag. 2014, 86, 634–643. [Google Scholar] [CrossRef]
- Proskuryakova, L.; Kovalev, A. Measuring energy efficiency: Is energy intensity a good evidence base? Appl. Energy 2015, 138, 450–459. [Google Scholar] [CrossRef]
- Paoli, L.; Cullen, J. Technical limits for energy conversion efficiency. Energy 2020, 192, 116228. [Google Scholar] [CrossRef]
- Dincer, I. The role of exergy in energy policy making. Energy Policy 2002, 30, 137–149. [Google Scholar] [CrossRef]
- Gong, M.; Wall, G. Exergy Analysis of the Supply of Energy and Material Resources in the Swedish Society. Energies 2016, 9, 707. [Google Scholar] [CrossRef]
- Valero, A.; Valero, A.; Calvo, G.; Ortego, A.; Ascaso, S.; Palacios, J.-L. Global material requirements for the energy transition. An exergy flow analysis of decarbonisation pathways. Energy 2018, 159, 1175–1184. [Google Scholar] [CrossRef]
- Rosen, M.A.; Dincer, I.; Kanoglu, M. Role of exergy in increasing efficiency and sustainability and reducing environmental im-pact. Energy Policy 2008, 36, 128–137. [Google Scholar] [CrossRef]
- Jorgensen, S.; Nielsen, S.N. Application of exergy as thermodynamic indicator in ecology. Energy 2007, 32, 673–685. [Google Scholar] [CrossRef]
- Nielsen, S.N.; Jørgensen, S.E. Sustainability analysis of a society based on exergy studies—A case study of the island of Samsø (Denmark). J. Clean. Prod. 2015, 96, 12–29. [Google Scholar] [CrossRef]
- Skytt, T.; Nielsen, S.N.; Fröling, M. Energy flows and efficiencies as indicators of regional sustainability—A case study of Jämtland, Sweden. Ecol. Indic. 2019, 100, 74–98. [Google Scholar] [CrossRef]
- Sousa, T.; Brockway, P.E.; Cullen, J.M.; Henriques, S.T.; Miller, J.; Serrenho, A.C.; Domingos, T. The Need for Robust, Consistent Methods in Societal Exergy Accounting. Ecol. Econ. 2017, 141, 11–21. [Google Scholar] [CrossRef]
- Reistad, G.M. Available Energy Conversion and Utilization in the United States. J. Eng. Power 1975, 97, 429–434. [Google Scholar] [CrossRef]
- Rosen, M. Evaluation of energy utilization efficiency in Canada using energy and exergy analyses. Energy 1992, 17, 339–350. [Google Scholar] [CrossRef]
- Dincer, I.; Hussain, M.M.; Al-Zaharnah, I. Analysis of sectoral energy and exergy use of Saudi Arabia. Int. J. Energy Res. 2004, 28, 205–243. [Google Scholar] [CrossRef]
- Utlu, Z.; Hepbasli, A. Turkey’s sectoral energy and exergy analysis between 1999 and 2000. Int. J. Energy Res. 2004, 28, 1177–1196. [Google Scholar] [CrossRef]
- Ayres, R.U.; Ayres, L.W.; Warr, B. Exergy, power and work in the US economy, 1900–1998. Energy 2003, 28, 219–273. [Google Scholar] [CrossRef]
- Warr, B.; Ayres, R.U.; Eisenmenger, N.; Krausmann, F.; Schandl, H. Energy use and economic development: A comparative analysis of useful work supply in Austria, Japan, the United Kingdom and the US during 100years of economic growth. Ecol. Econ. 2010, 69, 1904–1917. [Google Scholar] [CrossRef]
- Cullen, J.M.; Allwood, J.M. Theoretical efficiency limits for energy conversion devices. Energy 2010, 35, 2059–2069. [Google Scholar] [CrossRef]
- Sun, J.X.; Ma, L.W.; Ni, W.D.; Zheng, L. Reducing China’s Energy Consumption and CO2 Emissions by More Efficient Use of Energy; IEEE: New York, NY, USA, 2013; pp. 802–808. [Google Scholar]
- Ma, L.; Allwood, J.M.; Cullen, J.M.; Li, Z. The use of energy in China: Tracing the flow of energy from primary source to demand drivers. Energy 2012, 40, 174–188. [Google Scholar] [CrossRef]
- Chong, C.; Ma, L.; Li, Z.; Ni, W.; Song, S. Logarithmic mean Divisia index (LMDI) decomposition of coal consumption in China based on the energy allocation diagram of coal flows. Energy 2015, 85, 366–378. [Google Scholar] [CrossRef]
- Chong, C.; Liu, P.; Ma, L.; Li, Z.; Ni, W.; Li, X.; Song, S. LMDI decomposition of energy consumption in Guangdong Province, China, based on an energy allocation diagram. Energy 2017, 133, 525–544. [Google Scholar] [CrossRef]
- Chong, C.H.; Tan, W.X.; Ting, Z.J.; Liu, P.; Ma, L.; Li, Z.; Ni, W. The driving factors of energy-related CO2 emission growth in Malaysia: The LMDI decomposition method based on energy allocation analysis. Renew. Sustain. Energy Rev. 2019, 115, 109356. [Google Scholar] [CrossRef]
- Chong, C.; Ni, W.; Ma, L.; Liu, P.; Li, Z. The Use of Energy in Malaysia: Tracing Energy Flows from Primary Source to End Use. Energies 2015, 8, 2828–2866. [Google Scholar] [CrossRef]
- Yang, H.; Ma, L.; Li, Z. A Method for Analyzing Energy-Related Carbon Emissions and the Structural Changes: A Case Study of China from 2005 to 2015. Energies 2020, 13, 2076. [Google Scholar] [CrossRef]
- Zhao, Y.; Kong, G.; Chong, C.; Ma, L.; Li, Z.; Ni, W. How to Effectively Control Energy Consumption Growth in China’s 29 Provinces: A Paradigm of Multi-Regional Analysis Based on EAALMDI Method. Sustainability 2021, 13, 1093. [Google Scholar] [CrossRef]
- Ang, B.W.; Choi, K.-H. Decomposition of Aggregate Energy and Gas Emission Intensities for Industry: A Refined Divisia Index Method. Energy J. 1997, 18, 59–73. [Google Scholar] [CrossRef]
- Ang, B.; Liu, F. A new energy decomposition method: Perfect in decomposition and consistent in aggregation. Energy 2001, 26, 537–548. [Google Scholar] [CrossRef]
- Ang, B. Decomposition analysis for policymaking in energy: Which is the preferred method? Energy Policy 2004, 32, 1131–1139. [Google Scholar] [CrossRef]
- Ang, B. The LMDI approach to decomposition analysis: A practical guide. Energy Policy 2005, 33, 867–871. [Google Scholar] [CrossRef]
- Ang, B.; Liu, N. Handling zero values in the logarithmic mean Divisia index decomposition approach. Energy Policy 2007, 35, 238–246. [Google Scholar] [CrossRef]
- Ang, B. LMDI decomposition approach: A guide for implementation. Energy Policy 2015, 86, 233–238. [Google Scholar] [CrossRef]
- Hardt, L.; Owen, A.; Brockway, P.; Heun, M.K.; Barrett, J.; Taylor, P.G.; Foxon, T.J. Untangling the drivers of energy reduction in the UK productive sectors: Efficiency or offshoring? Appl. Energy 2018, 223, 124–133. [Google Scholar] [CrossRef]
- Zhang, X.; Su, B.; Yang, J.; Cong, J. Index decomposition and attribution analysis of aggregate energy intensity in Shanxi Province (2000–2015). J. Clean. Prod. 2019, 238. [Google Scholar] [CrossRef]
- Wang, C.; Chen, J.; Zou, J. Decomposition of energy-related CO2 emission in China: 1957–2000. Energy 2005, 30, 73–83. [Google Scholar] [CrossRef]
- Motasemi, F.; Afzal, M.T.; Salema, A.A.; Moghavvemi, M.; Shekarchian, M.; Zarifi, F.; Mohsin, R. Energy and exergy utilization efficiencies and emission performance of Canadian transportation sector, 1990–2035. Energy 2014, 64, 355–366. [Google Scholar] [CrossRef]
- China Energy Statistical Yearbook 2006; China’s National Bureau of Statistics: Beijing, China, 2006.
- China Energy Statistical Yearbook 2011; China’s National Bureau of Statistics: Beijing, China, 2011.
- China Energy Statistical Yearbook 2016; China’s National Bureau of Statistics: Beijing, China, 2016.
- Wang, Q. Energy Data of 2006; Innovative Green Development Program: Beijing, China, 2006. [Google Scholar]
- Wang, Q. Energy Data of 2011; Innovative Green Development Program: Beijing, China, 2011. [Google Scholar]
- Wang, Q. Energy Data of 2016; Innovative Green Development Program: Beijing, China, 2016. [Google Scholar]
- The 13th Five-Year Plan for Energy Development; National Development and Reform Commission: Beijing, China, 2016.
- The 13th Five-Year Plan for Renewable Energy Development; National Development and Reform Commission: Beijing, China, 2016.
- Szargut, J.; Morris, D.R.; Steward, F.R. Exergy Analysis of Thermal, Chemical, and Metallurgical Processes; Hemisphere Publishing Corporation: New York, NY, USA, 1987. [Google Scholar]
- Saidur, R.; Masjuki, H.; Jamaluddin, M. An application of energy and exergy analysis in residential sector of Malaysia. Energy Policy 2007, 35, 1050–1063. [Google Scholar] [CrossRef]
- Manso, R.; Sousa, T.; Domingos, T. Do the Different Exergy Accounting Methodologies Provide Consistent or Contradictory Results? A Case Study with the Portuguese Agricultural, Forestry and Fisheries Sector. Energies 2017, 10, 1219. [Google Scholar] [CrossRef]
- Cullen, J.M.; Allwood, J.M.; Borgstein, E.H. Reducing Energy Demand: What Are the Practical Limits? Environ. Sci. Technol. 2011, 45, 1711–1718. [Google Scholar] [CrossRef] [PubMed]
- Worrell, E.; Price, L.; Neelis, M.; Galitsky, C.; Zhou, N. World Best Practice Energy Intensity Values for Selected Industrial Sectors; Lawrence Berkeley National Laboratory: Berkeley, CA, USA, 2007. [Google Scholar]
- Yu, J. Status and transformation measures of industrial coal-fired boiler in China. Clean Coal Technol. 2012, 18, 88–89. (In Chinese) [Google Scholar]
- Yang, Y.; Yang, Z.; Xu, G.; Wang, N. Situation and Prospect of Energy Consumption for China’s Thermal Power Generation. Proc. CSEE 2013, 33, 1–11. [Google Scholar]
- China Power Industry Annual Development Report 2006; China Electricity Council: Beijing, China, 2006.
- China Power Industry Annual Development Report 2011; China Electricity Council: Beijing, China, 2011.
- China Power Industry Annual Development Report 2016; China Electricity Council: Beijing, China, 2016.


| Energy Source | |
|---|---|
| Coal | 1.06 |
| Oil | 1.06 |
| Natural gas | 1.04 |
| Biomass (20% humidity) | 1.11 |
| Dsource-coe | Dsource-str | Dtransf-str | Dtransf-eff | Denduse-str | Denduse-eff | Dpassive-str | Dpassive-eff | Dservice-str | Dtot | |
|---|---|---|---|---|---|---|---|---|---|---|
| 2005–2010 | 0.9551 | 0.9880 | 0.9986 | 1.0395 | 1.0034 | 1.1103 | 1.0023 | 1.0195 | 0.9997 | 1.1148 |
| 2010–2015 | 1.0253 | 0.9703 | 1.0064 | 1.0181 | 1.0137 | 1.1334 | 0.9678 | 1.0266 | 1.0011 | 0.1649 |
| 2005–2015 | 0.9801 | 0.9610 | 1.0053 | 1.0559 | 1.0162 | 1.2562 | 0.9722 | 1.0460 | 1.0006 | 1.2986 |
| Coal Utilization Coefficient | Capacity Structure | Conversion Efficiency | Total | ||
|---|---|---|---|---|---|
| Industrial coal boiler | 2005–2010 | 0.9409 | 1.1076 | 1.0474 | 1.0914 |
| 2010–2015 | 1.0190 | 1.0494 | 1.0590 | 1.1325 | |
| 2005–2015 | 0.9593 | 1.1585 | 1.1123 | 1.2361 | |
| Coal-fired power and heat generation | 2005–2010 | 0.9435 | 1.0330 | 1.0617 | 1.0349 |
| 2010–2015 | 1.0190 | 1.0066 | 1.0412 | 1.0680 | |
| 2005–2015 | 0.9613 | 1.0481 | 1.0969 | 1.1052 |
| Reference | Year | Area | Aggregate Exergy Efficiency | |
|---|---|---|---|---|
| Energy Source–Useful Energy | Energy Source–Final Service | |||
| This study | 2005–2015 | China | 11–15% | 3–5% |
| Nakicenovic et al. [25] | 1990 | World | 10% | a few percent below 10% |
| Cullen and Allwood [43] | 2005 | World | 11% | — |
| Brockway et al. [13] | 1971–2010 | China | 5–13% | — |
Publisher’s Note: MDPI stays neutral with regard to jurisdictional claims in published maps and institutional affiliations. |
© 2021 by the authors. Licensee MDPI, Basel, Switzerland. This article is an open access article distributed under the terms and conditions of the Creative Commons Attribution (CC BY) license (https://creativecommons.org/licenses/by/4.0/).
Share and Cite
Lin, Y.; Chong, C.; Ma, L.; Li, Z.; Ni, W. Analysis of Changes in the Aggregate Exergy Efficiency of China’s Energy System from 2005 to 2015. Energies 2021, 14, 2304. https://doi.org/10.3390/en14082304
Lin Y, Chong C, Ma L, Li Z, Ni W. Analysis of Changes in the Aggregate Exergy Efficiency of China’s Energy System from 2005 to 2015. Energies. 2021; 14(8):2304. https://doi.org/10.3390/en14082304
Chicago/Turabian StyleLin, Yuancheng, Chinhao Chong, Linwei Ma, Zheng Li, and Weidou Ni. 2021. "Analysis of Changes in the Aggregate Exergy Efficiency of China’s Energy System from 2005 to 2015" Energies 14, no. 8: 2304. https://doi.org/10.3390/en14082304
APA StyleLin, Y., Chong, C., Ma, L., Li, Z., & Ni, W. (2021). Analysis of Changes in the Aggregate Exergy Efficiency of China’s Energy System from 2005 to 2015. Energies, 14(8), 2304. https://doi.org/10.3390/en14082304