Article

Acid Treatment as a Way to Reduce Shale Rock Mechanical Strength and to Create a Material Prone to the Formation of Permanent Well Barrier

1
SINTEF Industry, 7034 Trondheim, Norway
2
Department of Geoscience and Petroleum, Norwegian University of Science and Technology, 7034 Trondheim, Norway
*
Author to whom correspondence should be addressed.
Energies 2021, 14(9), 2342; https://doi.org/10.3390/en14092342
Submission received: 15 March 2021 / Revised: 14 April 2021 / Accepted: 18 April 2021 / Published: 21 April 2021
(This article belongs to the Section K: State-of-the-Art Energy Related Technologies)

Abstract

:
Utilization of natural shale formations for the creation of annular barriers in oil and gas wells is currently discussed as a mean of simplifying cumbersome plugging and abandonment procedures. Shales that are likely to form annular barriers are shales with high content of swelling clays and relatively low content of cementation material (e.g., quartz, carbonates). Shales with large content of quartz and low content of swelling clays will be rather brittle and not easily deformable. In this paper we ask the question whether and to what extent it is possible to modify the mechanical properties of relatively brittle shales by chemically removing some cementation material. To answer this question, we have leached out carbonates from Pierre I shale matrix using hydrochloric acid and we have compared mechanical properties of shale before and after leaching. We have also followed leaching dynamics using X-ray tomography. The results show that removal of around 4–5 wt% of cementation material results in 43% reduction in Pierre I shale shear strength compared to the non-etched shale exposed to sodium chloride solution for the same time. The etching rate was shown to be strongly affected by the volume of fluid staying in direct contact with the shale sample.

1. Introduction

All oil and gas wells need to be permanently plugged and abandoned (P&A) after they stop injecting/producing. Well plugging before decommissioning relies on setting several cement plugs in the wellbore to isolate the reservoir and other fluid-bearing formations and to prevent contamination of the environment [1]. Guidelines for permanent abandonment described in NORSOK Standard D-010 assumes setting three barriers in a well: primary and secondary well barriers and the environmental isolation plug. Very often however a plug placed within the casing is not sufficient to create a throughgoing barrier, and the plugging procedure require casing removal. This is the case when the annuli behind the casing is not cemented or the cement quality is not acceptable. Under such circumstances the casing needs to be milled, swarf has to be removed and the remaining casing pulled. These procedures are very time consuming and thus very expensive [2]. Data from ConocoPhillips [2] indicate that pipe removal is one of the most time-consuming P&A operations, taking on average 65 days [2]. Assuming a daily rig day of USD 0.47 million [3] pipe removal from only one well can cost on average USD 38 million. It is thus not surprising that the oil industry is urgently seeking for novel P&A solutions.
One emerging innovation is utilization of shale formations to form natural permanent annular barriers. It has been shown by sonic bond logs that in many wells a solid phase is present behind the casing far above the theoretical cement top [4]. The presence of this solid material was correlated with shales, known to cause problems during drilling. It has been suggested that some shale formations may deform and seal off the space behind the casing. Figure 1 represents schematically how the P&A is performed currently (Figure 1A,B) and the proposed “shale as a barrier” concept (Figure 1C).
Creep, i.e., time dependent plastic deformation, has been identified as the main shale deformation mechanism [5]. It has been suggested that this phenomenon can potentially be useful in P&A [4,5]. Indeed, it has been confirmed in downscaled laboratory experiments that some shales like e.g., Lark-Horda can efficiently seal off annulus [6,7]. It has been shown that annulus closure may be induced by annulus pressure reduction and may be facilitated either thermally [8] or chemically [6]. Bauer et al. used controlled heating to stimulate plastic deformation in shale. They show that undrained heating under deviatoric stress may result in large plastic shear strains [8]. Their thermo-hydro-mechanically coupled finite-element simulations confirm that heating of a well may result in a strong reduction of the borehole radius and eventually to annulus closure. Van Oort et al. have used both heating as well as chemical treatment to accelerate shale creep [6]. They have shown that exposure of Lark-Horda shale to sodium and especially lithium silicate solutions resulted in faster formation of annular barrier compared to the reference test performed with the artificial pore fluid. The authors hypothesize that the fast barrier formation may have a twofold reason: (1) highly alkaline pH of these fluids may result in shale weakening and dispersion due to e.g., increased double-layer repulsion between the clay particles; (2) cation exchange in clays that results in increased intermolecular hydration forces and double-layer repulsion between clay particles leading to clay swelling.
The formation of a sustainable barrier closing the gap between the casing and the formation requires large shale deformations, way beyond the limits of elastic deformation [9]. As borehole closure is restricted by shear stiffness [9], plastic shear deformation or shear failure is needed to close the annulus. Any enhancement of such non-elastic processes in the near well region are therefore potentially beneficial for shale barrier formation. Creep, which is time delayed plastic (predominantly shear) deformation, has been considered to be an important process for the formation of shale barriers [4].
The Lark-Horda shale shown to undergo the chemical acceleration in Van Oort experiment [6] is a weak shale with a Young’s modulus of 827.4 MPa and large clay content of 70–73%, thus it is not surprising that by modulating clay swelling shale creep abilities can be engineered.
The question, whether mechanically strong and brittle shales can be chemically engineered so that they undergo time dependent plastic deformation, remains unanswered. The strong shales are typically those that contain small clay content and large content of cementation minerals like e.g., quartz, calcite, etc. [10]. We hypothesize that chemical etching of some cementation material from shale fabric may lead to reduction of shale stiffness and may lead to acceleration of creep. To achieve a balance between the amount of swelling clays and etched cementation material will be important. In this paper we test to what extent the mechanical strength of such shales can be decreased by chemically removing some cementation material from the shale matrix. To this end we use acid treatment to dissolve carbonates from Pierre I shale and test how this treatment affects the shear strength of this shale.
Acid treatment of shales has been of interest to scientific and oil industry environments in view of so called “matrix acidizing” [11,12,13], shale gas extraction [14], as well as CO2 storage [15,16]. Matrix acidizing of gas and oil-bearing shales is a stimulation method used often as a pre-treatment before hydraulic fracturing. The acidizing aims on: dissolving sediments, mud solids, increasing shale matrix porosity and thus stimulating the formation to produce more oil or gas. It has been shown experimentally that typical shale gas/oil shales like e.g., Eagle Ford, Mancos, Barnett and Marcellus may undergo significant reduction in Young’s Modulus after acid treatment [17]. It has also been reported that shales may experience increased creep behaviour when exposed at acidic conditions, as compared to neutral pH solutions [15]. The above findings suggest that acid treatment may be a good candidate for stimulation of hard and brittle shales to form annular barriers. The novelty of the concept suggested in this paper relies on applying acid treatment to the caprock surface in an annulus in order to weaken a stiff shale and thereby enhance the probability for the formation of a shale barrier.

2. Materials and Methods

2.1. Sample Preparation and Exposure

Pierre I shale was chosen as a model shale material as it possesses relatively high stiffness and friction angle owing to a large content of quartz and non-swelling clays and low content of swelling clays compared to other shales: Young’s modulus ~1 GPa, unconfined compressive strength ~10 MPa, friction angle ~30 degrees. Mineralogical composition of the Pierre I shale is presented in Table 1.
Two types of samples were prepared: (1) samples for mechanical testing and (2) samples for in-situ dynamic testing under X-ray tomography. The samples for mechanical testing have been prepared by first drilling cylindrical blocks (ϕ~14 mm) perpendicular to bedding plane and then slicing the blocks into 3–4 mm thick disks. The disks were polished using a sand paper in a specially designed jig to ensure that the end surfaces are flat and parallel. The samples were protected from drying by immersing them in Marcol oil (ExxonMobil).
As prepared samples were exposed to 1 M HCl (Sigma Aldrich, Saint Louis, MO, USA) or 1 M NaCl (Merck, Darmstadt, Germany) aqueous solutions at ambient conditions. It was important to apply similar molar concentrations of salt and acid in order to assure comparable ionic strength in both solutions so that osmotic swelling/shrinkage is comparable. The 1 M concentration was chosen to make sure the osmotic swelling of the samples will be hindered due to lower ionic strength of the pore fluid. After 2, 21, 48, 96, 144, 192 h at least three samples were removed from the solution, placed in Marcol oil and then P-wave velocity and shear strength measurements were performed as described later in this section.
Samples for dynamics studies were cylindrical shale blocks with diameter of ϕ~14 mm and length of about 15–20 mm. They were drilled out perpendicular to bedding plane and then molded in epoxy resin. The samples were prepared for exposure to acid in a two-fold manner: (1) sample A was cut at the top and polished with a sandpaper in Marcol oil to limit contact with air and drying. At time 0 the 1 M HCL was poured over the sample surface so that the plane parallel to bedding was exposed to acid. (2) sample B was drilled through and the inner diameter was ϕ~4 mm. 1 M acid was injected from the bottom using a syringe in order to displace Marcol oil protecting shale surface from drying out. Figure 2 shows schematically how the samples A and B were exposed to acid. The progress of reaction fronts for samples A and B were followed using X-ray tomography.

2.2. X-ray Computed Tomography

X-ray micro-computed tomography (µ-CT) was performed in order to follow reaction kinetics of shale rock with HCl. To this end an industrial CT scanner (XT H 225 ST, Nikon, Tokyo, Japan) was used. It was operated at 210 kV with a current of 155 μA. The raw CT data were reconstructed into cross sectional slices.

2.3. Powder X-ray Diffraction (XRD)

The changes of mineralogical composition of shales due to acid treatment were followed using a D8 Advance DaVinci X-ray diffractometer (Bruker, Billerica, Massachusetts, USA) with Bragg-Brentano geometry using CuKα radiation (λ = 1.54187 Å). The samples were first washed in water to remove acid and water-soluble reaction products of acid with shale minerals and next crushed using a mortar and pestle and dried at 40 °C. Corundum (α-alumina) was used as an internal standard. The samples were scanned from 2–55° 2θ. The data analysis does not include amorphous material as e.g., organic material. The method is therefore considered as semi-quantitative analysis. The result of X-ray diffraction analysis are listed in Table 1 (untreated Pierre I shale) and Table 2 (acid treated Pierre I shale after different exposure times).

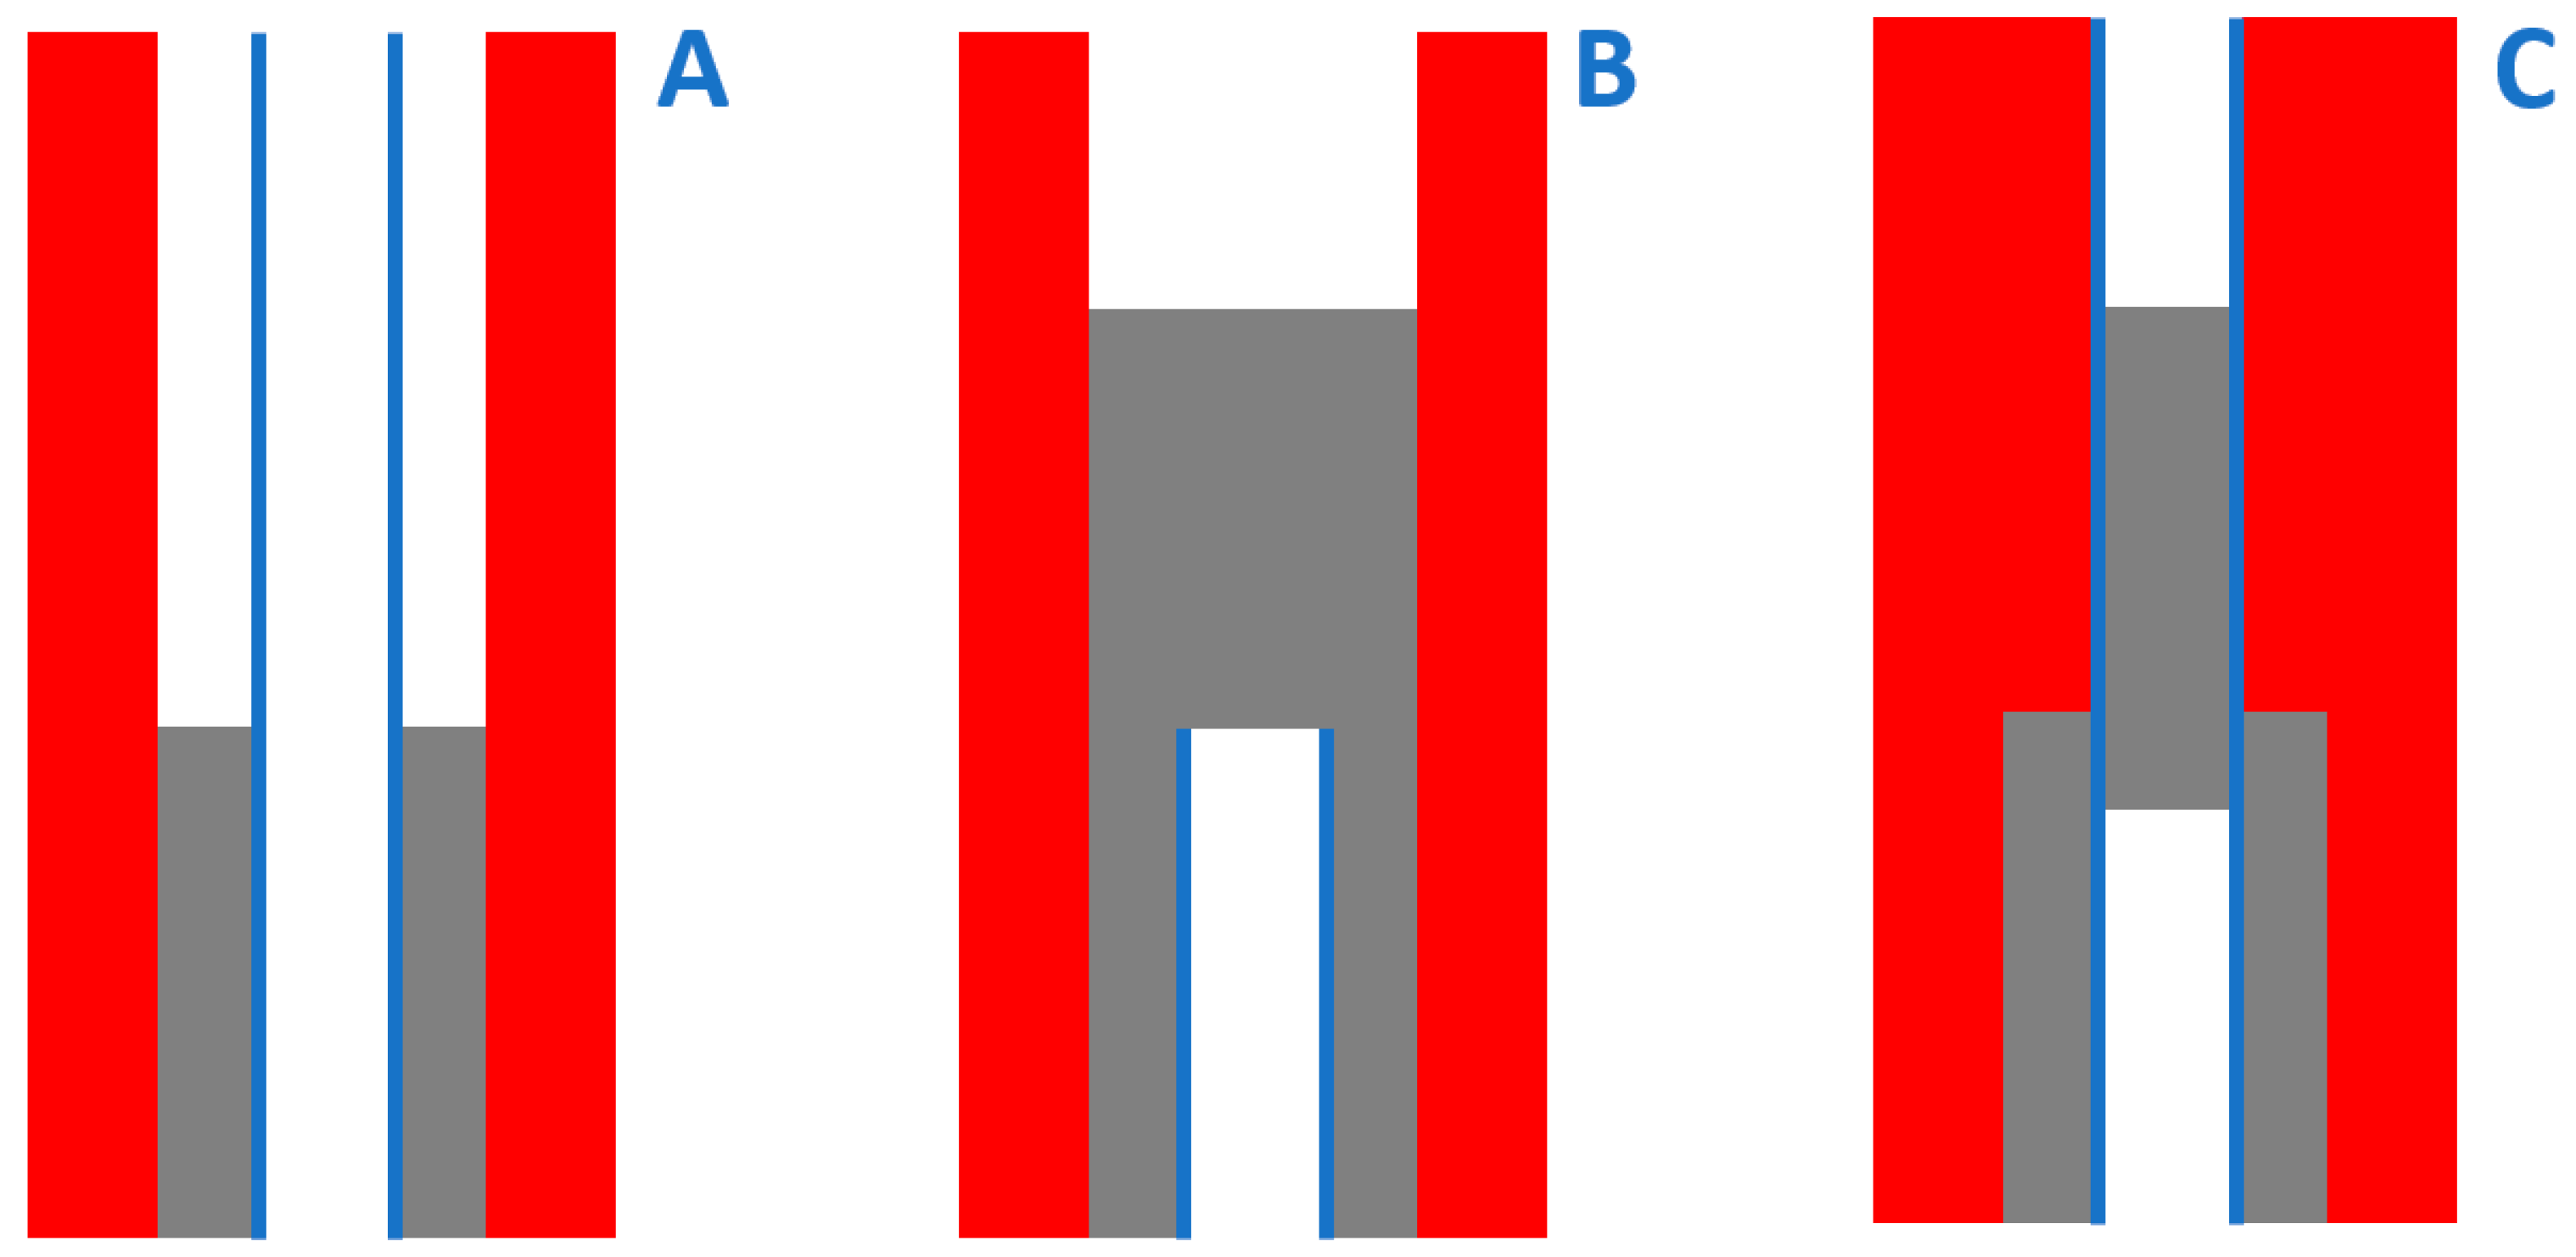
2.4. Shear Strength Measurements

The test is performed by applying an axial force to the head of the puncher tool in displacement control mode while measuring the axial displacement and force. A detailed description of the shale puncher tool used here is given elsewhere [18]. The standard displacement rate used was 0.15 mm/min.

2.5. P-Wave Velocity Measurements

P-wave velocity measurements were performed using the continuous wave technique (CWT) [19]. The technique is designed for measurements on very small (mm thick) samples. It utilizes standing waves in the sample, generated by a sweeping excitation frequency. The phase velocity of the sample is determined from the frequency difference between the resonance peaks. The tool operates in the MHz range.

2.6. Scanning Electron Microscopy/Energy Dispersive Spectroscopy (SEM/EDX)

Scanning electron microscopy (SEM) and Energy-Dispersive X-ray Spectroscopy (EDX) were used to visualize surfaces of shales non exposed and exposed to acid. A S-3400N microscope (Hitachi, Tokyo, Japan) was used at 30 kV accelerating voltage. Images were acquired with a backscattered electron (BSE) detector.

3. Results and Discussion

Typical force-displacement curves obtained for Pierre I shale samples after 96 h of exposure to oil, 1M NaCl brine and 1M HCl are presented in Figure 3. The curves for samples stored in oil were steep and underwent abrupt failure. The axial force needed to shear the sample was on average 2–4 times higher compared to the force required for failure of shale samples stored in water-based fluids. The shape of the force-displacement curve after exposure to water-based fluids became less sharp indicating that the material after exposure changed from brittle to more ductile. Deterioration of shale hardness and strength upon exposure to water based fluids is a well-known phenomenon termed “shale softening” [20]. According to the literature, the main mechanisms responsible for “shale softening” are: (1) interaction of the foreign fluids with swelling clays present in shales that result in volumetric changes of the clay particles, (2) electrostatic repulsion between similarly charged clay particles, and (3) dissolution of cementation minerals [20].
When a well preserved, shale sample is exposed to an external fluid at atmospheric pressure, the fluid first fills in the available pore spaces as pore spaces are typically only partially filled in with pore fluid [21]. Capillary forces transport the fluid further inside the sample and the pore fluid mixes with the exposure fluid. The exact ionic composition of the shale pore fluid of Pierre shale sample used in this work is unknown. Thus, it is expected that the arbitrary chosen 1 molar concentration of NaCl and HCl exposure fluids is very likely different from the pore fluid ionic strength and ionic composition. Mixing of the shale pore fluid with the exposure fluid will thus cause the system to undergo changes toward a new equilibrium state. These changes may thus include: (1) ion exchange between clays and the new pore fluid followed by volumetric response of swelling clays (swelling, shrinkage), (2) changes in the interparticle interactions, (3) dissolution of some minerals due to contact with undersaturated solution [16,20].
The observed significant difference between the maximum peak force after exposure to HCl compared to NaCl is most likely due to leaching out of some cementing material at acidic conditions. It has been shown that exposure of some shale rocks to acidic environment leads to significant deterioration of shale mechanical properties [16,17,22,23,24]. The loss of mechanical strength of shales upon exposure to acidic fluids was ascribed to dissolution of such minerals as: carbonates like calcite, dolomite, magnesite, and siderite; phyllosilicates like e.g., chlorite and K-feldspar [16,25].
In this paper we utilize this effect to transform a brittle Pierre I shale to a more ductile material that may have potential to creep and form a barrier behind a casing.
Figure 4 shows Pierre I shale shear strength evolution (a) and P-wave velocity evolution (b) with exposure time for 1M HCl, 1 M NaCl solutions as well as 1 M HCl solution followed with 1 h washing in a large excess of 1 M NaCl. Huge loss of shear strength (from 5.8 to 2.5 MPa) was observed for all samples independent from the pH of the exposure solution already after 2 h of exposure. This effect can be ascribed to the shale softening effect described earlier in this section. After 21 h of exposure the shear strength of samples exposed to NaCl has only slightly dropped to around 2.2 MPa and stayed unchanged during further exposure. Shear strength of the samples exposed to acid was reduced to about 1.2 MPa and further exposure did not change this value significantly. P-wave velocity values also remained unchanged after 21 h of exposure at 2.5 km/s for samples exposed to NaCl and at around 2.2 km/s for samples exposed to acid. The stable values of shear strength and P-wave velocity already after 21 h suggest that the shale samples reached equilibrium already within 1 day. The lower values of shear strength and P-wave velocity for acid treated shale samples suggest that the treatment affected microstructure of the shale fabric. Indeed, an X-ray tomography cross-section image through sample disks exposed to oil, NaCl, H2O and HCl/H2O, respectively, suggests that the acid exposed sample has lower material density compared to oil and NaCl exposed samples. This is manifested in lower X-rays absorption intensity in the HCl/H2O exposed disk (see Figure 5). The lower material density may be ascribed to partial dissolution of the shale fabric that leads to the formation of micropores in the shale fabric as depicted in Figure 5. Some cracking was observed for the sample that was first exposed to acid and next to water. The cracking was most likely due to increased osmotic pressure as well as swelling pressure acting in water on the mechanically weakened shale matrix.
Figure 6 compares topography and distribution of elements on the surfaces of cross sections through shale samples exposed to HCl and to oil, respectively. The SEM BSE image indicates slightly higher porosity of samples treated with HCl which is in line with X-ray tomography observations. EDX maps indicate that samples treated with HCl are depleted with calcium, magnesium and iron. The amount of other elements like e.g., silicon remained unchanged (data not shown). In order to quantify the amounts of minerals removed during acid treatment powder X-ray diffraction with corundum as an internal standard was performed. The mineralogical composition obtained for the samples based on XRD patterns is given in Table 2. The data show that already after 21 h of acid exposure samples are completely depleted from calcium and magnesium carbonate mineral (CaMg(CO3)2, dolomite). This explains why EDX maps show lower contents of calcium and magnesium. In fact, calcium was almost entirely removed from the shale sample during the acid treatment. Carbonate minerals are very susceptible to acid attack [16]. It has been shown that even weak acids like carbonic acid can efficiently etch carbonates from various types of shales [16,25]. The most susceptible to acid attack is calcite followed by dolomite while siderite and magnesite show lower dissolution rates [26]. The iron removed from shale samples after acid treatment could originate either from siderite (FeCO3), chlorite minerals that were present at low concentrations in Pierre I shale samples or from partial dissolution of phyllosilicate minerals like e.g., illite and mixed layer minerals. Pyrite (Fe2S) is rather resistant to acid attack [27] as long it is not exposed to oxidizing environment [28]. Thus, it is rather likely that the remaining iron after acid treatment is associated with the presence of i.e., pyrite. The apparent increase in the content of quartz after etching is most likely due to removal of carbonates. After removal of carbonates, quartz will constitute a higher fraction per given mass of the shale sample. The presence of siderite is at the detection limit. Appearance of siderite in the sample after 96 h of exposure to 1 M HCl is somewhat surprising as siderite is also susceptible to acid leaching. It is however likely that some reprecipitation might have happened during washing following acid treatment when the washing solution (deionized water with ions washed out from the sample) was in contact with CO2 from the air.
As the acid treatment of Pierre I shale is associated with mineral etching and thus density changes within the shale fabric, it was possible to follow the dynamics of acid treatment using an X-ray tomography technique. The etching was performed in two configurations described in detail and illustrated in the Materials and Methods section. Figure 7 shows the progress of etching for sample A that was exposed to acidic solution in a parallel configuration. In this configuration acid was applied from the top sample side and the shale/acid contact surface was parallel to the bedding plane. Figure 8 shows the progress of etching for sample B that was exposed to acidic solution in a perpendicular configuration where acid was applied through a channel drilled through the cylindrical sample. On the X-ray tomography images shown in both Figure 7 and Figure 8 the etched area was darker compared to the nonmodified material due to lower density and thus lower X-rays absorption intensity in the etched areas.
Figure 9 shows intensity profiles taken from X-ray tomography cross-sections of sample B after different exposure times. The shape of the profiles change with exposure time. In the area close to the exposed channel the intensity decreases with time and the length of the area with reduced intensity increases with time.
The reaction depth was plotted as a function of time for shale samples exposed to HCl acid at parallel and perpendicular configurations (see Figure 10).
A significantly higher etching rate was observed for the sample exposed in the parallel configuration, i.e., when the sample surface parallel to bedding was exposed to acid. Mass transport inside sedimentary rock matrices has been shown to be highly dependent on the direction in respect to rock bedding plane [29,30,31,32]. Typically, the diffusion rates in the direction perpendicular to the bedding plane are shown to be lower than that parallel to the bedding plane [30,31,32]. The anisotropy of the permeability and diffusivity are due to the anisotropy of pore structure of the bedding. Our observations in contrast to literature findings suggest that the etching reaction of carbonates with acid proceeds faster in the direction perpendicular to bedding than parallel. This however can be explained by the geometry and the size of the fluid reservoir being in direct contact with the surface. While in the parallel exposure configuration the whole volume of the reservoir (~20 cm3) is in direct contact with the exposed shale surface, in the perpendicular configuration only a small volume of a narrow channel (0.75 cm3) is in contact with the surface while the larger fluid reservoir (~20 cm3) is only connected via the channel. The presence of the narrow channel significantly constrains transport of reaction substrate (HCl acid) to the shale and products (e.g., calcium ions) from the surface. The constrained transport is the most likely explanation for the lower reaction rates in the perpendicular configuration compared to the parallel. Similar reduced reaction rates have been previously reported by Chavez Panduro et.al. [33]. The reactive fluid flow through the channel resulted in a significantly facilitated etching processes compared to the stationary conditions [33]. This suggest that at stationary conditions the volume of fluid in respect to the exposed surface will affect the etching rate while at the flow conditions the reaction rate will depend on the fluid flow rate [34]. Summarizing, the etching rate will be dependent on geometry in which shale is exposed to acid in addition to shale type, bedding plane exposed, acid concentration and type as well as temperature, pressure, and the reactive fluid flow rate.

Limitations

Only one type of shale has been studied in this paper. As it is likely that strength changes upon acid treatment will be determined by the proportions of swelling to cementation minerals as well as porosity of shales, a broader range of shales needs to be studied to find the relation between the proportions of these components that allow for creep and to find out how to engineer shales to induce creep. Another important aspect that future studies have to address is engineering of shale properties at conditions mimicking downhole conditions, i.e., higher temperature and pressure. The two parameters may affect both leaching rates as well as the resulting mechanical response.
It is expected however that any reduction in shear strength of the shale will improve the probability for annulus closure, unless the shear modulus of the shale is extremely small (typically less than 0.05 GPa [9]). Whether a given reduction in strength is sufficient to close the annulus in a given situation depends on the local stress and pore pressure conditions, the initial strength and the shear modulus of the rock (as well as the size of the annulus gap).
The thickness of the shale barrier has to be at least the minimum plug length required by regulations, which is 50 m in the Norwegian sector of the North Sea [3] while it is 100 ft (30.5 m) in the UK sector [35]. Since flow requires a continuous flow path, one may think that an impermeable annulus barrier is equally efficient regardless its length, hence the more efficient the barrier is, the shorter it can be while still fulfilling the required sealing efficiency. This argument has limited validity however, since the leaking fluid may bypass a short barrier by going through the intact shale which is not entirely impermeable, at least not in an “eternal perspective” [3]. The requirement that the barrier shall be “impermeable” [3], or at least sufficiently effective so that it only permits “leakage of fluids at the same rate or a lower rate than the caprock” [35] can hardly be met by any realistically applicable technology anyway, hence the minimum plug length set by regulators is for practical purposes the most relevant value for the minimum thickness of the shale formation.
The performance of the shale barrier will anyway need to be verified in accordance to current practices. There are currently two pressure integrity type of tests used to verify the performance of well barrier elements. These are: (1) The XLOT-type test and (2) the communications test. The resolution limits of those tests are, however, limited and the tests are not capable to detect annulus permeability below the milli Darcy permeability range [36].
Whether or not the concept of acid treatment to reduce strength of strong shales can be applicable in the field or not depends on whether the solution to combat casing corrosion can be applied as acids show corrosive properties towards metals including casing steel. The casing could possibly be protected from corrosion by e.g., applying coating on casing or corrosion inhibitors. In the latter case the effect of inhibitors on carbonates leaching has to be determined.

4. Conclusions

In this paper we show to what extend the mechanical properties of Pierre I shale can be changed by removing from the shale matrix carbonates acting as a cementation material. The removal was done by chemical leaching of carbonates in hydrochloric acid. Mechanical properties of shale before and after leaching have been compared. The results show that:
(1)
removal of around 4–5 wt% of cementation material resulted in 43% reduction in Pierre shale shear strength compared to the non-etched shale exposed to sodium chloride solution for the same time.
(2)
the removed material was mainly dolomite
(3)
leaching rate was dependent on geometry in which shale was exposed to acid, or more specifically, on volume staying in direct contact with the exposed shale surface. It has been suggested that leaching rate can be enhanced by inducing fluid flow.
Whether or not the observed mechanical strength reduction is sufficient for the shale barrier to form around casing is a subject of our further studies.

Author Contributions

Conceptualization, E.F. and K.G.; methodology, E.F., K.G.; investigation, K.G., M.L., M.H.B., R.B.; data curation, K.G., M.L., R.B.; writing—original draft preparation, K.G., M.L.; writing—review and editing, E.F., K.G., M.L., M.H.B., R.B.; supervision, E.F.; funding acquisition, E.F. All authors have read and agreed to the published version of the manuscript.

Funding

This work was supported by the Research Council of Norway, Aker BP ASA, BP Exploration Operating Company Ltd, ConocoPhillips Skandinavia AS, Equinor Energy AS, Lundin Norway AS, Petrobras and Total E&P Norge AS through the KPN project “Shale Barrier Toolbox: Designing future wells for efficient completion and simpler P&A” (Grant no. 280650/E30) at SINTEF Industry.

Institutional Review Board Statement

Not applicable.

Informed Consent Statement

Not applicable.

Data Availability Statement

Data will be made available upon request.

Conflicts of Interest

The authors declare no conflict of interest.

Abbreviations

QZQuartz
K-fK-feldspar
PlPlagioclase
ChChlorite
KaKaolinite
Mi/IlMica/illite
MixMixed layer
SmSmectite
DolDolomite
PyPyrite
P&Aplugging and abandonment
µ-CT, CTX-ray micro-computed tomography
XRDpowder X-ray diffraction
EDXenergy dispersive X-ray spectroscopy

References

  1. Vrålstad, T.; Saasen, A.; Fjær, E.; Øia, T.; Ytrehus, J.D.; Khalifeh, M. Plug & abandonment of offshore wells: Ensuring long-term well integrity and cost-efficiency. J. Pet. Sci. Eng. 2019, 173, 478–491. [Google Scholar] [CrossRef]
  2. Scanlon, E.; Garfield, G.L.; Brobak, S. New Technologies to Enhance Performance of Section Milling Operations that Reduces Rig Time for P&A Campaign in Norway. In Proceedings of the SPE/IADC Drilling Conference and Exhibition, Amsterdam, The Netherlands, 1–3 March 2011. [Google Scholar]
  3. D-010, Well Integrity in Drilling and Well Operations, Standards Norway. Available online: https://www.standard.no/en/sectors/energi-og-klima/Petroleum/NORSOK-Standard-Categories/D-Drilling/D-0102/ (accessed on 25 February 2021).
  4. Williams, S.M.; Carlsen, T.; Constable, K.C.; Guldahl, A.C. Identification and Qualification of Shale Annular Barriers Using Wireline Logs During Plug and Abandonment Operations. In Proceedings of the All Days; Society of Petroleum Engineers (SPE), San Antonio, TX, USA, 17 March 2009; p. 15. [Google Scholar]
  5. Kristiansen, T.G.; Dyngeland, T.; Kinn, S.; Flatebø, R.; Aarseth, N.A. Activating Shale to Form Well Barriers: Theory and Field Examples. In Proceedings of the SPE Annual Technical Conference and Exhibition 2018, Dallas, TX, USA, 24–26 September 2018; p. 23. [Google Scholar]
  6. van Oort, E.; Juenger, M.; Aldin, M.; Thombare, A.; McDonald, M. Simplifying Well Abandonments Using Shale as a Barrier. In Proceedings of the IADC/SPE International Drilling Conference and Exhibition, Galveston, TX, USA, 25 February 2020. [Google Scholar]
  7. Fjær, E.; Larsen, I. Shale as a Sealing Barrier around Deep Wells. In Proceedings of the ASME 2018 37th International Conference on Ocean, Offshore and Arctic Engineering, Madrid, Spain, 17–22 June 2018. [Google Scholar]
  8. Bauer, A.; Stenebråten, J.F.; Li, L.; Fjær, E. Can heating-induced creep result in shale barriers for P&A applications? In Proceedings of the 51st US Rock Mechanics/Geomechanics Symposium, San Francisco, CA, USA, 25–28 June 2017.
  9. Fjær, E.; Folstad, J.S.; Li, L. How creeping shale may form a sealing barrier around a well. In Proceedings of the 50th US Rock Mechanics/Geomechanics Symposium, Houston, TX, USA, 5–29 June 2016. [Google Scholar]
  10. Farrokhrouz, M. Mechanics and Mechanisms; Taylor & Francis Group: Oxfordshire, UK, 2013. [Google Scholar]
  11. Guo, T.; Li, Y.; Ding, Y.; Qu, Z.; Gai, N.; Rui, Z. Evaluation of Acid Fracturing Treatments in Shale Formation. Energy Fuels 2017, 31, 10479–10489. [Google Scholar] [CrossRef]
  12. Rabbani, E.; Davarpanah, A.; Memariani, M. An experimental study of acidizing operation performances on the wellbore productivity index enhancement. J. Pet. Explor. Prod. Technol. 2018, 8, 1243–1253. [Google Scholar] [CrossRef] [Green Version]
  13. Abdollahi, R.; Esfandyari, H.; Pari, M.N.; Davarpanah, A. Conventional diverting techniques and novel fibr-assisted self-diverting system in carbonate reservoir acidizing with successful case studies. Pet. Res. 2021. [Google Scholar] [CrossRef]
  14. Hu, X.; Xie, J.; Cai, W.; Wang, R.; Davarpanah, A. Thermodynamic effects of cycling carbon dioxide injectivity in shale reservoirs. J. Pet. Sci. Eng. 2020, 195, 107717. [Google Scholar] [CrossRef]
  15. Cerasi, P.; Lund, E.; Kleiven, M.L.; Stroisz, A.; Pradhan, S.; Kjøller, C.; Frykman, P.; Fjær, E. Shale Creep as Leakage Healing Mechanism in CO2 Sequestration. Energy Procedia 2017, 114, 3096–3112. [Google Scholar] [CrossRef]
  16. Bhuiyan, M.H.; Agofack, N.; Gawel, K.M.; Cerasi, P.R. Micro- and Macroscale Consequences of Interactions between CO2 and Shale Rocks. Energies 2020, 13, 1167. [Google Scholar] [CrossRef] [Green Version]
  17. Morsy, S.; Hetherington, C.J.; Sheng, J.J. Effect of Low-Concentration HCl on the Mineralogical, Mechanical, and Physical Properties of Shale Rocks. In Proceedings of the SPE Eastern Regional Meeting, Pittsburgh, PA, USA, 20–22 August 2013. [Google Scholar]
  18. Stenebraten, J.F.; Sonstebo, E.F.; Lavrov, A.V.; Fjaer, E.; Haaland, S. The shale puncher-a compact tool for fast testing of small shale samples. In Proceedings of the 42nd US Rock Mechanics Symposium (USRMS), San Francisco, CA, USA, 1 January 2008. [Google Scholar]
  19. Nes, O.; Horsrud, P.; Sonstebo, E.; Holt, R.; Ese, A.; Okland, D.; Kjorholt, H. Rig Site and Laboratory Use of CWT Acoustic Velocity Measurements on Cuttings. SPE Reserv. Eval. Eng. 1998, 1, 282–287. [Google Scholar] [CrossRef]
  20. Du, J.; Hu, L.; Meegoda, J.N.; Zhang, G. Shale softening: Observations, phenomenological behavior, and mechanisms. Appl. Clay Sci. 2018, 161, 290–300. [Google Scholar] [CrossRef]
  21. Santarelli, F.J.; Carminati, S. Do Shales Swell? A Critical Review of Available Evidence. In Proceedings of the SPE/IADC Drilling Conference, Amsterdam, The Netherlands, 28 February–2 March 1995; p. 16. [Google Scholar]
  22. Feng, G.; Kang, Y.; Sun, Z.-D.; Wang, X.-C.; Hu, Y.-Q. Effects of supercritical CO2 adsorption on the mechanical characteristics and failure mechanisms of shale. Energy 2019, 173, 870–882. [Google Scholar] [CrossRef]
  23. Ao, X.; Lu, Y.; Tang, J.; Chen, Y.; Li, H. Investigation on the physics structure and chemical properties of the shale treated by supercritical CO2. J. CO2 Util. 2017, 20, 274–281. [Google Scholar] [CrossRef]
  24. Zou, Y.; Li, S.; Ma, X.; Zhang, S.; Li, N.; Chen, M. Effects of CO 2 –brine–rock interaction on porosity/permeability and mechanical properties during supercritical-CO2 fracturing in shale reservoirs. J. Nat. Gas Sci. Eng. 2018, 49, 157–168. [Google Scholar] [CrossRef]
  25. Gaus, I. Role and impact of CO2–rock interactions during CO2 storage in sedimentary rocks. Int. J. Greenh. Gas Control. 2010, 4, 73–89. [Google Scholar] [CrossRef]
  26. Golubev, S.V.; Bénézeth, P.; Schott, J.; Dandurand, J.L.; Castillo, A. Siderite dissolution kinetics in acidic aqueous solutions from 25 to 100 °C and 0 to 50 atm pCO2. Chem. Geol. 2009, 265, 13–19. [Google Scholar] [CrossRef]
  27. Al Moajil, A.; Al-Khaldi, M.; Hazzazi, H.; Caliskan, S. Acidizing Highly Permeable Sandstone Stringers: Drill-in Fluid Damage and Compatibility with Rock Minerals. In Proceedings of the SPE Trinidad and Tobago Section Energy Resources Conference, San Francisco, CA, USA, 22 June 2018. [Google Scholar]
  28. Descostes, M.; Vitorge, P.; Beaucaire, C. Pyrite dissolution in acidic media. Geochim. Cosmochim. Acta 2004, 68, 4559–4569. [Google Scholar] [CrossRef]
  29. Negara, A.; Salama, A.; Sun, S.; Elgassier, M.; Wu, Y.-S. Numerical Simulation of Natural Gas Flow in Anisotropic Shale Reservoirs. In Proceedings of the 2015 Abu Dhabi International Petroleum Exhibition and Conference, Abu Dhabi, UAB, 9–12 November 2015. [Google Scholar]
  30. Yang, Y.; Lu, X.; Wang, Q.; Song, D.; Chen, Y.; Hong, Y. Study on the anisotropy of mass transfer for oxygen in the ash layer of extremely low calorific oil shale semi-coke. Appl. Therm. Eng. 2018, 128, 1494–1501. [Google Scholar] [CrossRef]
  31. Sato, M.; Panaghi, K.; Takada, N.; Takeda, M. Effect of Bedding Planes on the Permeability and Diffusivity Anisotropies of Berea Sandstone. Transp. Porous Media 2019, 127, 587–603. [Google Scholar] [CrossRef] [Green Version]
  32. Ghanbari, E.; Xu, M.; Dehghanpour, H.; Bearinger, D. Advances in Understanding Liquid Flow in Gas Shales. In Proceedings of the SPE/CSUR Unconventional Resources Conference, Calgary, AB, Canada, 30 September 2014; pp. 1030–1049. [Google Scholar]
  33. Panduro, E.A.C.; Torsæter, M.; Gawel, K.; Bjørge, R.; Gibaud, A.; Yang, Y.; Bruns, S.; Zheng, Y.; Sørensen, H.O.; Breiby, D.W. In-Situ X-ray Tomography Study of Cement Exposed to CO2 Saturated Brine. Environ. Sci. Technol. 2017, 51, 9344–9351. [Google Scholar] [CrossRef] [PubMed]
  34. Brunet, J.-P.L.; Li, L.; Karpyn, Z.T.; Huerta, N.J. Fracture opening or self-sealing: Critical residence time as a unifying parameter for cement–CO2–brine interactions. Int. J. Greenh. Gas Control. 2016, 47, 25–37. [Google Scholar] [CrossRef] [Green Version]
  35. Guidelines on Qualification of Materials for the Abandonment of Wells, Issue 2; The UK Oil and Gas Industry Association Limited: London, UK, 2015.
  36. Raaen, A.M.; Fjær, E. Pressure Testing of Barrier Integrity. In Proceedings of the ASME 2020 39th International Conference on Ocean, Offshore and Arctic Engineering, Fort Lauderdale, FL, USA, 3–7 August 2020. [Google Scholar]
Figure 1. Schematic illustration of: (A) Unplugged well: caprock (red), cement (grey), casing (blue); (B) Current P&A operations including casing removal and formation-to-formation cementing; (C) The proposed “shale as a barrier” concept relying on plugging of uncemented annulus by spontaneous or chemically induced shale deformation.
Energies 14 02342 g001
Figure 2. Schematic illustration of in-situ exposure configuration for X-ray tomography studies of samples (A) (parallel configuration where the surface exposed to acid was paralell to the bedding plane) and (B) (perpendicular configuration where the surface exposed to acid was perpendicular to the bedding plane). Sample diameter was ϕ~14 mm and the length about 15-20 mm in both configurations. The hole diameter in configuration B was ϕ~4 mm.
Energies 14 02342 g002
Figure 3. Typical force-displacement curves obtained after 96 h of exposure to different fluids i.e., oil, 1M NaCl brine and 1M HCl. Indicate decimals with “.” not “,”.
Energies 14 02342 g003
Figure 4. Shear strength (a) and P-wave velocity (b) vs. duration of sample exposure to 1 M NaCl (orange), 1 M HCl (blue), 1 M HCl and 2 additional hours in 1M NaCl (grey). Error bars indicate standard deviation from the mean value obtained for at least three samples. Wherever an error bar is not visible, the standard deviation is smaller than the size of markers.
Energies 14 02342 g004
Figure 5. X-ray tomography cross-sectional image through shale disks exposed for 96 h to oil, 1 M NaCl, H2O and 1 M HCl/H2O, respectively, (left) and around 3 times enlarged images of shale samples exposed to H2O (top) and 1 M HCl and H2O (bottom) with micro-sized porosity highlighted in red being a consequence of mineral dissolution (right).
Energies 14 02342 g005
Figure 6. SEM BSE image and EDX maps showing distribution of calcium, magnesium and iron elements on surfaces of cross-sections of shale samples exposed to 1 M HCl (left) and 1 M NaCl (right) after 96 h of exposure.
Energies 14 02342 g006
Figure 7. X-ray tomography cross-sections through the cylindrical shale sample A (in a parallel configuration where the surface exposed to 1 M HCl was parallel to the bedding plane) after different exposure times (0, 3, 21 and 96 h) indicating (red stripe) the progress of the etching process.
Energies 14 02342 g007
Figure 8. X-ray tomography XY (top) and YZ (bottom) cross-sections through the cylindrical shale sample B (in a configuration where the surface exposed to acid was perpendicular to the bedding plane) after different exposure times (0, 5, 10, 29, 53 and 125 h). The red stripe indicates the extent of the etched volume. The channel diameter is ~4 mm.
Energies 14 02342 g008
Figure 9. Intensity profiles for sample B taken after 0, 10, 55 and 125 h of exposure to 1 M HCl. The red lines indicate the outer boundaries of the etched volume.
Energies 14 02342 g009
Figure 10. Reaction depth (distance from surface to the reaction front) vs time for sample A (parallel configuration-blue) and B (perpendicular configuration-red) with fitted logarithmic function.
Energies 14 02342 g010
Table 1. Mineralogical composition of Pierre shale estimated based on X-ray diffraction.
QZK-fPlChKaMi/IlMixSmDolPy
wt%3051117308241
QZ Quartz, K-f K-feldspar, Pl Plagioclase, Ch Chlorite, Ka kaolinite, Mi/Il Mica/illite, Mix Mixed layer, Sm Smectite, Dol Dolomite, Py Pyrite.
Table 2. Mineralogical composition of shale samples after exposure to oil, water (after 96 h) and 1 M HCl (after 2, 21, 46, 96 h).
QZK-fPlChKaMi/IlMixSmSiDolPy
Oil30511173082041
H2O276120829310141
HCl 2 h29790725315131
HCl 21 h298120623318001
HCl 46 h328120428410002
HCl 96 h32715062539102
QZ Quartz, K-f K-feldspar, Pl Plagioclase, Ch Chlorite, Ka kaolinite, Mi/Il Mica/illite, Mix Mixed layer, Sm Smectite, Dol Dolomite, Si Siderite, Py Pyrite.
Publisher’s Note: MDPI stays neutral with regard to jurisdictional claims in published maps and institutional affiliations.

