Article

The Influence of a Photovoltaic Micro-Installation on the Low-Frequency Parameters of Electricity at PCC and Its Impact on the Thermal Characteristics of Selected Devices

1
Department of Metrology and Optoelectronics, Faculty of Electronics, Telecommunications and Informatics, Gdansk University of Technology, ul. G. Narutowicza 11/12, 80-288 Gdansk, Poland
2
Departments of Electric Drivers and Energy Conversions, Faculty of Electrical and Control Engineering, Gdansk University of Technology, ul. G. Narutowicza 11/12, 80-288 Gdansk, Poland
*
Author to whom correspondence should be addressed.
Energies 2021, 14(9), 2355; https://doi.org/10.3390/en14092355
Submission received: 19 March 2021 / Revised: 14 April 2021 / Accepted: 19 April 2021 / Published: 21 April 2021
(This article belongs to the Section A2: Solar Energy and Photovoltaic Systems)

Abstract

:
This manuscript illustrates the measurement results of parameters describing the quality of energy at the PCC (point of common coupling) of a photovoltaic micro-installation that can significantly affect devices in the same power grid. The analyses reflecting heating of selected devices used in domestic installations, which were performed in an isolated laboratory environment, are also indicated. The conducted study aimed at checking the thermal characteristics of the chosen equipment, i.e., AC/DC power supply, LED and fluorescent light sources, a step-down transformer at synergistically higher voltage harmonics and constant component in the network voltage. The tests were carried out at the disturbance levels recorded at the site of the photovoltaic micro-installation. The conducted tests aimed at indicating the presence of an increased level of synergetic disturbances in the vicinity of micro-photovoltaic installations. Based on the research, recommendations were made for photovoltaic micro-installations.

1. Introduction

Power electronic devices have recently recorded a significant increase in domestic appliances, which is mostly due to the development and wide use of renewable energy installations. Their popularity is largely related to the necessity to convert the obtained energy into the currently used form. It is assumed that electricity acquired with the use of the broadly understood solar technology currently reaches about 600 GW installed capacity [1], which equals to about 30% of energy obtained from renewable sources. Solar installations evolve to a various extent all over the world. In some countries, significant saturation of their occurrence in supply networks was achieved. Solar installations are currently being developed mainly based on systems that use photovoltaic energy. Poland is one of the countries with considerable expansion. Recently, there has been a very rapid growth of photovoltaic installations, which are massively connected to the power grid. According to data from the Energy Regulatory Office and PSE–Operator [2] (Polskie Sieci Elektroenergetyczne—Operator), in 2015 installations with a capacity of 71 MW were installed in Poland, while in 2019 the capacity reached the level of 477 MW. In January 2020, capacities of 1.3 GW were noted, whereas at the beginning of December 2020, it was reported that there were new installations with a total capacity exceeding 3.7 GW [3]. It is the sector of photovoltaic micro-installations that is responsible for such a large increase. The achieved level of photovoltaic installations is still much lower than, for example, in Germany, where installations with a capacity of approximately 49 GW were installed [4] (in 2019, 4 GW of new installations were installed), or in Spain, where according to the REE report [5], in 2019 the installed capacity of photovoltaic installations was close to 4 GW. However, the growth rate of small photovoltaic infrastructure is very dynamic. At the same time, it should also be mentioned that most of these installations are on-grid systems. Systems equipped with energy storage are installed in a few cases. The restrictions in force in Poland allow for the use of single-phase inverters up to 3.68 kW in micro installations without restrictions on their connection to the grid [6]. On the other hand, in the reference to installations up to 10 kW, the installed inverters should be remotely controlled by the grid operator. The emerging new installations not only increase the contribution in the production of renewable energy, but also in some cases are a source of disturbances introduced into the grid. Similar problems have already been monitored in different photovoltaic installations in various parts of the world and presented among others [7,8,9,10]. They indicate a number of similarities in the reported problems resulting from incorrect operation of renewable energy systems. The issues related to the spreading use of diverse renewable energy installations cooperating with power grids can be divided into those resulting from [11,12,13,14]:
  • Power flows from LV (Low Voltage) grid to MV (Medium Voltage) grid;
  • The occurrence of an increase in voltage on the lines caused by the reverse operation of current loads;
  • Problems with voltage control at network control points (power flows from different directions);
  • Increase in losses on transmission systems related to power flows;
  • Problems with reactive power flows and their distribution;
  • Formation of unbalance in the reference to differences between phases L 1–L 2–L 3.
Additionally, the operation of inverters often leads to problems with:
  • Energy quality;
  • Electromagnetic compatibility of devices cooperating with networks in which there are photovoltaic installations.
In the case of low-frequency disturbances, it often causes a range of problems occurring in power networks and end devices. It is related to frequently occurring additional thermal and electrical effects, which are the reason of, among others, accelerated aging processes [15,16]. Additionally, there may be miscellaneous damages related to malfunction of devices under the influence of existing disturbances. Such effects have been observed in various parts of the world where renewable energy installations have grown rapidly. The article presents the results of observed disturbances that occurred in the LV supply network. The tests were commissioned by one of the power network operators due to an increased number of electrical equipment and apparatus failures in a certain area. Additionally, there were reports from end users regarding various damages to electrical devices. The primary reported remark was overheating of devices powered from the LV grid. Actions taken by the operator showed that a low-power photovoltaic installation was connected to the grid in the area in question. The connected installation was a typical 1-phase installation mounted in the energy operator’s area of operation. The mentioned low-power installation consists of a set of PV modules (14 pcs) and an inverter enabling cooperation with the grid (as in the Figure 1); however, there was no energy storage.
According to the current legal conditions, grid operators are provided with the information for generating groups A on the power generating module and about the photovoltaic panels in accordance to EU Commission Regulation 2016/631 dated 14 April 2016, establishing the EU grid code (the so-called NC RfG code) [17]. On that basis, accompanied by the documents on proper assembly and final approval by authorized companies, network operators issue a decision on connecting the installation to the network. On one hand, such an approach enables a relatively quick connection of new suppliers, however, on the other, in some cases problematic installations are implemented. This manuscript presents only the results related to low-frequency disturbances recognized in the supply network, which were identified as originating from renewable energy installations based on photovoltaic panels cooperating with a 1-phase inverter.

2. Tested Micro Installation

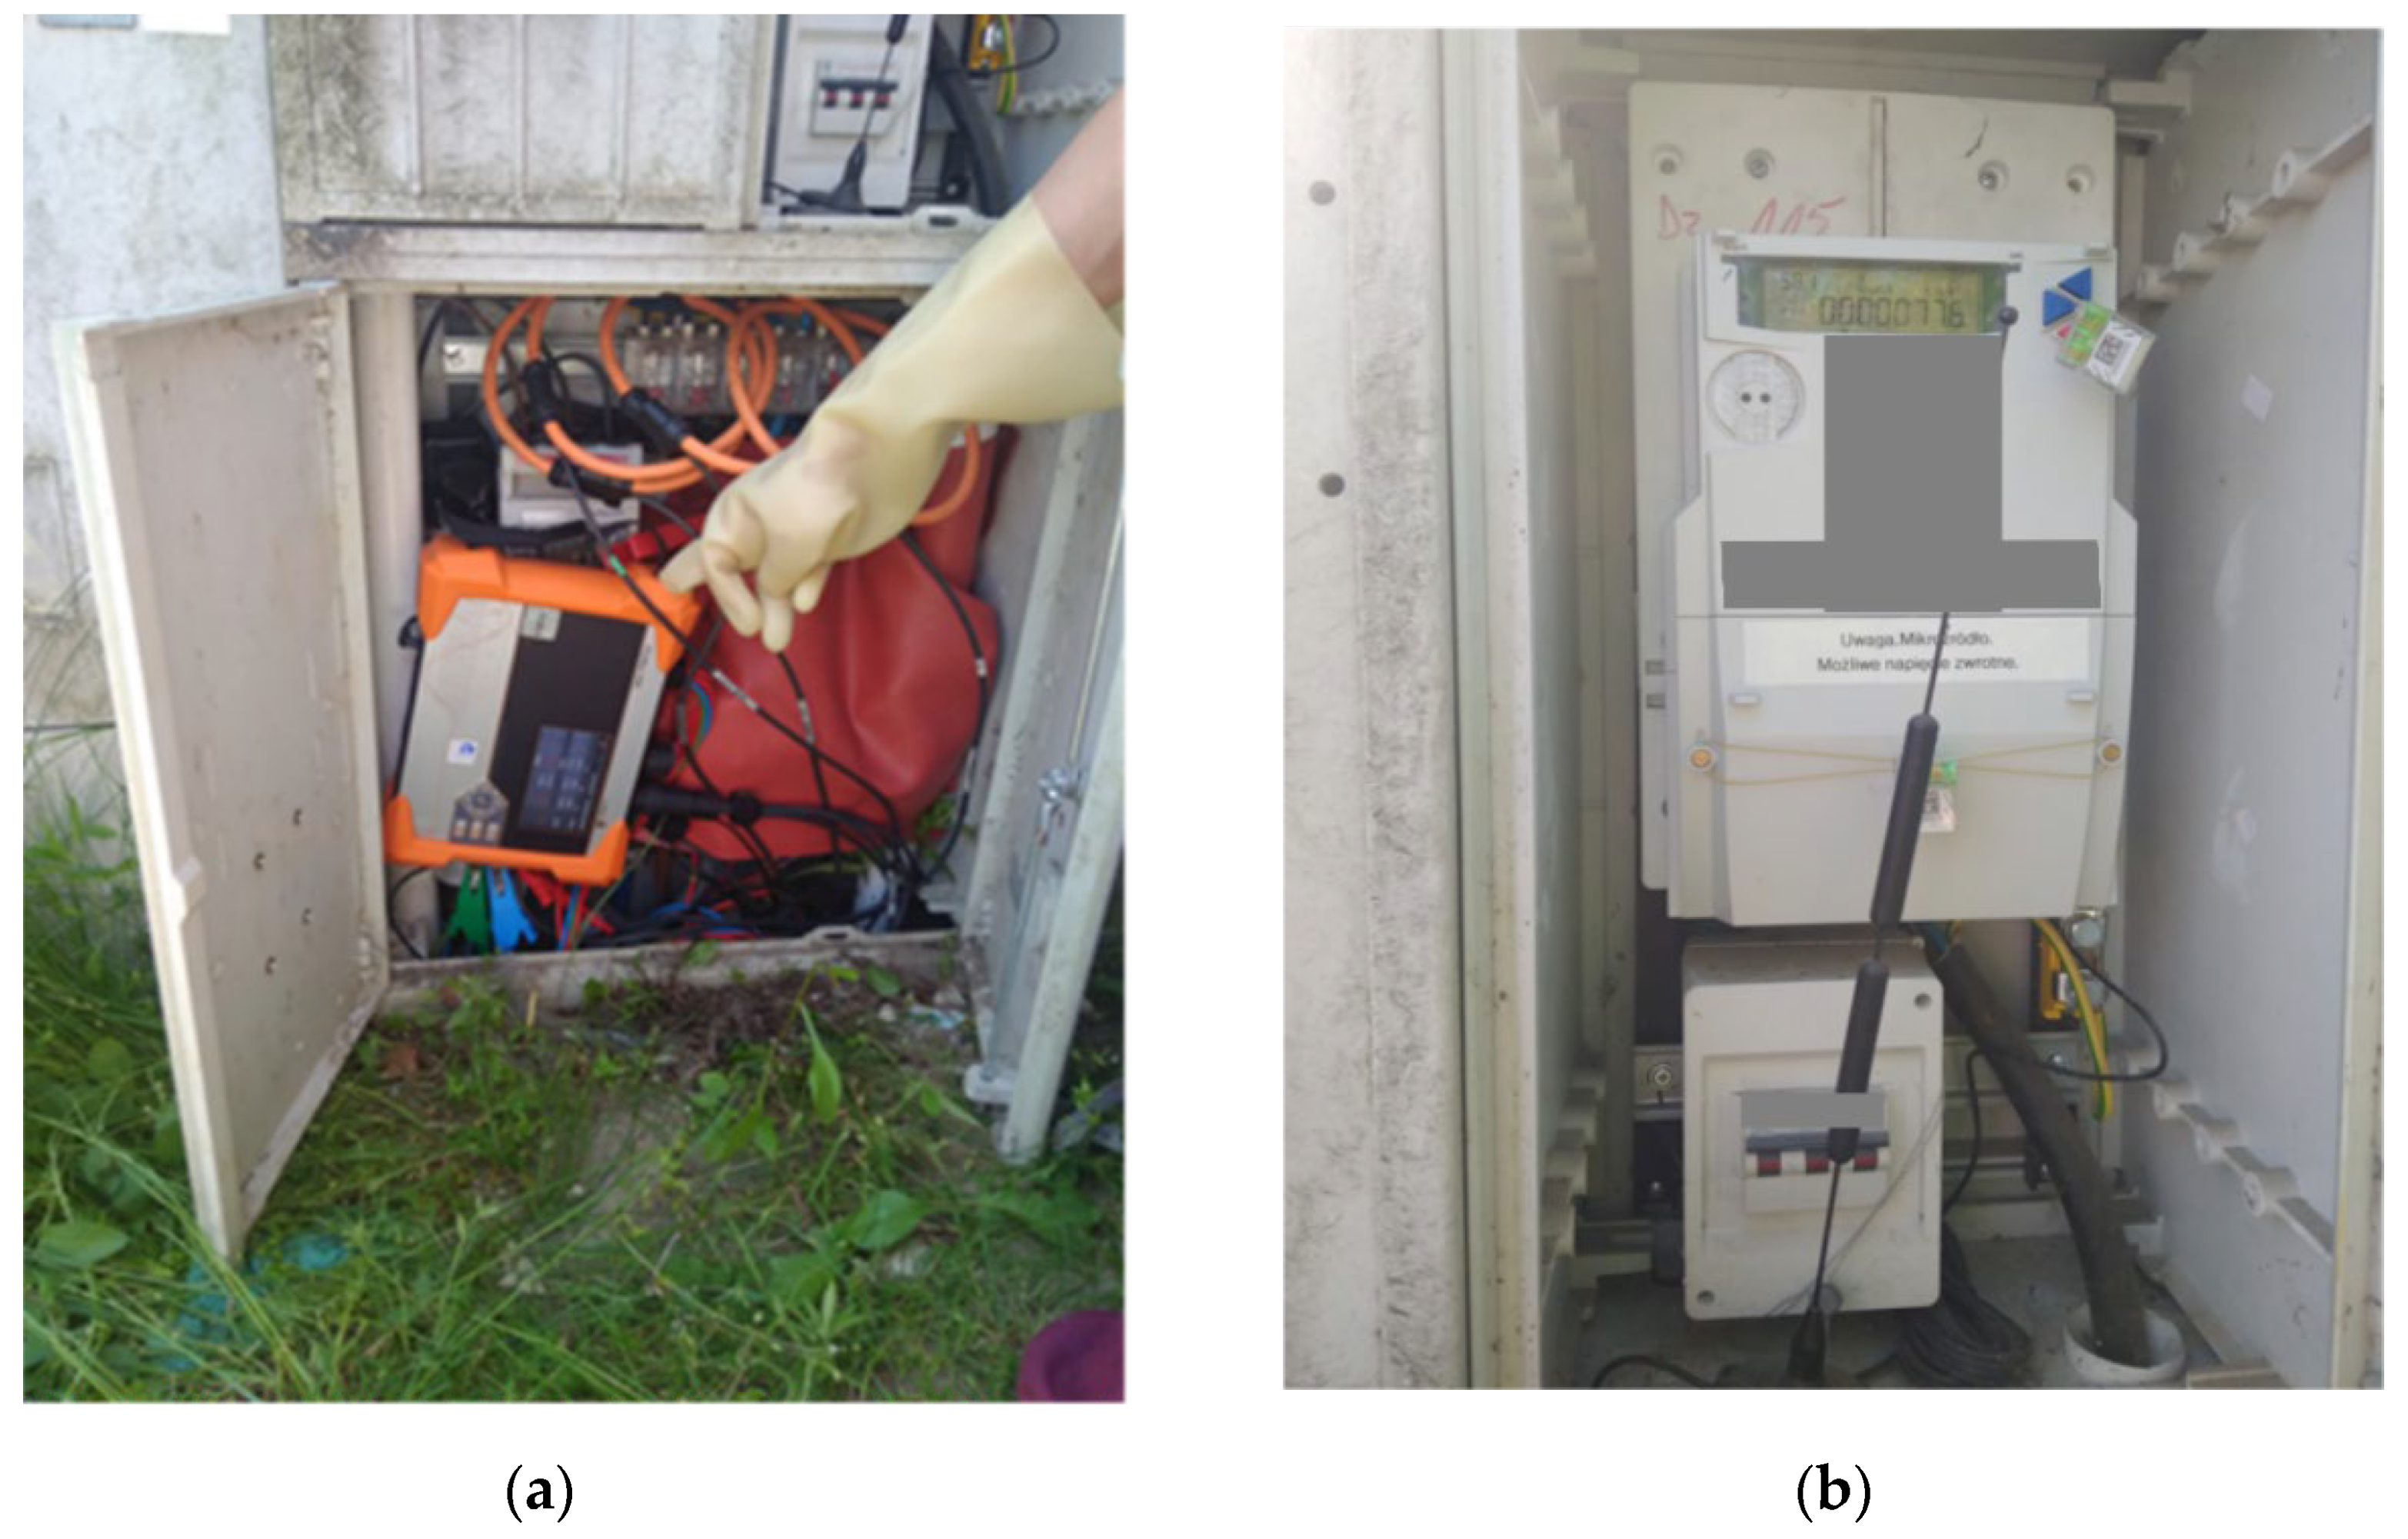
The analyses of the LV network, at the PCC behind electricity meter placed at the network side, were taken. Figure 2 illustrates the PCC. The measurements were performed with the PQ–BOX 200 (A. Eberle GmbH & Co. KG, Nürnberg, Germany) meter during 7 days in June.
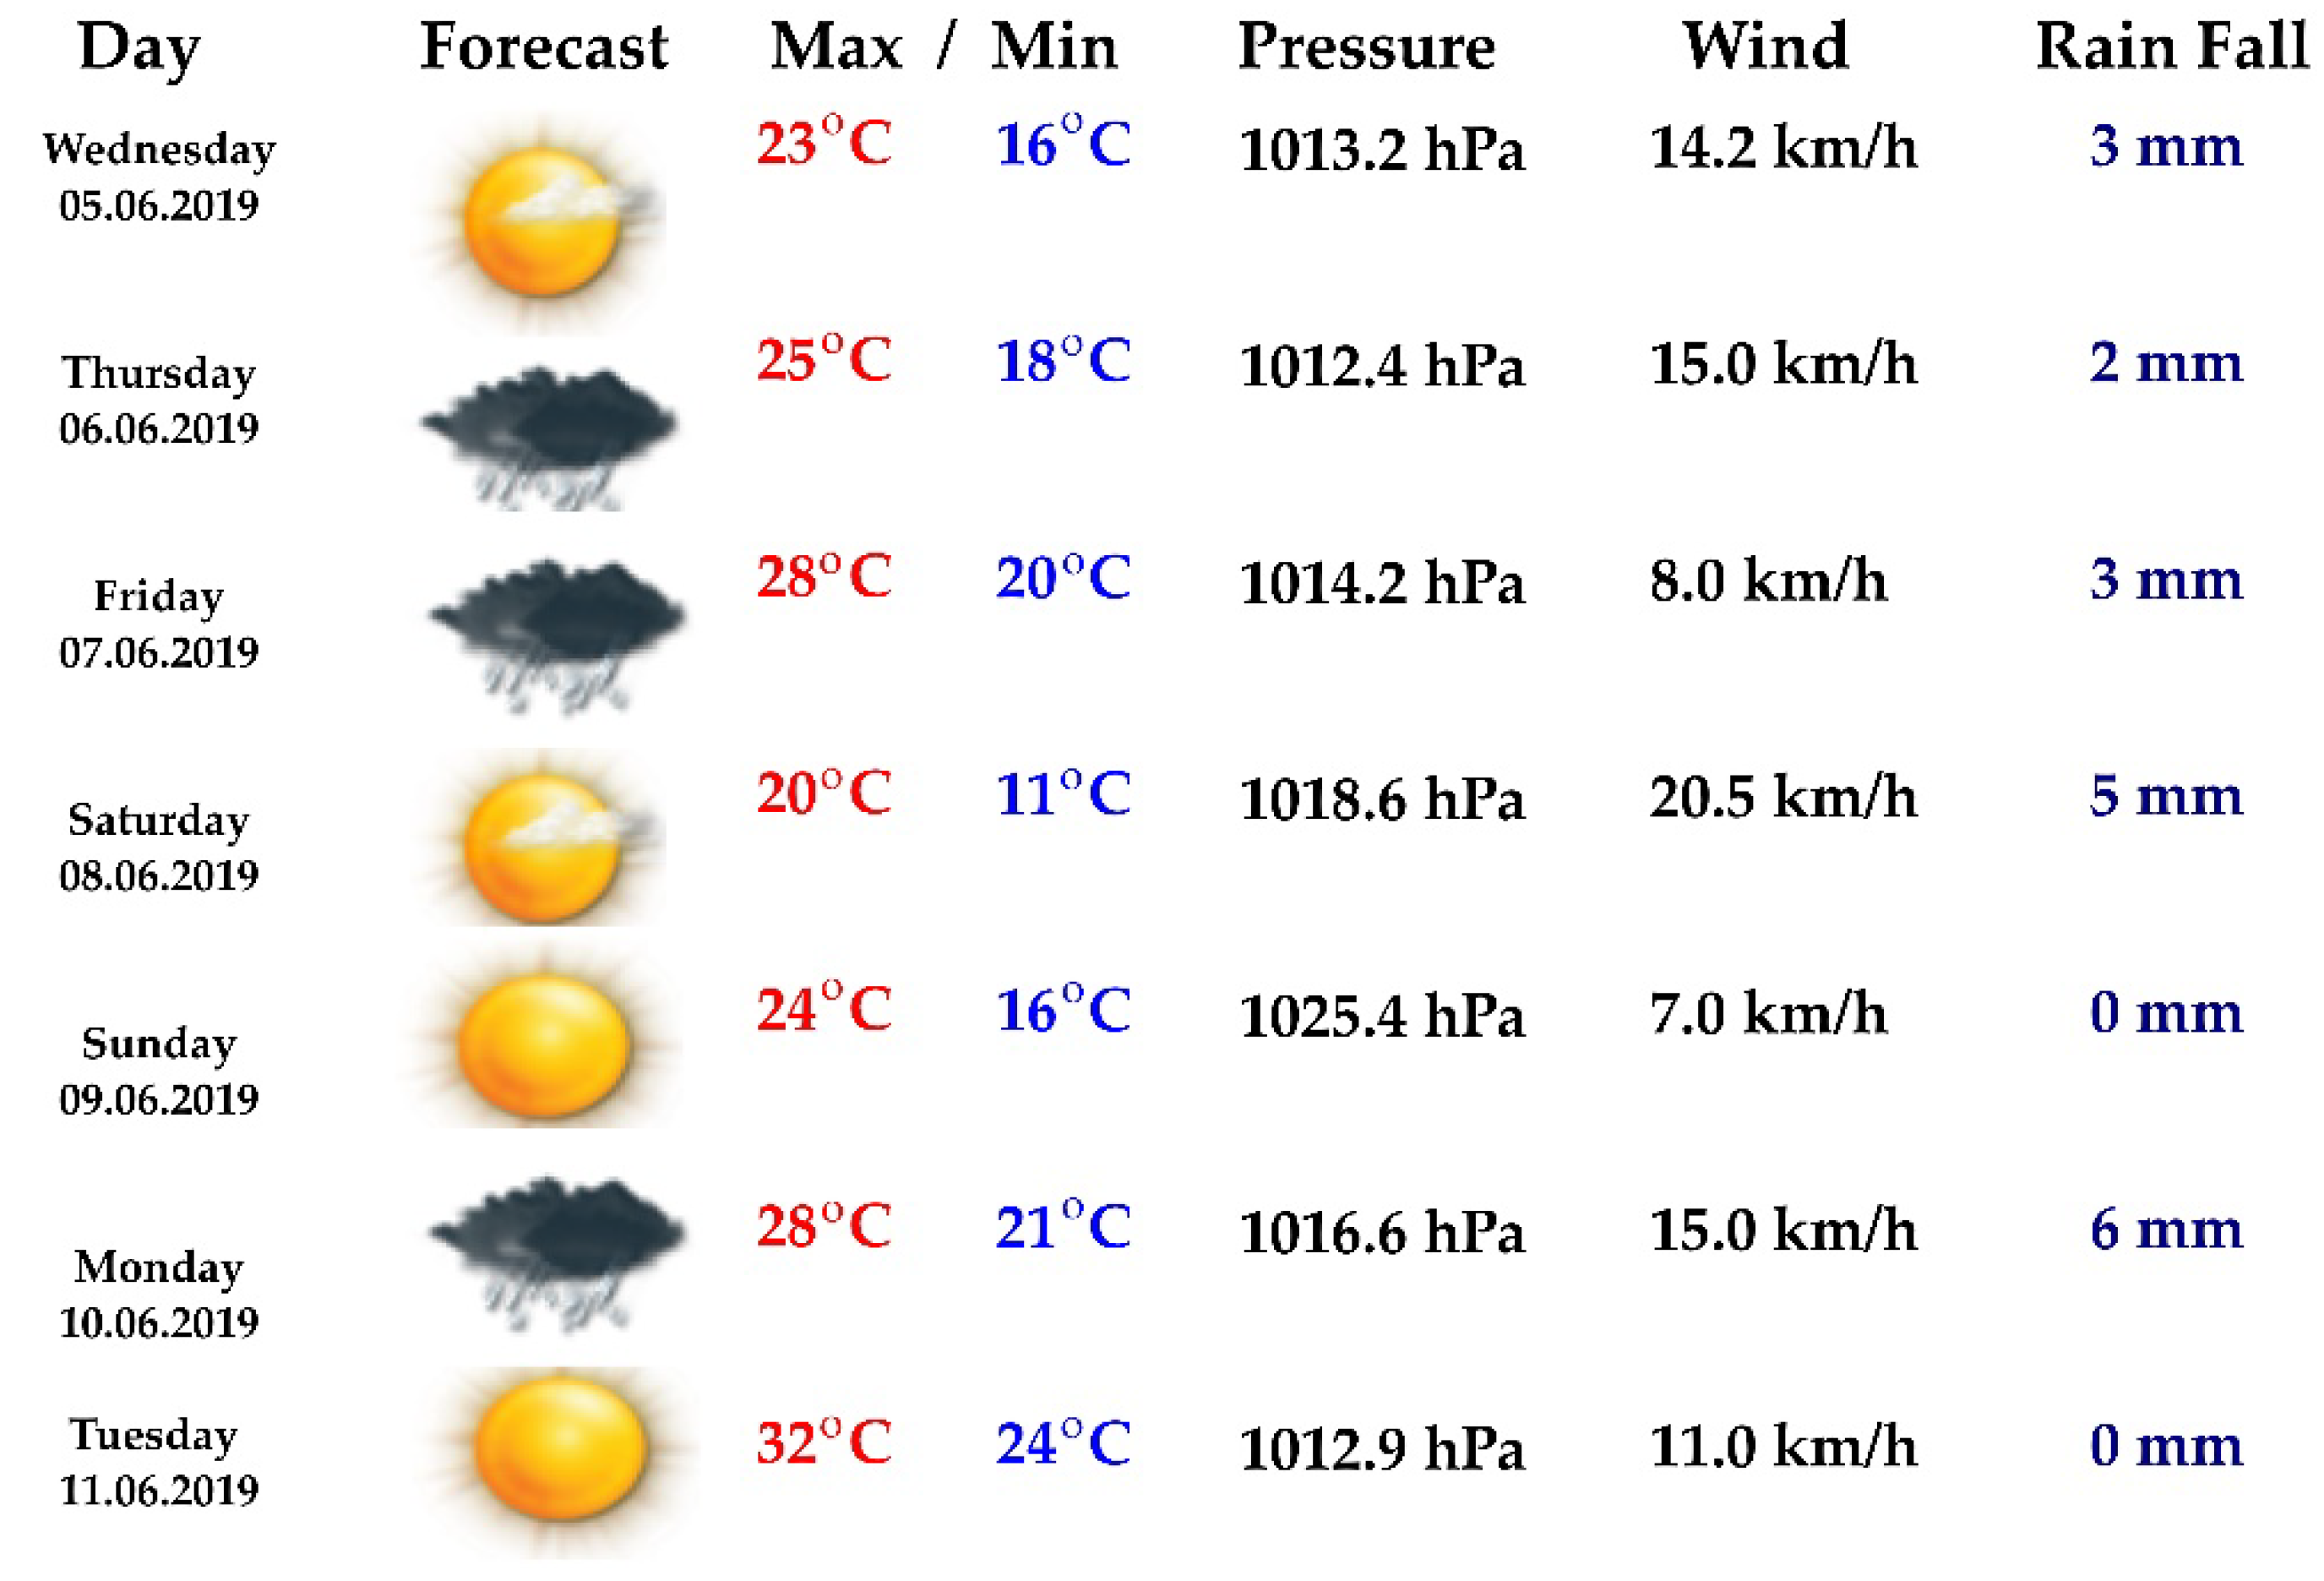
Figure 3 shows the atmospheric conditions at the site during measurements. Tests were performed in the area where problems with the quality of electricity and electromagnetic compatibility of the equipment connected to the mains were reported.
According to the user’s declarations, the facility had a 4.0 kWp photovoltaic installation consisting of 14 polycrystalline Selfa GA S.A (Poland) modules of the SV120P.5–295 type with a nominal power of 295 Wp. Compatible with the SUN2000L–3.68KTL inverter by HUAWEI (Union of Huawei Investment & Holding Co., Ltd., Shenzhen, PRC) characterized by:
  • Converter power 3.68 kW;
  • Rated supply voltage 160–480 V (DC);
  • Output voltage 230 V (AC);
  • Rated input current 11 A;
  • Maximum output current 16 A;
  • Rated operating frequency 50/60 Hz;
  • The photovoltaic installation was put into operation in April 2019.
During the measurements, the quality of the supplied electricity was monitored in accordance with the recommendations as per EN 50160 standard.

3. Measurements

The measurements proved that there were problems with the quality of the supplied energy in the considered network during the period of measurements, which included 7 days and 22 h. Table 1 presents the basic low-frequency voltage parameters for the entire measurement period according to EN 50160.
Table 2 shows the recorded incidents (duration wise) without distinguishing into individual phases, where U stands for nominal voltage 230 V.
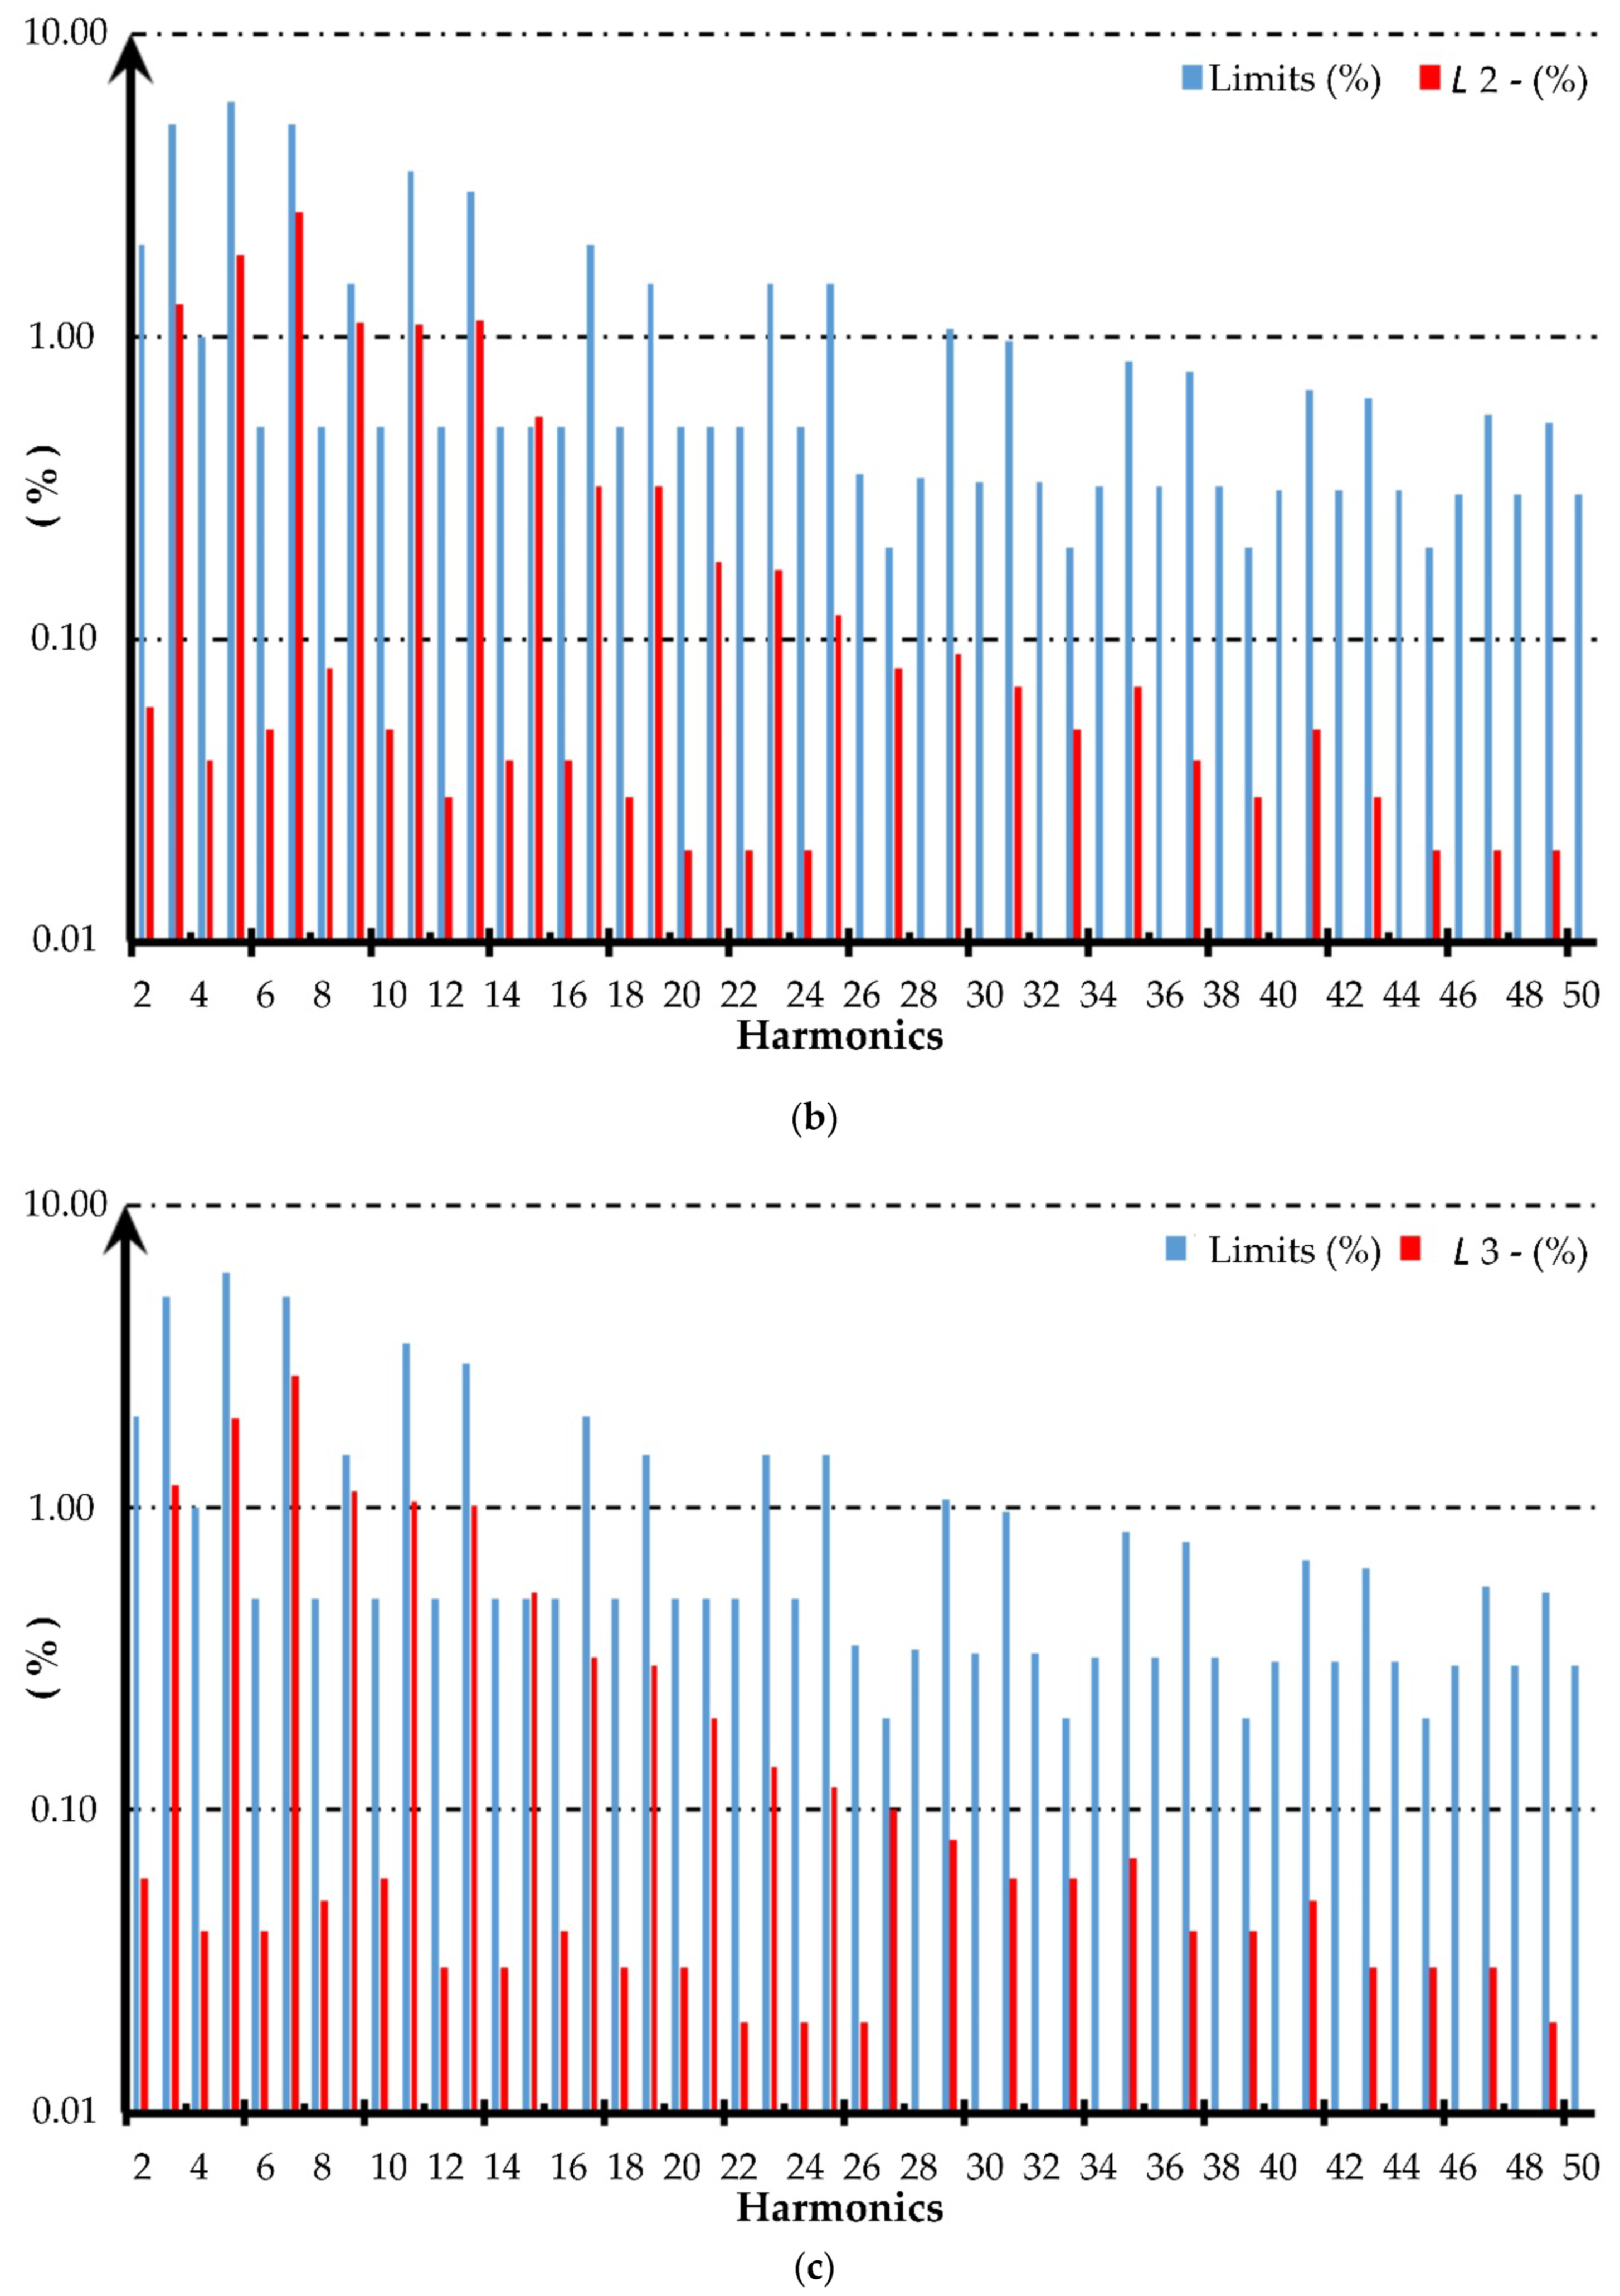
Figure 4 represents the distribution of harmonics in individual phases L 1, L 2, L 3 during the measurement period, where the x axis represents harmonics, while y axis percentage share of a given harmonics. The measured values are marked in red, the permissible limits of individual harmonics are shown in light blue.
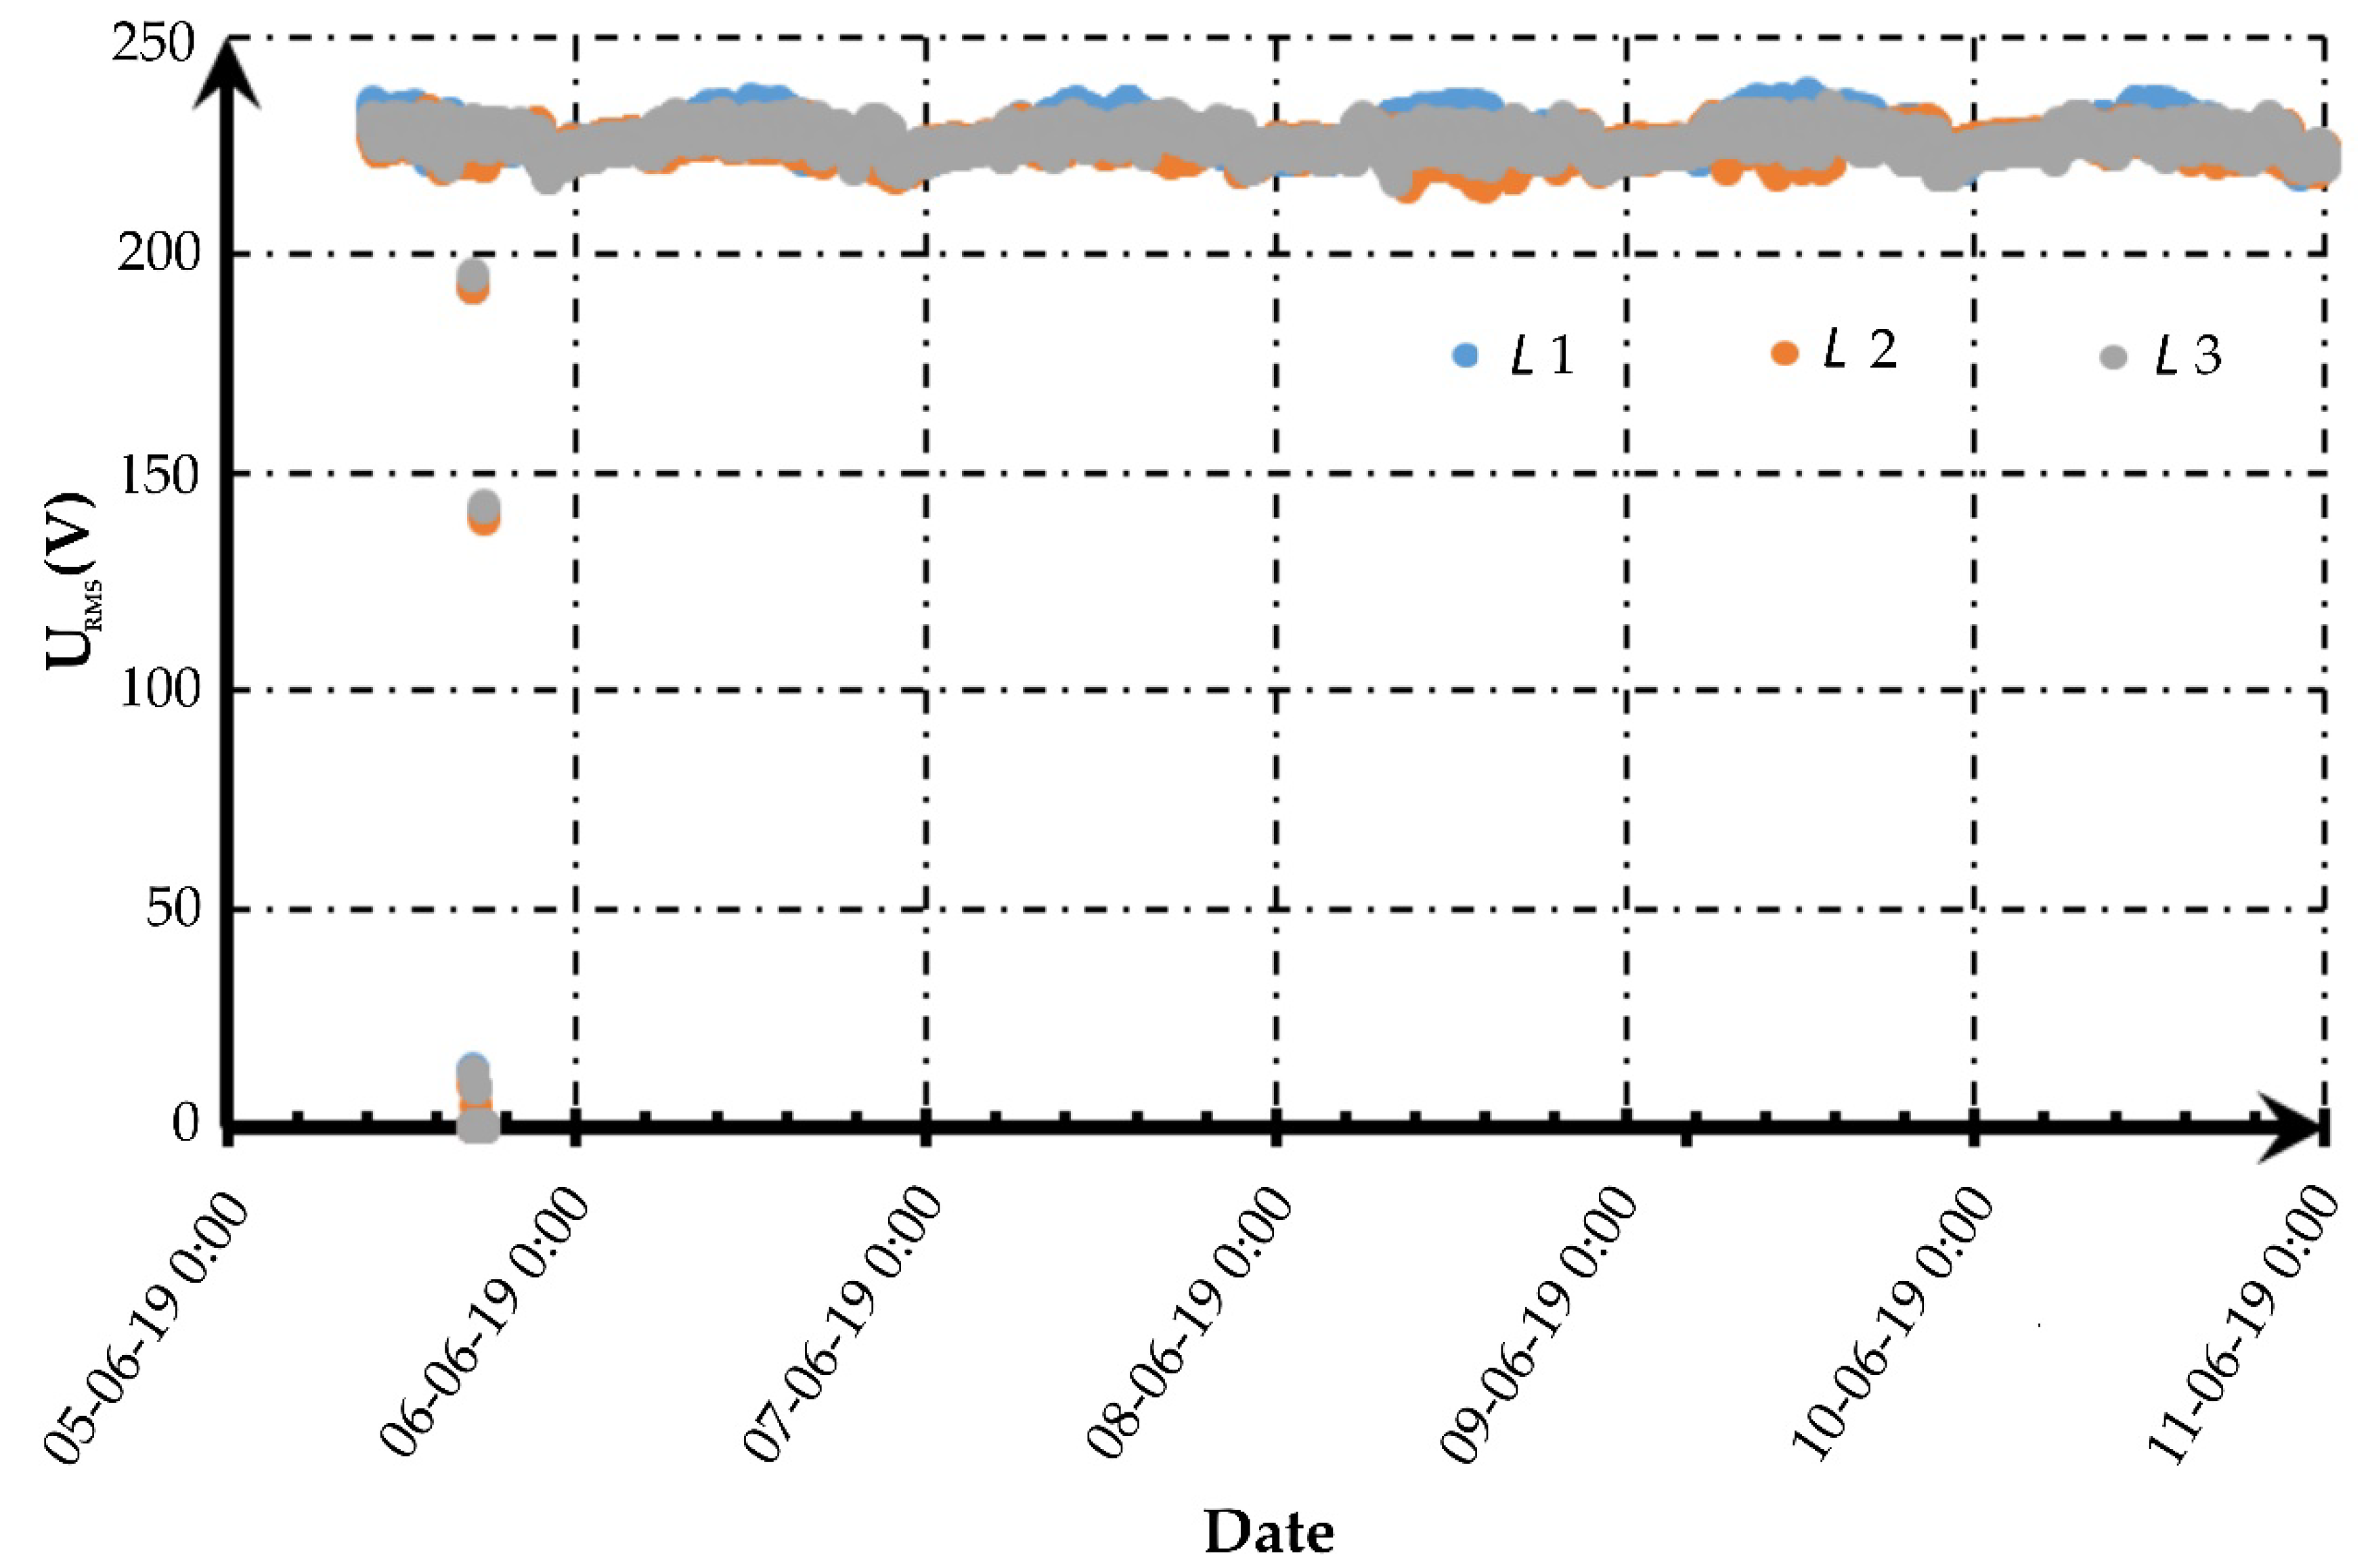
Figure 5 shows the changes in the RMS voltage during the measurements.
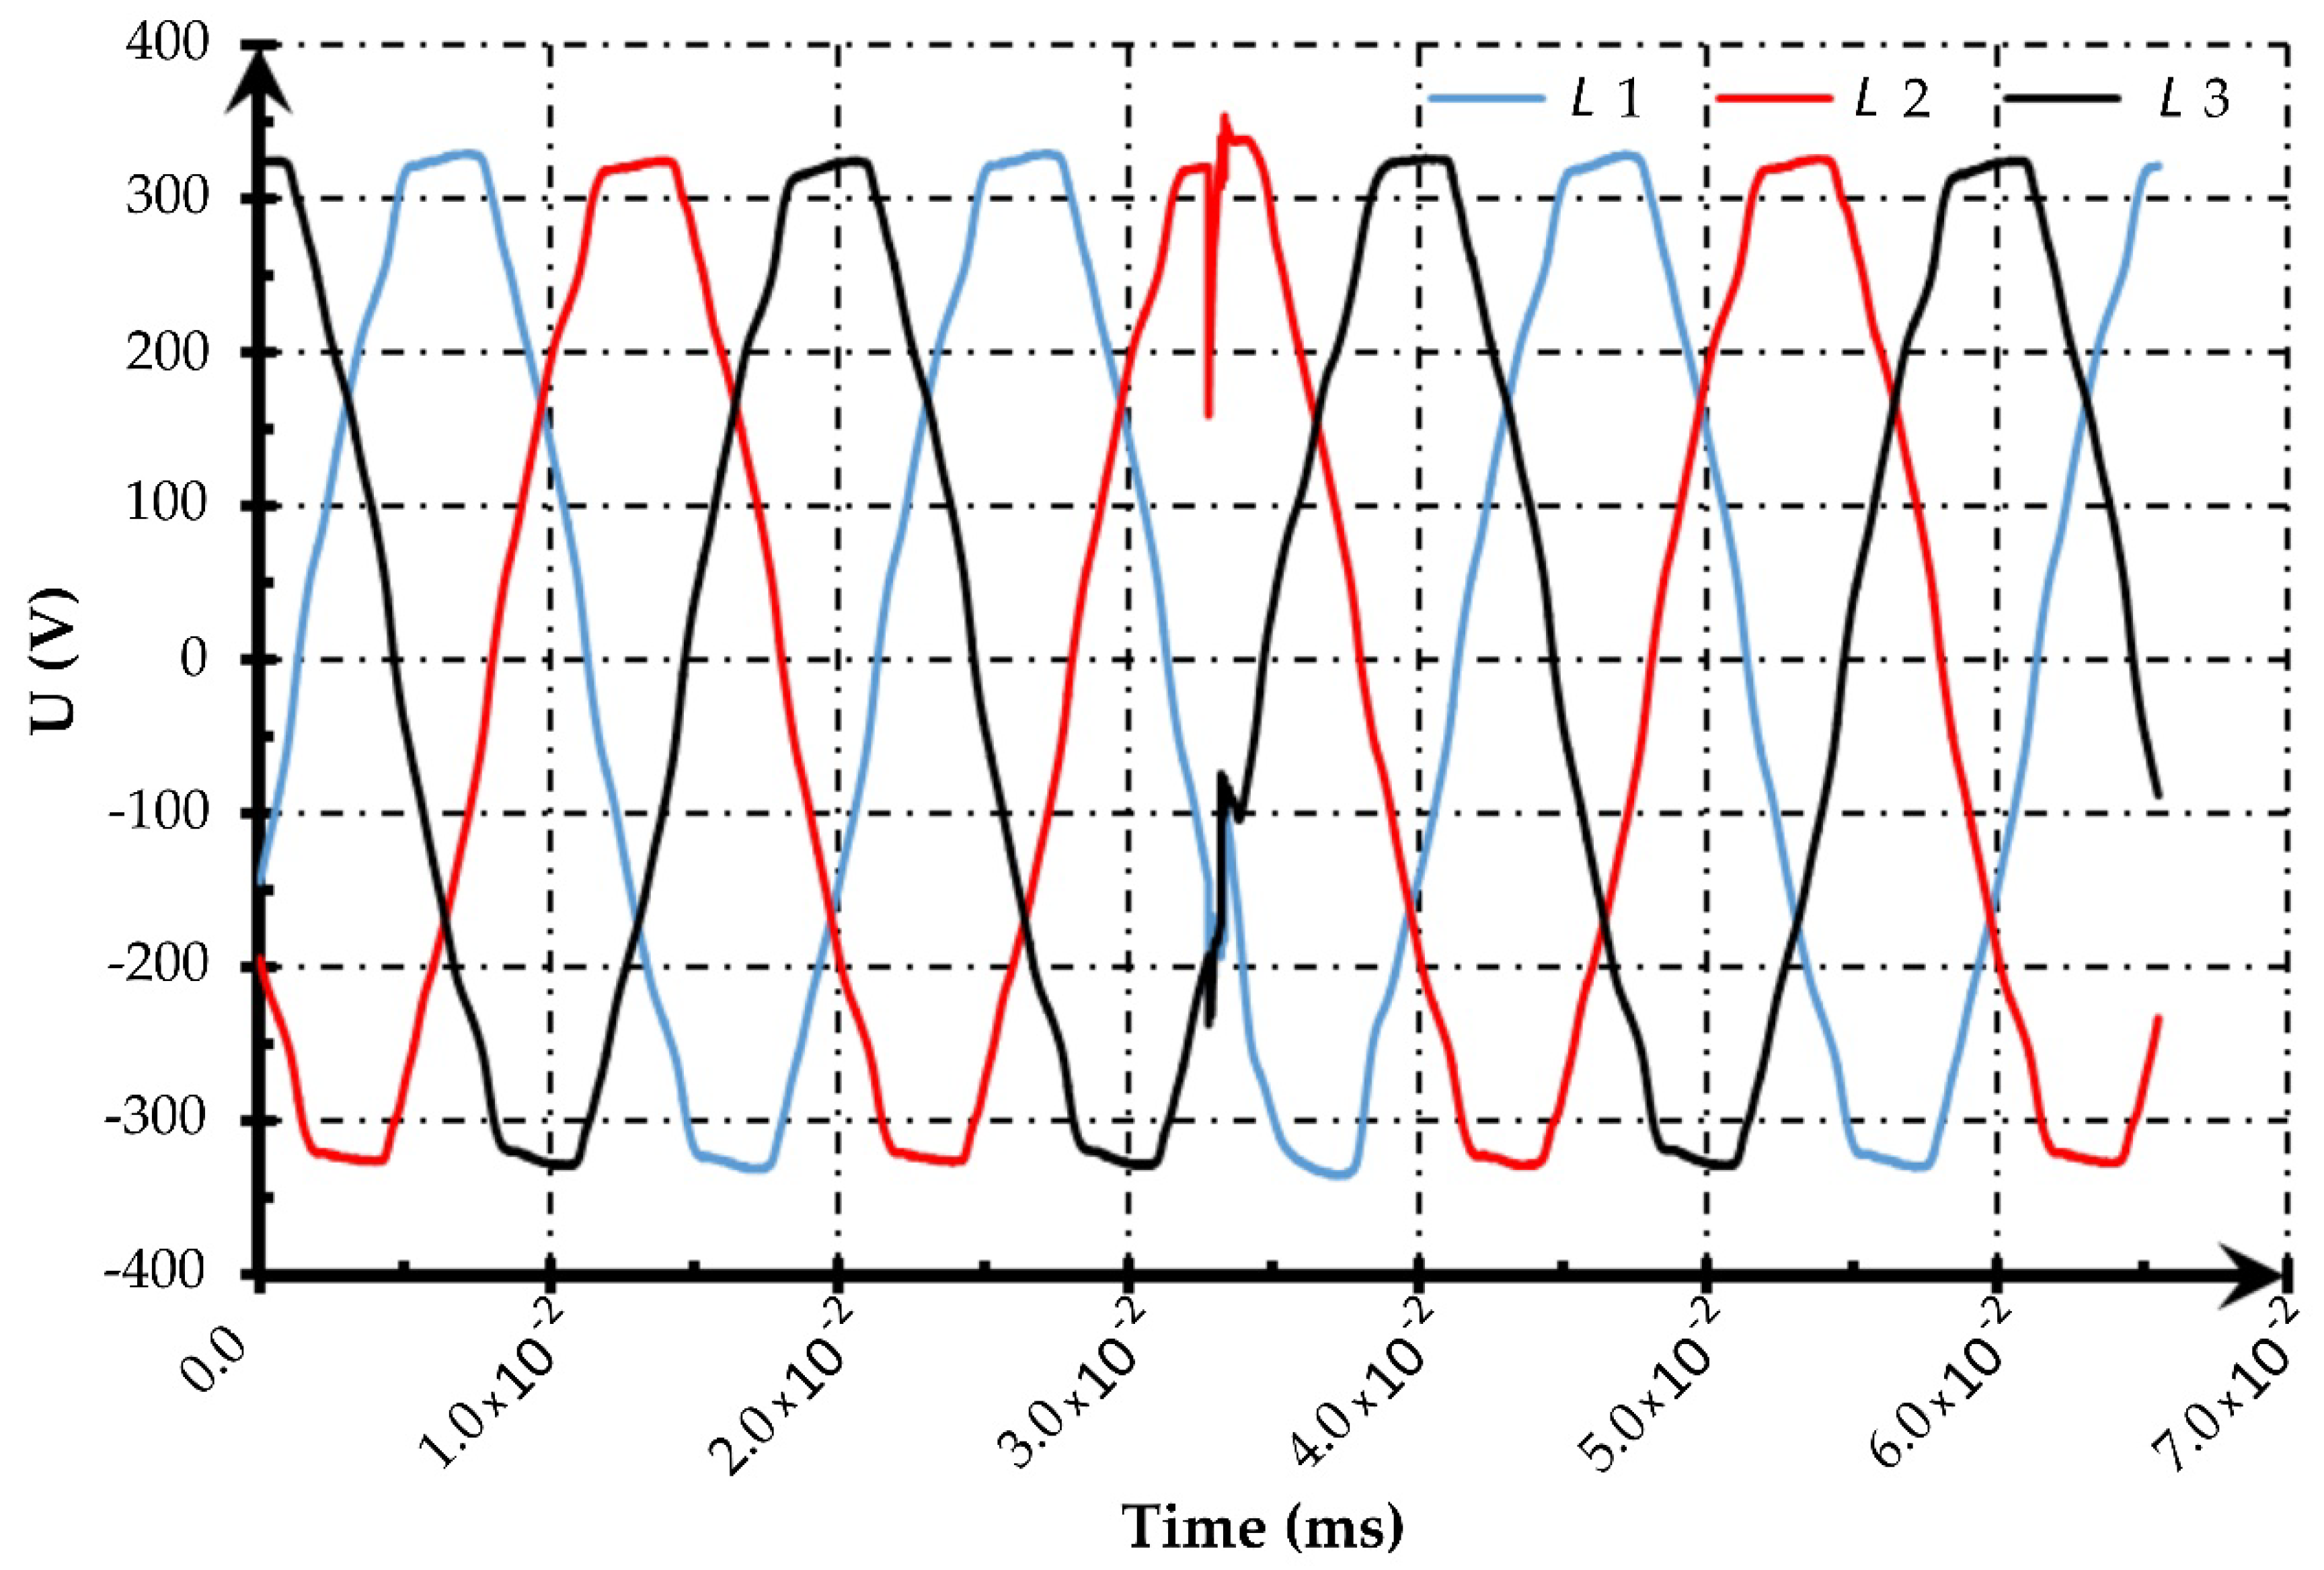
Figure 6 and Figure 7 illustrate typical rapid changes in the instantaneous voltage U (t) resulting from voltage commutation collapses that were recorded in the phase waveforms.
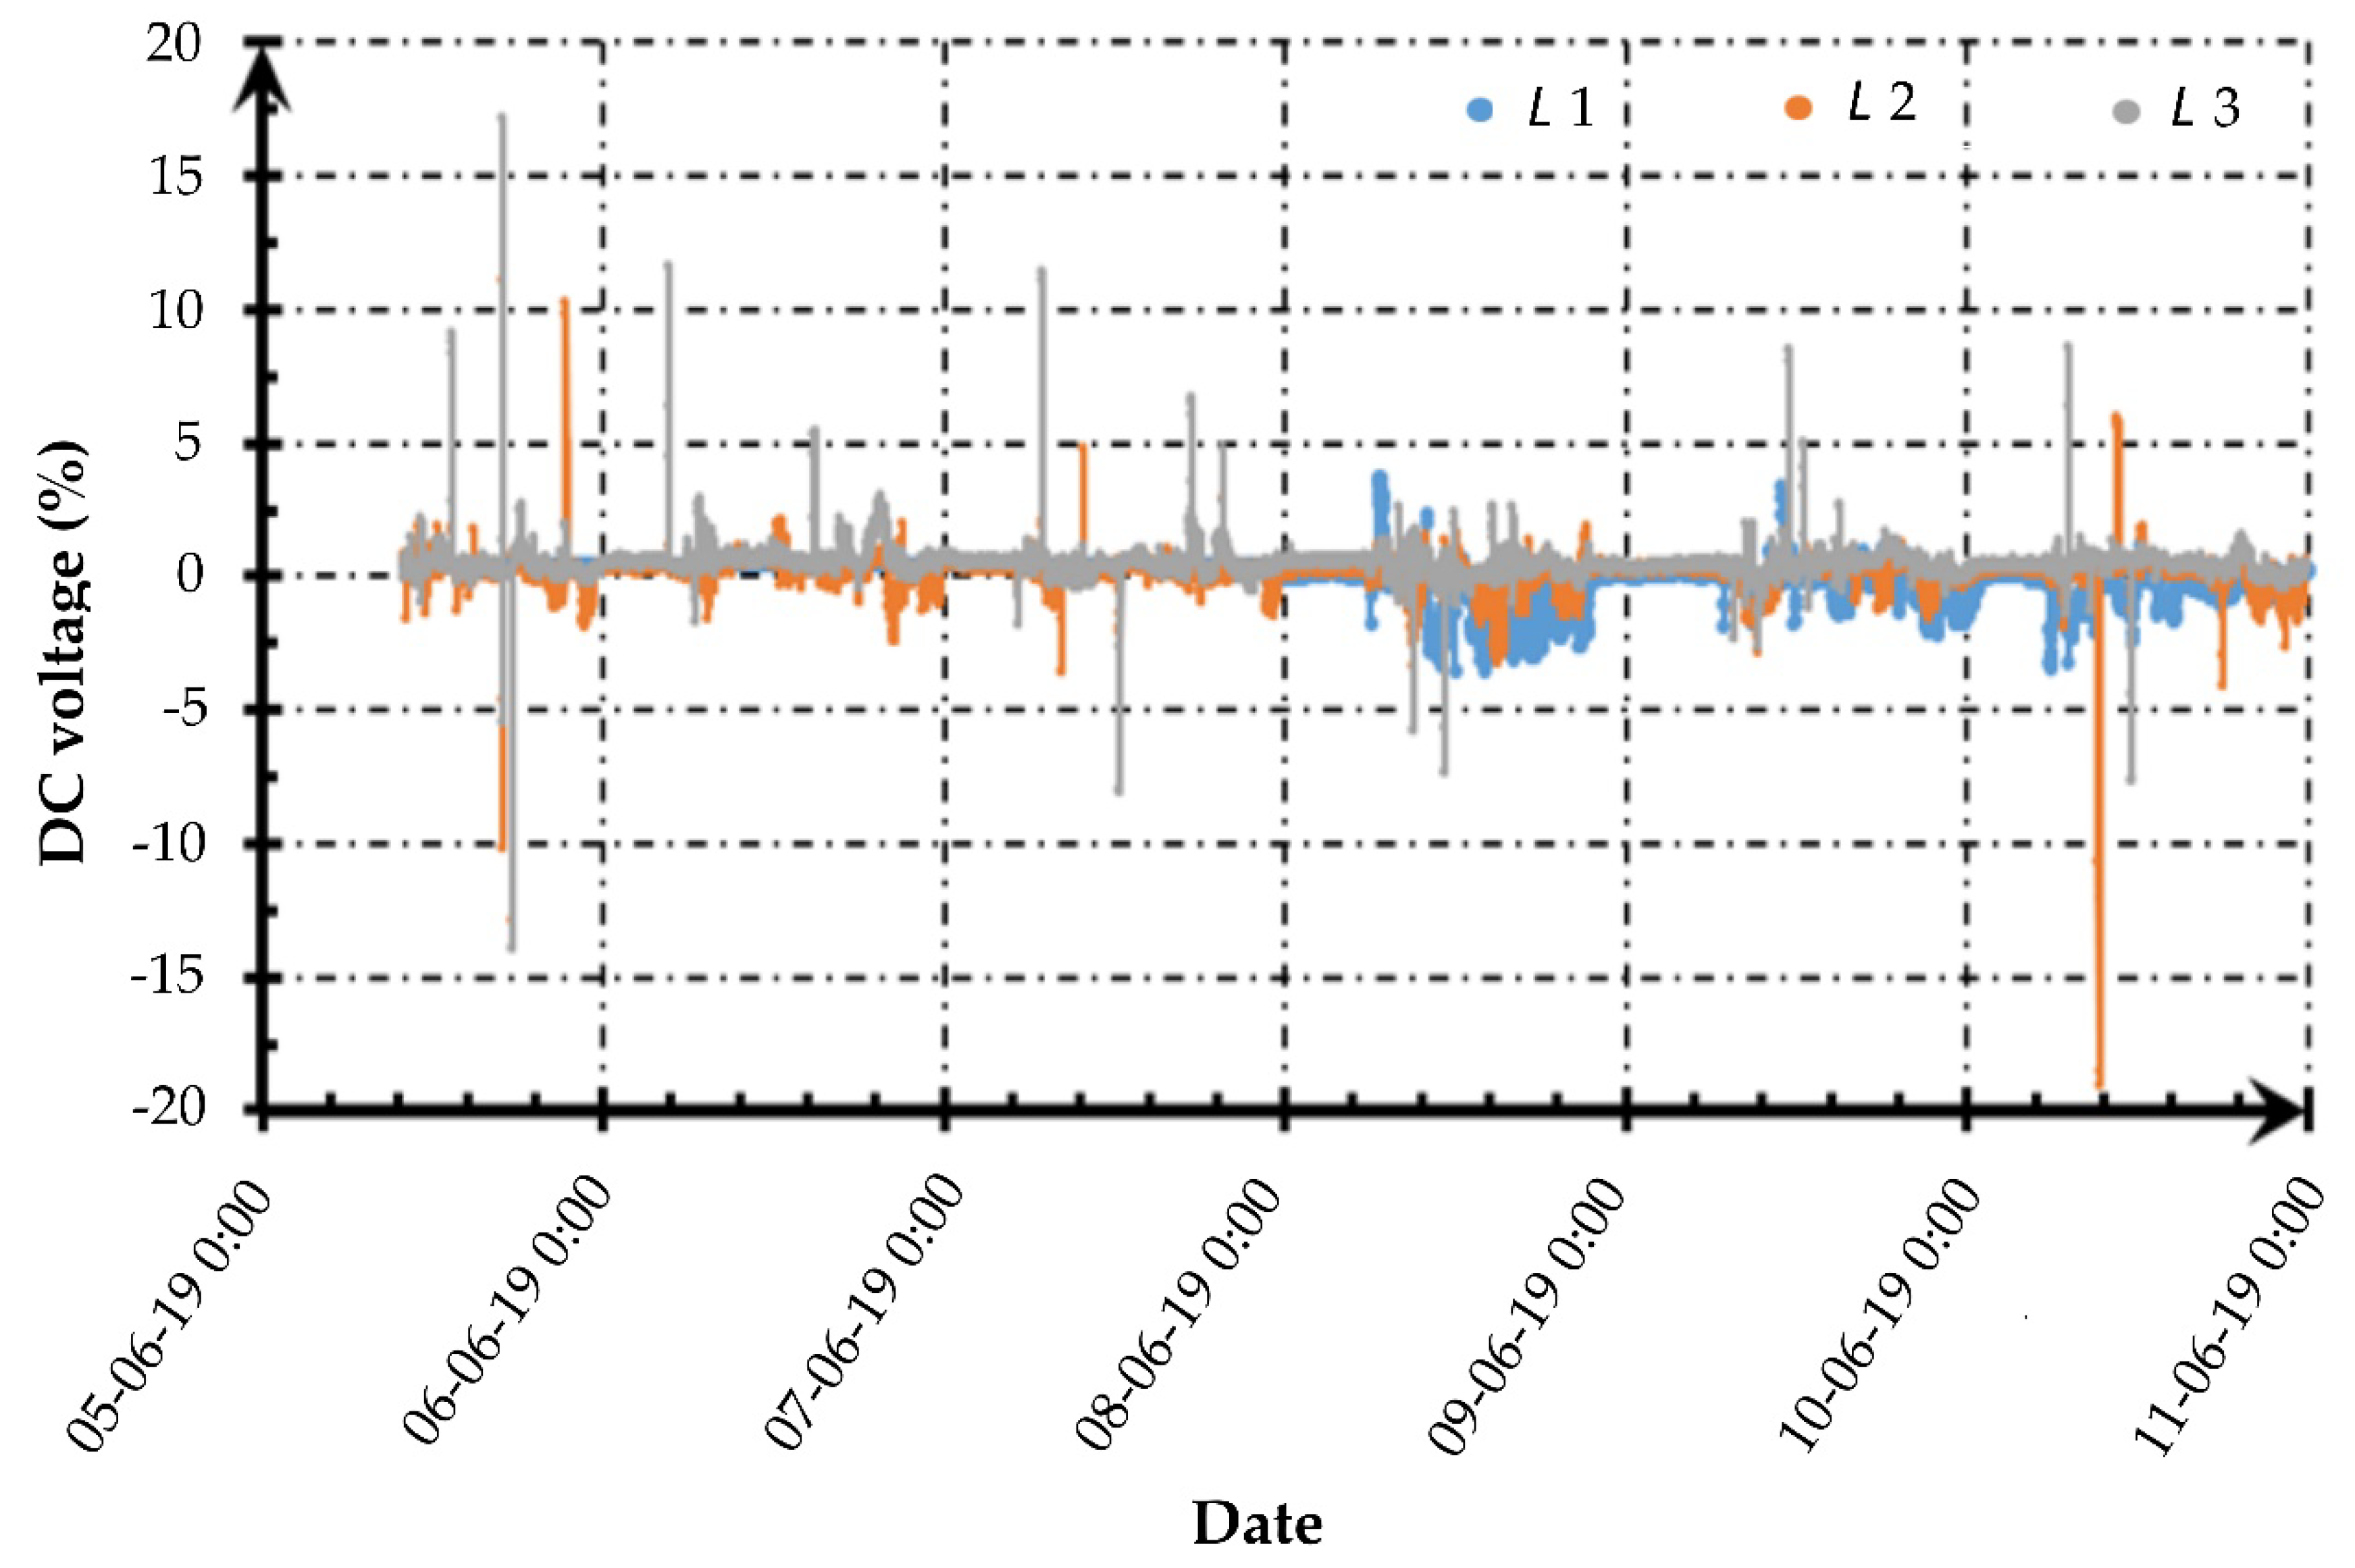
There was also a constant component (UDC) in the measured voltage waveforms, which is presented in Figure 8, where DC voltage is presented as the percentage of rated voltage −230 V.
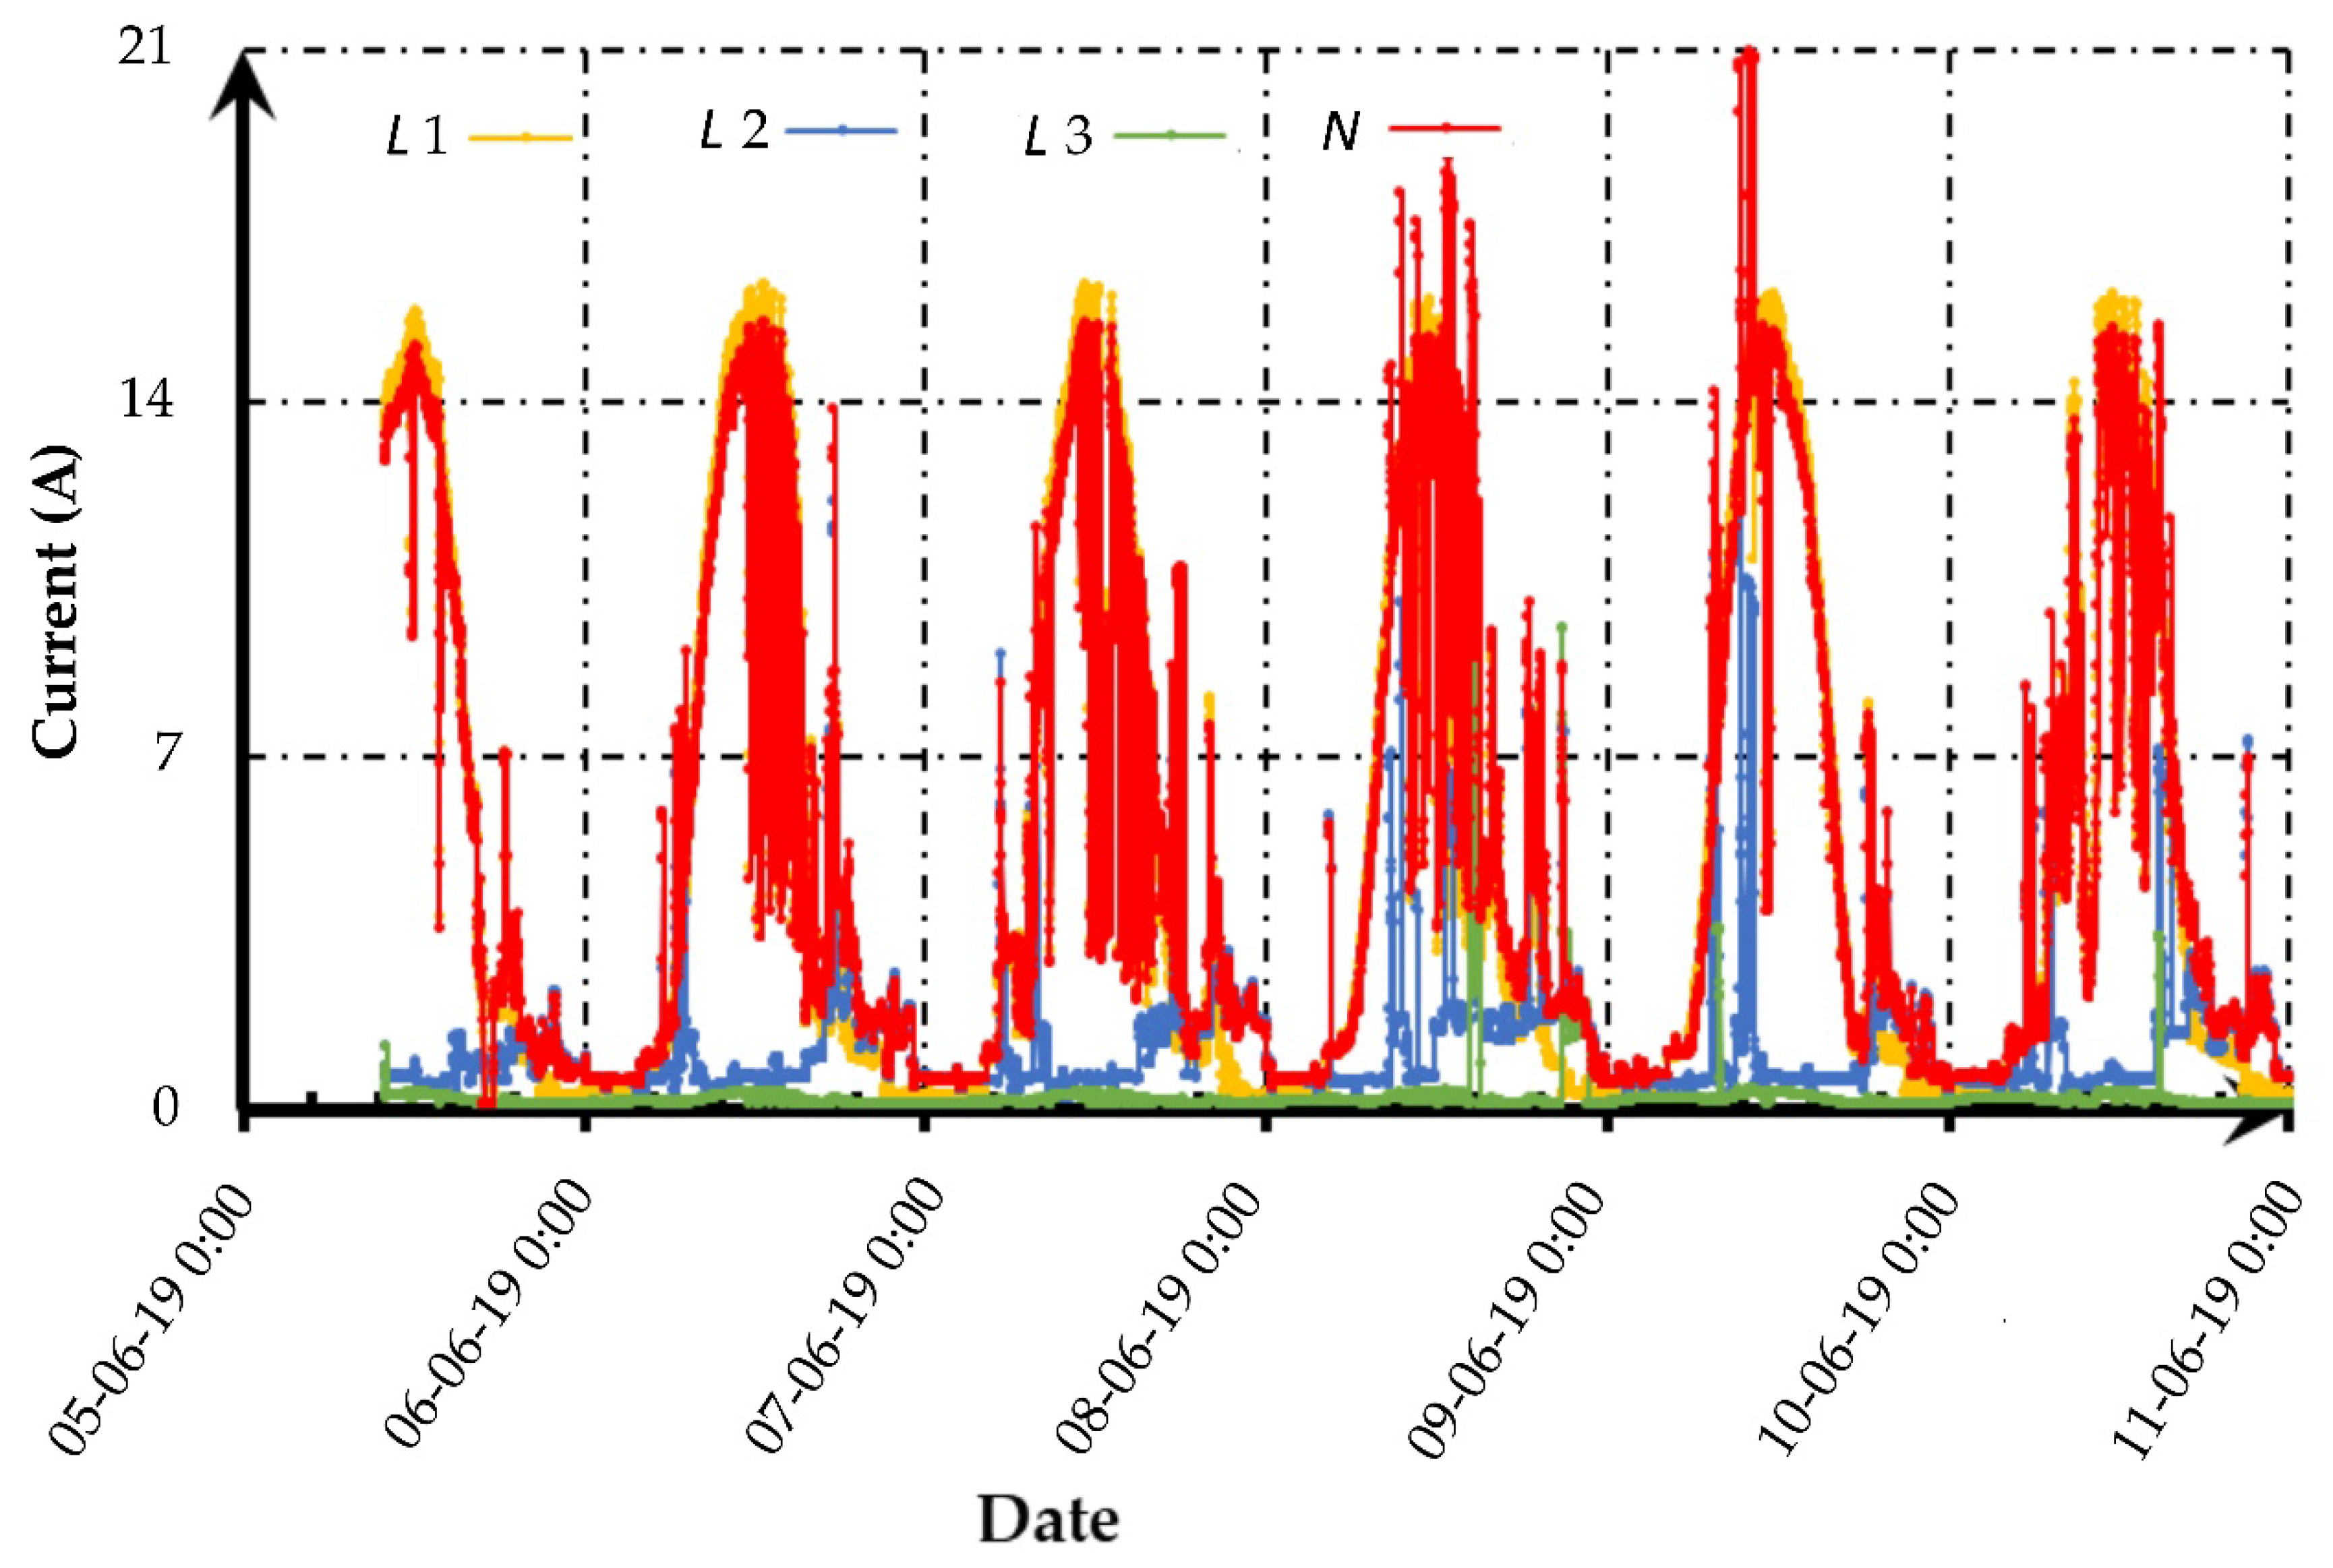
Figure 9 shows the measurement of the currents in the individual phases.
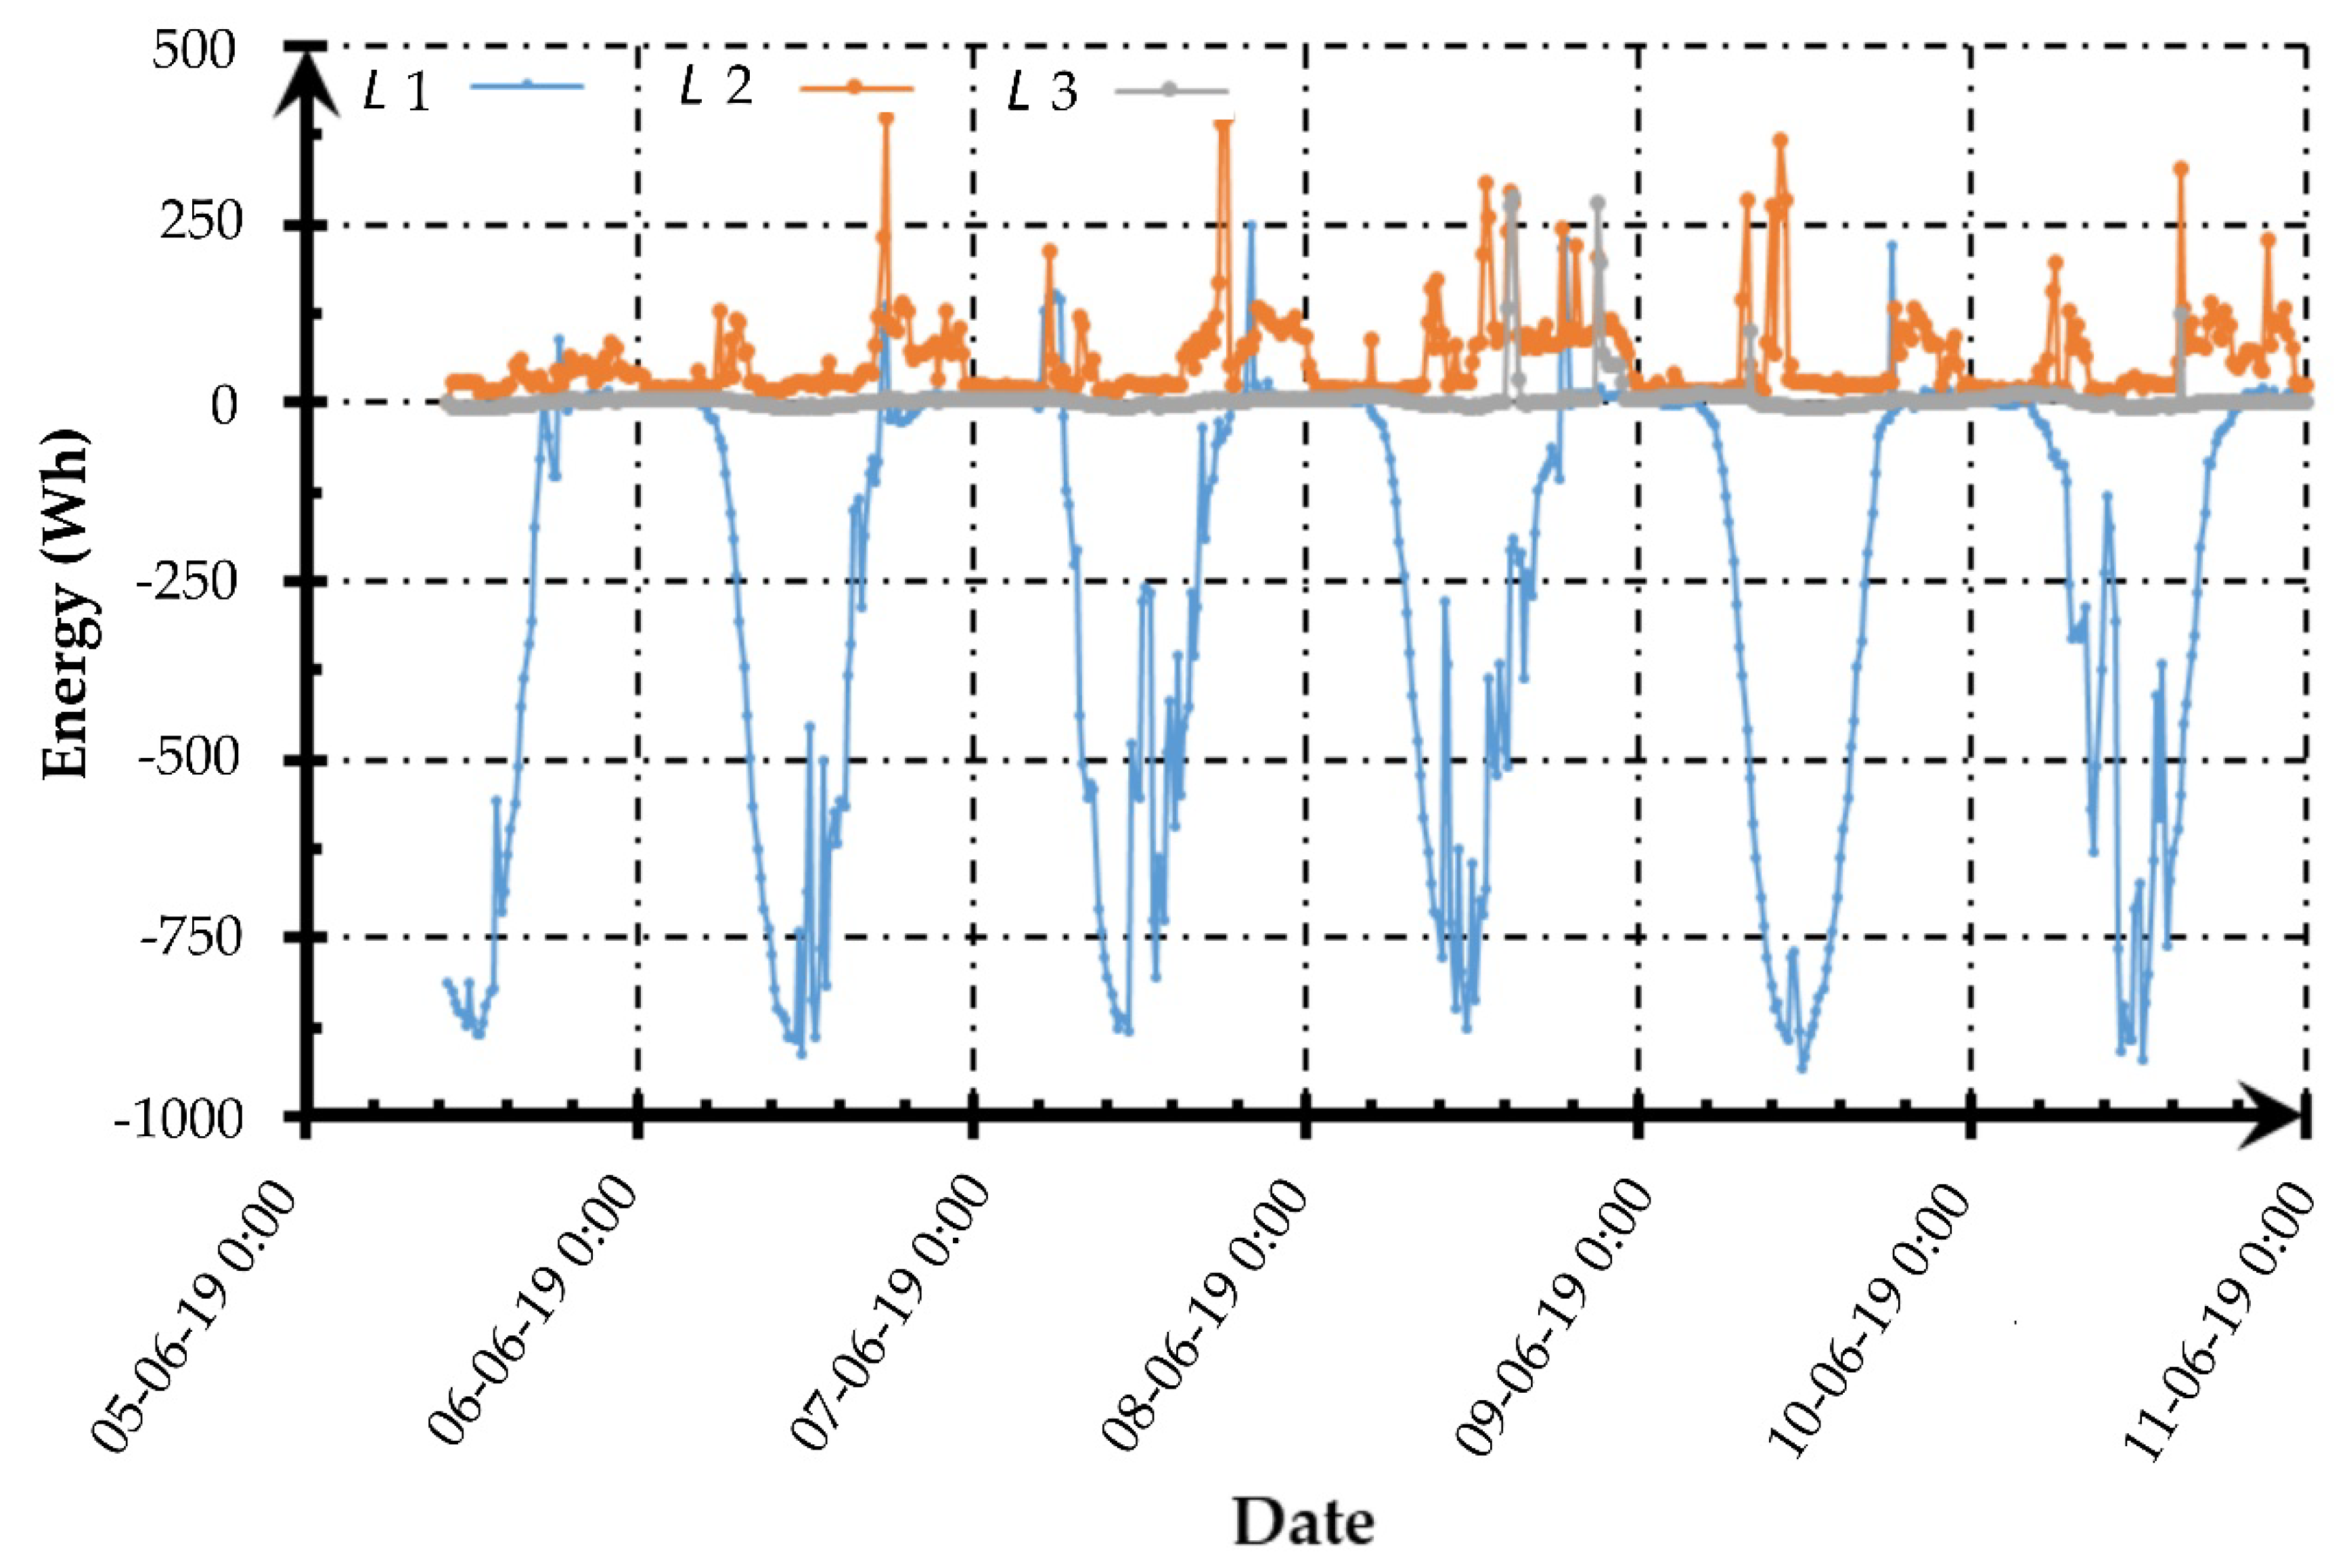
The analyzed energy flows indicate a significant disproportion between individual phases, which can be seen particularly in Figure 10, showing energy flows in the facility in individual phases.

4. Evaluation of Selected Objects

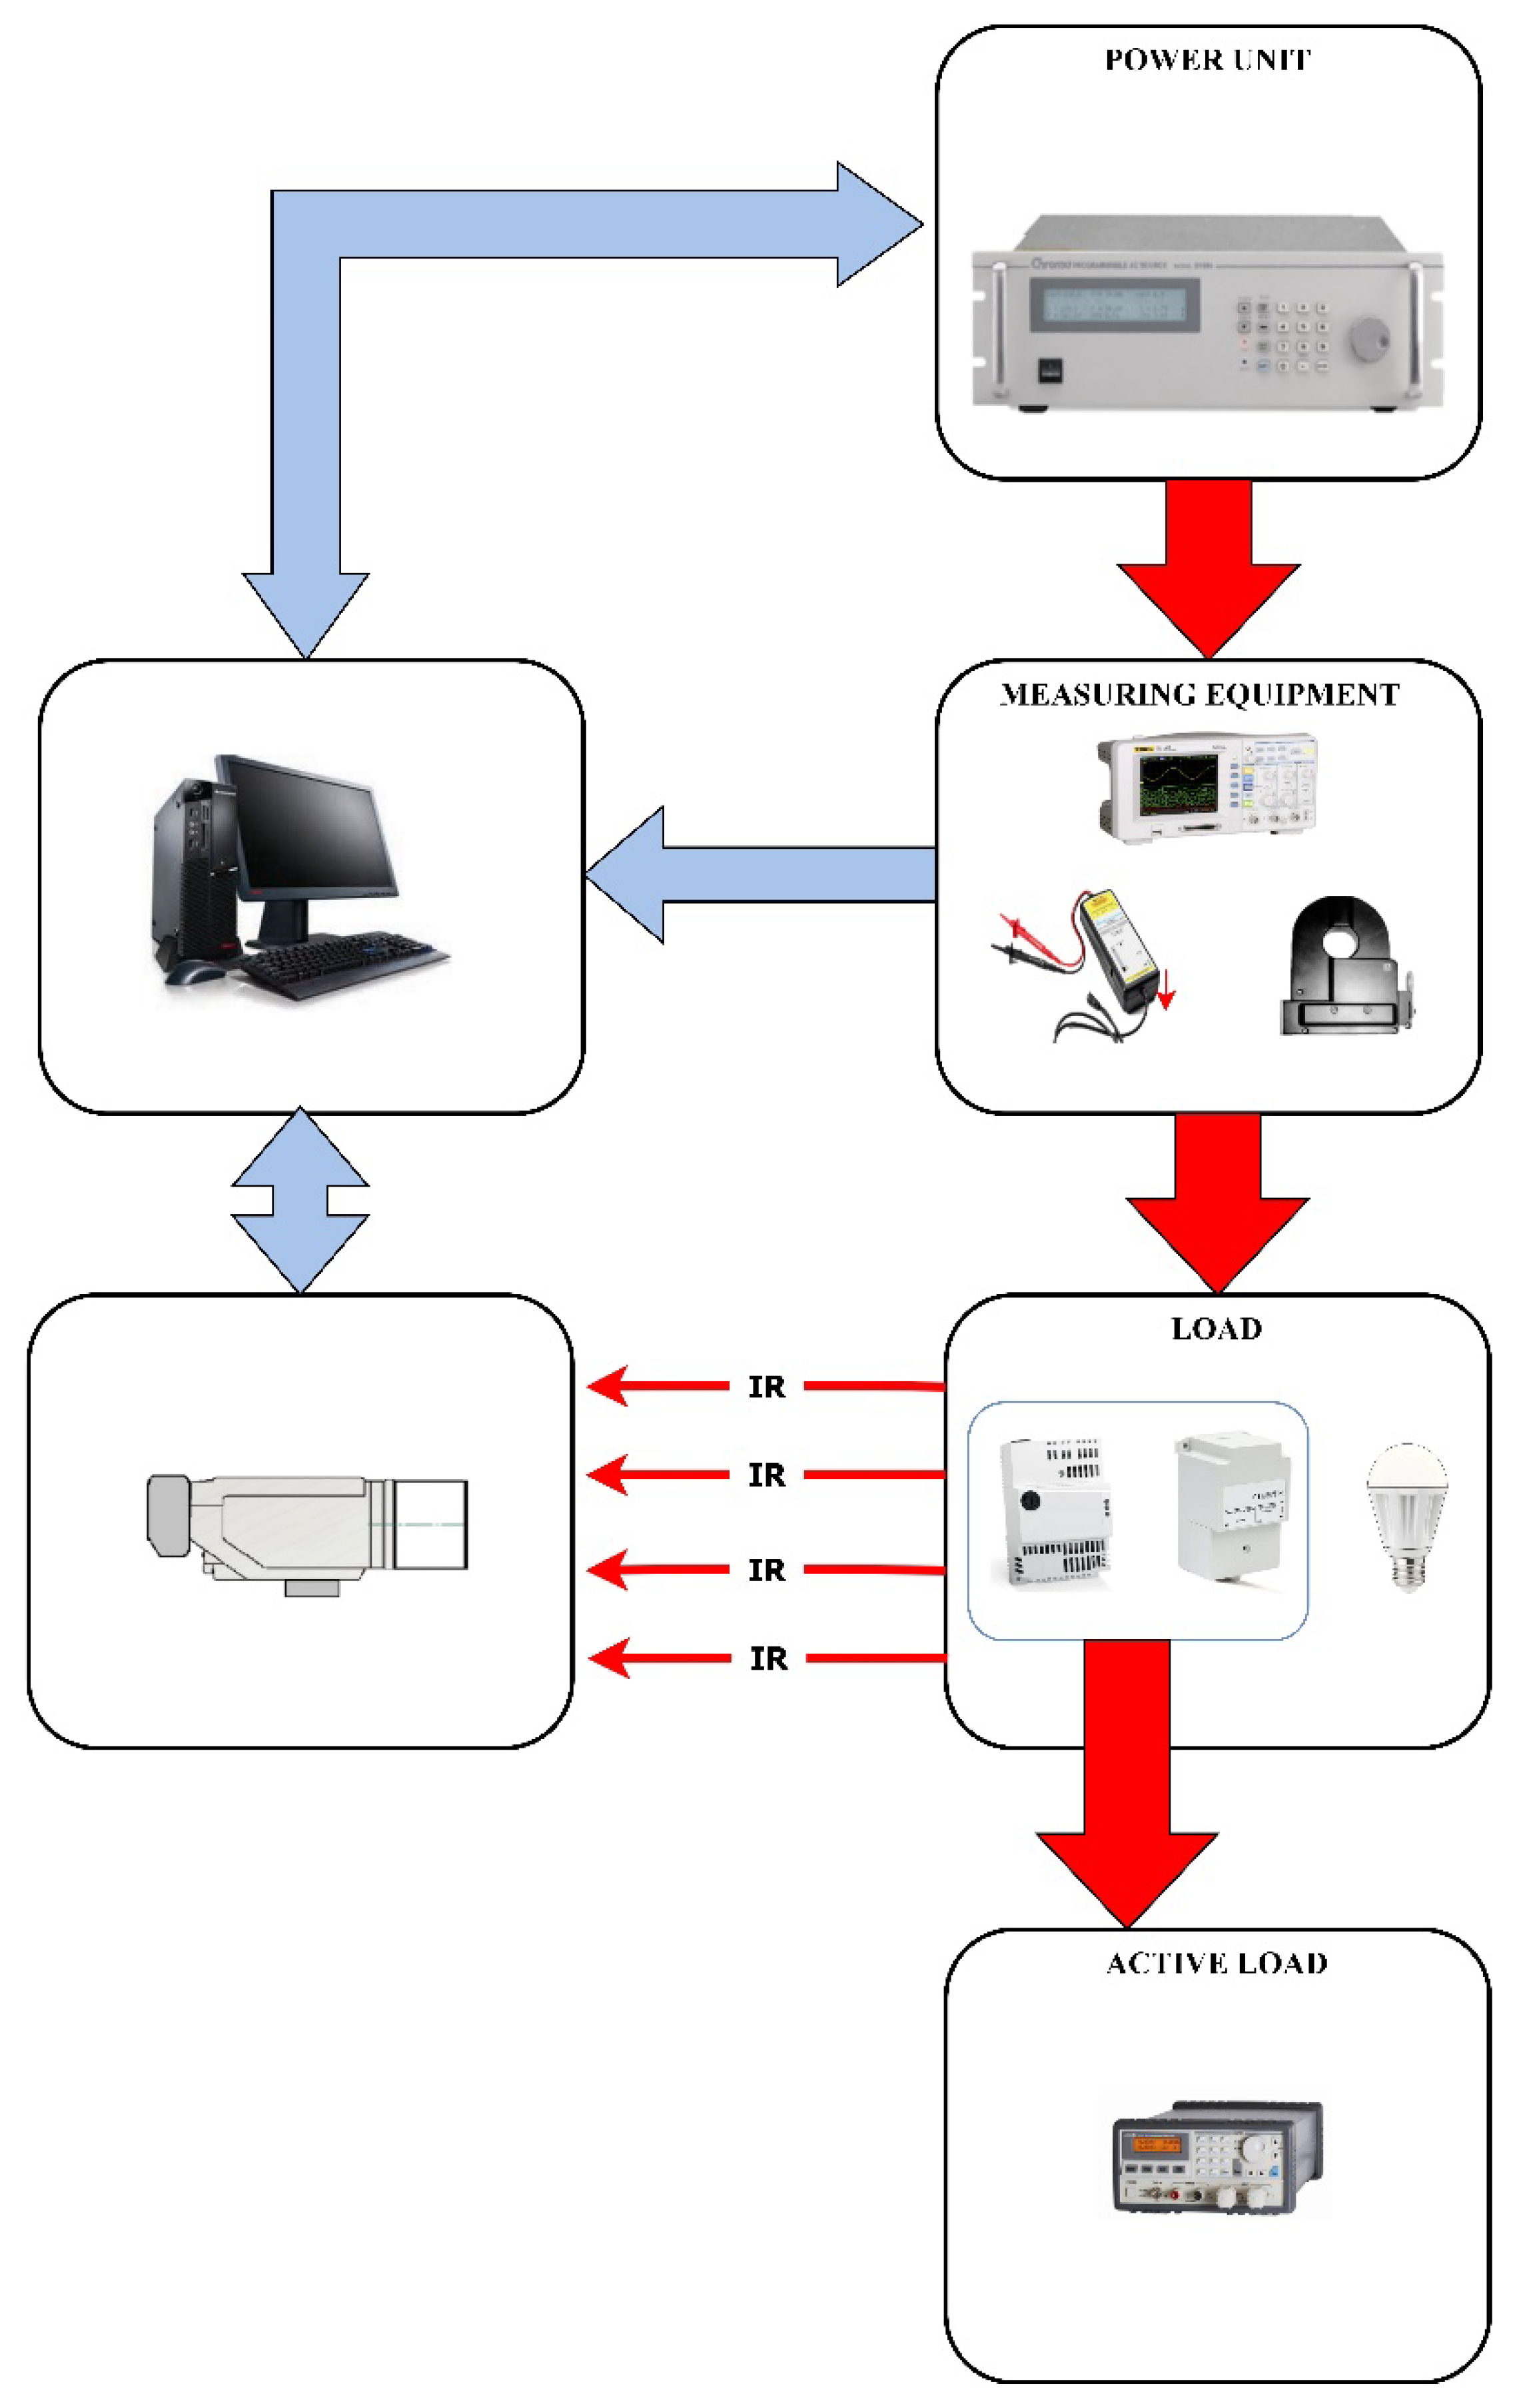
Selected systems were also tested. They were chosen on the basis of recipients’ declarations, who indicated which elements and systems in their installations were damaged. The testing, in an insulated environment with a distorted voltage supply, was related to power supplies used in fire alarm systems, LED lighting source, fluorescent lighting source and two step-down transformers typically used for various electronic or electrical devices. During the measurements, basic electrical parameters as well as temperature fields were monitored. For the tests of LED lighting sources, a controlled power supply type 61503 by Chroma was applied. The tests were carried out in the measurement system presented in Figure 11, which also included: R&S RT – ZD 01 (Rohde&Schwarz GmbH&Co. KG, Germany) voltage probe, ALCL – 40 D (Multi measuring instruments Co., Ltd., Tokyo, Japan) current probe, RIGOL 1102 D (Rigol Technologies, Inc., Suzhou, PRC) oscilloscope, VIGOcam v.50 (VIGO System S.A, Ozarow Mazowiecki, Poland) the thermal imaging camera with a reference field, and ARRAY active load 3712A (Array Electronic Co., Ltd., Nanjing, PRC) used as load for objects in test. The load was selected at the level of 75% of the rated power of the devices (this applies to the tested power supplies and power transformers).
Devices that were in operation for more than 100 h were used for all measurements of both lighting sources, power supply and transformers. Thermal imaging tests were carried out for a period of at least 120 min from reaching the state that guaranteed achieving temperature stability of the evaluated objects at an ambient temperature of 25 °C ± 5 °C. The thermal imaging camera was placed at a distance of 1 m from the research objects. Table 3 presents the basic technical data declared by the manufacturers of tested equipment.
In order to observe changes in the thermal characteristics resulting from the effect of distorted voltage, the following tests were carried out (the tests were marked according to Table 4):
  • Measurements at undistorted voltage of U = 230 V;
  • Harmonics of levels resulting from the measurements carried out at PCC (harmonics levels were applied in accordance with Table 5);
  • Harmonics as in point (b) and the constant component UDC = 0.5 V;
  • Harmonics as in point (b) and the constant component UDC = 18 V.
Table 5 describes the exposure used during the tests. Its levels were selected in line with the maximum disturbance levels recorded in the L 2 phase for the previously performed examination for harmonics up to 21st. All analyses were carried out at the fundamental frequency level (50 Hz) of 230 V. The values of all harmonics in the range from the 22nd to the 40th were adopted at 0%. The values of introduced harmonics were given in percentage of the value of the fundamental frequency.

5. Test Results

The collected test results for the determined temperature increments ∆T are presented in Table 6.

6. Analysis of the Results

The conducted analyses illustrated a relatively high level of disturbances in the voltages measured near the monitored photovoltaic installation. The measurements showed a significant share of harmonics in the supply voltage. The THD (Total Harmonic Distortion) was exceeded in all three phases reaching their maximum in the L 2 phase at the value of 18%. It should also be noted that the individual harmonics are exceeded against the applicable limits only at the 15th harmonic level. Their occurrence, however, at such levels should be considered uncommon. The recorded disturbance levels are typical of industrial networks rather than household networks. At the same time, the power flows in individual phases indicate a substantial discrepancy in power between the individual phases at the facility. Only the L 1 and L 2 phases are loaded, while in the L 3, the power consumption is negligible. This indicates a very uneven load of individual phases at the facility. Additionally, in each phase there is a constant component that reaches the value of 18 V in the L 2 phase for a period of over 12 min. The presence of a constant component in the supply network at levels up to 500 mV was monitored by the authors at various installations. Yet, its presence at higher levels, and for a relatively long period of time, may be the reason of overheating of some mains-operated devices. The laboratory tests carried out in isolated conditions reflected that the presence of harmonics only in supply voltages with THD levels of 18% is not the source of significant temperature increment, which are at the level of are approximately of 4 °C. Only the synergistic occurrence of harmonics and the constant component considerably increases the heating level of some devices equipped with magnetic circuits. This applies in particular to circuits powered from supply transformers, where the recorded increment in temperature rises from the level of ∆T ≈ 20 °C to ∆T ≈ 50 °C. In the case of newer power electronics solutions, the recorded temperature increments are trivial.

7. Conclusions

In the course of conducted analyses, it was possible to identify the source of disturbances in the LV network for the area in question. It should be considered that they came from the installed photovoltaic installation. Unfortunately, due to the lack of access to the installation itself, it was not possible to determine the exact reason of the disturbances and to discover whether they were caused by improper installation, damaged device or the operation of unidentified equipment. The examined nature of the disturbances suggests that they originated from a working photovoltaic installation, which, for unknown reasons, works incorrectly. The effects are the observed disturbances of a relatively high level that may lead to local damage, which may cause disorders in the vicinity of the disturbance. In particular, this may refer to older-generation electrical devices and reducing their lifetime to a great extent. The obtained results and observations are fully consistent with the previously known effects of disturbances in industrial areas. Their occurrence in home grids at such a level should be considered a disturbing effect of the development of photovoltaic, because so far, such levels of disturbances have not been observed in home power grids. According to the authors, the problems related to the overheating of electrical devices reported by end users in the vicinity of the photovoltaic installation are related to the synergistic occurrence of a high level of harmonics introduced into the grid, and the appearance of a relatively large constant component. As a result of their influence, the magnetic circuits became saturated and the operating point of various devices shifted, resulting in excessive heating. At the same time, the obtained results indicate that the currently existing methods of controlling small installations put into operation are definitely inadequate. In some cases, simplified procedures allow for fitting of installations that may seriously affect the existing infrastructure and nearby electrical equipment. According to the authors, installing devices that allow the quality of energy supplied to the grid by small photovoltaic installations to be monitored, should be considered a necessity. Due to the considerable increase in the mentioned installations, unfortunately, a vast multiplication of problems related to quality of energy in household networks, similar to those presented in the [18,19,20,21,22,23] recorded in countries where the contribution of renewable energy installations is higher than in Poland, should be expected.
It seems necessary to introduce additional requirements that may be associated with the need to install additional local electricity quality meters related to the implemented intelligent control and energy reception systems. It may also be required to follow the path of introducing more strict requirements for the acceptance of small photovoltaic installations and to waive from the previously promoted notification system, which according to the authors, would not be advisable due to the creation of barriers to the development of micro installations.
Additionally, in the process of designing individual elements, the methods of reducing DC components should be taken into account and based on:
  • DC suppression converters;
  • DC compensation methods;
  • Capacitor blocking method;
  • Physical capacitors;
  • Virtual capacitor;
  • Intelligent control.
The above methods are presented in more details inter alia in [24].

Author Contributions

Conceptualization, methodology, writing—review and editing S.G. and M.W. All authors have read and agreed to the published version of the manuscript.

Funding

This research was support by the Faculty of Electronics, Telecommunications and Informatics of the Gdańsk University of Technology.

Institutional Review Board Statement

Not applicable.

Informed Consent Statement

Not applicable.

Data Availability Statement

Data is contained within the article.

Acknowledgments

We would like to thank all the technical staff who assisted the team in conducting the research.

Conflicts of Interest

The authors declare no conflict of interest.

References

  1. Solar Energy. Available online: https://www.irena.org/solar (accessed on 18 March 2021).
  2. Installed Power (MW)—The National Potential of Renewable Energy Sources in Numbers-Urząd Regulacji Energetyki. Available online: https://www.ure.gov.pl/pl/oze/potencjal-krajowy-oze/5753,Moc-zainstalowana-MW.html (accessed on 9 April 2020).
  3. The National Potential of Renewable Energy Sources in Numbers-Urząd Regulacji Energetyki. Available online: https://www.ure.gov.pl/pl/oze/potencjal-krajowy-oze (accessed on 18 March 2021).
  4. Wirth, H.; Ise, F. Recent Facts about Photovoltaics in Germany, version of 11 March 2021; ISE: Freiburg, Germany; Available online: https://www.ise.fraunhofer.de/en/publications/studies/recent-factsabout-pv-in-germany.html (accessed on 9 April 2020).
  5. Solar PV Lights the Way to Energy Transition|Red Eléctrica de España. Available online: https://www.ree.es/en/press-office/news/featured-story/2020/04/solar-pv-lights-way-energy-transition (accessed on 18 March 2021).
  6. Installation ENERGA S.A Connection Code. Available online: https://www.energa-operator.pl/upload/wysiwyg/dokumenty_do_pobrania/uslugi/przylaczenie_do_sieci/kodeksy_sieciowe/Procedura_uzytkowanie_modulu_wytwarzania_typA_Zgloszenie.pdf (accessed on 18 March 2021).
  7. Quiroga, G.A.; Kagan, H.; Amasifen, J.C.C.; Almeida, C.F.M.; Kagan, N.; Vicentini, E. Study of the Distributed Generation impact on distributed networks, focused on quality of power. In Proceedings of the 2016 17th International Conference on Harmonics and Quality of Power (ICHQP), Belo Horizonte, Brazil, 16–19 October 2016; pp. 855–860. [Google Scholar] [CrossRef]
  8. Wang, Y.; Kuckelkorn, J.; Liu, Y. A state of art review on methodologies for control strategies in low energy buildings in the period from 2006 to 2016. Energy Build. 2017, 147, 27–40. [Google Scholar] [CrossRef]
  9. Zhang, J.; Ma, Q.; Xia, S.; Huan, G. Research on the Power Quality Control of Distributed Photovoltaic Power. In Proceedings of the 2019 IEEE International Conference on Energy Internet (ICEI), Nanjing, China, 20–24 May 2019; pp. 461–465. [Google Scholar] [CrossRef]
  10. Ibrahem, H.; Yehia, D.M.; Azmy, A.M. Power Quality Investigation of Distribution Networks with High Penetration of Solar Energy. In Proceedings of the 2019 21st International Middle East Power Systems Conference (MEPCON), Cairo, Egypt, 17–19 December 2019; pp. 1193–1198. [Google Scholar] [CrossRef]
  11. Do, D.-T.; Hirsch, H. EMI Filter Performance of Transformerless Topology for Photovoltaic Applications. In Proceedings of the 2020 International Symposium on Electromagnetic Compatibility-EMC EUROPE, Glasgow, UK, 30 July–6 August 2021; pp. 1–6. [Google Scholar] [CrossRef]
  12. Ping, H.; Dong, L.; Xin, Q. Influence of Grid-connected Photovoltaic Systems on Power Quality. In Proceedings of the 2019 IEEE 2nd International Conference on Automation, Electronics and Electrical Engineering (AUTEEE), Shenyang, China, 22–24 November 2019; pp. 447–451. [Google Scholar] [CrossRef]
  13. Lumbreras, D.; Gálvez, E.; Collado, A.; Zaragoza, J. Trends in Power Quality, Harmonic Mitigation and Standards for Light and Heavy Industries: A Review. Energies 2020, 13, 5792. [Google Scholar] [CrossRef]
  14. Anzalchi, A.; Sundararajan, A.; Moghadasi, A.; Sarwat, A. Power quality and voltage profile analyses of high penetration grid-tied photovoltaics: A case study. In Proceedings of the 2017 IEEE Industry Applications Society Annual Meeting, Cincinnati, OH, USA, 1–5 October 2017; pp. 1–8. [Google Scholar] [CrossRef]
  15. Mazzanti, G.; Passarelli, G.; Russo, A.; Verde, P. The effects of voltage waveform factors on cable life estimation using measured distorted voltages. In Proceedings of the 2006 IEEE Power Engineering Society General Meeting, PES, Montreal, QC, Canada, 18–22 June 2006. IEEE Computer Society. [Google Scholar] [CrossRef]
  16. Mazzanti, G. Reliability evaluation of insulation subjected to harmonic voltages within the limits set by international standards. IEEE Trans. Dielectr. Electr. Insul. 2014, 21, 2037–2046. [Google Scholar] [CrossRef]
  17. EU Grid Code EUR-Lex-32016R0631-EN-EUR-Lex. Available online: https://eur-lex.europa.eu/legal-content/EN/ALL/?uri=OJ:JOL_2016_112_R_0001 (accessed on 18 March 2021).
  18. Olowu, T.O.; Sundararajan, A.; Moghaddami, M.; Sarwat, A.I. Future challenges and mitigation methods for high photovoltaic penetration: A survey. Energies 2018, 11, 1782. [Google Scholar] [CrossRef] [Green Version]
  19. Doron, P.; Karni, J.; Slocum, A. A generalized approach for selecting solar energy system configurations for a wide range of applications. MRS Energy Sustain. 2019, 6, e11. [Google Scholar] [CrossRef] [Green Version]
  20. Al-Shetwi, A.Q.; Hannan, M.A.; Jern, K.P.; Alkahtani, A.A.; PG Abas, A.E. Power Quality Assessment of Grid-Connected PV System in Compliance with the Recent Integration Requirements. Electronics 2020, 9, 366. [Google Scholar] [CrossRef] [Green Version]
  21. Kroposki, B.; Johnson, B.; Zhang, Y.; Gevorgian, V.; Denholm, P.; Hodge, B.-M.; Hannegan, B. Operating Electric Power Systems with Extremely High Levels of Variable Renewable Energy. IEEE Power Energy Mag. 2017, 15, 61–73. [Google Scholar] [CrossRef]
  22. Soonwook Hong, P.; Michael Zuercher-Martinson, P.D. White Paper Harmonics and Noise in Photovoltaic (PV) Inverter and the Mitigation Strategies; Solectria Renewables: Lawrence, MA, USA, 2020; Available online: https://www.solectria.com/site/assets/files/1482/solectria_harmonics_noise_pv_inverters_white_paper.pdf (accessed on 18 March 2021).
  23. Dartawan, K.; Hui, L.; Suehiro, M. Harmonics Issues That Limit Solar Photovoltaic Generation On Distribution Circuits; Pterra LLC: New York, NY, USA, 2012; Available online: https://www.pterra.com/wp-content/uploads/2013/10/Solar_Paper_0482_Harmonics.pdf (accessed on 18 March 2021).
  24. Long, B.; Zhang, M.; Liao, Y.; Huang, L.; Chong, K. An Overview of DC Component Generation, Detection and Suppression for Grid-Connectedn Converter Systems. IEEE Access 2019, 7, 110426–110438. [Google Scholar] [CrossRef]
Figure 1. Typical photovoltaic micro-installation without energy storage.
Energies 14 02355 g001
Figure 2. The installation site at PCC (a) PQ-BOX 200, (b) electric meter.
Energies 14 02355 g002
Figure 3. Weather conditions during 7 days of measurement.
Energies 14 02355 g003
Figure 4. Harmonics in the supply voltage: (a) phase L 1; (b) phase L 2; (c) phase L 3.
Energies 14 02355 g004aEnergies 14 02355 g004b
Figure 5. The RMS voltage measurements, URMS for L 1, L 2, L 3.
Energies 14 02355 g005
Figure 6. Rapid changes in voltage example 1.
Energies 14 02355 g006
Figure 7. Rapid changes in voltage example 2.
Energies 14 02355 g007
Figure 8. Constant component (DC) in voltage.
Energies 14 02355 g008
Figure 9. Currents variation during measurements.
Energies 14 02355 g009
Figure 10. Currents variation during measurements.
Energies 14 02355 g010
Figure 11. Applied measurement system.
Energies 14 02355 g011
Table 1. Basic parameters of the supply voltage according to EN 50160.
ParameterUnitMax95%Min
FrequencyHz88.6150.0549.89
Voltage L 1V237.02233.26218.16
Voltage L 2V233.12229.25214.33
Voltage L 3V234.23230.26217.21
THD L 1% 8.37
THD L 2% 18.64
THD L 3% 9.23
Voltage Unbalance(events) 40
Table 2. Division of registered events in the supply voltage due to their duration.
Voltage Unbalanced
Events10 ≤ t < 200200 ≤ t < 500500 ≤ t < 10001000 ≤ t < 50005000 ≤ t < 60,000
(%)(ms)
90 > U ≥ 8010000
80 > U ≥ 7021000
70 > U ≥ 4011000
40 > U ≥ 500000
U< 50012616
Voltage increase
(%)10 ≤ t < 500500 ≤ t < 50005000 ≤ t < 60,000
U ≥ 120000
120 > U ≥ 110000
Table 3. Basic technical data declared by the manufacturers of tested equipment.
ItemSymbolDeclared Parameters
Power suppyA 1Un = 230 V; 60 VA; 50 Hz; Uout = 18 V; Iout = 3 A;
LED lighting sourceO 1Un = 230 V; 50 Hz, 80 mA, 11 W, 2700 K, 1055 lm;
Fluorescent lighting sourceO 2Un = 220–230 V; 50 Hz; 17 W;
Power transformerTR 1Un = 230 V; 35 VA; 47–63 Hz, Uout = 18 V; Iout = 2 A;
Power transformerTR 2Un = 230 V; 20 VA; 50 Hz; Uout = 18 V Iout = 1 A
Table 4. Applied test voltage.
TestVoltageHarmonicsUDC
-V-V
T 1230-0.0
T 2230As per Table 50.0
T 3230As per Table 50.5
T 4230As per Table 518.0
Table 5. Voltage harmonics values during tests.
HarmonicsValueAngleHarmonicsValueAngle
-%°-%°
20.5150120.575
34.090134.630
40.5150140.175
56.2180151.8180
60.3180160.1120
78.640171.6150
80.4150180.150
92.8150191.490
100.3100200.175
113.975210.1180
Table 6. Measurement results of temperature increments ∆T for individual tests.
ObcjectTest T 1Test T 2Test T 3Test T 4
-°C°C°C°C
A 141.341.845.247.3
O 158.258.458.458.6
O 247.848.448.550.0
TR 120.420.620.648.4
TR 218.218.822.450.9
Publisher’s Note: MDPI stays neutral with regard to jurisdictional claims in published maps and institutional affiliations.