
Comparison of Biological Efficiency Assessment Methods and Their Application to Full-Scale Biogas Plants

 , ,
, ,  ,
,
Abstract
:1. Introduction
2. Materials and Methods
2.1. Study Design
2.2. Data Collection and Laboratory Analyses
2.2.1. Process Data
2.2.2. Sampling
2.2.3. Dry Matter Content (DM) and Organic Dry Matter Content (ODM)
2.2.4. Biochemical Methane Potential Test
2.2.5. Fiber Content
2.2.6. Gross Calorific Value
2.3. Mass Balance
2.3.1. Substrate
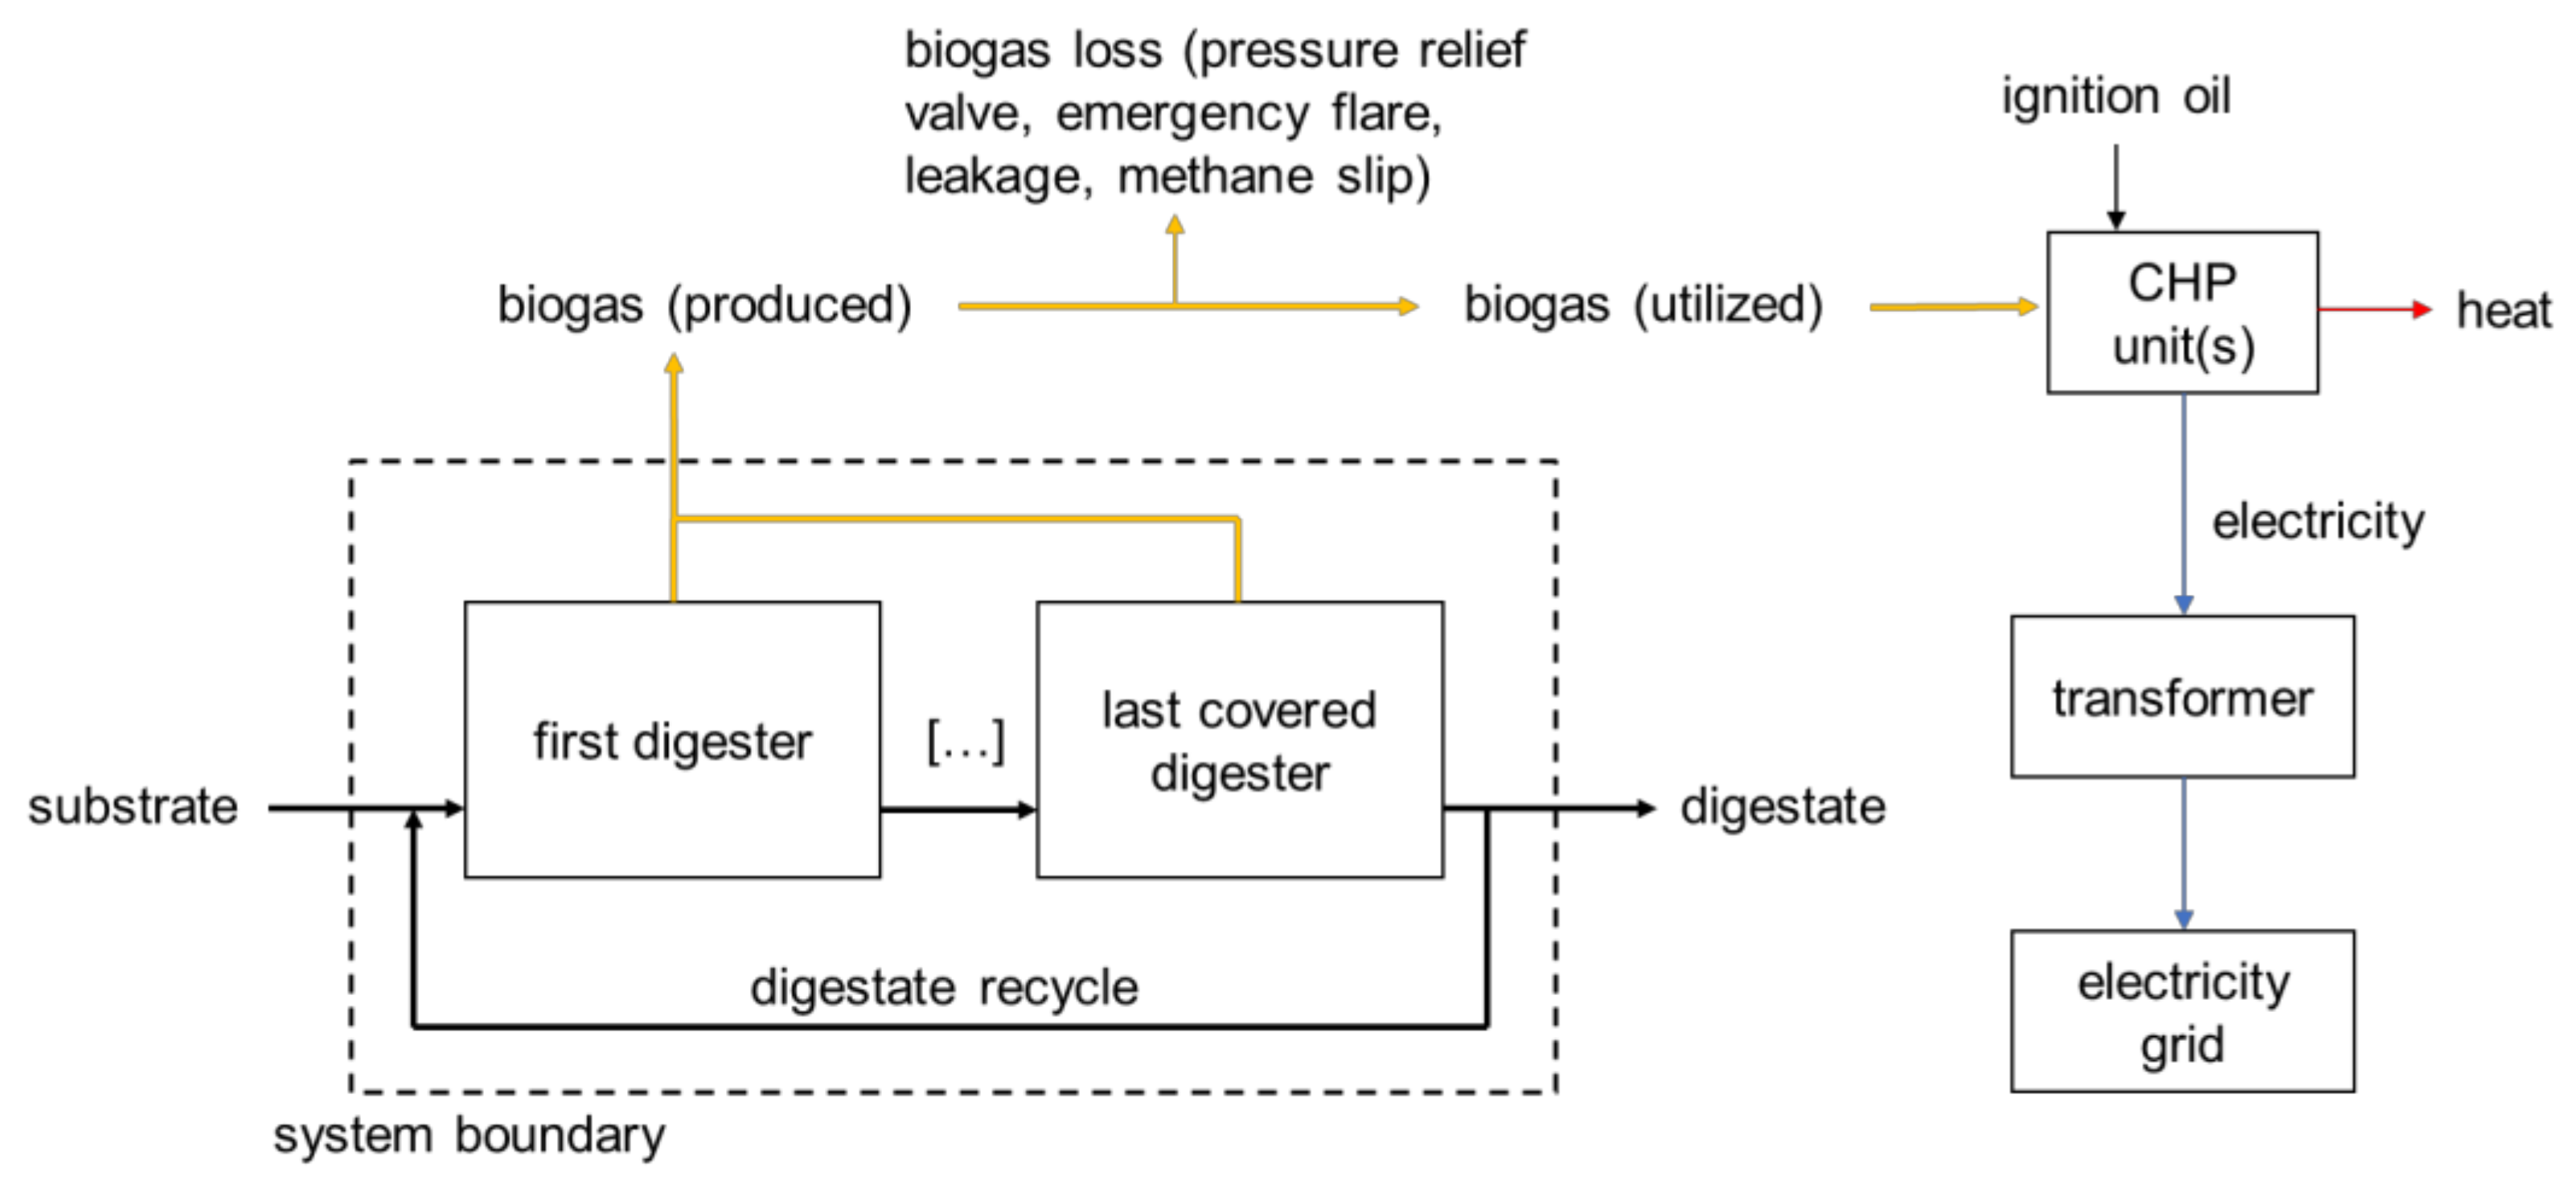
2.3.2. Biogas
- the transformation loss between the feed-in point and the CHP unit is 2% of the amount of electricity fed in, which is the average value of all examined BPs for which this transformation loss could be calculated based on alignment of electricity measurement at CHP units and at the grid access point;
- gas leakages and losses, like gas burned in the emergency flares, were not considered;
- for BPs using more than one CHP unit: The fed-in electricity from the BP was allocated to single CHP units by their rated power and operating hours in the investigated 12-month period;
- the electrical efficiency of CHP units was assumed to be equal to the published values by the manufacturers minus 3.1%, which reflects the average efficiency loss as determined by Aschmann and Effenberger [29]. Factors for efficiency loss are engine wear, site of installation above sea level, properties at different loads and engine settings. A higher accuracy in this value was not possible with the available data;
- the biogas was simplified to consist of methane and carbon dioxide only. The methane concentration was measured at every BP at least one time a month. The residual was assumed to be carbon dioxide only. Justification: Water vapor in produced biogas was condensed by gas cooling at every BP. The condensed water was pumped into digestate storage tanks and accounts to digestate mass in the mass balance. Other trace gas components produce a negligible error.
2.3.3. Digestate
2.3.4. Organic Dry Matter Content (ODM) Material Balance
2.4. Energy Balance
2.5. Specific Methane Potential of Substrate Mixtures
2.5.1. Biochemical Methane Potential Test (BMP)
2.5.2. Values According to Literature (KTBL)
2.5.3. Fermentable Organic Dry Matter (FOM)
2.5.4. Energy of Fermentable Organic Dry Matter (EFOM)
2.5.5. Anaerobically Degradable Energy (adE)
2.5.6. Total Energy (tE)
2.6. Efficiency Indicators
2.6.1. Yield Efficiency
Yield Based on BMP
Yield Based on KTBL
Yield Based on FOM
Yield Based on EFOM
Yield Based on adE
Yield Based on tE
2.6.2. Conversion Efficiency
Conversion Based on BMP
Conversion Based on FOM
Conversion Based on EFOM
Conversion Based on adE
Conversion Based on tE
Conversion Based on ODM
3. Results and Discussion
3.1. Mass and Energy Balance
- (1)
- Positive ODM balance residual and positive energy balance residual
- (2)
- Negative ODM balance residual and positive energy balance residual
- (3)
- Negative ODM balance residual and negative energy balance residual
3.2. Specific Methane Potential
3.3. Conversion and Yield Efficiency
4. Conclusions
Supplementary Materials
Author Contributions
Funding
Institutional Review Board Statement
Informed Consent Statement
Data Availability Statement
Acknowledgments
Conflicts of Interest
References
- FNR. Entwickelung der Biogasanlagenstandorte in Deutschland. Available online: https://mediathek.fnr.de/grafiken/daten-und-fakten/bioenergie/biogas/entwicklung-der-biogasanlagenstandorte-in-deutschland.html (accessed on 14 April 2021).
- Torrijos, M. State of Development of Biogas Production in Europe. Procedia Environ. Sci. 2016, 35, 881–889. [Google Scholar] [CrossRef]
- Daniel-Gromke, J.; Rensberg, N.; Denysenko, V.; Stinner, W.; Schmalfuß, T.; Scheftelowitz, M.; Nelles, M.; Liebetrau, J. Current Developments in Production and Utilization of Biogas and Biomethane in Germany. Chem. Ing. Tech. 2008, 90, 17–35. [Google Scholar] [CrossRef]
- Schievano, A.; D’Imporzano, G.; Salati, S.; Adani, F. On-field study of anaerobic digestion full-scale plants (Part I): An on-field methodology to determine mass, carbon and nutrients balance. Bioresour. Technol. 2011, 102, 7737–7744. [Google Scholar] [CrossRef] [PubMed]
- Ruile, S.; Schmitz, S.; Mönch-Tegeder, M.; Oechsner, H. Degradation efficiency of agricultural biogas plants—A full-scale study. Bioresour. Technol. 2015, 178, 341–349. [Google Scholar] [CrossRef] [PubMed]
- Hartmann, H.; Ahring, B.K. Anaerobic digestion of the organic fraction of municipal solid waste: Influence of co-digestion with manure. Water Res. 2005, 39, 1543–1552. [Google Scholar] [CrossRef] [Green Version]
- Demirer, G.N.; Chen, S. Effect of retention time and organic loading rate on anaerobic acidification and biogasification of dairy manure. J. Chem. Technol. Biotechnol. 2014, 79, 1381–1387. [Google Scholar] [CrossRef]
- Schievano, A.; D’Imporzano, G.; Orzi, V.; Adani, F. On-field study of anaerobic digestion full-scale plants (Part II): New approaches in monitoring and evaluating process efficiency. Bioresour. Technol. 2011, 102, 8814–8819. [Google Scholar] [CrossRef]
- VDI 4630. Fermentation of organic materials-Characterisation of the Substrate, Sampling, Collection of Material Data, Fermentation Tests; Verlag des Vereins Deutscher Ingenieure: Düsseldorf, Germany, 2016. [Google Scholar]
- Weinrich, S.; Schäfer, F.; Bochmann, G.; Liebetrau, J. Value of batch tests for biogas potential analysis. Method comparison and challenges of substrate and efficiency evaluation of biogas plants. IEA Bioenergy Task 2018, 37, 13–28. [Google Scholar]
- Hülsemann, B.; Zhou, L.; Merkle, W.; Hassa, J.; Müller, J.; Oechsner, H. Biomethane Potential Test: Influence of Inoculum and the Digestion System. Appl. Sci. 2020, 10, 2589. [Google Scholar] [CrossRef] [Green Version]
- KTBL. Faustzahlen Biogas, 3rd ed.; KTBL: Darmstadt, Germany, 2013. [Google Scholar]
- Weißbach, F. On Assessing the Gas Production Potential of Renewable Primary Products. Landtechnik 2008, 63, 356–358. [Google Scholar] [CrossRef]
- Weißbach, F. Gas production potential of fresh and ensiled sugar beets in biogas production. Landtechnik 2009, 64, 394–397. [Google Scholar] [CrossRef]
- Weißbach, F. The gas forming potential of pig slurry in biogas production. Landtechnik 2011, 66, 460–464. [Google Scholar] [CrossRef]
- Weißbach, F. The gas forming potential of dry chicken dung in biogas production. Landtechnik 2012, 67, 299–304. [Google Scholar] [CrossRef]
- Weißbach, F. Gas production potential of forage and cereal crops in biogas production. Landtechnik 2009, 64, 317–321. [Google Scholar] [CrossRef]
- Mächtig, T.; Moschner, C.R.; Hartung, E. Monitoring the efficiency of biogas plants—Correlation between gross calorific value and anaerobically non-degradable organic matter of digestates. Biomass Bioenergy 2019, 130, 105389. [Google Scholar] [CrossRef]
- Fischer, E.; Postel, J.; Ehrendreich, F.; Nelles, M. Using the mean fuel efficiency to energetically assess agricultural biogas plants. Agric. Eng. 2016, 71, 139–154. [Google Scholar] [CrossRef]
- Biogas-Messprogramm III, 1st ed.; Fachagentur Nachwachsende Rohstoffe: Gülzow, Germany, 2021.
- DIN EN 15935:2012-11, Sludge, Treated Biowaste, Soil and Waste—Determination of Loss on Ignition; Beuth Verlag GmbH: Berlin, Germany, 2012.
- Pröter, J.; Weinrich, S.; Hofman, J.; Kube, J. Mass balancing of biogas plants. In Collection of Methods for Biogas, 2nd ed.; Liebetrau, J., Pfeiffer, D., Eds.; DBFZ: Leipzig, Germany, 2020; pp. 381–392. [Google Scholar]
- Apelt, M. Determination of aliphatic, organic acids and benzaldehyde with headspace GC. In Collection of Methods for Biogas, 2nd ed.; Liebetrau, J., Pfeiffer, D., Eds.; DBFZ: Leipzig, Germany, 2020; pp. 64–68. [Google Scholar]
- Steinbrenner, J.; Nägele, H.-J.; Buschmann, A.; Hülsemann, B.; Oechsner, H. Testing different ensiling parameters to increase butyric acid concentration for maize silage, followed by silage separation and methane yield potential of separated solids residues. Bioresour. Technol. Rep. 2019, 7, 100193. [Google Scholar] [CrossRef]
- VDLUFA. Federation of German Agricultural Investigation and Research Institutes; VDLUFA Verlag: Darmstadt, Germany, 2007. [Google Scholar]
- Dittrich-Zechendorf, M. Determination of total Kjeldahl nitrogen and crude protein. In Collection of Methods for Biogas, 2nd ed.; Liebetrau, J., Pfeiffer, D., Eds.; DBFZ: Leipzig, Germany, 2020; pp. 90–100. [Google Scholar]
- DIN EN ISO 18125:2017-08, Solid Biofuels—Determination of Calorific Value; Beuth Verlag GmbH: Berlin, Germany, 2017.
- Havukainen, J.; Uusitalo, V.; Niskanen, A.; Kapustina, V.; Horttanainen, M. Evaluation of methods for estimating energy performance of biogas production. Renew. Energy 2014, 66, 232–240. [Google Scholar] [CrossRef]
- Aschmann, V.; Effenberger, M. The electrical efficiency of biogas-driven combined heat and power plants. Agric. Eng. 2012, 67, 118–121. [Google Scholar] [CrossRef]
- DIN EN ISO 6976:2016-12, Natural Gas—Calculation of Calorific Values, Density, Relative Density and Wobbe Indices from Composition; Beuth Verlag GmbH: Berlin, Germany, 2016.
- Banks, C.J.; Chesshire, M.; Heaven, S.; Arnold, R. Anaerobic digestion source-segregated domestic food waste: Performance assessment by mass and energy balance. Bioresour. Technol. 2011, 102, 612–620. [Google Scholar] [CrossRef] [PubMed] [Green Version]
- Liebetrau, J.; Reinelt, T.; Clemens, J.; Hafermann, C.; Friehe, J.; Weiland, P. Analysis of greenhouse gas emissions from 10 biogas plants within the agricultural sector. Water Sci. Technol. 2013, 67, 1370–1379. [Google Scholar] [CrossRef] [PubMed]
- Angelidaki, I.; Boe, K.; Ellegaard, L. Effect of operating conditions and reactor configuration on efficiency of full-scale biogas plants. Water Sci. Technol. 2005, 52, 189–194. [Google Scholar] [CrossRef]
- Lansing, S.; Hülsemann, B.; Choudhury, A.; Schueler, J.; Lisboa, M.S.; Oechsner, H. Food waste co-digestion in Germany and the United States: From lab to full-scale systems. Resour. Conserv. Recycl. 2019, 148, 104–113. [Google Scholar] [CrossRef]
- KTBL. Gasausbeute in Landwirtschaftlichen Biogasanlagen. KTBL-Heft 107, 3rd ed.; KTBL: Darmstadt, Germany, 2015; p. 27. [Google Scholar]
- Mata-Alvarez, J.; Macé, S.; Llabrés, P. Anaerobic digestion of organic solid wastes. An overview of research achievements and perspectives. Bioresour. Technol. 2000, 74, 3–16. [Google Scholar] [CrossRef]
- Astals, S.; Batstone, D.J.; Mata-Alvarez, J.; Jensen, P.D. Identification of synergistic impacts during anaerobic co-digestion of organic wastes. Bioresour. Technol. 2014, 169, 421–427. [Google Scholar] [CrossRef] [Green Version]
- Pöschel, M.; Ward, S.; Owende, P. Evaluation of energy efficiency of various biogas production and utilization pathways. Appl. Energy 2010, 87, 3305–3321. [Google Scholar] [CrossRef]
- Browne, J.D.; Murphy, J.D. Assessment of the resource associated with biomethane from food waste. Appl. Energy 2013, 104, 170–177. [Google Scholar] [CrossRef]
- Weiland, P.; Gemmeke, B.; Rieger, C. Biogas-Messprogramm II: 61 Biogasanlagen im Vergleich; Gülzow-Prüzen, Germany, 2009; ISBN 978-3-9803927-8-5. Available online: https://www.fnr-server.de/ftp/pdf/literatur/pdf_385-messprogramm_ii.html (accessed on 20 April 2021).
- Zhou, L.; Hülsemann, B.; Cui, Z.; Merkle, W.; Sponagel, C.; Zhou, Y.; Guo, J.; Dong, R.; Müller, J.; Oechsner, H. Operating Perfomance of Full-Scale Agricultural Biogas Plants in Germany and China: Results of a Year-Round Monitoring Program. Appl. Sci. 2021, 11, 1271. [Google Scholar] [CrossRef]
- Weißbach, F. Degree of utilization of primary renewable products in biogas production. Landtechnik 2009, 64, 18–21. [Google Scholar] [CrossRef]
- Symons, G.E.; Buswell, A.M. The Methane Fermentation of Carbohydrates. J. Am. Chem. Soc. 1933, 55, 2028–2036. [Google Scholar] [CrossRef]


| BP | Average Electrical Power | Temperature First Digester | Stages | HRT Heated | HRT Gas-Tight | OLR | Manure Share |
|---|---|---|---|---|---|---|---|
| kW | °C | HY/FD/SD/ST | d | d | kgODM d−1 m−3 | %mass | |
| 1 | 73 | 42 | 0/1/0/1 | 50 | 153 | 3.0 | 91.4 |
| 2 | 532 | 27–33 | 1/1/1/4 | 73 | 73 | 2.2 | 75.5 |
| 3 | 74 | 44 | 0/1/1/1 | 148 | 148 | 1.1 | 81.9 |
| 4 | 671 | 36–40 | 0/1/2/1 | 231 | 275 | 1.0 | 36.4 |
| 5 | 1229 | 45 | 0/1/1/2 | 72 | 213 | 3.3 | 58.0 |
| 6 | 77 | 42 | 0/1/0/1 | 73 | 221 | 1.9 | 82.1 |
| 7 | 498 | 44 | 0/1/1/2 | 127 | 346 | 3.4 | 32.9 |
| 8 | 209 | 43 | 0/1/0/2 | 66 | 66 | 4.9 | 10.5 |
| 9 | 316 | 38–47 | 0/1/1/2 | 104 | 156 | 3.1 | 37.7 |
| 10 | 358 | 42 | 0/1/1/1 | 225 | 225 | 1.6 | 7.7 |
| 11 | 508 | 47–53 | 0/1/1/1 | 59 | 116 | 4.8 | 34.9 |
| 12 | 207 | 45 | 0/2/1/0 | 142 | 142 | 1.8 | 43.6 |
| 13 | 512 | 40 | 0/2/1/2 | 61 | 61 | 2.6 | 67.9 |
| 14 | 451 | 44 | 0/1/0/1 | 42 | 168 | 4.9 | 50.9 |
| 15 | 942 | 41 | 0/1/1/1 | 81 | 81 | 3.8 | 0.3 |
| 16 | 469 | 40 | 0/1/1/1 | 113 | 113 | 2.3 | 32.5 |
| 17 | 1706 | 43–45 | 0/2/1/1 | 72 | 118 | 4.3 | 0.0 |
| 18 | 649 | 45 | 0/1/1/1 | 133 | 189 | 2.5 | 0.0 |
| 19 | 571 | 43 | 1/2/0/1 | 63 | 129 | 3.5 | 56.3 |
| 20 | 199 | 39–45 | 0/1/0/1 | 65 | 134 | 2.5 | 52.9 |
| 21 | 1796 | 43 | 0/2/1/2 | 73 | 156 | 4.1 | 0.0 |
| 22 | 635 | 43–49 | 0/1/1/1 | 71 | 168 | 3.2 | 51.5 |
| 23 | 459 | 52–59 | 0/1/1/5 | 101 | 101 | 2.9 | 34.6 |
| 24 | 381 | 35–43 | 0/1/0/1 | 78 | 78 | 2.2 | 51.6 |
| 25 | 560 | 43 | 0/1/1/2 | 89 | 218 | 1.9 | 55.9 |
| 26 | 712 | 42 | 0/1/0/1 | 54 | 104 | 3.1 | 75.6 |
| 27 | 739 | 43 | 0/1/1/1 | 124 | 192 | 2.5 | 0.0 |
| 28 | 557 | 44 | 0/2/0/6 | 45 | 45 | 3.6 | 73.0 |
| 29 | 371 | 43 | 0/1/1/1 | 87 | 208 | 2,3 | 42.7 |
| 30 | 515 | 42 | 0/1/0/1 | 81 | 226 | 3.6 | 32.0 |
| 31 | 511 | 42 | 1/2/1/1 | 120 | 120 | 1.4 | 62.1 |
| 32 | 512 | 44 | 0/1/1/1 | 61 | 96 | 1.6 | 84.9 |
| 33 | 975 | 50 | 0/1/2/2 | 59 | 272 | 4.3 | 51.7 |
| Yield Efficiency [%] | ||||||||
|---|---|---|---|---|---|---|---|---|
| BP | BMP | KTBL | FOM | EFOM | adE | tE | ||
| Case 1 | 1 | 98 | 76 | 73 | 67 | 42 | 36 | |
| 2 | 101 | 97 | 98 | 92 | 61 | 53 | ||
| 3 | 92 | 79 | 77 | 76 | 50 | 45 | ||
| 4 | 86 | 76 | 104 | 107 | 54 | 49 | ||
| 5 | 92 | 87 | 96 | 95 | 67 | 59 | ||
| 6 | 88 | 98 | 87 | 75 | 75 | 50 | ||
| 7 | 108 | 99 | 98 | 91 | 69 | 63 | ||
| 8 | 77 | 82 | 85 | 85 | 60 | 55 | ||
| 9 | 106 | 97 | 110 | 110 | 68 | 62 | ||
| 10 | 90 | 99 | 92 | 85 | 75 | 72 | ||
| Case 2 | 11 | 105 | 97 | 99 | 95 | 69 | 62 | |
| 12 | 104 | 101 | 95 | 86 | 71 | 66 | ||
| 13 | 114 | 103 | 109 | 101 | 69 | 61 | ||
| 14 | 114 | 104 | 103 | 100 | 80 | 72 | ||
| 15 | 101 | 117 | 113 | 107 | 87 | 83 | ||
| 16 | 96 | 113 | 106 | 102 | 85 | 81 | ||
| 17 | 110 | 116 | 110 | 103 | 86 | 83 | ||
| 18 | 122 | 116 | 132 | 132 | 89 | 82 | ||
| 19 | 107 | 109 | 112 | 106 | 77 | 70 | ||
| 20 | 110 | 102 | 115 | 107 | 69 | 59 | ||
| 21 | 98 | 116 | 110 | 103 | 88 | 82 | ||
| 22 | 115 | 113 | 110 | 105 | 82 | 75 | ||
| 23 | 114 | 110 | 128 | 122 | 84 | 76 | ||
| 24 | 96 | 109 | 109 | 103 | 75 | 70 | ||
| 25 | 99 | 113 | 108 | 102 | 82 | 74 | ||
| 26 | 138 | 115 | 124 | 109 | 70 | 59 | ||
| 27 | 94 | 116 | 111 | 104 | 87 | 82 | ||
| 28 | 118 | 111 | 115 | 108 | 78 | 70 | ||
| Case 3 | 29 | 109 | 113 | 109 | 102 | 85 | 76 | |
| 30 | 100 | 116 | 116 | 111 | 82 | 74 | ||
| 31 | 122 | 124 | 128 | 122 | 88 | 80 | ||
| 32 | 132 | 129 | 126 | 116 | 79 | 68 | ||
| 33 | 123 | 116 | 116 | 109 | 86 | 79 | ||
| Min | 77 | 76 | 73 | 67 | 42 | 36 | ||
| Max | 138 | 129 | 132 | 132 | 89 | 83 | ||
| Median | 105 | 109 | 109 | 103 | 77 | 70 | ||
| Median Case 2 | 109 | 110 | 112 | 105 | 79 | 73 | ||
| Conversion Efficiency [%] | |||||||
|---|---|---|---|---|---|---|---|
| BP | BMP | FOM | EFOM | adE | tE | ODM | |
| Case 1 | 1 | 89 | 101 | 123 | 77 | 66 | 69 |
| 2 | 90 | 104 | 121 | 80 | 70 | 73 | |
| 3 | 95 | 80 | 104 | 68 | 61 | 64 | |
| 4 | 96 | 133 | 159 | 80 | 72 | 75 | |
| 5 | 97 | 123 | 120 | 84 | 75 | 79 | |
| 6 | 94 | 86 | 80 | 80 | 53 | 64 | |
| 7 | 96 | 91 | 117 | 88 | 82 | 84 | |
| 8 | 93 | 99 | 107 | 75 | 69 | 72 | |
| 9 | 98 | 121 | 144 | 89 | 82 | 85 | |
| 10 | 99 | 100 | 104 | 92 | 88 | 90 | |
| Case 2 | 11 | 97 | 101 | 111 | 81 | 73 | 76 |
| 12 | 94 | 91 | 101 | 84 | 77 | 80 | |
| 13 | 93 | 111 | 120 | 81 | 72 | 75 | |
| 14 | 96 | 95 | 105 | 84 | 76 | 80 | |
| 15 | 97 | 111 | 112 | 91 | 87 | 89 | |
| 16 | 97 | 106 | 105 | 87 | 83 | 85 | |
| 17 | 98 | 106 | 109 | 91 | 89 | 90 | |
| 18 | 98 | 126 | 136 | 92 | 85 | 88 | |
| 19 | 85 | 105 | 112 | 82 | 74 | 78 | |
| 20 | 95 | 106 | 112 | 72 | 61 | 65 | |
| 21 | 99 | 108 | 106 | 91 | 85 | 88 | |
| 22 | 97 | 108 | 112 | 87 | 80 | 83 | |
| 23 | 96 | 116 | 125 | 86 | 78 | 81 | |
| 24 | 89 | 106 | 108 | 79 | 73 | 75 | |
| 25 | 96 | 100 | 104 | 84 | 76 | 80 | |
| 26 | 91 | 96 | 120 | 77 | 64 | 67 | |
| 27 | 98 | 108 | 112 | 93 | 89 | 91 | |
| 28 | 93 | 106 | 109 | 78 | 70 | 73 | |
| Case 3 | 29 | 97 | 104 | 100 | 83 | 75 | 79 |
| 30 | 93 | 97 | 105 | 77 | 69 | 73 | |
| 31 | 98 | 115 | 117 | 85 | 77 | 80 | |
| 32 | 95 | 104 | 112 | 76 | 66 | 69 | |
| 33 | 95 | 101 | 106 | 84 | 77 | 80 | |
| Min | 85 | 80 | 80 | 68 | 53 | 64 | |
| Max | 99 | 133 | 159 | 93 | 89 | 91 | |
| Median | 96 | 105 | 112 | 84 | 75 | 79 | |
| Median Case 2 | 95 | 106 | 112 | 85 | 77 | 80 | |
Publisher’s Note: MDPI stays neutral with regard to jurisdictional claims in published maps and institutional affiliations. |
© 2021 by the authors. Licensee MDPI, Basel, Switzerland. This article is an open access article distributed under the terms and conditions of the Creative Commons Attribution (CC BY) license (https://creativecommons.org/licenses/by/4.0/).
Share and Cite
Hülsemann, B.; Mächtig, T.; Pohl, M.; Liebetrau, J.; Müller, J.; Hartung, E.; Oechsner, H. Comparison of Biological Efficiency Assessment Methods and Their Application to Full-Scale Biogas Plants. Energies 2021, 14, 2381. https://doi.org/10.3390/en14092381
Hülsemann B, Mächtig T, Pohl M, Liebetrau J, Müller J, Hartung E, Oechsner H. Comparison of Biological Efficiency Assessment Methods and Their Application to Full-Scale Biogas Plants. Energies. 2021; 14(9):2381. https://doi.org/10.3390/en14092381
Chicago/Turabian StyleHülsemann, Benedikt, Torsten Mächtig, Marcel Pohl, Jan Liebetrau, Joachim Müller, Eberhard Hartung, and Hans Oechsner. 2021. "Comparison of Biological Efficiency Assessment Methods and Their Application to Full-Scale Biogas Plants" Energies 14, no. 9: 2381. https://doi.org/10.3390/en14092381