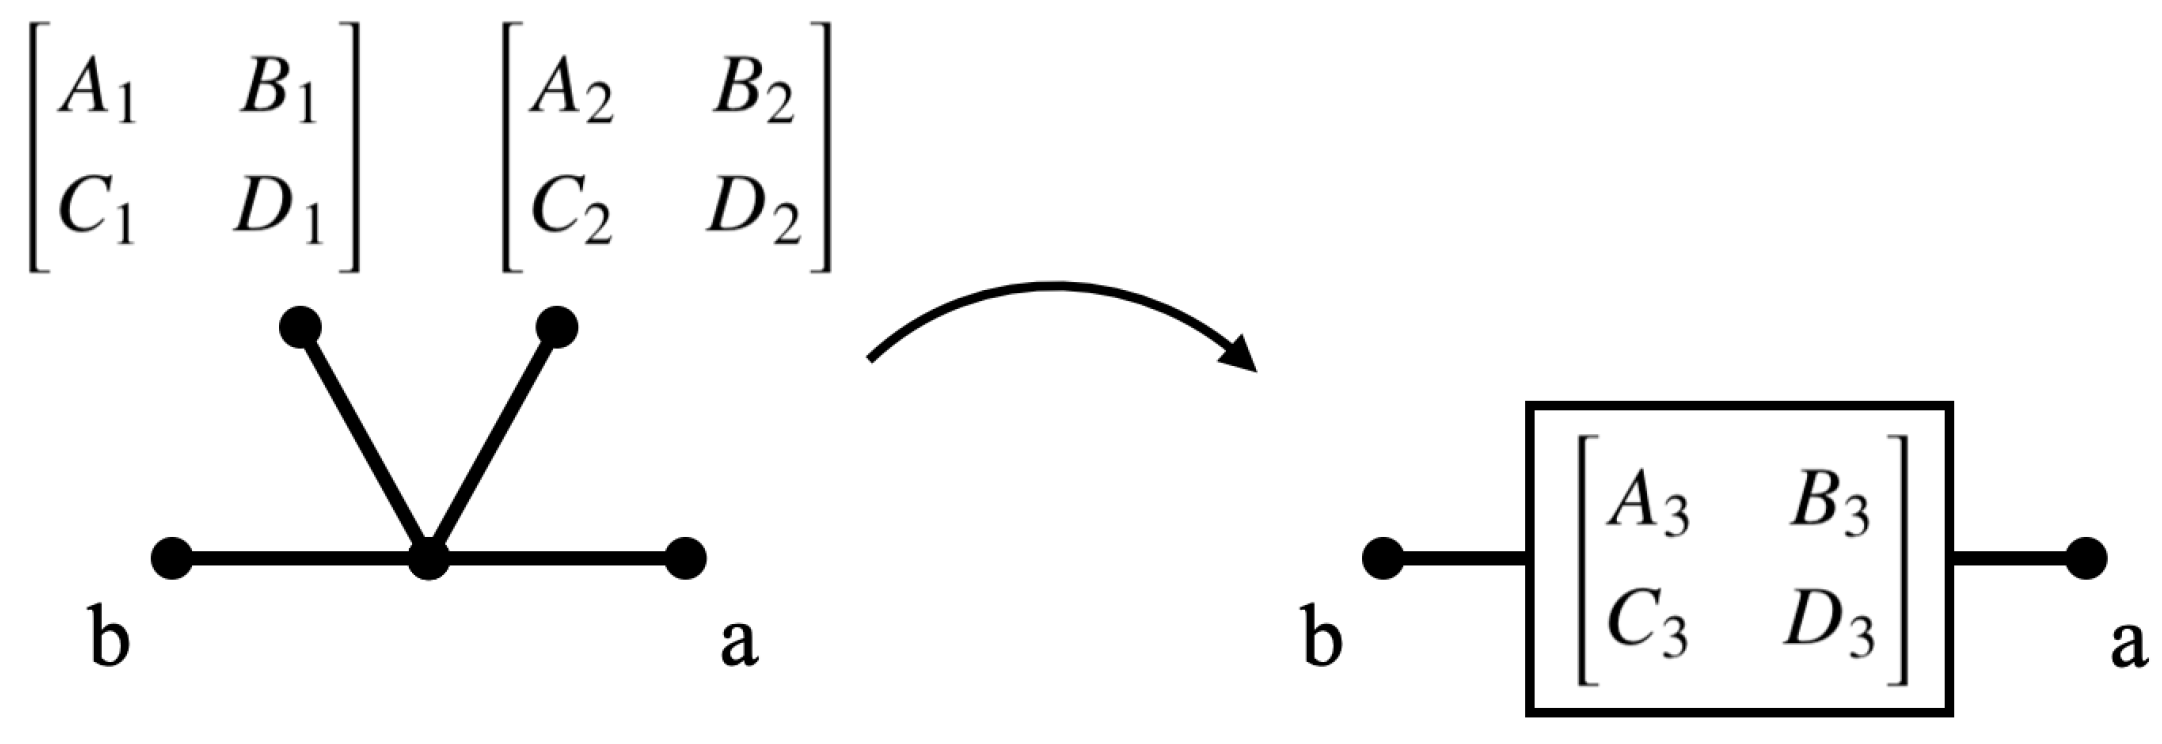
Several mathematical tools are used here for modeling a network frequency response, and a summary of each is given in this section.
3.1. Network Simulation
The channel transfer function
H is calculated from a fully defined network using two-port network theory [
24,
35]. The channel transfer function is defined as the ratio of the transmitter voltage
and the receiver voltage
.
The transfer function is computed using ABCD matrices. The matrix elements corresponding to a cable are calculated from
and
as:
These components are computed for each cable and load, and are then combined for all the loads and wires between the transmitter and receiver. The channel transfer function (in decibels) is then calculated using (
13) [
16].
where
,
,
,
are the matrix elements of the combined ABCD matrix,
is the transmitter impedance, and
is the receiver impedance. See the
Appendix A for more details on how the transfer function is computed using two-port networks.
The network solver was written in Python and interfaced with the Bayesian inference code. The solver was verified against the code of Cañete et al. [
9] for a simplified network.
3.2. Bayesian Inference
We employ a probabilistic framework to estimate model parameters based on data [
21]. Specifically, we cast the inference in a Bayesian framework, which helps update our prior knowledge about the model parameters by comparing the model predictions with the available data. From the Bayes rule:
where
is the observed data,
is the set of model parameters, and
designates a probability.
is called the
prior probability and encodes any prior knowledge, including expert opinion, one might have about the model in the context of a particular application.
, called the
likelihood, measures the agreement between the model and the data for select parameter values. Close agreement between the model and the data will result in higher values for the
posterior .
For this work, the prior was set to a uniform distribution between the bounds set for the model parameters. We employ a Gaussian approximation for the likelihood:
where
is the output of the proposed, and
denotes a normal distribution with mean
and variance
. Since
is unknown, it is inferred as one of the parameters.
To apply Bayesian inference, parameter samples must be drawn from the prior distribution and the likelihood evaluated via (
15). If the samples are drawn randomly from the prior distribution, it can take a prohibitively large number of samples to reasonably approximate the posterior, unless the number of parameters
is very small. Instead, Markov chain Monte Carlo (MCMC) methods are generally used to draw samples from the distribution of
. MCMC methods take a sample and propose a modification to the sample, then estimate the likelihood at the proposed point. The proposed sample can be accepted or rejected depending on the posterior value at the new location. Therefore, samples are more likely be drawn to regions of parameter space with high posterior values. For details, see Refs. [
21,
36].
There are a variety of MCMC methods that could be used. Single chain methods such as the Metropolis-Hastings method [
37], adaptive Metropolis (AM) [
38], or delayed rejection adaptive Metropolis (DRAM) [
39] update a single sample many times, making a single chain. This work uses transitional Markov chain Monte Carlo (TMCMC), which has been shown to be more robust for high dimensional parameter spaces than single chain methods [
22,
40,
41]. TMCMC uses a series of intermediate distributions, given in (
16), to transition a set of samples from the prior to the posterior distribution:
is a parameter that is increased from 0 to 1 to transition the samples gradually from the prior to the posterior. This gradual change prevents the samples from immediately clustering in locally favorable regions without exploring a larger region of parameter space.
For the PLC networks presented here, the parameters correspond to the wire length l, wire radius , load power , resonance frequency , phase , load parameters D and T, and the standard deviation for the discrepancy between the model and the data. There are additional network parameters , but a sensitivity analysis showed that they had marginal effects on the transfer function, so they are ignored when performing Bayesian inference to keep the parameter space lower dimensional. The load types can also be considered parameters, but they only take on discrete values and are not directly calibrated with TMCMC. Therefore, the load types are considered a separate set of discrete parameters and the parameters that take on continuous values are the continuous parameters . The continuous parameters have a direct dependence on the discrete parameters, so . Furthermore, the number of continuous parameters is dependent on the discrete parameters because a load will have a different number of continuous parameters depending on the load type (constant loads have one continuous parameter, frequency selective loads have two, time-varying harmonic loads have three, and time-varying commuted loads have four).
Because of the dependence of continuous parameters on discrete parameters,
, for this work we will infer
for fixed
choices. The Bayesian inference update rule, in (
14), becomes:
For simplicity, and since we are not comparing models across different sets of
, the dependence of continuous parameters on the discrete parameters is left out of the notation in this work.
3.3. Sensitivity Analysis
We employ Global Sensitivity Analysis (GSA) to estimate how the change in network modeling output can be apportioned to changes in the continuous parameters . With the focus on statistical model calibration, we employ variance-decomposition methods where the total output variance is decomposed into fractions associated with the model parameters and their interactions.
The effects of input parameters
and their interactions on a model output
, are quantified through Sobol indices [
42,
43,
44]. The first order Sobol indices are given by:
where
,
is the expectation with respect to
, and
is the variance with respect to
. Note that, in this context, subscript
i can denote one parameter or a group of parameters. The first-order Sobol indices estimate the fractional contribution of each input parameter
to the total variance of the model output.
Sobol indices are computed using UQ Toolkit [
45], an open-source library for uncertainty quantification. The UQ Toolkit estimates Sobol indices using Monte Carlo (MC) algorithms proposed by Ref. [
46].
3.4. Sensitivity-Informed Bayesian Inference
The network topologies in this work generally have over 50 continuous parameters that could be optimized, but a 50 parameter space is too high-dimensional to directly pursue a statistical inference study. Many of the parameters are for loads and wires far from the main path between the transmitter and receiver, and likely have an negligible effect on the transfer function. The objective of sensitivity-informed Bayesian inference is to perform Bayesian inference only on parameters that have a significant effect on the transfer function. We use Sobol indices to calculate how sensitive the frequency response is to each continuous parameter and only perform Bayesian inference on the most sensitive parameters. For a network with randomly generated discrete parameters , Sobol indices are computed for all continuous parameters , then Bayesian inference is performed on a subset of designated as the trainable parameters , consisting of the most sensitive parameters.
Sensitivity-informed Bayesian inference can only calibrate for assumed . Therefore, random search methods are applied to identify the discrete parameters in a three-part process. First, sensitivity-informed Bayesian inference is applied to different realizations of the network, each with different randomly generated . The different realizations are independent and can be run in parallel to speed up the computational time. In the second part, further refinements are made with a random greedy search on the discrete parameters. For iterations, a single discrete parameter is randomly regenerated, and Bayesian inference is performed only on the dependent parameters . Every third iteration, three random parameters are selected and inference is performed on them to ensure that the wires length and radius are also updated, as those parameters are not dependent on discrete parameters . At each stage, the new model is saved only if it is more accurate than the previous model, making it a greedy algorithm. In the third part, a single run of sensitivity-informed Bayesian inference is performed to ensure the most sensitive parameters are calibrated and to obtain an accurate sample distribution for error analysis.
To compare different calibrated models, the continuous ranked probability score (CRPS) is used [
47,
48,
49]. CRPS provides an aggregate value expressing a prediction error for probabilistic outputs. The advantage of the CRPS over simply using the standard deviation is that it accounts for non-Gaussian distributions. See Ref. [
49] for details.
The full algorithm for calibrating the network model is given in Algorithm 1.
| Algorithm 1: Algorithm for calibration network model |
![Energies 14 02402 i001 Energies 14 02402 i001]() |
To summarize Algorithm 1, in the initial inference step, sensitivity-informed Bayesian inference is run on a number of randomly generated network realizations. In the random search step, the most accurate model is repetitively modified, and Bayesian inference is applied only to a few parameters. In the final refinement step, sensitivity-informed Bayesian inference is applied to the most accurate model to generate parameter samples from the posterior distribution for accurate error analysis. The model calibration is all done in an offline stage, where computational resources are not a significant barrier. Model predictions of the calibrated model can then be made in an online stage very quickly.
3.5. Predictive Assessment
We will employ both
pushed-forward distributions and
Bayesian posterior-predictive distributions [
50] to assess the predictive skill of the transfer function. The pushed-forward distribution is the model distribution computed directly from the samples, and the Bayesian posterior-predictive distribution is the model distribution inclusive of the statistical discrepancy between the model and the data (and therefore accounts for model form and/or measurements errors). The process used to generate push-forward posterior estimates is formalized as:
Here, denotes hypothetical data and denotes the push-forward probability density of the hypothetical data conditioned on the observed data . We start with samples from the posterior distribution . These samples are readily available from the TMCMC exploration of the parameter space. Using these samples, we evaluate the transfer function H and collect the resulting samples that correspond to the push-forward posterior distribution .
The pushed-forward posterior does not account for the discrepancy between the data
and the model predictions, subsumed into the definition of the likelihood function in (
15). The Bayesian posterior-predictive distribution, defined in (
20), is computed by marginalization of the likelihood over the posterior distribution of model parameters
:
In practice, we estimate
through sampling. The sampling workflow is similar to the one shown in (
19). After the model evaluations
are completed, we add random noise consistent with the likelihood model settings presented in (
15). The resulting samples are used to compute summary statistics of
. For example, the modeled transfer function is the mean of
.


