Article

A CFD-Based Parametric Thermal Performance Analysis of Supply Air Ventilated Windows

by
Shiva Najaf Khosravi
* and
Ardeshir Mahdavi
Department of Building Physics and Building Ecology, Vienna University of Technology, 1040 Vienna, Austria
*
Author to whom correspondence should be addressed.
Energies 2021, 14(9), 2420; https://doi.org/10.3390/en14092420
Submission received: 2 March 2021 / Revised: 16 April 2021 / Accepted: 21 April 2021 / Published: 23 April 2021
(This article belongs to the Special Issue Challenges and Research Trends of Building Energy Performance)

Abstract

:
Ventilated windows have the potential to contribute to both indoor air quality and energy efficiency in cold climates. A typical ventilated window functions as a solar collector under inward air flow direction and incident solar radiation. The ventilated window is a modification of the multiple pane windows in which air is drawn in from outside and is heated through conduction, convection, and radiation in the cavity. In this study, a detailed parametric analysis was conducted to investigate the thermal performance of ventilated windows and their capacity to preheat ventilation air. High-resolution 3D steady RANS computational fluid dynamic (CFD) simulations were performed for six ventilated window geometries. Model results were compared with measurements. The following geometric characteristics were evaluated in detail: (i) The height of the window, (ii) the width of the cavity, (iii) the location of double-layered glazing, and (iv) the width of the supply air opening. The results suggested that taller cavities and a smaller cavity depth can provide higher incoming air temperature. Windows with inner double-layered glazing and a smaller width of supply air opening displayed a better thermal performance.

1. Introduction

Windows represent essential elements of buildings’ envelope. Given their higher thermal transmittance, improving their thermal behavior has been a persistent subject of interest [1]. Different approaches to energy-efficient glazing systems are still debated among scientists [2,3]. Optimum glazing is expected to allow for high solar gains and low heat loss in winter. Windows are also expected to facilitate sufficient air change rates [4]. To achieve these attributes, various transparent building components have been developed, including ventilated windows [5]. These type of windows have received increasing attention since their introduction in Northern Europe [6]. As the name implies, the main difference between conventional windows and ventilated windows is the existence of free or forced convection in the interstitial cavity between the window’s layers. In certain instances, operable vents positioned at the top and bottom of the frames enable, depending on the operation mode, the flow of air in the cavity [7].
The five main operation modes of a ventilated window are schematically illustrated in Figure 1. These are referred to here as supply (i), exhaust (ii), indoor air curtain (iii), outdoor air curtain (iv), and insulation mode (vi) [8,9]. The appropriate ventilated window configuration depends on the method of operation as well as the climatic circumstances. For instance, a high supply air temperature to the indoor space in the cold season would be desirable [10]. Ventilated windows, which could be in principle deployed both in new and old buildings, have the potential to provide preheated ventilation air during the wintertime [11,12,13]. The supply air window is a modification of the multiple pane windows in which air is pulled in from outside then is heated through convection, conduction, and radiation within the cavity [12,14]. Solar radiation, absorbed by the louvers and glazing panels converts into heat, which is carried both to the interior and exterior space via conduction, long-wave radiation, and convection. Moreover, convection due to wind and buoyancy contributes to heat transfer between glazing panes [15]. The design and operation of ventilated windows must take a number of challenges into consideration. Open cavities raise issues such as security, acoustics, air quality, cleaning and maintenance, and condensation [16]. If falling below the dew point temperature, low surface temperature of glass panes may trigger condensation risk [8].
According to the previous studies, condensation occurs on the outer glass pane at the cavity side when the vents operate in reverse (i.e., when indoor air enters into the cavity). In general, this phenomenon occurs when the oscillating pattern of airflow through the vents is not sufficient to dispel the condensation from the surfaces [17]. The result of an experiment by Baker and Mcevoy (2000) indicates that when the doors of the test room (including the exhaust vents) are closed, the airflow velocity reduction inside the cavity can lead to condensation [17]. Other studies suggest that the application of single-layer glass as an outer pane can result in lower surface temperatures and condensation [18].
To achieve the optimum configuration of the ventilated windows, analyzing their thermal performance is essential. Hence, the thermal behavior of ventilated windows, or supply air windows, have received notable observation in the literature in the past few decades [8,14,19,20,21,22,23]. The thermal performance of the ventilated window has been investigated via experimental methods [8,24,25]. Oftentimes, experiments were conducted to validate either CFD or energy balance models or to assess the risk of condensation [8,17,25,26]. Experimental studies are of course highly instructive, but also rather expensive and time-consuming. This makes them less effective for parametric studies. Deployed carefully, CFD-based numerical simulations can provide alternative or at least complementary means of investigation [27]. As such, there have been advances in CFD application regarding ventilated windows. Some of the related studies have concentrated on the CFD simulation of the flow in the cavity [8,21,26,28,29,30,31,32], some have concentrated on the overall energy performance [25,33,34,35,36], and some compared supply air window with the other alternatives [37,38,39,40,41,42,43]. As many studies have confirmed, CFD simulation has the potential to yield high-resolution information about the flow field nature. Needless to say, the resources needed for detailed 3D simulations are considerable [25,27].
The study of the literature in this area reveals many different approaches to numerical simulation. This is due to the variety of possible geometric configurations as well as to the diversity of the heat transfer modes (natural or forced convection, with or without consideration of radiation). In this context, Table 1 summarizes the results of a comprehensive review of the topically relevant CFD applications (from the oldest to the most recent one). It entails information on the studies’ turbulence modeling approach, the solar radiation modeling approach, the main objective of the study and considered parameters, the type of the window, and if coupled (indoor airflow and outdoor wind flow), decoupled (just indoor airflow), two-dimensional, or three-dimensional simulations were performed.
As such, the review supported a number of observations:
  • The majority of CFD studies focused on (i) the heat gain capacity of the window, (ii) buoyancy-driven ventilation, or (iii) overall heat transfer within the window;
  • The standard k-ε or the RNG k-ε turbulence model has been widely implemented for CFD simulations of ventilated windows;
  • A large number of CFD investigations focused on DSF, whereas few addressed supply air windows [1,8,9,12,14,34,35];
  • The majority of the conducted studies were limited to 2D models and in many of these studies the solar radiation was not considered. In some cases heat sources were applied instead of solar radiation [5,28,31];
  • Some studies did not consider the dependency of material-related properties on temperature [8,10,12,21,25];
  • Most CFD models considered the thermal performance of windows under the assumption of a constant outdoor temperature and did not consider the wind impact. These factors are, however, important, when assessing the thermal performance of the ventilated windows;
  • The majority of studies did not consider indoor or outdoor conditions. In some cases [1,9,14,47,48,51], heat transfer coefficients for indoor and outdoor surfaces were considered. In one case, the radiative temperature on the glazing surfaces was considered [1].
These observations suggest that, despite considerable advancement in the CFD-supported study of ventilated windows, the intricate nature of heat transfer and airflow within a ventilated window is far from being fully understood. Therefore, further research in this area is needed.
Predicting the thermal performance of a ventilated window is not a trivial task. The cavity flow patterns are the consequence of various flows and simultaneous physical processes. These highly dynamic processes are in constant interaction with each other. This feature makes them depend on the geometric, optical, thermo-physical, as well as aerodynamic properties of the different window components. Moreover, the dynamics of indoor and outdoor temperatures, outdoor wind speed and direction, and solar radiation intensity influence the windows’ behavior [8,15,26,48,57]. Hence, to consider a ventilated window in building physic simulations, various phenomena must be considered (Figure 2):
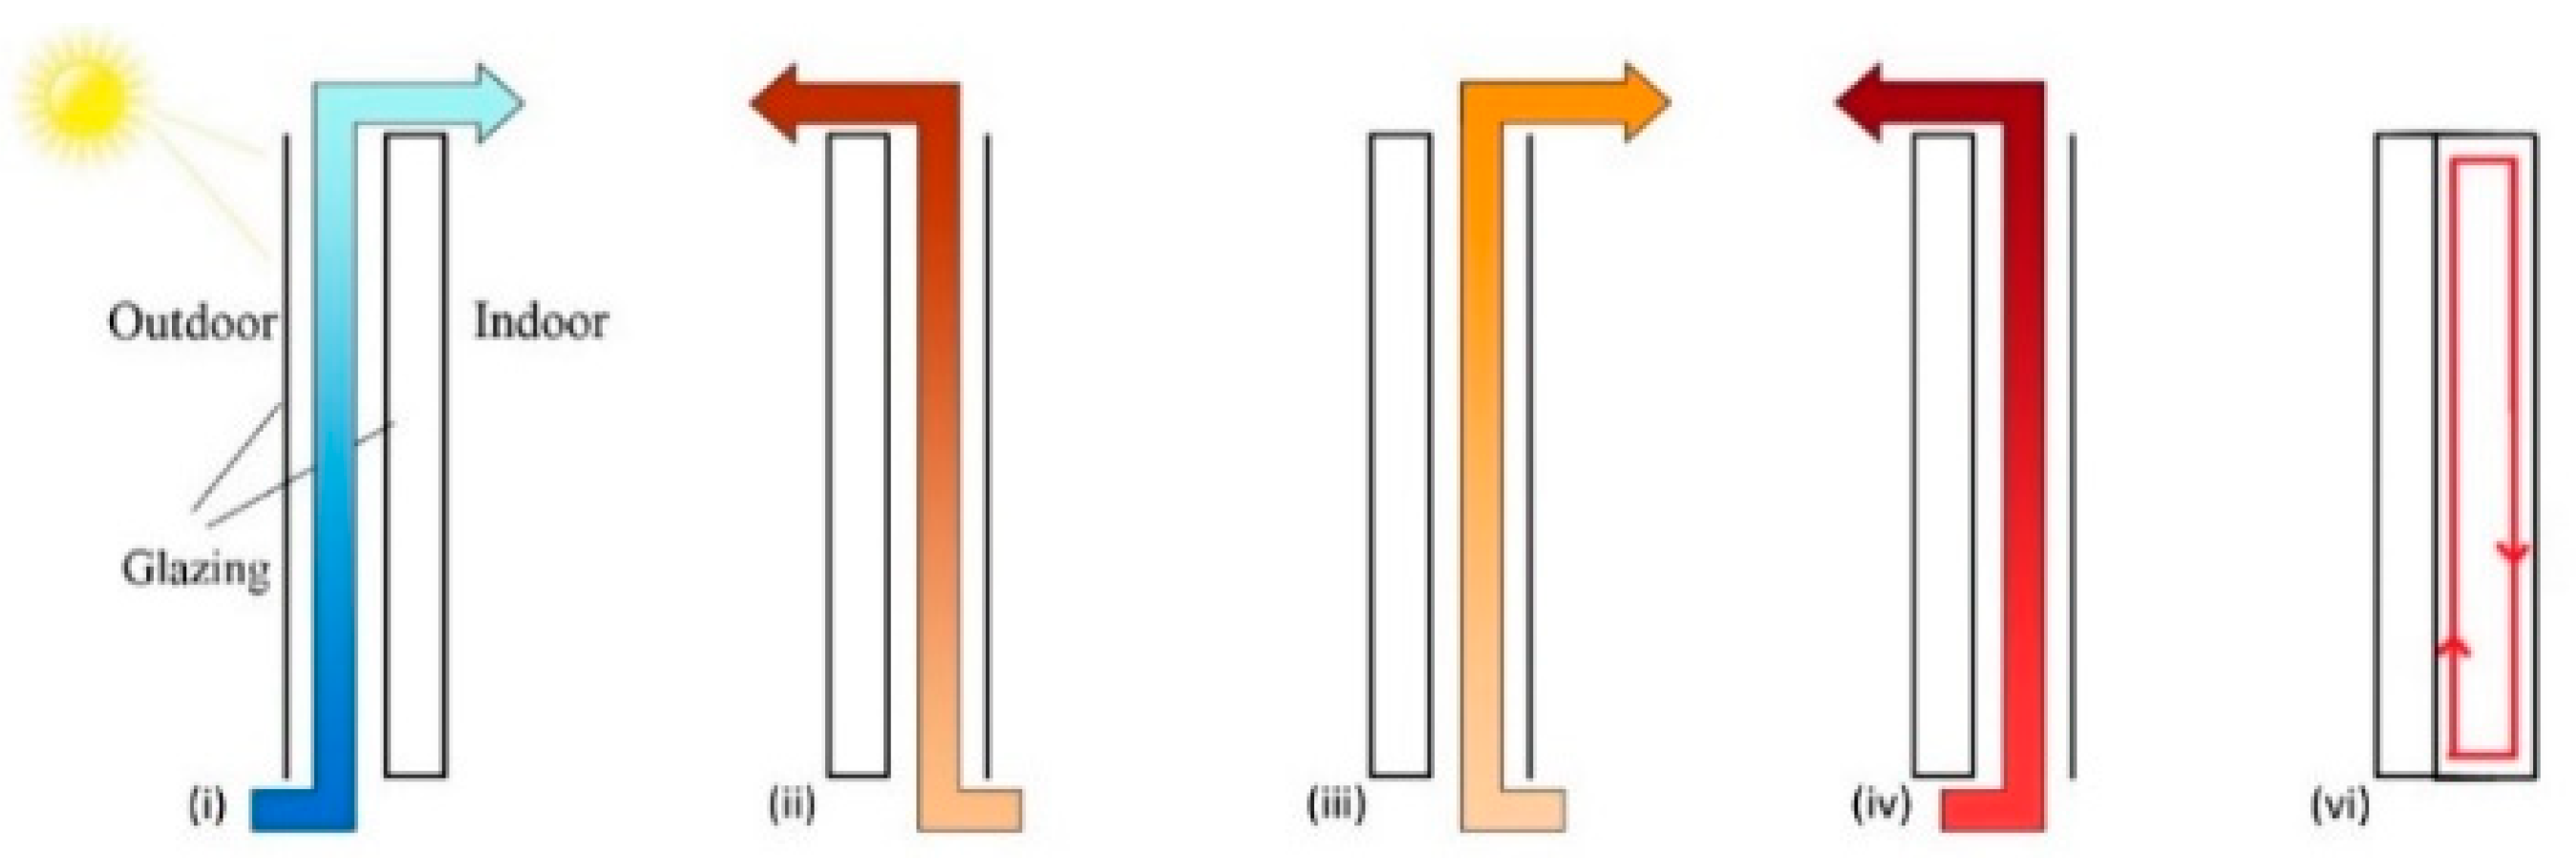
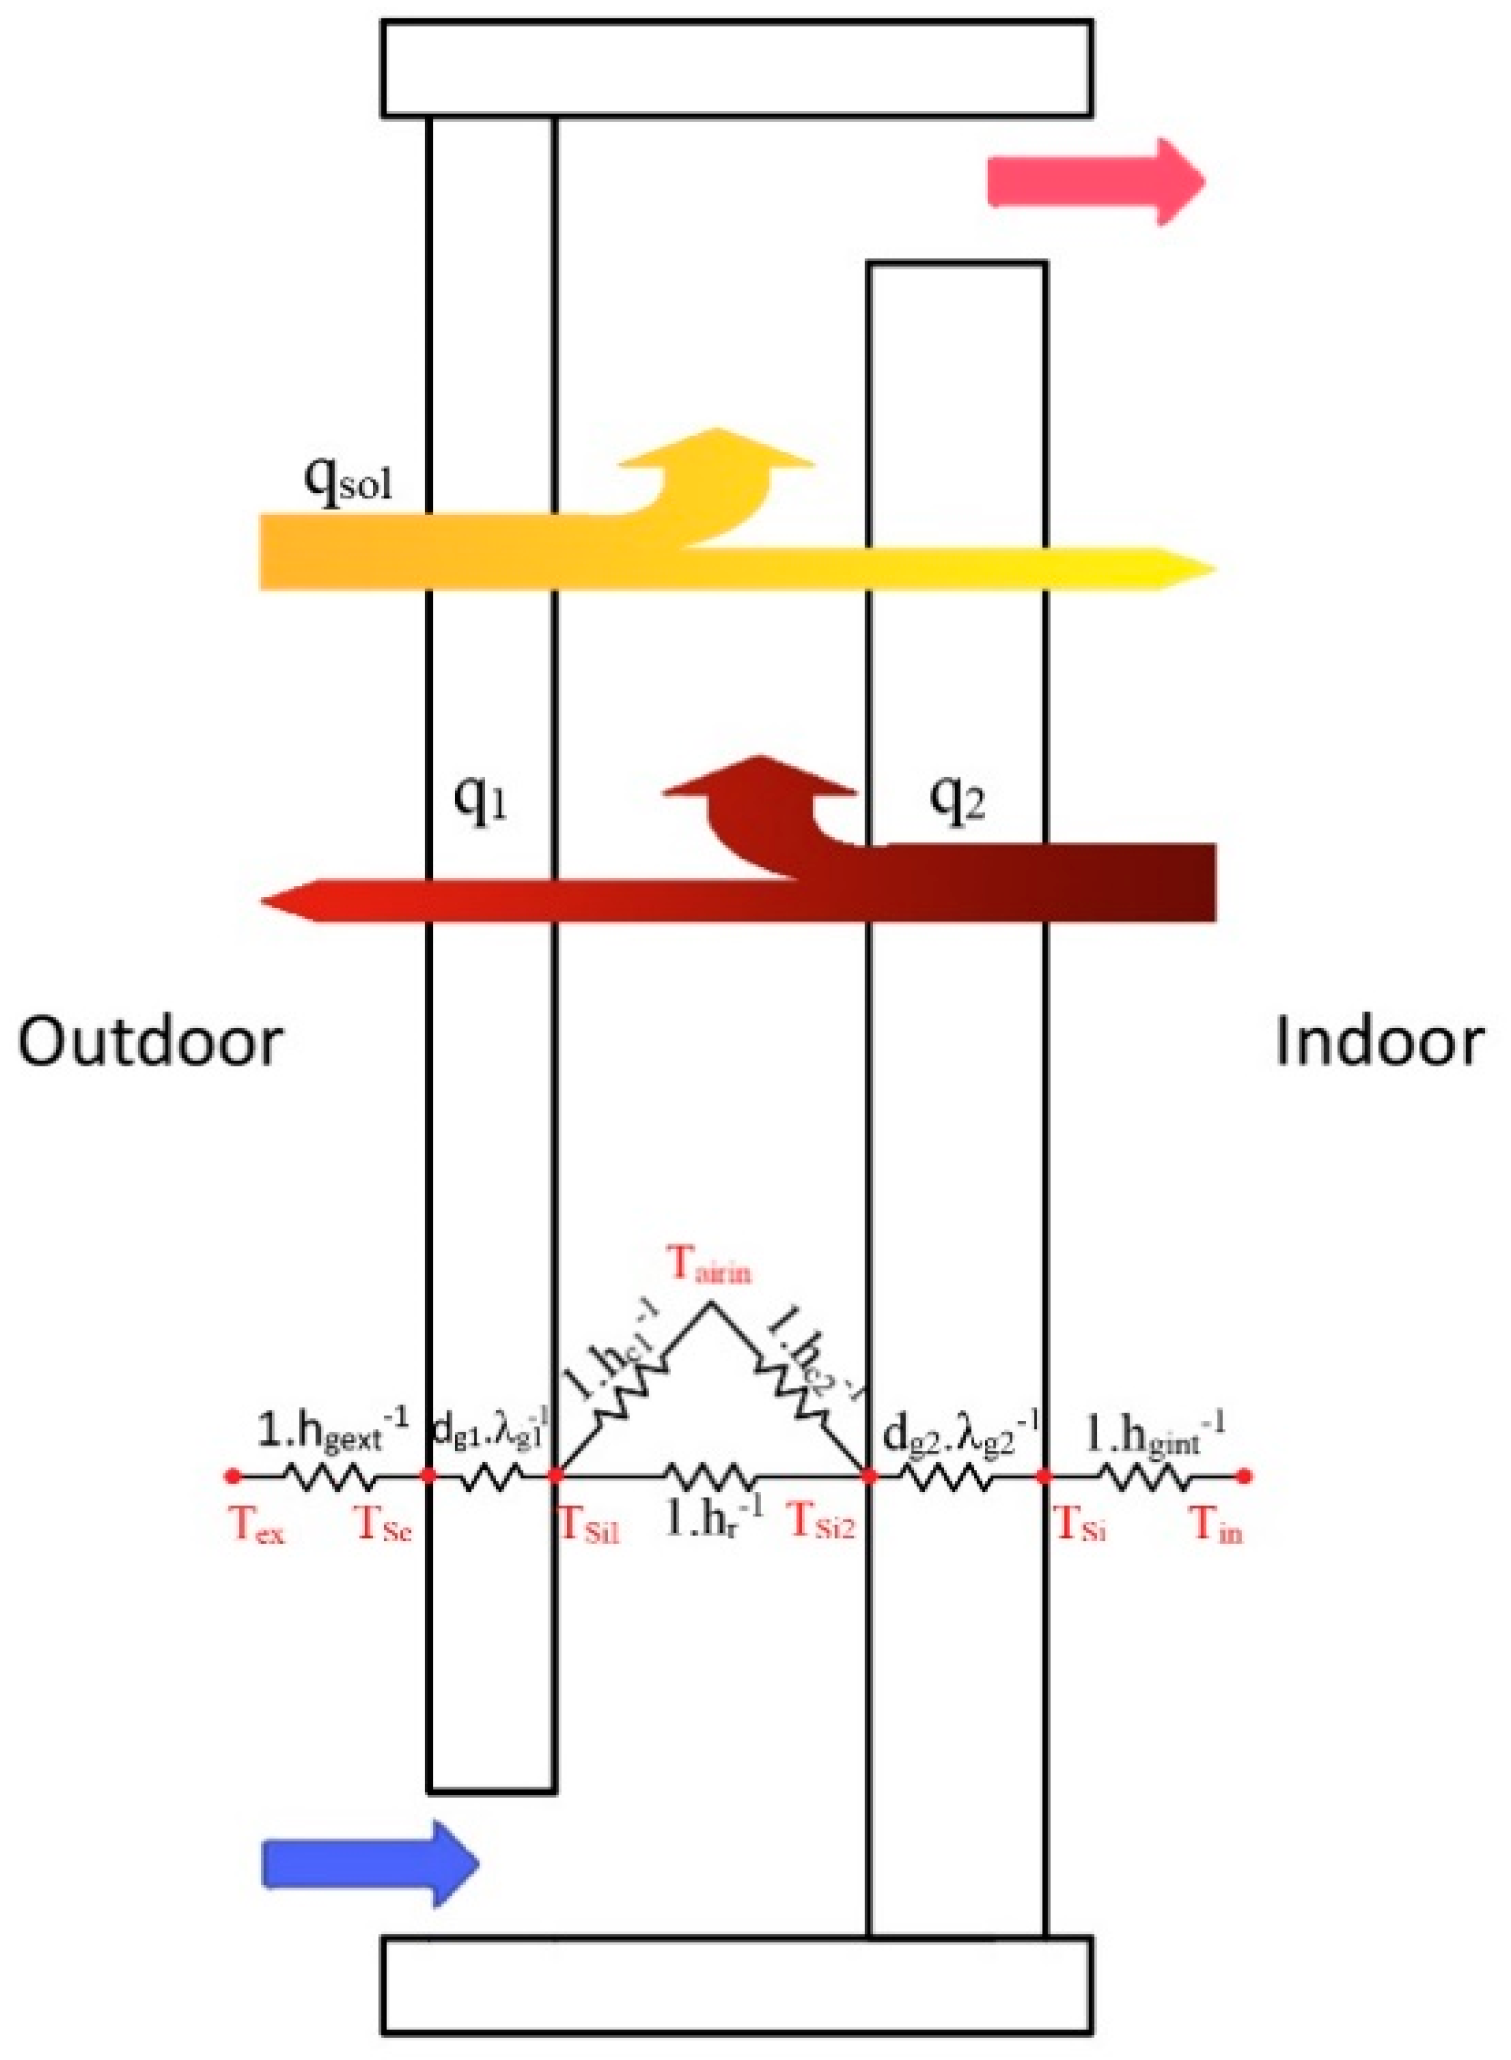
  • Conductive heat transfer within the glazing layers;
  • Convection and long-wave radiation between the inner glass and the inside environment, between the outer glass and outdoor conditions, and also within the glazing panes;
  • Convective heat transfer among the glazing panes caused by airflow (unknown convective coefficients in the windows interstitial cavity makes the modeling challenging);
  • Absorbed solar radiation by the glass panes [1].
Given the complexity of the physical processes involved, a candidate simulation model should ideally incorporate complete three-dimensional processes, suitable turbulence models, solar radiation influences, realistic boundary conditions, and temperature-dependent material properties [14]. The simulation models should be also tested and—to the extent possible—calibrated against measurement data.
In this context, the present study concerns the investigation of a supply-type ventilated window in terms of its emergent field characteristics (velocity and temperature distribution) and thermal performance.

2. Methodology

As mentioned earlier, in this study the thermal behavior of ventilated window cavities with buoyancy-driven airflow was investigated through the CFD simulation. The following variables were considered in the simulation:
(1)
Environmental conditions:
  • Outdoor air temperature;
  • Insolation (double-layered glazing).
(2)
Cavity geometries
  • Depth: 50, 25 mm;
  • Height: 2.0, 1.0 m;
  • Opening width: 24, 12 mm.
The values of these variables were computed by numerically simulating the heat transfer within the window and solving the model in a commercially available CFD code. Moreover, available measured data obtained from an empirical set-up were applied to evaluate the CFD model and examine the heat gain ability of the window as well as the effect of solar radiation on temperature distribution and ventilation behavior. The CFD model was subsequently utilized to compute air temperature and air velocity distributions. A CFD-based approach can support the detailed study of the complex flow and thermal characteristics of ventilated windows [35]. Our main objective here was to explore the optimization potential of the window design with regard to the geometry of the cavity (height, depth, opening size) as well as the position of the double-layered glazing (inside versus outside). Condensation risk of the outer glass pane at the cavity side was evaluated for each case.

2.1. Modeling the Ventilated Window

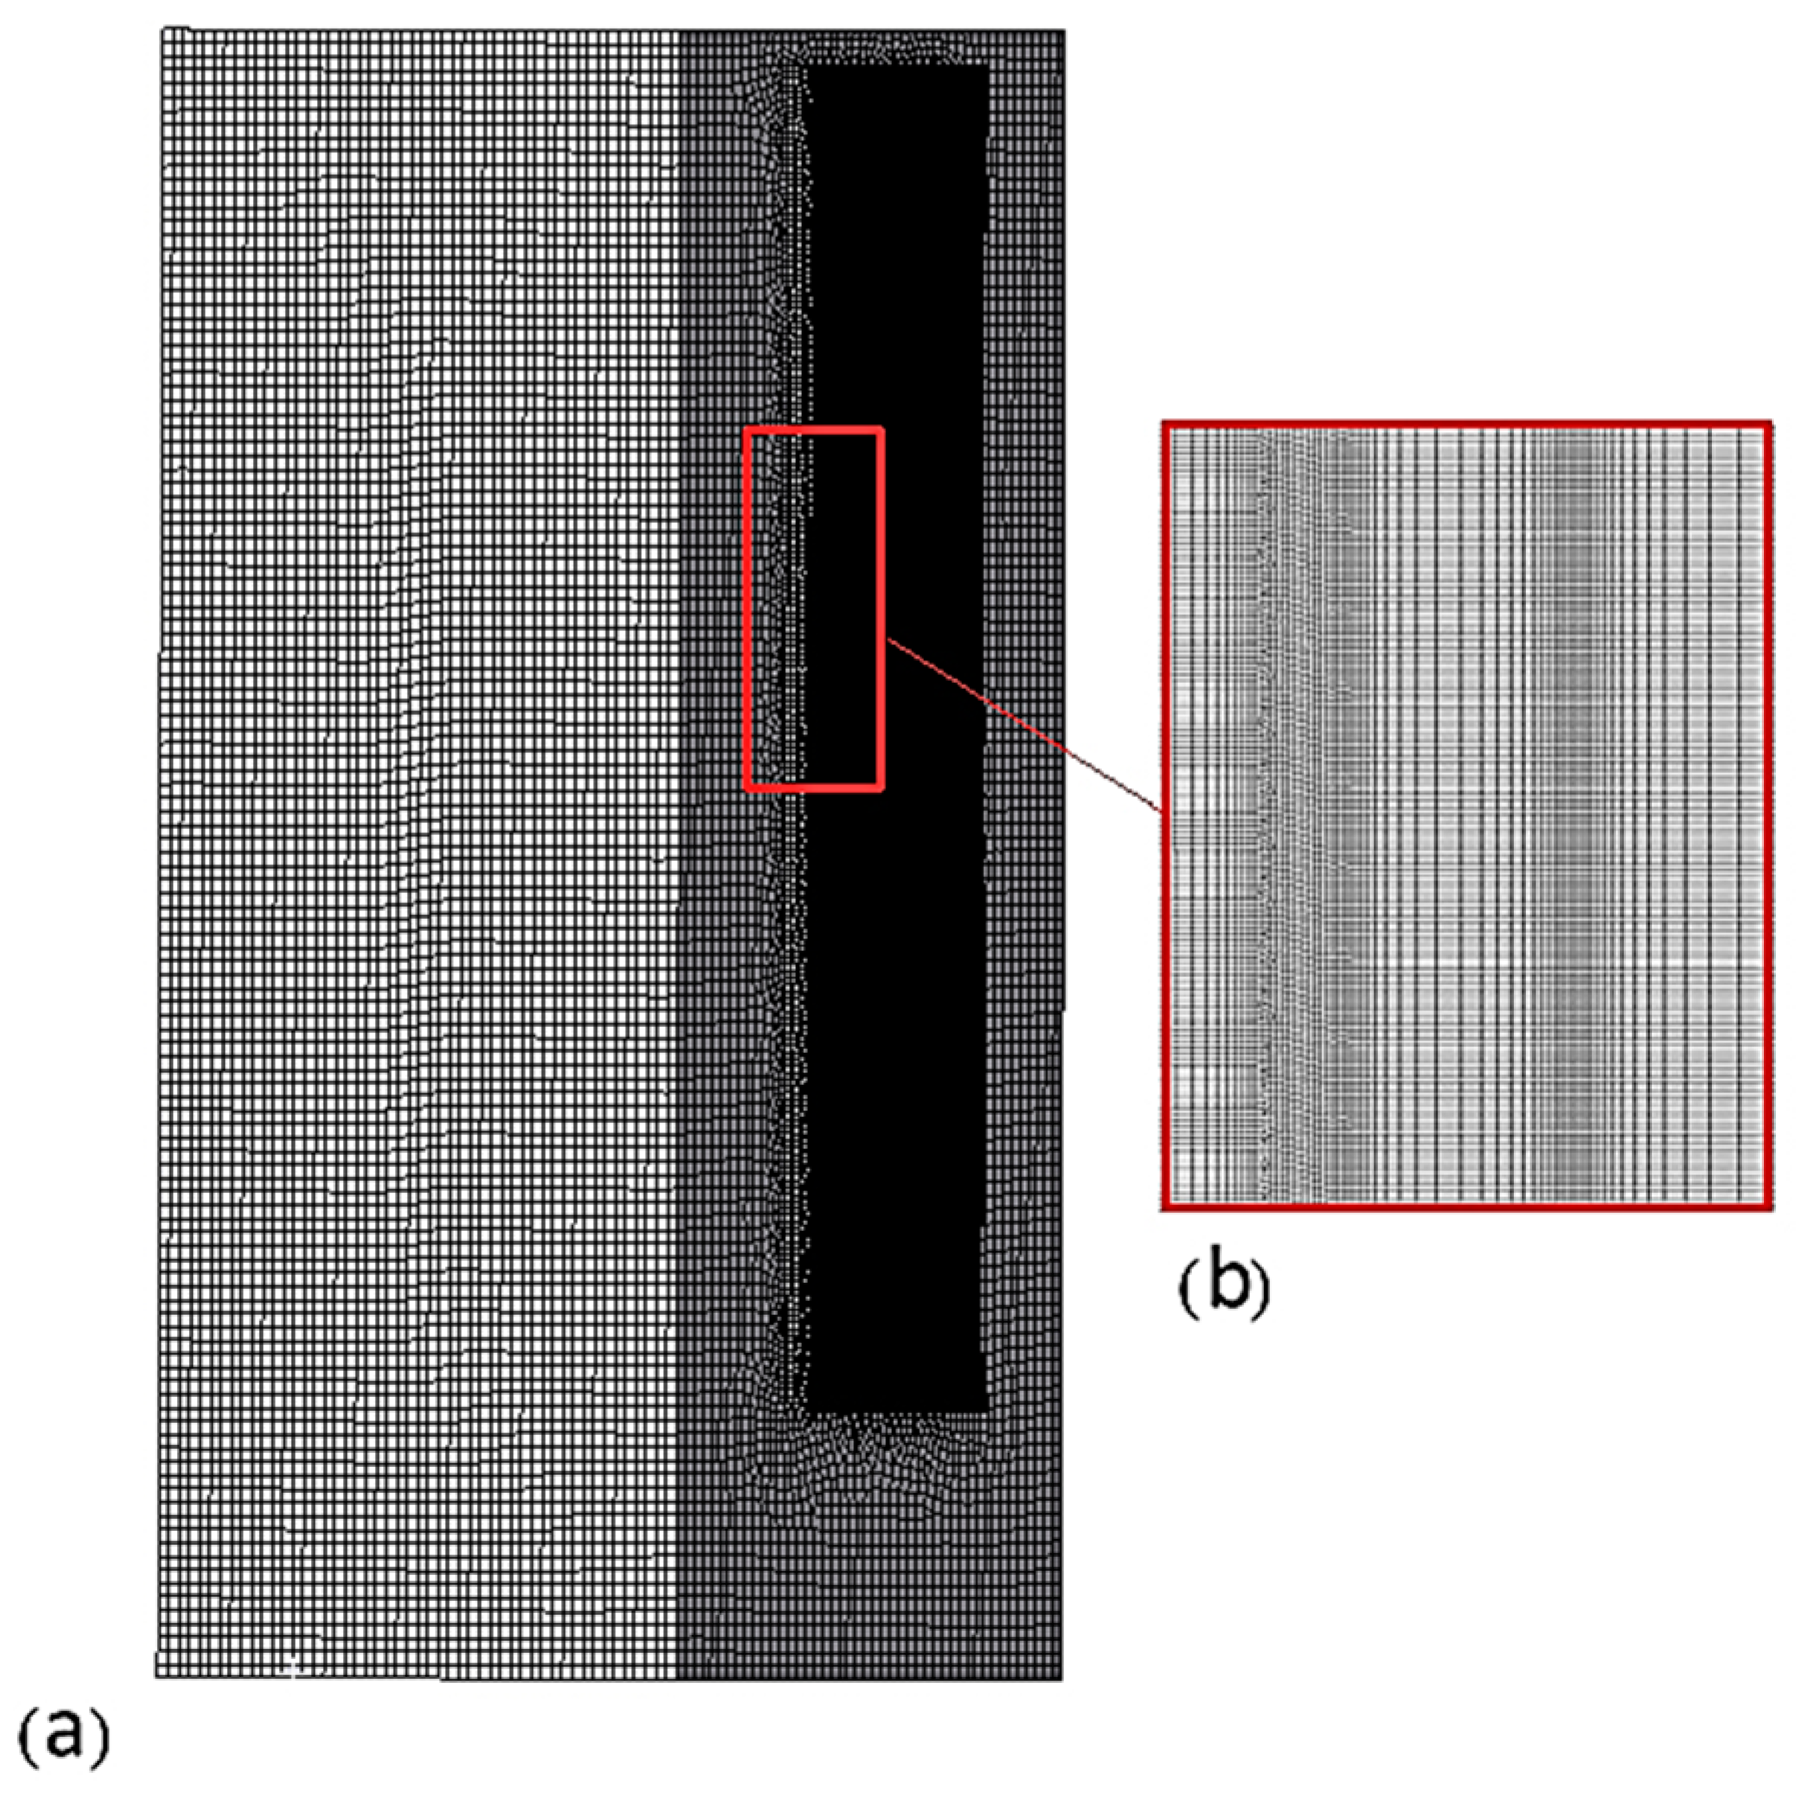
2.1.1. The CFD Model

The simulation included buoyancy-driven air flows resulting from solar and thermal radiation and conduction within the ventilated window system.
The results of CFD simulations were highly sensitive to the boundary condition assumptions [34]. The total solar energy transmittance depended on outdoor conditions (air temperature, radiant temperatures, solar radiation, wind), indoor conditions (air and radiant temperatures, air velocity), façade geometry, optical (solar reflectance and transmittances), and thermal properties (emissivity, thermal conductivities) of all layers [28]. A previous study indicates that the precision can be enhanced by modeling ambient outdoor conditions [58]. Hence, to simulate the thermal performance of the ventilated window, the analysis applied high-resolution coupled (outdoor wind flow plus indoor space) 3D steady Reynolds-averaged Navier–Stokes (RANS) computational fluid dynamics (CFD).
The finite volume code applied was ANSYS FLUENT 19.0 [59]. Ansys design modeler and Ansys meshing were applied as a pre-processor to create the geometry, mesh, and the computational domain. Figure 3 represents the computational domain.
In this model, a mesh with a hexahedral element was generated. A finer mesh was applied between the glass sheets to achieve higher resolution concerning the air movement in the cavity. The mesh and the relevant number of cells was a crucial parameter that strongly affected the computational time [58]. A grid independence study was performed to assure the sufficiency of the mesh density. To check the grid independency, different mesh sizes were applied to the cavity. The mean temperature and mean velocity of the cavity were monitored, and the results are presented at the Table 2.
For different element sizes, almost the same temperature and velocity value were obtained. Based on these results, the mesh size of 4 × 4 mm was selected for the cavity. The total number of the mesh for the whole domain was 2,939,898. Figure 4 displays a vertical section of the cavity grid generation.
The inflow section of the outdoor space was set as a velocity inlet boundary and the parameters were set according to local meteorological parameters. The outflow section of the outdoor space was set as a pressure outlet boundary and the lateral section was set as a symmetric boundary. A constant value of 8.7 (W·m−2·K−1) was assumed for the heat transfer coefficient between the inner pane of the internal façade and the indoor air, and the indoor air temperature was set at 20 °C corresponding to the experimental conditions, described later in this paper [60].
Due to the transient variations of solar radiation and outdoor air temperature, the thermal behavior of the window units was rather dynamic. However, due to their relatively small thermal mass, the glazing units reacted relatively swiftly to the dynamics of prevailing thermal conditions. Based on this observation, and given considerations pertaining to computational efficiency, thermal processes in the ventilated window were modeled assuming a steady-state mode [47].

2.1.2. CFD Setup

As mentioned above, the present study applied a three-dimensional domain in a steady-state mode. The conservation equation for mass, momentum, and thermal energy, which is known as Reynolds-averaged Navier–Stokes equation, was solved to predict the field variables temperature and velocity. The subsequent partial differential equations—(1) continuity equation; (2) momentum equation; (3) energy equation—were utilized as a governing equation concluded from the mass conservation law, and conservation law of momentum [52].
t ( V   ρ d V ) + A   ρ V r . d a = 0
t ( V   ρ d V ) + A   ρ v r v . d a = A   p I . d a + V   f b d V
t V   ρ E d V A   [ ρ H V r + v g p ] . da = A   q . d a + A   T . v d A + V   f b . v d V + V   S E d V
where v presents continuum velocity, v r is the relative velocity; V is volume; a is the area; p is the pressure; I is the unit vector; T presents the viscous stress tensor; E is the total energy; H is the enthalpy; q” is the heat flux vector; is a Kronecker product; and S E radiation energy source.
Buoyancy due to density change was applied in the energy equation. The discrete ordinates (DO) model was applied as the radiation model [15,61]. This model was suitable for modeling glass, a semi-transparent media [8]. Three radiative processes were mainly relevant for the window system, namely the incident solar radiation, radiation exchange between glass panes, and inward thermal radiation. The widely deployed K-ɛ realizable turbulence model was applied [58,62]. The pressure-based solver was applied [20]. The SIMPLE segregated solver was used for pressure–velocity coupling [20]. The discretization scheme employed for the energy, momentum, turbulent kinetic energy, and specific dissipation rate was the second order upwind scheme. The pressure staggering option (PRESTO) was used for the pressure discretization scheme. Gradient reconstruction was done using the least squares cell-based method [20]. The acceptable residual limits were set at <10−3 for continuity, x, y, and z momentum, turbulent kinetic energy, and turbulent specific dissipation, whereas this limit for energy was <10−6 [20]. Monitors for area weighted static temperature on the supply vent, maximum velocity within the cavity space, and supply vent mass flow rate were set up. When the changes in the monitor variables were less than one percent, the monitors were considered as stable. Three types of materials were applied in each simulation, namely transparent fluid (air), semi-transparent solids (glazing), and opaque solids (frames and walls) [63]. Table 3 summarizes the thermal conductivity and solar (infrared) property of the layers. These parameters were adopted from ASHRAE Fundamentals Handbook [63].
To evaluate the CFD model’s reliability, a reference case which corresponds to the actually implemented experimental setup was considered [60]. Figure 5 schematically illustrates the vertical section of the ventilated window with free convection that was applied as a reference case. To generate information relevant to design considerations, first the effect of height of the cavity was evaluated. Second, the influence of the cavity depth, and then the width of the opening and the position of the double-layered glazing were analyzed.

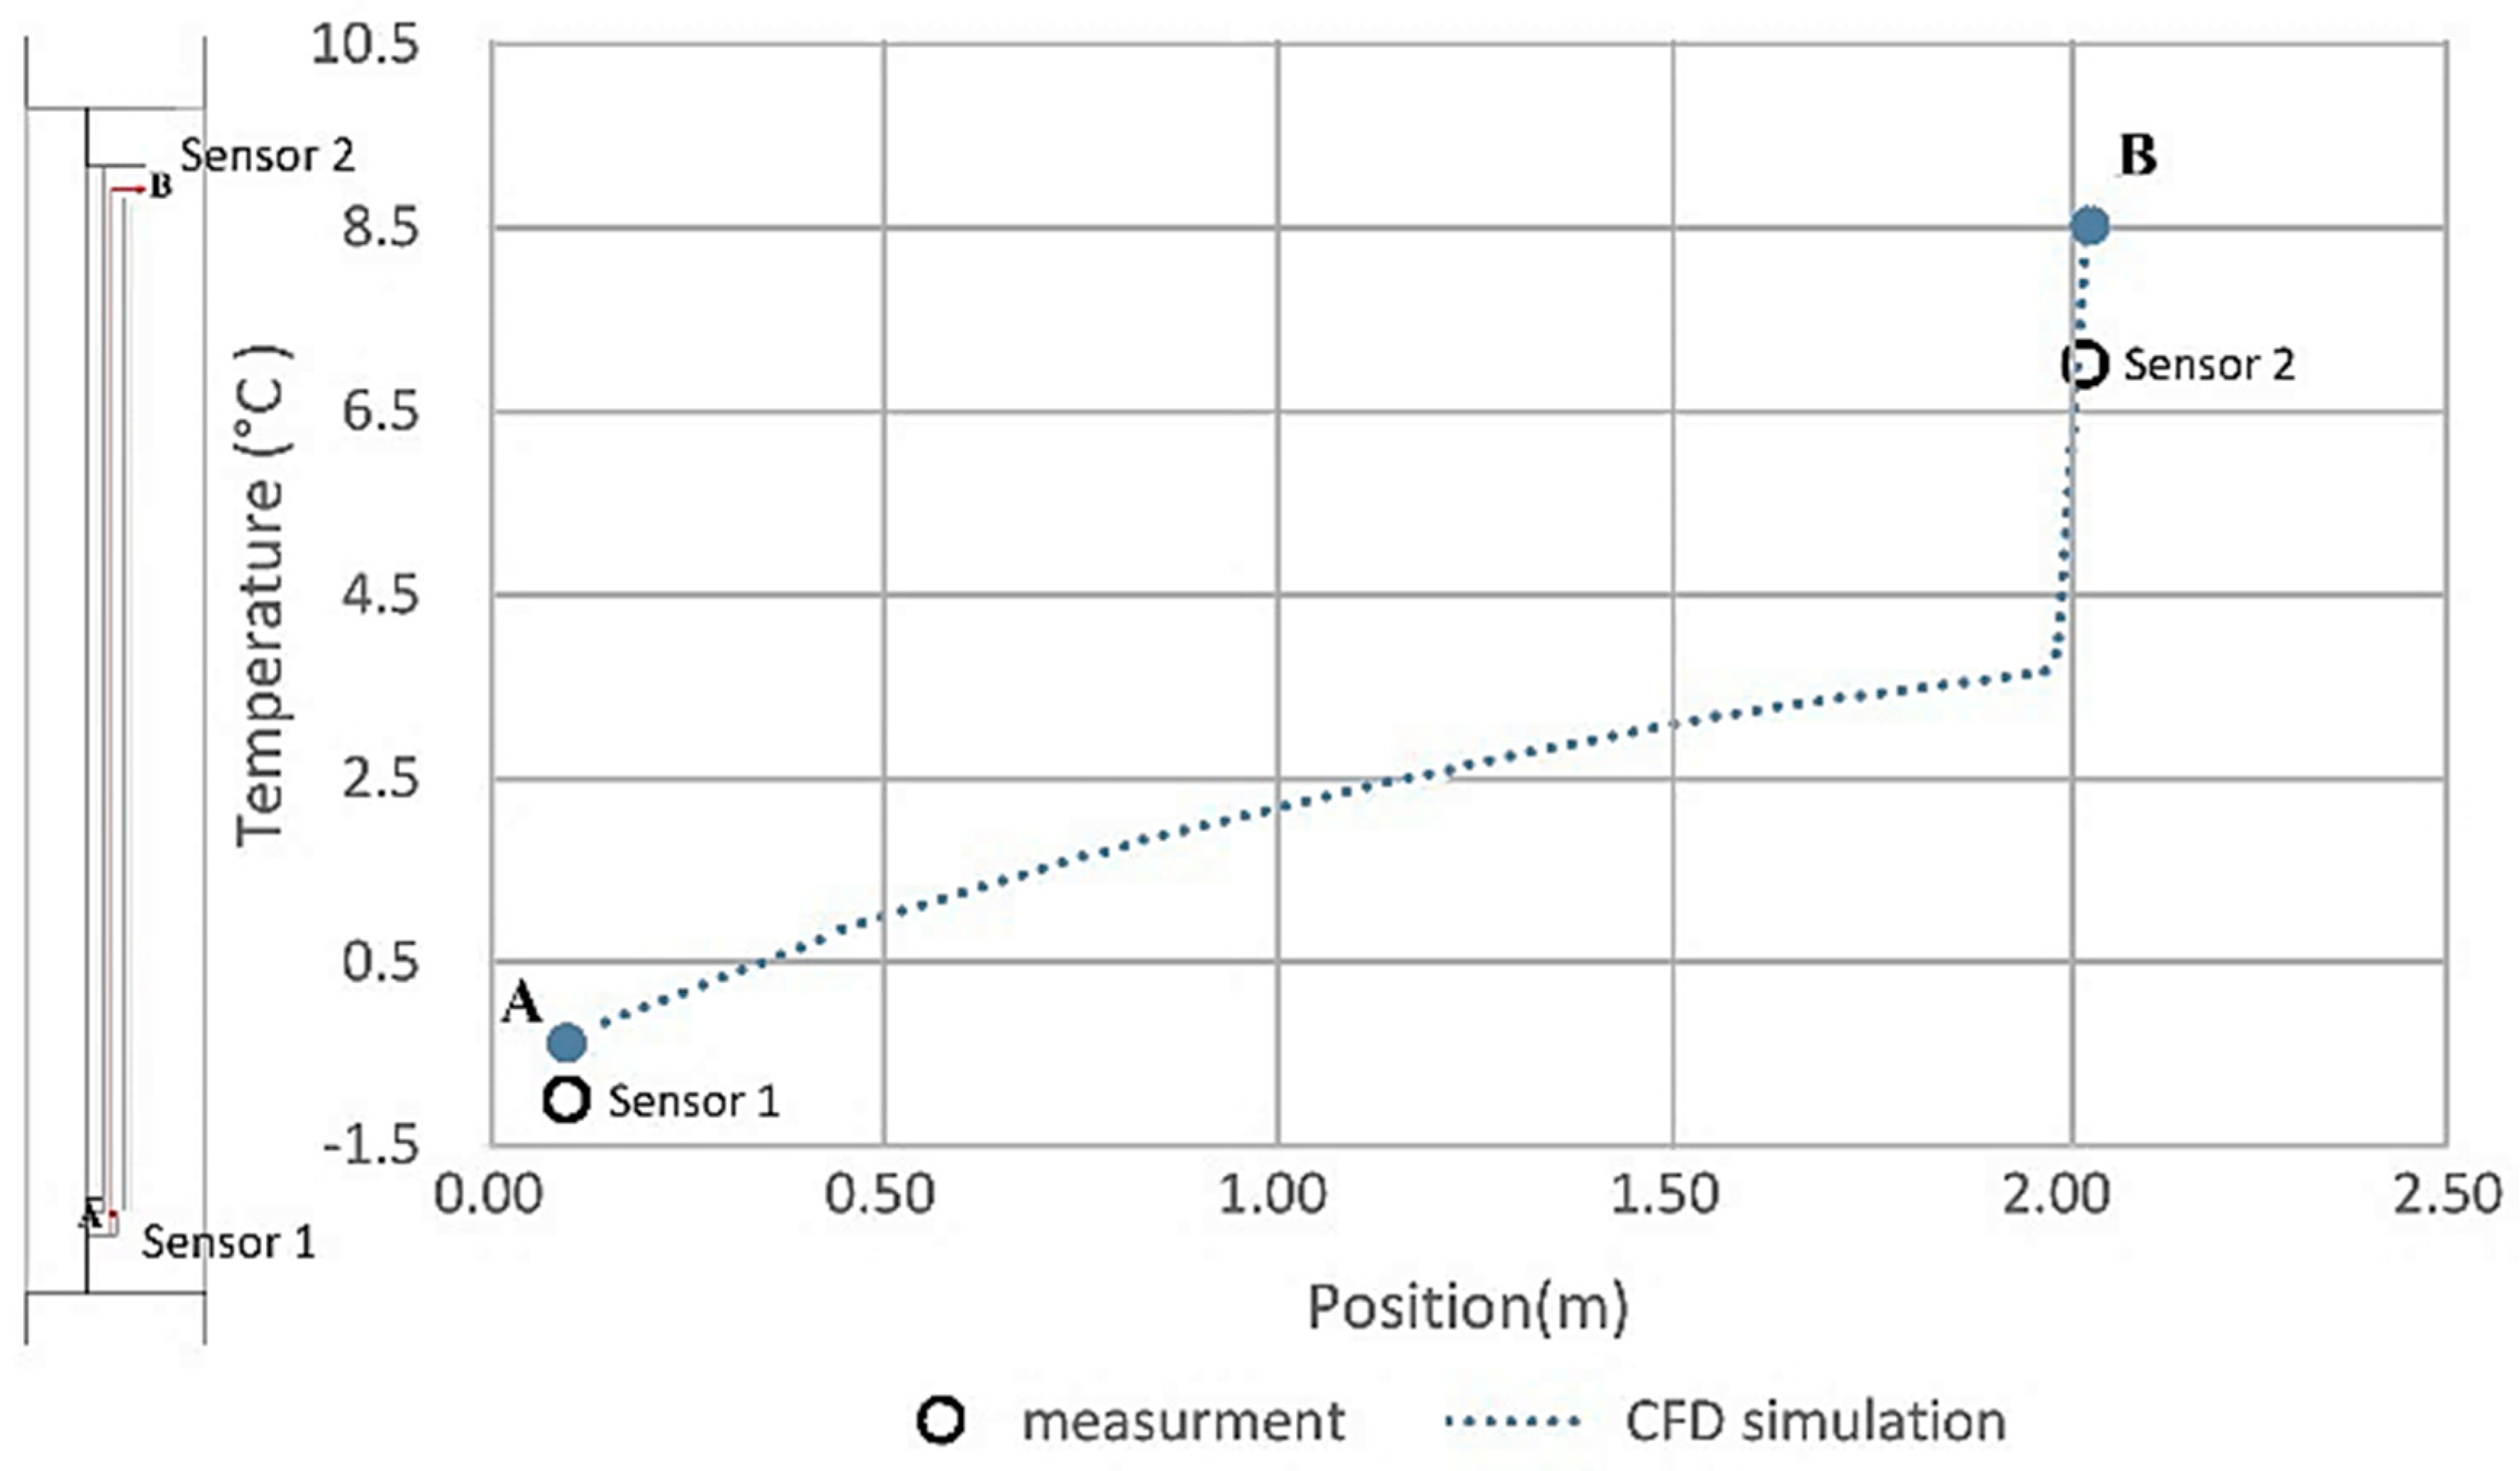
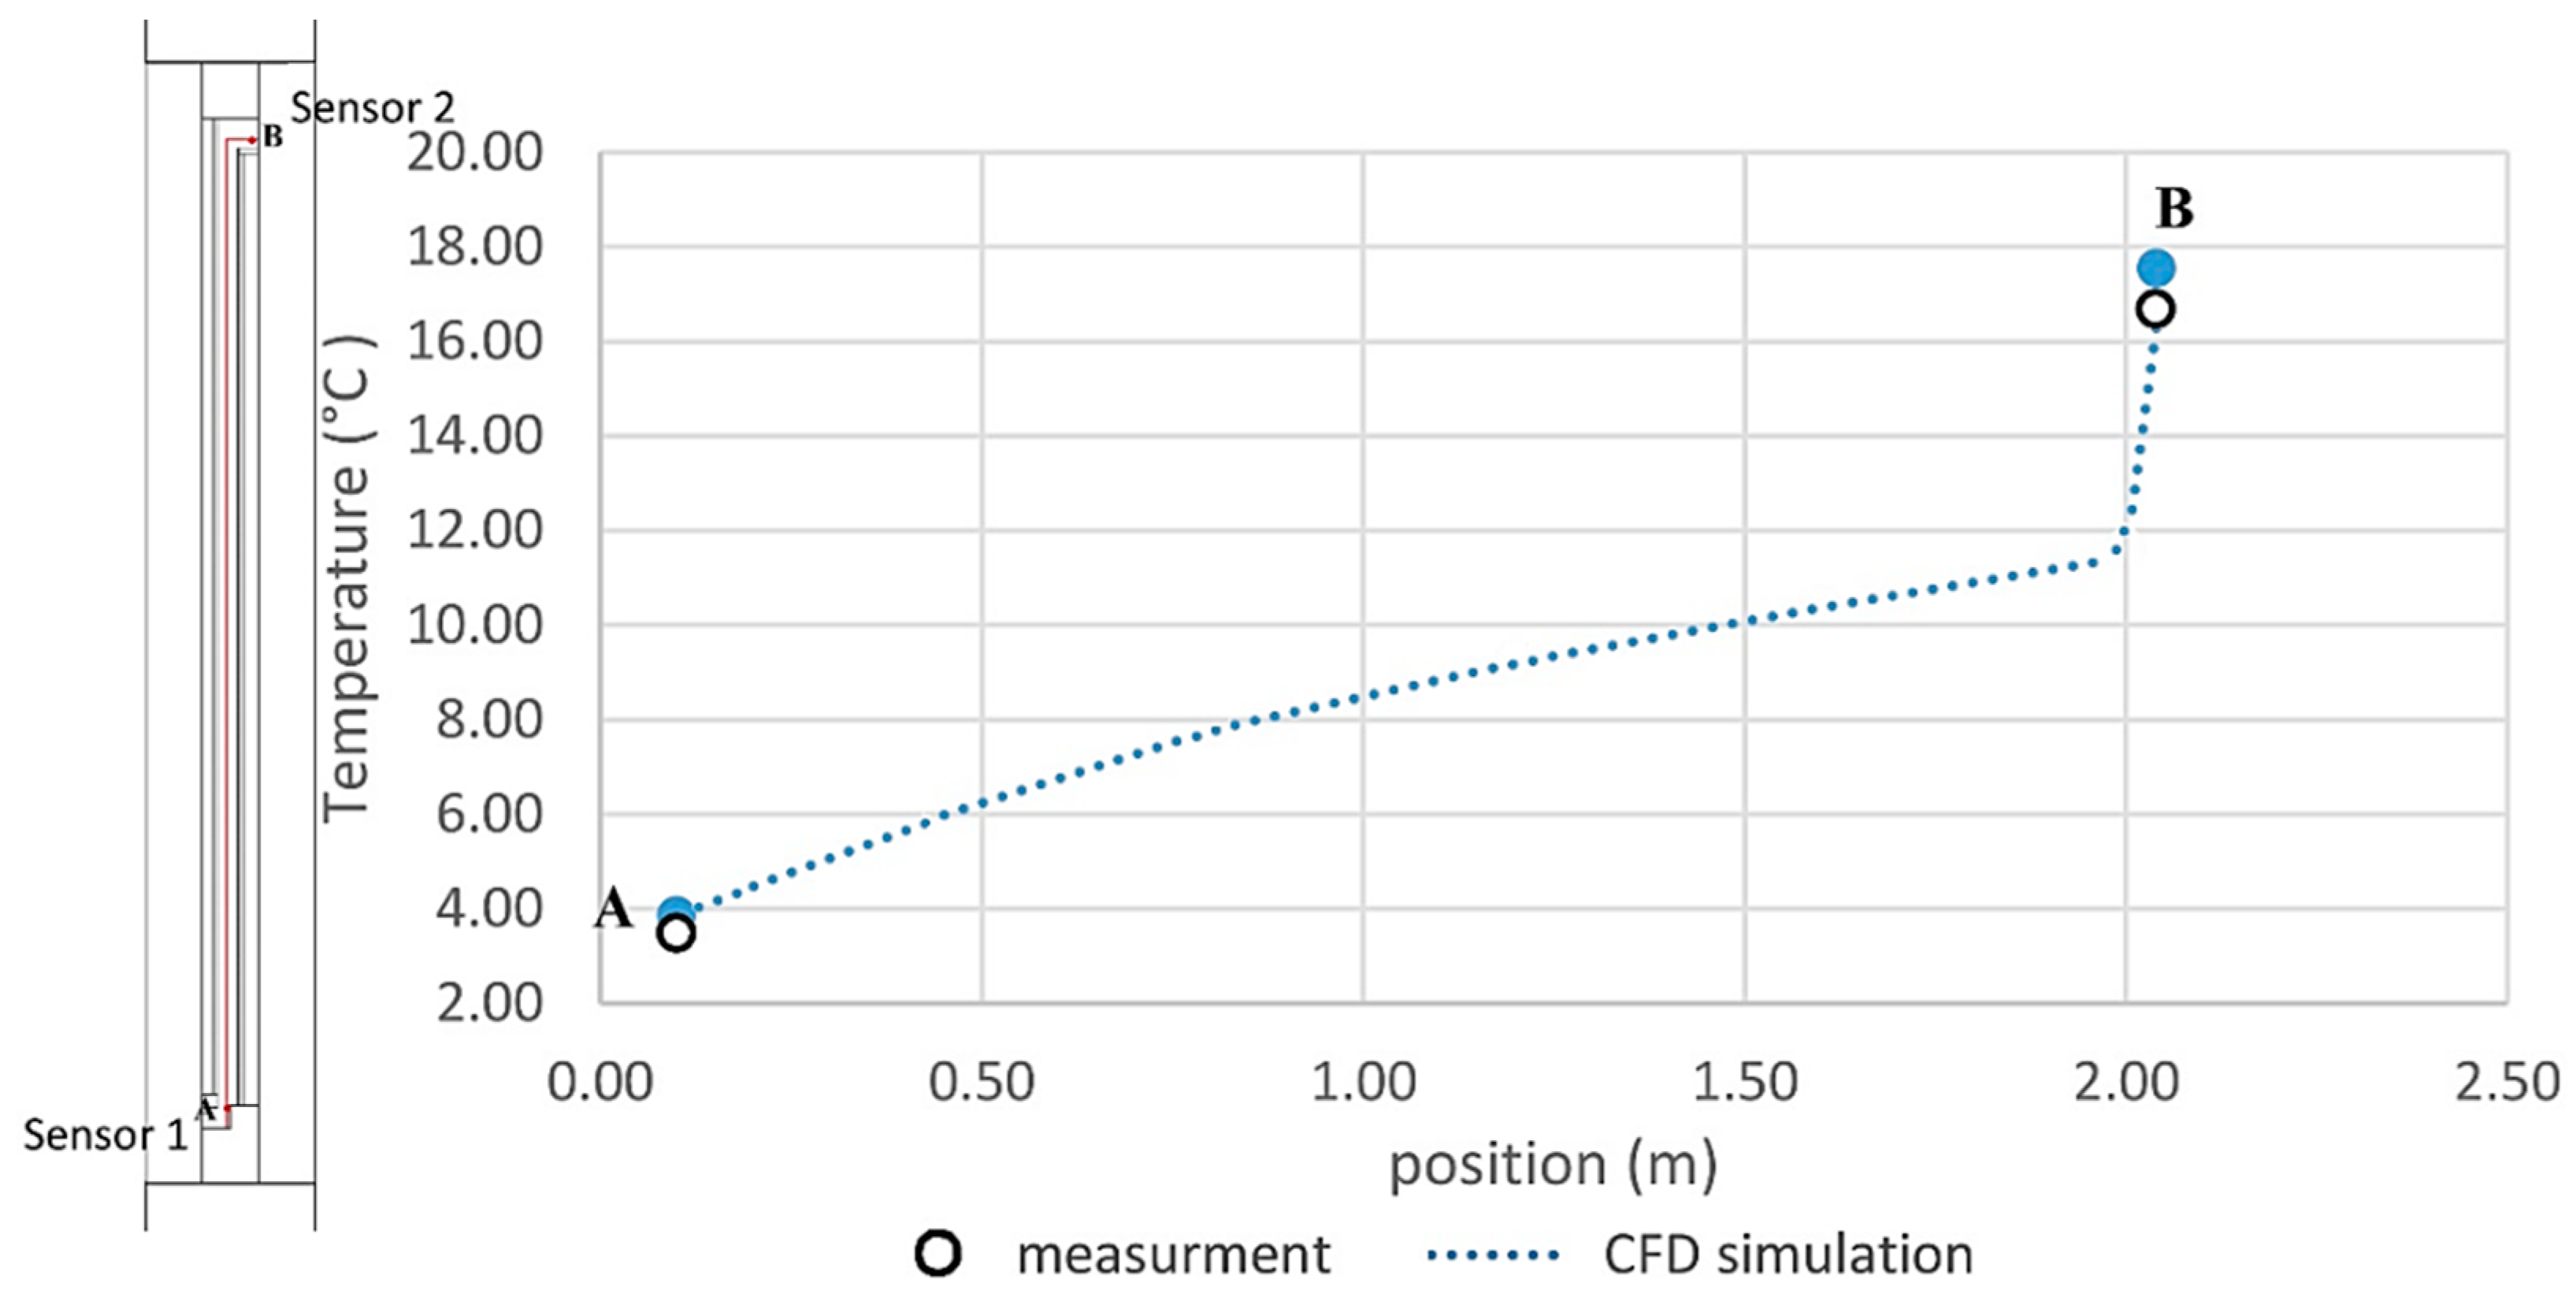
3. Comparison with Measurements

3.1. Laboratory Test

The ventilated windows under optimum flow conditions can operate as a heat gain device. Escaping indoor space heat through the inner pane enters the window cavity and returns into the room [64,65]. These features enable the window to function as a passive solar element. The window’s ventilation ability, as well as heat loss recovery, was examined in the laboratory tests, and subsequently, the effect of solar radiation was analyzed in the field trials by “Holzforschung Austria” [60].
To examine the performance of the CFD model, the simulation results were compared with measurement data from both trials (laboratory and field test). The aim of the laboratory test was to estimate the capability of ventilated window to preheat the supply air. To this end, a mock-up ventilated window (1.2-m wide and 2.1-m high) was installed in a window test facility. Outside and inside air temperature was set to −1 and 20 °C respectively. A pressure difference of 5 Pa between indoor and outdoor was generated in the test facility. During the laboratory test, thermocouples with a measurement accuracy of ±1.5 K were installed to measure air and surface temperature [60]. The CFD simulation model replicated the experimental configuration, also in terms of the boundary conditions. Figure 6 illustrates the temperature distribution profile (along the depicted path) obtained from the CFD simulation, together with the measured temperature at two sensor locations in the window specimen.
The measurement results documented the potential of the ventilated window to pre-heat the incoming air for ventilation during the winter season. Simulation results may be suggested to agree in tendency with the measurements. The larger disagreement between simulated and measured value in case of sensor 2 may be due partially to the difficulty to superimpose the position of this sensor in reality and in the simulation model.

3.2. Field Trial

As stated earlier, the results achieved from the numeric model were compared to the results of field trial measurements. The aim of the field trial was analyzing the thermal performance of the ventilated window and the influence of solar radiation under real outdoor climate conditions [60]. The location of the field trial was Stetten, Austria (latitude: 48°14’ N; longitude: 16°21’ E). A 1.2-m wide and 2.1-m high ventilated window was installed in the Holzforschung test facility [60]. The west side of the façades was exposed to real weather conditions and the other side faced the thermally conditioned room. The tested window had a sealed double-glazing on the interior side and a single uncoated glass pane on the exterior. All glass panes were 4-mm thick, the air gap was 50 mm, and the argon-filled cavity in the double-sealed glazing was 12 mm. The inlet valve-in was positioned in the bottom frame and the air was sucked under the external sash. Measurements of the temperature were made along the window air gap. The air speed, the solar irradiance on the west-facing vertical surface, and the outdoor and indoor air temperatures were recorded every 10 min over five winter days (11–16 January 2016). During the experiment, indoor temperature was kept at an almost constant level (around 20 °C). Standard equipment was installed to monitor and record temperature, global and diffuse solar irradiation, wind speed, and humidity. The measurement accuracy of the air temperature sensors and thermocouples were ±0.1 and ±1.5 K, respectively [60].
The experimental results did not reveal any significant relationship between wind speed and the air temperature in the ventilated window’s cavity. On the other hand, the solar radiation was shown to have a strong influence on the air temperatures in the buffer space. Generally, the measured temperature of the air supplied to the space was found to be between 10 to 20 K higher than the outdoor air entering the window’s inlet [60]. A one-hour-long segment of measured data from the first day of measurements could be identified as involving relatively small fluctuations of the boundary conditions. We thus could treat this period as a quasi-steady state. The registered mean values of the boundary condition during this one-hour period (13:00, 11 January 2016) were treated as the applicable boundary conditions for the CFD simulation model (see Table 4).
In addition, in this case, the simulation model overestimated the temperatures at positions A (3.9 instead of 3.5 °C) and B (17.48 instead of 16.7 °C). However, the simulated air temperature increase (13.6 K) in the cavity matched fairly well with the measured value (13.2 K). Figure 7 presents velocity and temperature distribution within the cavity.
Given steady-state boundary conditions, the effective capacity of ventilated windows in terms of preheating magnitude of the outdoor air may be expressed in relative terms as follows:
η = θ s θ e   ·   θ i θ e 1 ,
In this equation, η denotes a measure of the window’s preheating capacity under specified boundary conditions, and θs, θe, and θi denote supply air temperature, outdoor temperature, and indoor temperature, respectively. As applied to previously described experiments, the η-value can be shown to be 0.49 for the laboratory experiment and 0.84 for the field trial. This difference can be readily explained given the presence of solar radiation and the associated warming effect in the case of the field trial. Figure 8 illustrates the temperature distribution in the window’s cavity as computed by CFD simulation together with the measurements obtained from the two sensors.

4. Results and Discussion

4.1. Thermal Performance of Ventilated Window Configuration

As mentioned before, the main goal of the present contribution was to computationally examine the effects of the height and depth of the cavity, width of the supply air opening, and the position of the double-layered glazing (inside versus outside) on the performance of the ventilated window. Note that the assumed boundary conditions matched the previously mentioned assumptions in the case of the field trials, namely 20 and 3 ℃ for indoor and outdoor temperatures, respectively (see Table 4). The solver settings were indistinguishable from those used for comparison with the experiment. Generally, the thermal performance of a ventilated window can be assessed by four criteria, namely (i) airflow rate through cavity openings; (ii) average cavity air temperature; (iii) incoming air temperature; and (iv) heat flux through interior glazing [34,66].

4.1.1. Cavity Height

The complex convection fluid flow induced by solar radiation within the interstitial space depends strongly on the height of the cavity [27,35]. A taller cavity is more exposed to the solar radiation and consequently, provides a more effective buoyancy force [34]. To evaluate the effect of cavity height, the thermal behavior of two ventilated windows under the identical boundary conditions and different height (1 and 2 m high and 0.050 m cavity depth) were estimated. To decrease the number of influencing parameters, the dimensionless aspect ratio was applied. The aspect ratio describes the ratio within the entire cavity height and the cavity depth [67]:
A = H·L−1
Here, A represents the aspect ratio, H is the height of the cavity, and L represents the thickness or depth of the cavity.
Table 5 includes the simulation results for the aforementioned cases. The table also includes the computed air flow rates as well as the values of the aforementioned heating capacity indicator η, plus aspect ratio.
The results suggest that the window with the higher vertical dimension and aspect ratio provided higher incoming temperature, as a larger part of the glazing was exposed to the solar radiation.

4.1.2. Cavity Depth

A previous study determined that in the case of double-skin façades, the cavity widths does not have a substantial impact on the overall thermal behavior [34]. Hence, the decision regarding the sufficient depth of the cavity is based on the following parameters: (a) Considering ventilation requirement; (b) providing adequate space for the shading device; and (c) cleaning and maintenance [34]. To investigate the effect of cavity depth on the thermal performance of the ventilated window, two cases with different cavity depths (25 and 50 mm) were evaluated. Note that the dimension of the window kept as 1-m high and 1-m width. Table 6 provides the numerical results of the simulation.
According to these results, the supply air temperature was slightly higher in the ventilated window with a smaller cavity depth and higher aspect ratio. However, the ventilated window with a 50-mm cavity depth could provide sufficient space to accommodate adequate shading elements.

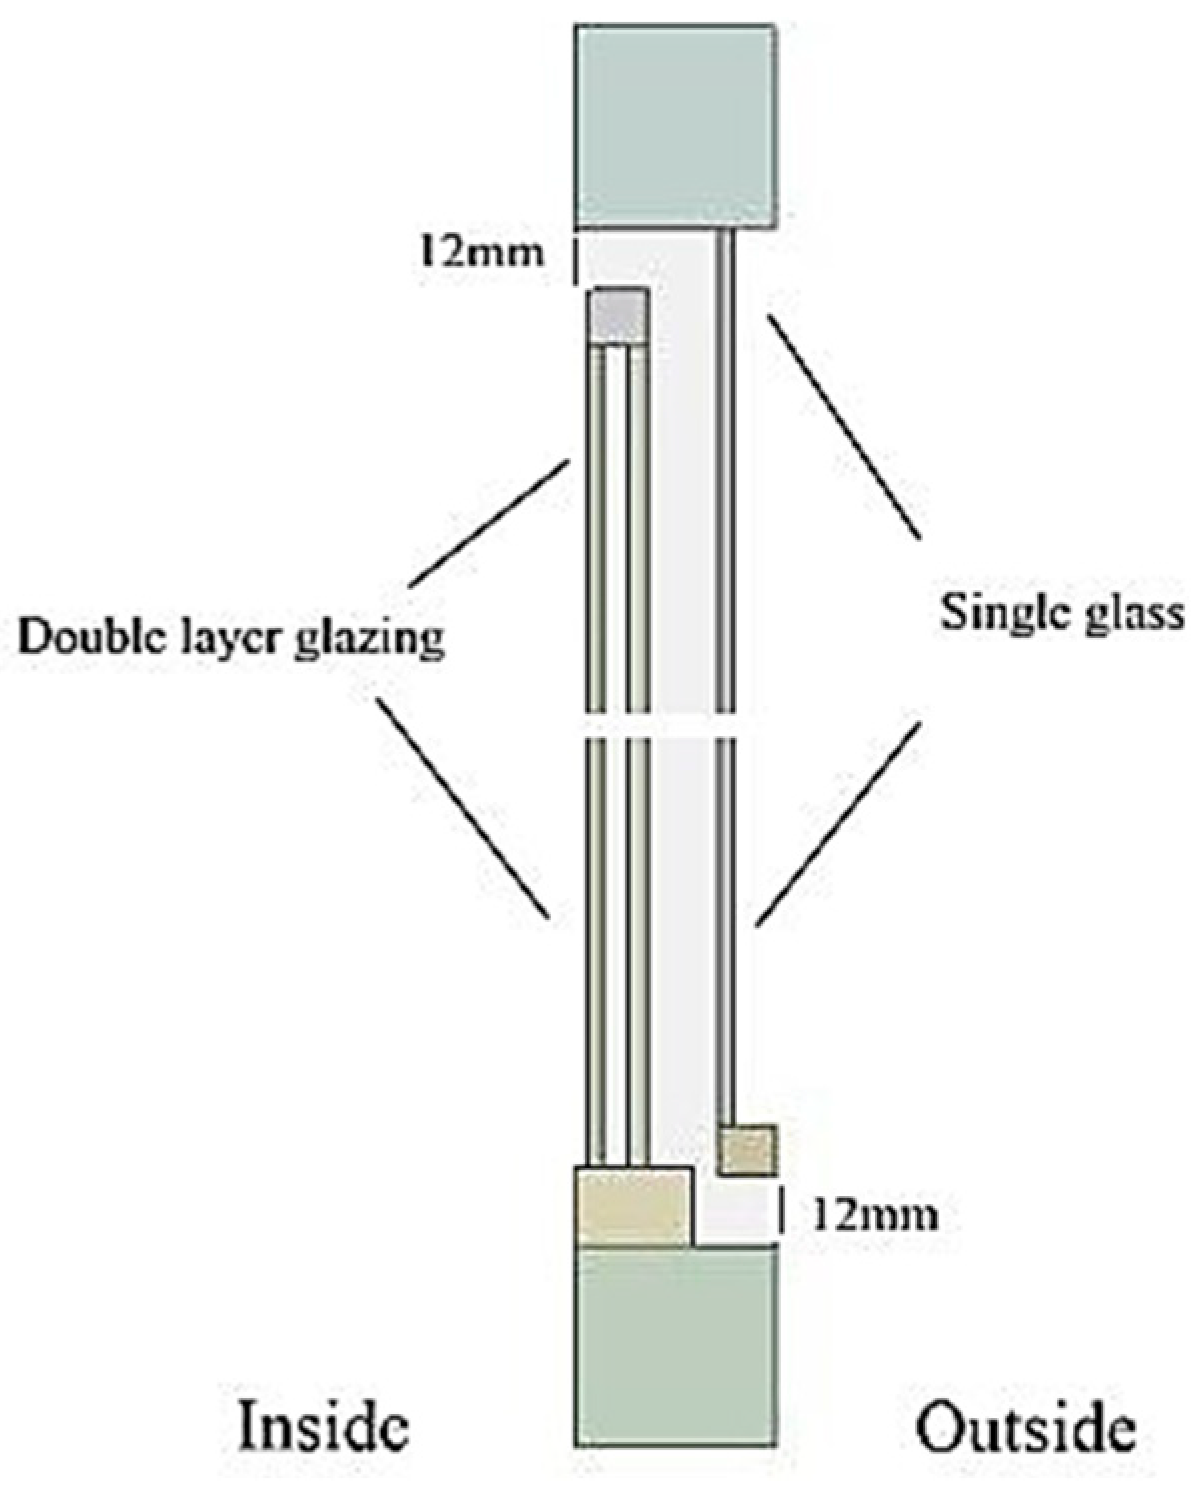
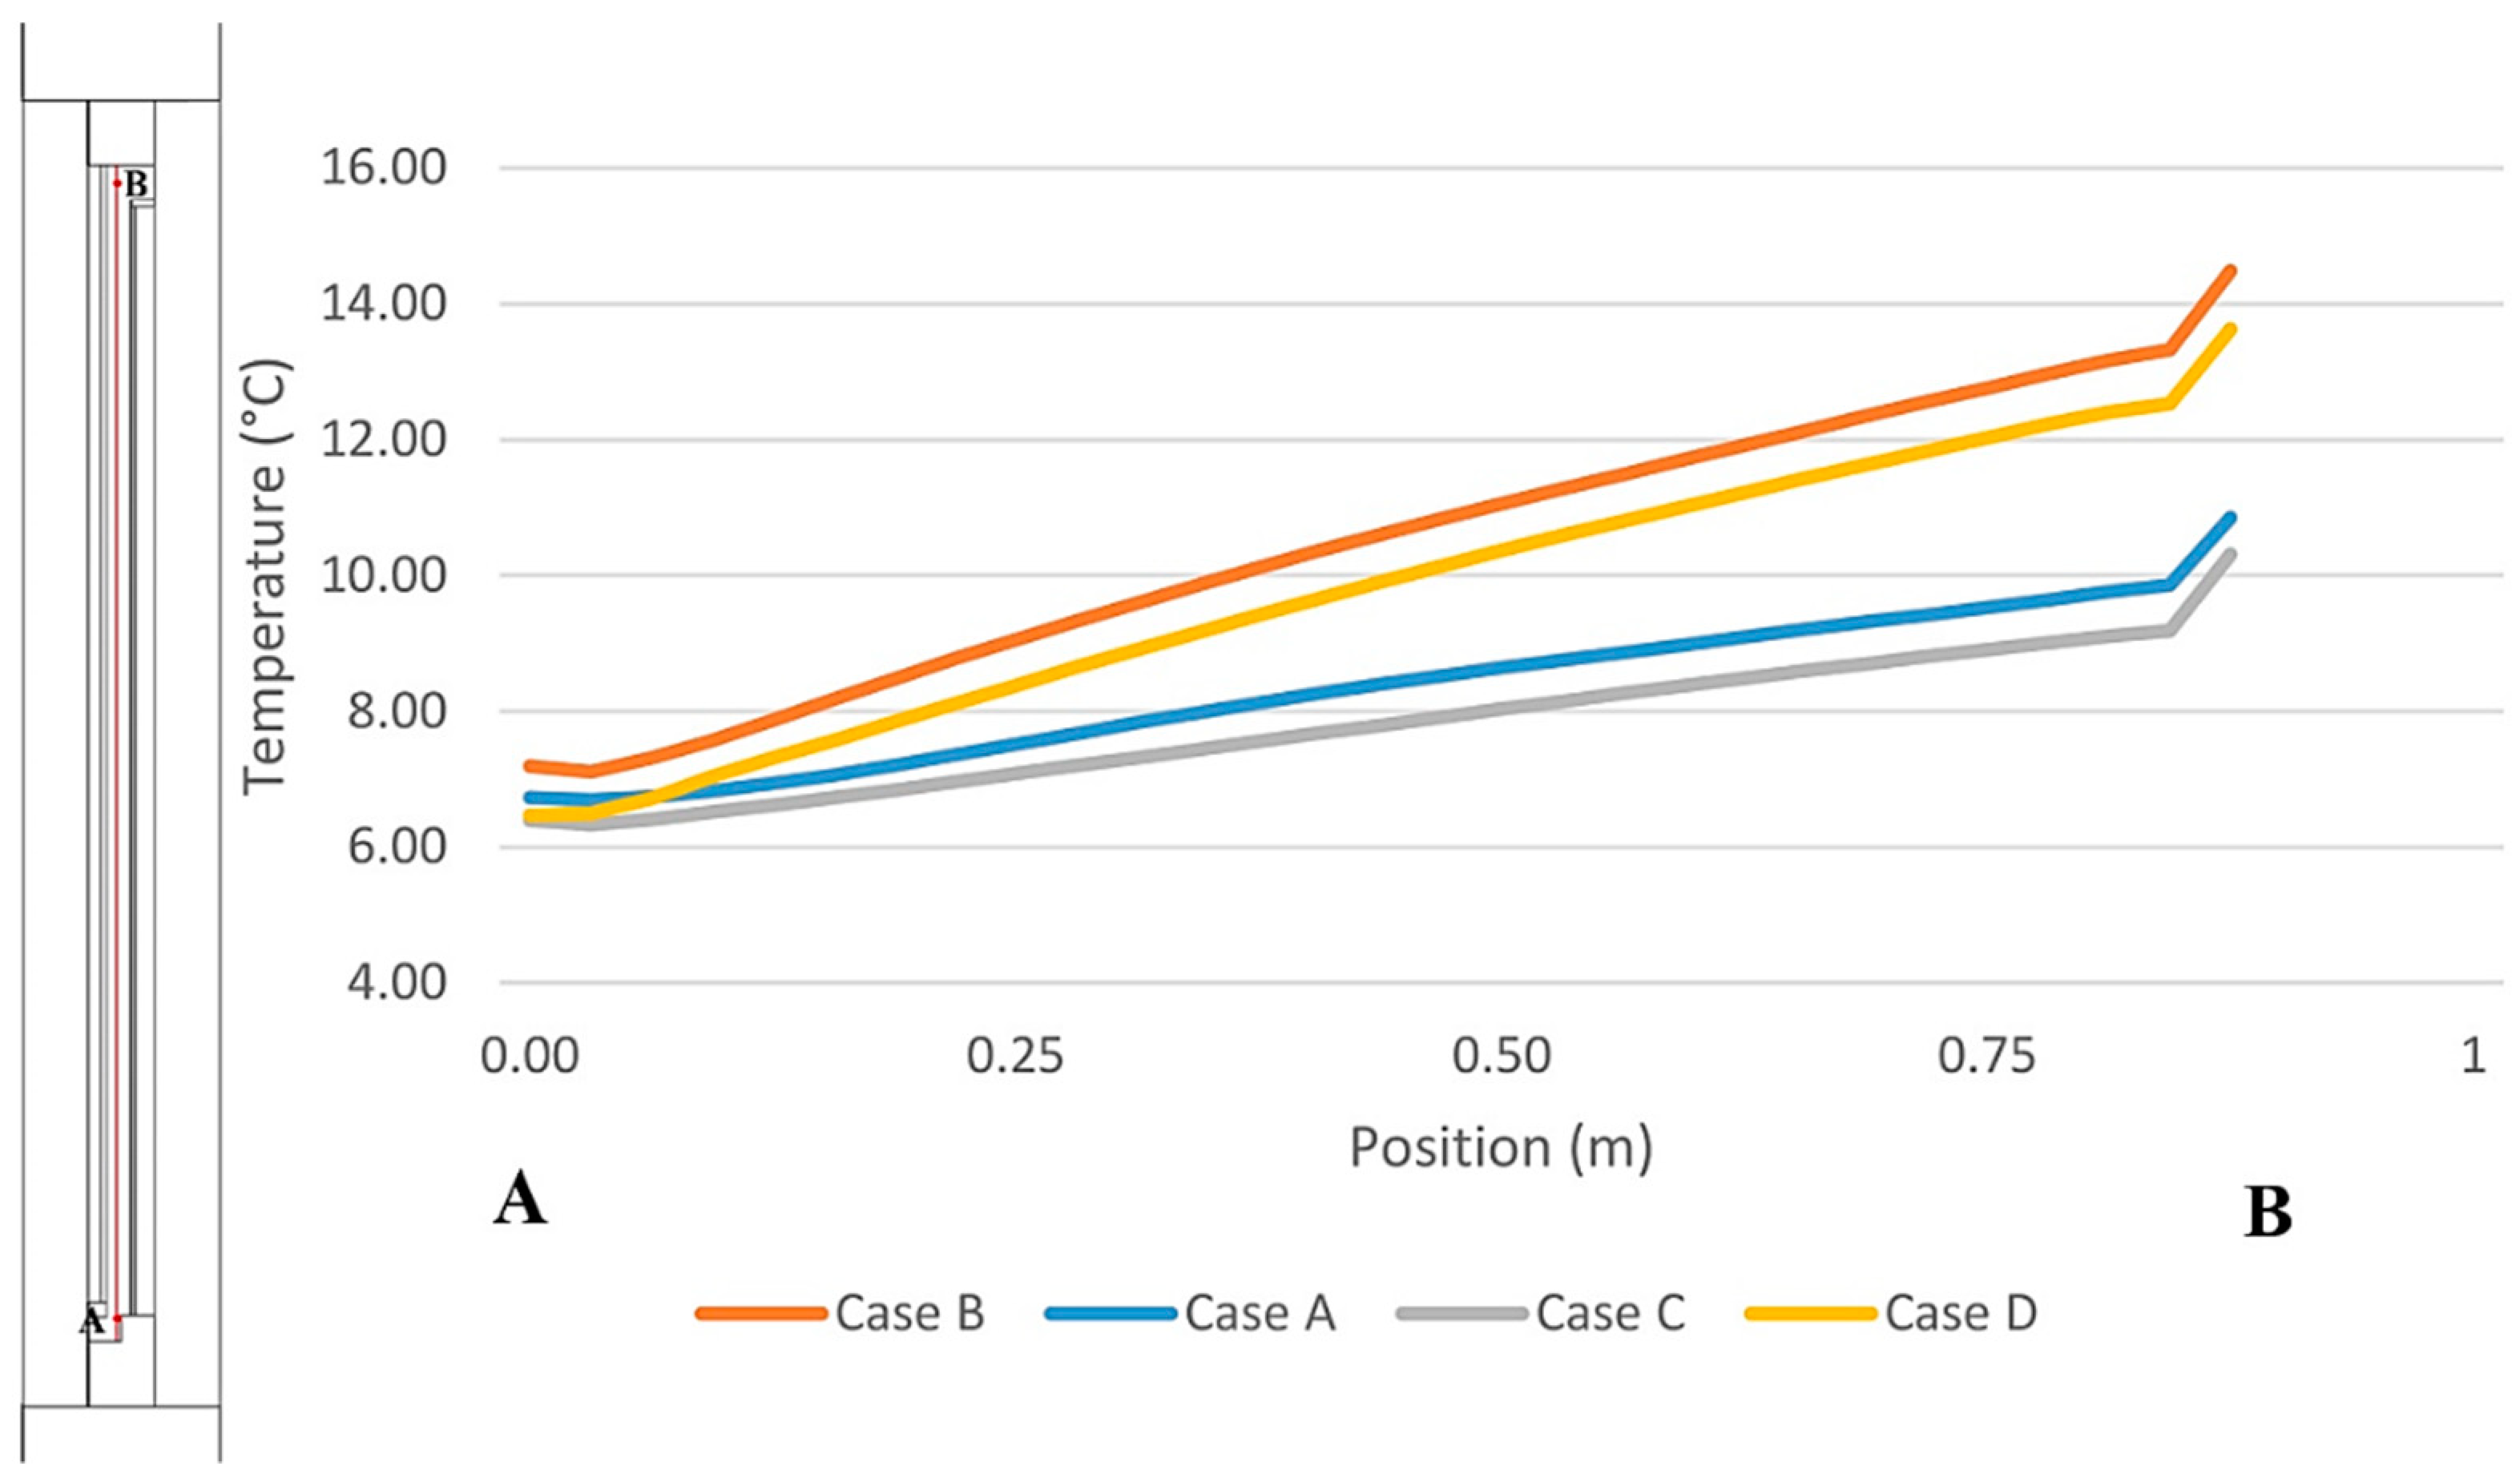
4.1.3. The Effect of Opening Size and the Type of the Glazing

As mentioned earlier, another aim of the investigation was to computationally investigate the effects of the width of the supply air opening and the position of the double-layered glazing (inside versus outside) on the performance of the ventilated window. The incoming airflow behavior depends strongly on the opening geometry and thermal property of the glazing [36]. The temperature of supply air depends on absorbed solar radiation by glazing and the heat lost from the indoor space to the cavity [68]. The total solar heat gain depends on the incident solar radiation on the outer glazing unit and the portion that could reach the inner glazing. As the cavity between glazing units is ventilated and the airflow heats by convection, the absorbed solar radiation by both glazing units influence the heat exchange between the surfaces and the airflow. With higher absorbance values of the inner pane, more solar energy is transferred into the cavity [68]. Single-layered glazing in the inside wing transfers more solar radiation to the indoor space.
To assess the effect of opening size and the position of double-layered glazing, four cases were considered as per Table 7. The assumed window dimensions were identical in all four cases (1-m wide and 1-m high).
Table 8 summarizes the simulation results for the four cases in terms of the temperature of the supply air entering into the room. The effect of the aforementioned variables can be clearly seen in Figure 9, which illustrates the computed temperature profile along the depicted path in the window cavity. Figure 10 presents the temperature contours for the aforementioned simulated cases.
According to the results, a significant temperature rise within the cavity was noticeable in all cases. Two sources of thermal energy could be assumed to contribute to the preheating of the air flowing through the cavity, namely incident solar radiation and conductive heat transfer from inside the room through the inner glass pane to the cavity. Cases B and D displayed a significantly higher average temperature in the buffer space as compared to the other two cases. This indicates the effect of conductive heat transfer from indoor space to the cavity via the single pane of glass. Consequently, reduced heat transfer from indoor space to the cavity in cases A and C can be suggested to be responsible for the lower values of the computed supply air temperature.

4.1.4. Condensation Issue

As stated earlier, one of the challenges regarding ventilated windows pertains to the risk of condensation on the outer glass pane at the cavity side. The evaluation of condensation risk in case of complex fenestration systems is a non-trivial challenge. A first, a rather basic possibility to query this issue would be to consider the profile of the surface temperature on the inner layer of the window element. Based on simulated minimum surface temperature values, the dimensionless temperature factor at the outer glazing panes of ventilated window (fRsi) [69] can be derived as per the following equation:
frsi = (θsiθe)·(θiθe)−1,
Herein, θ s i denotes the temperature at the internal surface at the point with the lowest temperature, θ i indoor temperature, and θ e outdoor temperature.
Table 9 provides numeric information regarding the minimum inside surface temperature of the outer glass layer as the dimensionless temperature factor for the aforementioned scenarios. As it could be expected, when the double-layered glazing was used for the outside window wing (i.e., cases B and D), the temperature factor value (fRsi) clearly exceeded the minimum recommended value of 0.7 according to the applicable regulation in Austria [70]. In case A, the smaller size of the width of the supply air opening could be assumed to have contributed to somewhat higher cavity temperature.

5. Conclusions

The results of the present study are compatible with general assumptions concerning the functionality of ventilated windows. The most distinctive characteristic of the ventilated windows is the potential to contribute to indoor air quality and higher energy efficiency. In general, this window serves as a solar collector under inward flow conditions and incident solar radiation. The solar radiation absorbed by the layers of the window as well as heat transferred from the indoor environment preheat the air within the gap and creates buoyancy forces that induce an upward flow of air. The temperature inside the ventilated window is expected to be higher than the outdoor temperature during most of the day. This results in lower conductive heat losses depending on ambient temperature and solar radiation level.
Our study covered a thermal analysis of several ventilated window configurations. The thermal performance of these models was evaluated numerically by a commercially available CFD under winter conditions. To gain confidence concerning the model’s reliability, its performance was first compared with laboratory and field measurements before its deployment toward the aforementioned parametric analysis.
  • The results point to the ventilated windows’ potential to deliver preheated fresh air to indoor spaces;
  • A temperature rise in the order of 3 to 18 K was computationally observed in the windows’ cavity under the specified boundary conditions. The field studies proved the strong effect of solar radiation on the thermal behavior of the ventilated window; nevertheless, they did not display a clear influence of the wind velocity. Rather, the thermally driven buoyancy force in the cavity seems to be the principal driver behind the airflow;
  • Amongst the simulated alternatives, analyzing the geometry of the cavity showed that taller cavities and smaller cavity depth can provide higher incoming air temperature;
  • Evaluating the width of the inlet opening and position of double-layered glazing indicated that case B with a 12-mm opening width displayed better results in terms of higher cavity temperatures and higher minimum surface temperatures (inner glass surface of the outer wing), also resulting in a lower risk of condensation in the cavity. However, case A had the advantage of higher energy efficiency given the lower rate of heat transfer from the indoor space to the cavity.
Ongoing and future studies in this context intend to address a number of limitations of the present treatment. For instance, additional investigations are necessary to both empirically and computationally determine the annual energy saving potential related to the use of ventilated windows, as compared to the standard double-layered window. These investigations would also have to address the monetary and environmental implications regarding the production, installation, and maintenance of ventilated windows under different boundary conditions (e.g., performance during the summer condition and under different local climatic conditions).

Author Contributions

S.N.K.: Conceptualization, Methodology, Simulation, Formal analysis, writing original draft. A.M.: Conceptualization, Methodology, Writing original draft, Visualization, Supervision. Both authors have read and agreed to the published version of the manuscript.

Funding

This research received no external funding. Open Access Funding by TU Wien.

Acknowledgments

The authors gratefully acknowledge Julia Bachinger of the Holzforschung Austria for the provision of the empirical testing data used in this paper. The authors further acknowledge the kind support ofChristian Jordan and Francesco Zonta of TU Wien for their support of the generation and assessment of the CFD simulation models used in this paper. Open Access Funding of the paper was by TU Wien.

Conflicts of Interest

The authors declare no conflict of interest.

References

  1. Gloriant, F.; Tittelein, P.; Joulin, A.; Lassue, S. Modeling a triple-glazed supply-air window. Build. Environ. 2015, 84, 1–9. [Google Scholar] [CrossRef]
  2. Ma, P.; Wang, L.S.; Guo, N. Maximum window-to-wall ratio of a thermally autonomous building as a function of envelope U-value and ambient temperature amplitude. Appl. Energy 2015, 146, 84–91. [Google Scholar] [CrossRef]
  3. Kull, T.M.; Mauring, T.; Tkaczyk, A.H. Energy balance calculation of window glazings in the northern latitudes using long-term measured climatic data. Energy Convers. Manag. 2015, 89, 896–906. [Google Scholar] [CrossRef]
  4. Feist, W.; Schnieders, J.; Dorer, V.; Haas, A. Re-inventing air heating: Convenient and comfortable within the frame of the Passive House concept. Energy Build. 2005, 37, 1186–1203. [Google Scholar] [CrossRef]
  5. Danza, L.; Barozzi, B.; Belussi, L.; Meroni, I.; Salamone, F. Assessment of the Performance of a Ventilated Window Coupled with a Heat Recovery Unit through the Co-Heating Test. Buildings 2016, 6, 3. [Google Scholar] [CrossRef] [Green Version]
  6. Poirazis, H. Double skin facades: A literature review. In A Report of IEA SHC Task 34, ECBCS Annex 43; Lund University: Lund, Sweden, 2006. [Google Scholar]
  7. Appelfeld, D.; Svendsen, S. Experimental analysis of energy performance fa ventilated window for heat recovery under controlled conditions. Energy Build. 2011, 43, 3200–3207. [Google Scholar] [CrossRef] [Green Version]
  8. Gosselin, J.R.; Chen, Q. A computational method for calculating heat transfer and airflow through a dual-airflow window. Energy Build. 2008, 40, 452–458. [Google Scholar] [CrossRef]
  9. Wang, E.; Wang, H.; Deng, M.; Wang, K.; Wang, Y. Simulation of the ventilation and energy performance of a PV-integrated breathing window. Procedia Eng. 2017, 205, 2779–2784. [Google Scholar] [CrossRef]
  10. Gosselin, J.R.; Chen, Q. A Dual Airflow Window for Indoor Air Quality Improvement and Energy Conservation in Buildings. HVAC&R Res. 2008, 14, 359–372. [Google Scholar] [CrossRef]
  11. Carlos, J.S.; Corvacho, H.; Silva, P.D.; Castro-Gomes, J.P. Real climate experimental study of two double window systems with preheating of ventilation air. Energy Build. 2010, 42, 928–934. [Google Scholar] [CrossRef]
  12. Southall, R.; McEvoy, M. Results from a Validated CFD Simulation of a Supply Air ‘Ventilated Window’. Air Distrib. Rooms (Roomvent) 2000, 2, 1049–1054. [Google Scholar]
  13. McEvoy, M.; Southall, R.G.; Baker, P.H. Test cell evaluation of supply air windows to characterise their optimum performance and its verification by the use of modelling techniques. Energy Build. 2003, 35, 1009–1020. [Google Scholar] [CrossRef]
  14. Bhamjee, M.; Nurick, A.; Madyira, D.M. An experimentally validated mathematical and CFD model of a supply air window: Forced and natural flow. Energy Build. 2013, 57, 289–301. [Google Scholar] [CrossRef]
  15. Torre, A.T.d.l.; Saelens, D.; Carmeliet, J.; Baelmans, M. Investigation on airflow and heat transfer of a glazing facade with external louvers. In Proceedings of the 4th International Building Physics Conference, Istanbul, Turkey, 15–18 June 2009. [Google Scholar]
  16. Haase, M.; Wigenstad, T. Condensation Issues in Ventilated Façades. In Materials with Complex Behaviour II. Advanced Structured Materials; Öchsner, A., Silva, L.F.M.D., Altenbach, H., Eds.; Springer: Berlin, Germany, 2012. [Google Scholar]
  17. Baker, P.H.; McEvoy, M. Test cell analysis of the use of a supply air window as a passive solar component. Sol. Energy 2000, 69, 113–130. [Google Scholar] [CrossRef]
  18. Laverge, J.; Schouwenaars, S.; Steeman, M.; Janssens, A.; Van Den Bossche, N. Condensation in a closed cavity double skin facade: A model for risk assessment. Engineering 2010, 1–9. [Google Scholar]
  19. Indian Buildings Congress. Practical Handbook on Energy Conservation in Buildings Indian Building Congress, 1st ed.; Nabhi Publications: New Delhi, India, 2008. [Google Scholar]
  20. Bhamjee, M. A Computational Fluid Dynamics and Experimental Investigation of an Airflow Window. Ph.D. Theisis, University of Johannesburg, Johannesburg, South Africa, 2011. [Google Scholar]
  21. Safer, N.; Woloszyn, M.; Roux, J.J. Three-dimensional simulation with a CFD tool of the airflow phenomena in single floor double-skin facade equipped with a venetian blind. Sol. Energy 2005, 79, 193–203. [Google Scholar] [CrossRef]
  22. Saelens, D.; Roels, S.; Hens, H. The inlet temperature as a boundary condition for multiple-skin facade modelling. Energy Build. 2004, 36, 825–835. [Google Scholar] [CrossRef]
  23. Tanimoto, J.; Kimura, K.I. Simulation study on an air flow window system with an integrated roll screen. Energy Build. 1997, 26, 317–325. [Google Scholar] [CrossRef]
  24. Strachan, P.A.; Vandaele, L. Case studies of outdoor testing and analysis of building components. Build. Environ. 2008, 43, 129–142. [Google Scholar] [CrossRef] [Green Version]
  25. Xu, X.; Yang, Z. Natural ventilation in the double skin facade with venetian blind. Energy Build. 2008, 40, 1498–1504. [Google Scholar] [CrossRef]
  26. Jiru, T.E.; Haghighat, F. Modeling ventilated double skin façade—A zonal approach. Energy Build. 2008, 40, 1567–1576. [Google Scholar] [CrossRef]
  27. Ji, Y.; Cook, M.J.; Hanby, V.; Infield, D.G.; Loveday, D.L.; Mei, L. CFD modelling of naturally ventilated double-skin facades with Venetian blinds. J. Build. Perform. Simul. 2008, 1, 185–196. [Google Scholar] [CrossRef]
  28. Manz, H. Total solar energy transmittance of glass double façades with free convection. Energy Build. 2004, 36, 127–136. [Google Scholar] [CrossRef]
  29. Gratia, E.; De Herde, A. Natural ventilation in a double-skin facade. Energy Build. 2004, 36, 137–146. [Google Scholar] [CrossRef]
  30. Popa, C.; Ospir, D.; Fohanno, S.; Chereche, C. Numerical simulation of dynamical aspects of natural convection flow in a double-skin façade. Energy Build. 2012, 50, 229–233. [Google Scholar] [CrossRef]
  31. Zeng, Z.; Li, X.; Li, C.; Zhu, Y. Modeling ventilation in naturally ventilated double-skin façade with a venetian blind. Build. Environ. 2012, 57, 1–6. [Google Scholar] [CrossRef]
  32. Iyi, D.; Hasan, R.; Penlington, R.; Underwood, C. Double skin façade: Modelling technique and influence of venetian blinds on the airflow and heat transfer. Appl. Therm. Eng. 2014, 71, 219–229. [Google Scholar] [CrossRef] [Green Version]
  33. Manz, H.; Frank, T. Thermal simulation of buildings with double-skin façades. Energy Build. 2005, 37, 1114–1121. [Google Scholar] [CrossRef]
  34. Pappas, A.; Zhai, Z. Numerical investigation on thermal performance and correlations of double skin façade with buoyancy-driven airflow. Energy Build. 2008, 40, 466–475. [Google Scholar] [CrossRef]
  35. Fuliotto, R.; Cambuli, F.; Mandas, N.; Bacchin, N.; Manara, G.; Chen, Q. Experimental and numerical analysis of heat transfer and airflow on an interactive building facade. Energy Build. 2010, 42, 23–28. [Google Scholar] [CrossRef] [Green Version]
  36. Carlos, J.S. Assessment of pre-heating air through a double window system on different building location and weather condition. Build. Simul. 2014, 7, 247–261. [Google Scholar] [CrossRef]
  37. Yılmaz, Z.; Çetintaş, F. Double skin façade’s effects on heat losses of office buildings in Istanbul. Energy Build. 2005, 37, 691–697. [Google Scholar] [CrossRef]
  38. Hamza, N. Double versus single skin facades in hot arid areas. Energy Build. 2008, 40, 240–248. [Google Scholar] [CrossRef]
  39. Høseggen, R.; Wachenfeldt, B.J.; Hanssen, S.O. Building simulation as an assisting tool in decision making: Case study: With or without a double-skin façade? Energy Build. 2008, 40, 821–827. [Google Scholar] [CrossRef]
  40. Tanaka, H.; Okumiya, M.; Tanaka, H.; YoungYoon, G.; Watanabe, K. Thermal characteristics of a double-glazed external wall system with roll screen in cooling season. Build. Environ. 2009, 44, 1509–1516. [Google Scholar] [CrossRef] [Green Version]
  41. Chan, A.L.S.; Chow, T.T.; Fong, K.F.; Lin, Z. Investigation on energy performance of double skin façade in Hong Kong. Energy Build. 2009, 41, 1135–1142. [Google Scholar] [CrossRef]
  42. Choi, W.; Joe, J.; Kwak, Y.; Huh, J. Operation and control strategies for multi-storey double skin facades during the heating season. Energy Build. 2012, 49, 454–465. [Google Scholar] [CrossRef]
  43. Joe, J.; Choi, W.; Kwon, H.; Huh, J. Load characteristics and operation strategies of building integrated with multi-story double skin facade. Energy Build. 2013, 60, 185–198. [Google Scholar] [CrossRef]
  44. Marjanovic, L.; Cook, M.; Hanby, V.; Rees, S. CFD modelling of convective heat transfer from a window with adjacent venetian blinds. In Proceedings of the 9th International IBPSA Conference (Building Simulation 2005), Montréal, QC, Canada, 15–18 August 2005. [Google Scholar]
  45. Ghadimi, M.; Ghadamian, H.; Hamidi, A.; Fazelpour, F.; Behghadam, M. Analysis of free and forced convection in airflow windows using numerical simulation of heat transfer. Int. J. Energy Environ. Eng. 2012, 3, 14. [Google Scholar] [CrossRef] [Green Version]
  46. Zou, H.; Fei, Y.; Yang, F.; Tang, H.; Zhang, Y.; Ye, S. Mathematical Modeling of Double-Skin Facade in Northern Area of China. Math. Probl. Eng. 2013, 2013, 712878. [Google Scholar]
  47. Skaff, M.C.; Gosselin, L. Summer performance of ventilated windows with absorbing or smart glazings. Sol. Energy 2014, 105, 2–13. [Google Scholar] [CrossRef]
  48. Parra, J.; Guardo, A.; Egusquiza, E.; Alavedra, P. Thermal Performance of Ventilated Double Skin Façades with Venetian Blinds. Energies 2015, 8, 4882–4898. [Google Scholar] [CrossRef]
  49. Dama, A.; Angeli, D.; Larsen, O.K. Naturally ventilated double-skin façade in modeling and experiments. Energy Build. 2017, 144, 17–29. [Google Scholar] [CrossRef] [Green Version]
  50. Li, Y.; Darkwa, J.; Kokogiannakis, G. Heat transfer analysis of an integrated double skin façade and phase change material blind system. Build. Environ. 2017, 125, 111–121. [Google Scholar] [CrossRef]
  51. Demanega, I.; De Michele, G.; Avesani, S.; Pernigotto, G.; Babich, F.; Gasparella, A. CFD and ray tracing to evaluate the thermal performance of Complex Fenestration Systems. In Proceedings of the BSO 2018: 4th Building Simulation and Optimization Conference, Cambridge, UK, 11–12 September 2018. [Google Scholar]
  52. Cho, K.-J.; Cho, D.-W. Solar Heat Gain Coefficient Analysis of a Slim-Type Double Skin Window System: Using an Experimental and a Simulation Method. Energies 2018, 11, 115. [Google Scholar] [CrossRef] [Green Version]
  53. Souza, C.O.; Souza, H.A.; Rodrigues, E.F. Experimental and numerical analysis of a naturally ventilated double-skin façade. Energy Build. 2018, 165, 328–339. [Google Scholar] [CrossRef]
  54. El Ahmar, S.; Battista, F.; Fioravanti, A. Simulation of the thermal performance of a geometrically complex Double-Skin Facade for hot climates: EnergyPlus vs. OpenFOAM. Build. Simul. 2019, 12, 781–795. [Google Scholar] [CrossRef]
  55. Choi, H.; Kang, K.; An, Y.; Kim, E.; Lee, Y.; Kim, T. Analysis of Heat Transfer in a Slim Double Skin Façade using CFD Simulation. In Proceedings of the 16th International IBPSA Conference (Building Simulation 2019), Rome, Italy, 2–4 September 2019. [Google Scholar]
  56. Noh-Pat, F.; Gijon-Rivera, M.; Xaman, J.; Zavala-Guillen, I.; Aguilar, J.O.; Rodrıguez-Perez, M. Modelling of an energy-efficient open double-glazing unit for the main climatic conditions of Mexico. Indoor Built Environ. 2020, 29, 746–764. [Google Scholar] [CrossRef]
  57. Hensen, J.; Barták, M.; Frantisek, D. Modeling and simulation of a double-skin facade system. ASHRAE Trans. 2002, 108, 1251–1259. [Google Scholar]
  58. Pasut, W.; De Carli, M. Evaluation of various CFD modelling strategies in predicting airflow and temperature in a naturally ventilated double skin façade. Appl. Therm. Eng. 2012, 37, 267–274. [Google Scholar] [CrossRef] [Green Version]
  59. ANSYS Inc. Documentation, Fluent 19.1; ANSYS Inc.: Canonsburg, PA, USA, 2018. [Google Scholar]
  60. Nusser, B.; Bachinger, J.; Schober, K.P. Untersuchungen zur Hygrothermischen Funktionsweise des Low-Tech Window Air Verbundfensters; Holz Forschung: Vienna, Austria, 2016. [Google Scholar]
  61. Choudhary, R.; Malkawi, A. A methodology for micro-level building thermal analysis: Combining CFD and experimental set-ups. In Proceedings of the Seventh International IBPSA Conference, Rio de Janeiro, Brazil, 13–15 August 2001. [Google Scholar]
  62. Launder, B.; Spalding, D.B. The Numerical Computation of Turbulent Flow Computer Methods. Comput. Methods Appl. Mech. Eng. 1974, 3, 269–289. [Google Scholar] [CrossRef]
  63. ASHRAE Standard. ASHRAE Fundamentals Handbook; ASHRAE: Atlanta, GA, USA, 2005. [Google Scholar]
  64. Southall, R.; McEvoy, M. Investigations into the functioning of a supply air window in relation to solar energy as determined by experiment and simulation. Sol. Energy 2006, 80, 512–523. [Google Scholar] [CrossRef]
  65. Carlos, J.S.; Corvacho, H. Ventilated Double Window for the Preheating of the Ventilation Air Comparison of Its Performance in a Northern and a Southern European Climate. J. Renew. Energy 2013, 2013, 290865. [Google Scholar] [CrossRef] [Green Version]
  66. Greffet, R.; Salagnac, P.; Michaux, G.; Ridoret, J. Airflow Window: Numeical Study and Sensibility Analysis of Thermal Performances. In Proceedings of the 13th Conference of International Building Performance Simulation Association, Chambéry, France, 26–28 August 2013. [Google Scholar]
  67. Bakonyi, D. The Thermal Modeling of Traditional Double-Skin Box Type Windows, in Department of Building Constructions. Ph.D. Thesis, Budapesti University of Technology and Economics, Budapest, Hungary, 2016. [Google Scholar]
  68. Carlos, J.S.; Corvacho, H. Evaluation of the performance indices of a ventilated double window through experimental and analytical procedures: SHGC-values. Energy Build. 2015, 86, 886–897. [Google Scholar] [CrossRef]
  69. ISO 2007 ISO 10211. In Thermal Bridges in Building Construction—Heat Flows and Surface Temperatures; International Organization for Standardization: Geneva, Switzerland, 2007.
  70. Austrian Standards. ÖNORM B 8110-2 SUPPLEMENT 4; Austrian Standards: Vienna, Austria, 2003. [Google Scholar]
Figure 1. Schematic illustration of the principle operation modes of a ventilated window. Adapted from [8,9]. i: Supply, exhaust ii: exhaust, indoor air curtain iii: indoor air curtain, outdoor air curtain iv: outdoor air curtain, and insulation mode vi: and insulation mode
Energies 14 02420 g001
Figure 2. Schematic diagram with electrical analogy; λg: Thermal conductivity of the glass; Tex: Outdoor temperature; Tse: Outdoor surface temperature of glass; Tsin: Indoor surface temperature of glass; hr: Radiative heat transfer coefficient; hgext: Heat transfer coefficients (external glazed surfaces); hgint: Heat transfer coefficients (internal glazed surfaces); qsol: Total solar radiation; q: Heat flow; hc: Heat transfer coefficient.
Energies 14 02420 g002
Figure 3. Computational domain.
Energies 14 02420 g003
Figure 4. (a) Grid generation in the indoor space. (b) Vertical cross section of the cavity.
Energies 14 02420 g004
Figure 5. Schematic illustration of the ventilated window.
Energies 14 02420 g005
Figure 6. Left: Schematic section through the examined ventilated window with the position of the two temperature probes (A to B); right: Measured (sensors A and B) and simulated temperature profile. The distance information (x-axis) denotes the relative distance from the position of sensor A).
Energies 14 02420 g006
Figure 7. (a): Temperature distribution; (b): velocity contours within the cavity.
Energies 14 02420 g007
Figure 8. Left: Schematic section through the examined ventilated window with the position of the two temperature probes (used in the course of field measurements); right: Measured (sensors A and B) and simulated temperature profiles.
Energies 14 02420 g008
Figure 9. Simulated temperature distribution in window’s cavity space.
Energies 14 02420 g009
Figure 10. Temperature distribution within the cavity for the different cases.
Energies 14 02420 g010
Table 1. Overview of ventilated window thermal performance studies based on CFD simulations.
Ref.Window TypeDimension/Coupling/Steady or TransientMain Objective of the StudyTurbulence and Radiation Modeling
[12]SM2D/S/DCDifferent glass types, configurations, and ventilation were considered to evaluate the thermal performance of the window in summertime.K-ε/NS
[28]OAC2D/T/DCThe impact of the glazing layer order also ventilation properties on the total solar energy transmittance plus the thermal performance of double façades were evaluated.Standard K-ε/HS
[44]IM3D/S/DCThe heat transfer rate from a window surface was evaluated for different aluminum blade angles for both summer and winter conditions.K-ε/NS
[21]DSF
(OAC)
3D/S/DCThe impact of blind position, angle, and air outlet position on the airflow development of the window was numerically analyzed.K-ε realizable/NS
[8]SM, EM3D/S/DCA new method was suggested to apply both in CFD and radiation calculations to determine airflow, and heat transfer within the window.K-ε RNG/S2S
[34]SM3D/S/CBuilding energy simulation, moreover integrated CFD was applied to assess the double-skin façade energy performance.K-ε RANS/NS
[27]DSF
(OAC)
2D/S/DCA numerical method was employed to evaluate the thermal behavior of the ventilated faced with different angles of the venetian blind.K-ω model MC model
[15]OAC2D/T/DCThe main goal of the study was to investigate the influence of solar radiation on the airflow behavior as well as temperature distribution on a glass façade including external louvers.K-ε RANS/DO
[35]DSF
(SM)
3D/S/DCA simple analytical technique was introduced to the contribution of solar radiation in the DSF’s energy balance.K-ε RANS/HS
[31]OAC2D/S/CTo numerically evaluate the buoyancy force and address the high computational cost, the porous model was suggested, and the accuracy of the model was investigated.Standard K-ε/HS
[45]IAC2D/S/DCOverall forced convective heat transfer within an airflow window was estimated.K-ε RNG/NS
[46]EM3D/T/CDifferent building envelopes and building orientations and their effect on DSF thermal performance were examined numerically.K-ε RNG/DO
[14]SM3D/S/DCThe thermal behavior of the supply air window was compared for the natural and forced flow cases.SST K-ω, DO
[47]EM, OAC2D/S/DCThe total heat gain decrease provided by ventilated glazing units was examined to insulated units under summer conditions. A different operating design, as well as optimum cavity space, were investigated.laminar flow/S2S
[1]SM2D/S/DCCFD simulation was applied to recalculate windows simulation parameters and apply them in a simplified building simulation model.Laminar, radiative temperature
[48]DSF
(OAC)
3D/T/DCThe impact of various constructions, optical, and operation parameters of a DSF in terms of energy savings was estimated in terms of decreasing the solar load entering the building.RNG K-ε, P1 radiation model
[49]OAC2D/T/OThe CFD and BS models were combined to obtain a realistic picture of the DSF thermal performance.SST K-ω RANS/NS
[50]DSF
(OAC)
2D/T/DCThe heat transfer of a combined double-skin façade plus phase change material (PCM) blind was evaluated.K-ε RNG/DO
[9]SM, EM, OAC, IAC2D/S/DCThe effect of different glazing, opening, and airflow size on the thermal performance of the airflow window was investigated for both summer and winter time.Standard K-ε/NS
[51]IM2D/S/DCCFD + ray-tracing method was applied to both standard and complex fenestration systems with integrated blinds, and the results were compared with the ISO 15,099 standard.K-ε RNG/S2S
[52]OAC, IM3D/S/CThe cavity air temperatures plus solar heat gain coefficients (SHGC) were analyzed to the closed and open conditions of the window’s external opening.Realizable K-ε RANS/S2S
[53]DSF
(OAC)
3D/T/DCThe airflow and heat convection within the cavity was investigated and the results compared with the measurement outcomes.K-ε model, NS
[54]DSF
(OAC)
3D/S/DCTo analyze the ability of two simulation applications, the thermal performance of DSF was evaluated with Energy Plus and Open FOAM CFD. The results compared with experimental outcomes.StandardK-ε/NS
[55]OAC3D/S/CThe main purpose was to evaluate the influence of colored or low-emissivity glass as an outer pane to improve cooling performance.K-ε RNG/S2S
[56]ODGU2D/S/DCThe numerical analysis on two configurations of ODGU indicated application of (clear glass + air + clear glass) can be the most energy-efficient option for the hot climate.Laminar, RIM
IM: Insulation mode; SM: Supply mode; EM: Exhaust mode; IAC: Indoor air curtain; OAC: Outdoor air curtain; DSF: Double-skin façade; ODGU: Open double-glazing unit; 3D: Three-dimensional; 2D: Two-dimensional; C: Coupled outdoor–indoor simulations; DC: Decoupled outdoor–indoor simulations; I: Indoor; O: Outdoor; S: Steady; T: Transient; S2S: Surface-to-surface radiation model; DO: Discrete ordinates radiation model; RIM: Radiosity–irradiosity method; NS: No solar radiation; HS: Heat sources instead of solar radiation model.
Table 2. Grid test.
Table 2. Grid test.
Grid Size of the Cavity (mm)Mean Temperature °CMean Velocity (m·s−1)
4 × 48.7180.315
3 × 38.7230.312
2 × 28.7280.303
Table 3. Assumed properties of simulated glazing unit.
MaterialSingle Glazing (6 mm)Low-Emissivity Double-Glazing (4 + 12 + 4 mm)
Transmittance0.7520.305
Reflectance0.1430.402
Absorbance0.1050.250
Emissivity0.840.148
Thermal conductivity10.043
Table 4. Boundary condition for the CFD model.
VariableValueUnit
Irradiance180W⋅m−2
Wind speed3.5m·s−1
Outdoor temperature3°C
Table 5. Supply air temperature, heat flux, effectiveness, volumetric flow rate, and mean cavity temperature for the ventilated windows with two cavity height assumptions.
Cavity HeightSupply Temperature °CHeat Flux W⋅m−2Effectiveness (η-value) V · · (L·s−1)Mean Cavity Temperature °CAspect Ratio
1 m16.661.250.82.118.7020
2 m17.481.290.852.039.0140
Table 6. Supply air temperature, heat flux, effectiveness, volumetric flow rate, and mean cavity temperature for the ventilated windows with two cavity depth assumptions.
Cavity DepthSupply Temperature °CHet flux (W·m−2)Effectiveness (η-Value) V · · (L·s−1)Mean Cavity TemperatureAspect Ratio
25 mm16.850.850.812.108.940
50 mm16.661.250.82.118.7020
Table 7. Summary of the simulated configurations (width of the inlet opening was assumed to be 12 mm in all cases).
CaseWidth of the Supply Air OpeningPosition of the Double-Layered Element
A12Inside
B12Outside
C24Inside
D24Outside
Table 8. Supply air temperature, volumetric flow rate for the simulated scenarios.
Cavity DepthSupply Temperature °CEffectiveness (η-Value) V ˙ · (L·s−1)Mean Cavity Temperature
A16.660.82.118.70
B17.860.872.2310.95
C16.260.782.108.63
D17.230.832.2010.90
Table 9. Minimum surface temperature obtained from CFD simulation together with calculated frsi value.
Simulated ScenariosMinimum Surface TemperaturefRsi
Case A8.700.76
Case B10.970.88
Case C8.690.70
Case D10.900.82
Publisher’s Note: MDPI stays neutral with regard to jurisdictional claims in published maps and institutional affiliations.

