Economics of Battery Use in Agriculture: Economic Viability of Renewable Energy Complemented with Batteries in Agriculture
Abstract
:1. Introduction
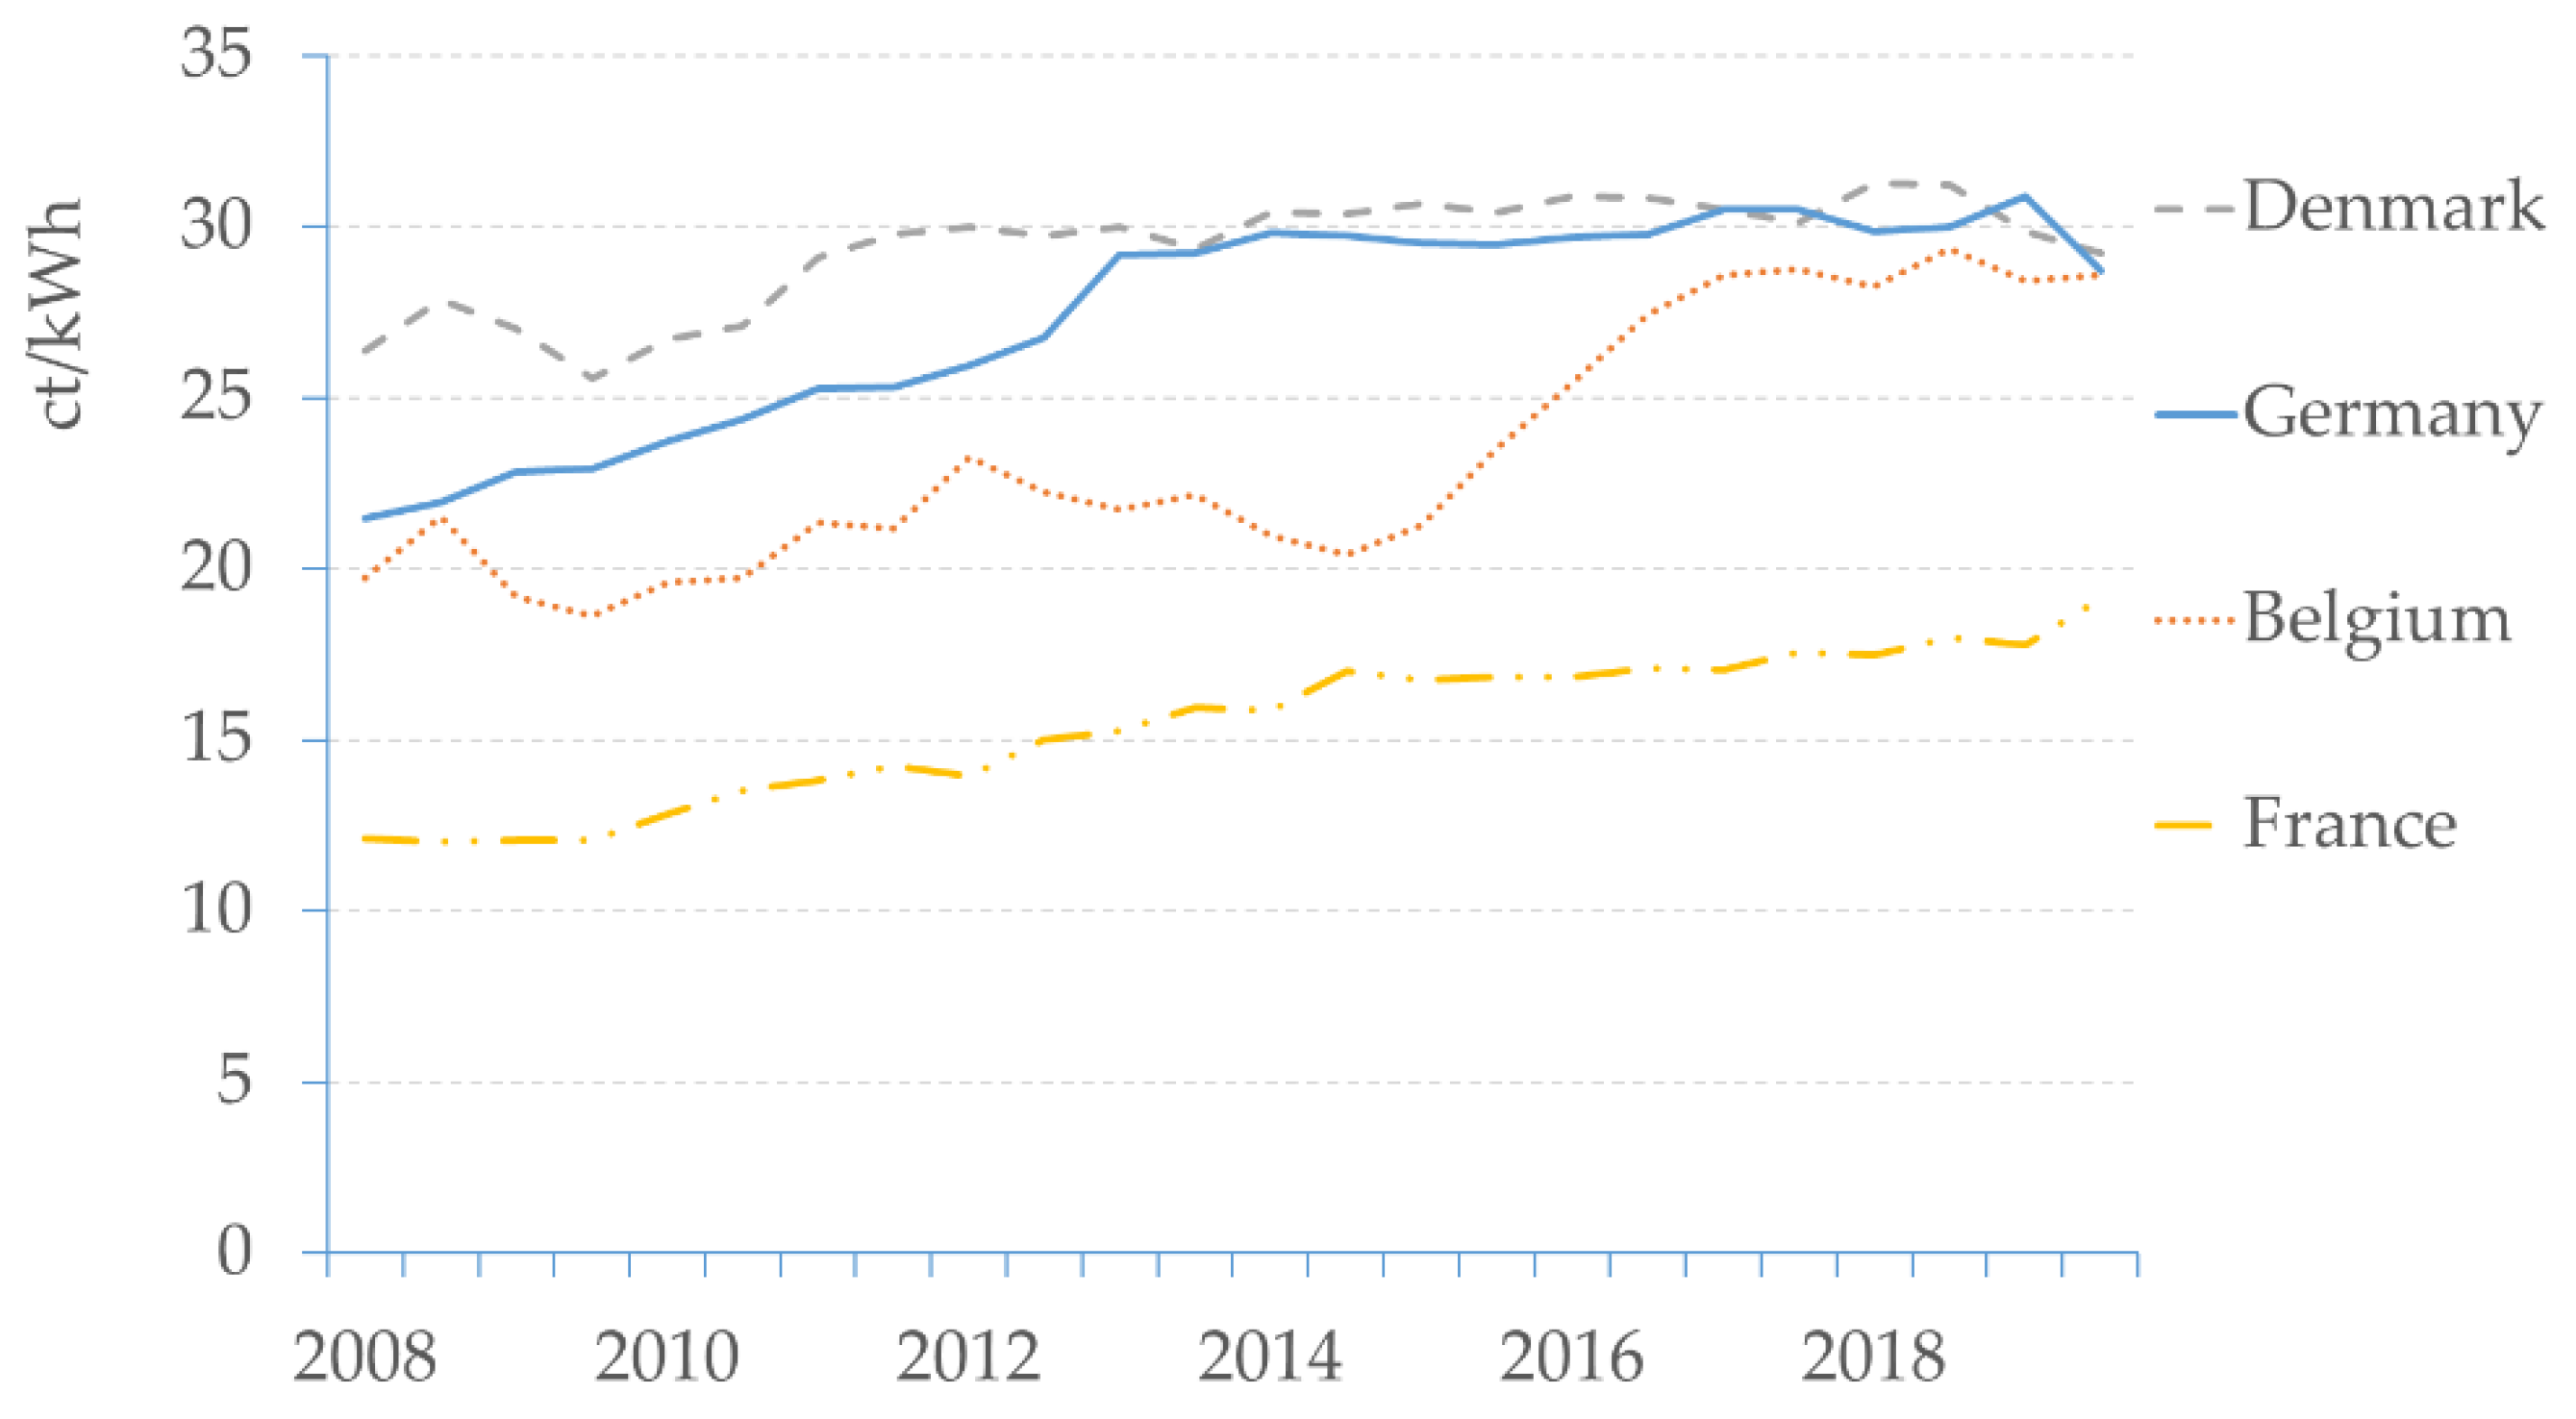
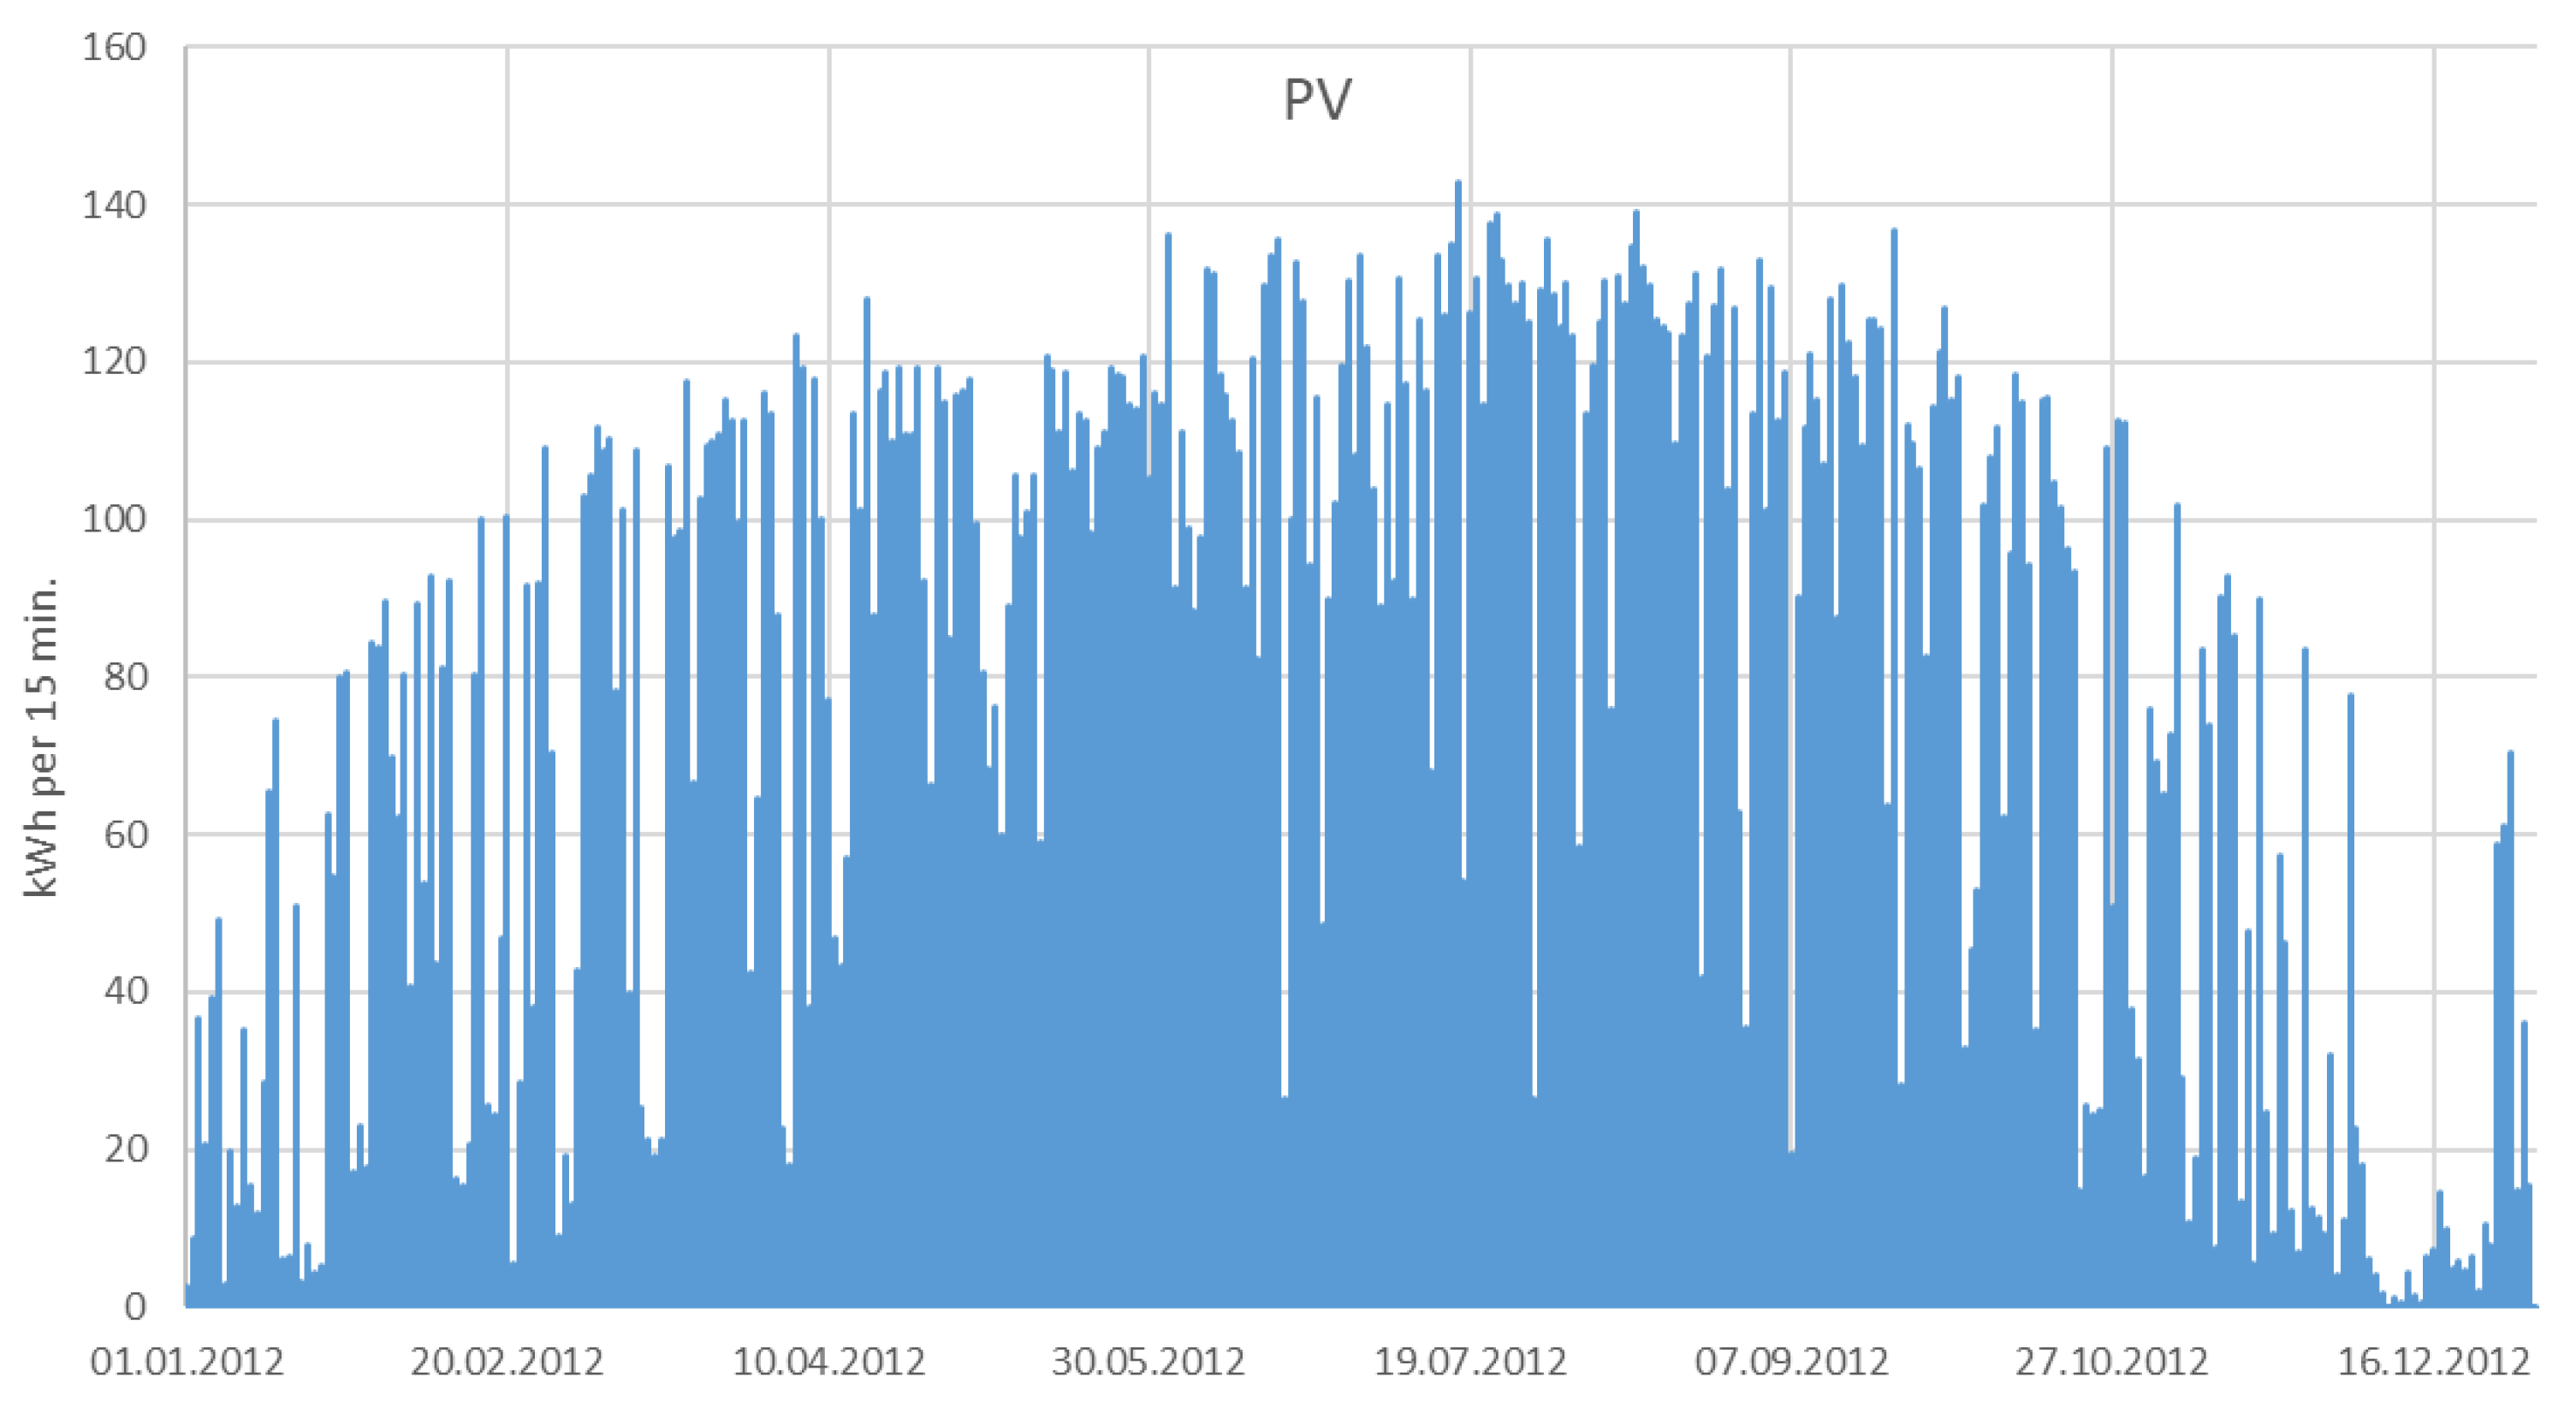
- For individual companies and with a view to the future, PV systems are of particular interest, as they can be installed at any location and on almost any roof.
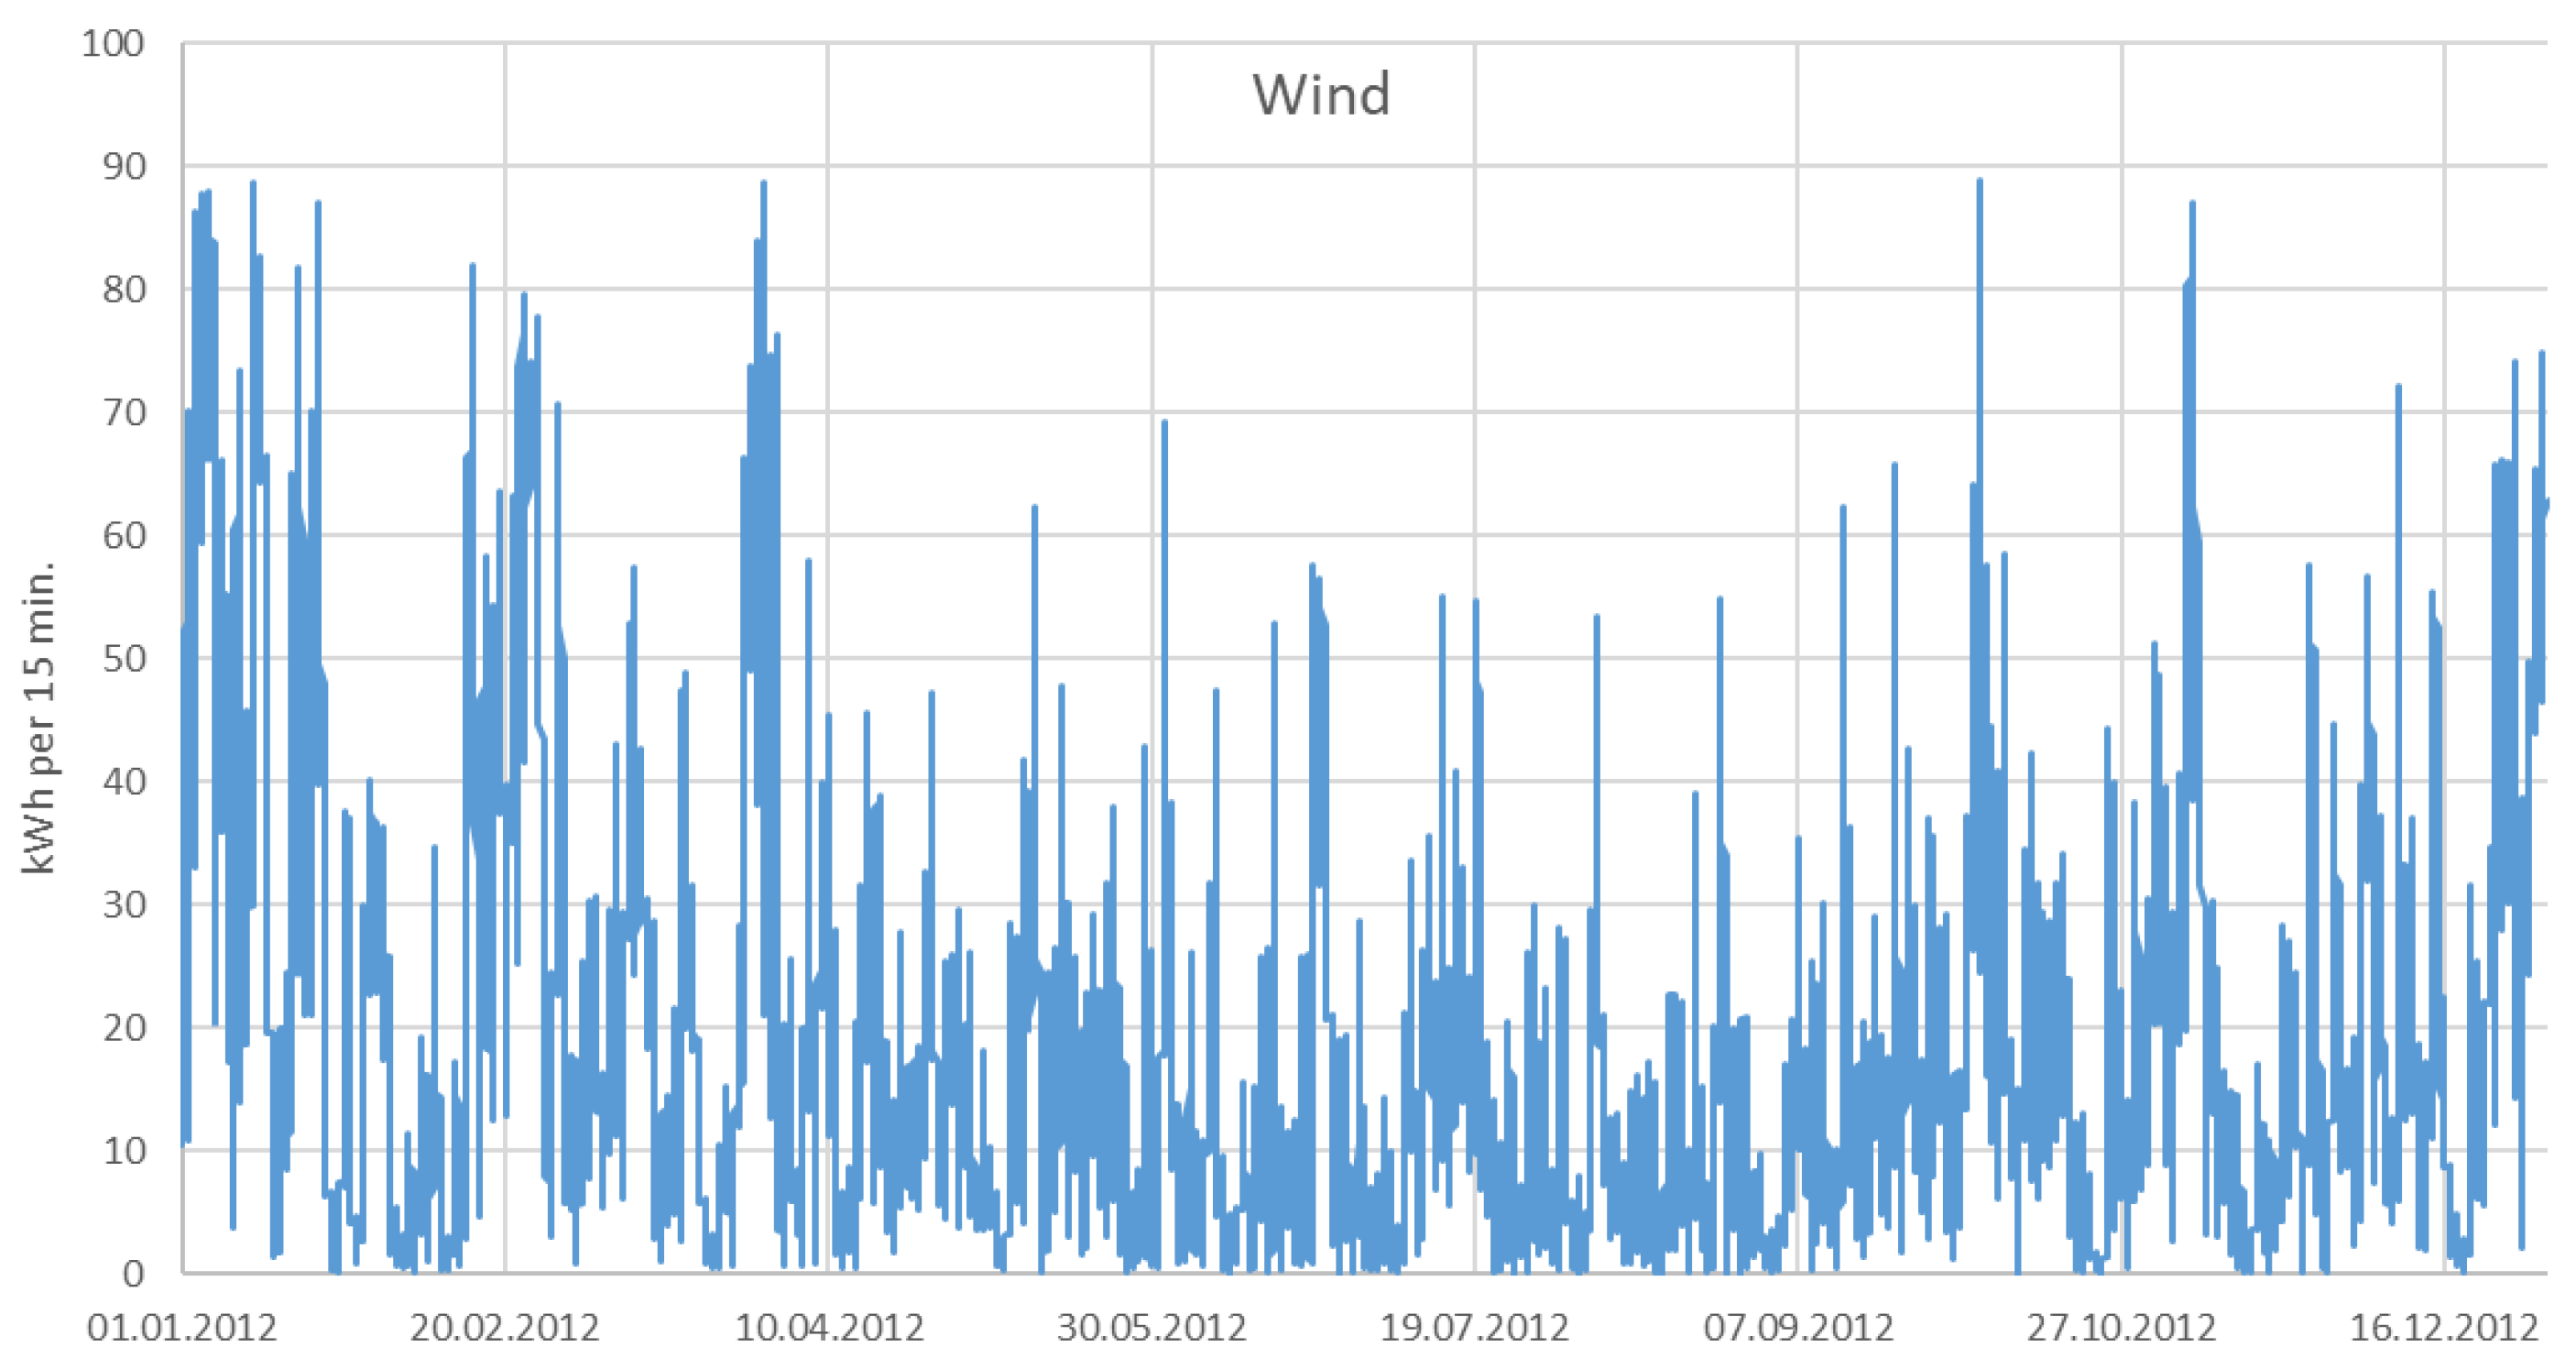
- Modern wind turbines are so big that a single farm can use only a portion of the electricity produced. As of 2020, the permits and thus the investments in this area temporarily decreased significantly. To promote investment in new wind turbines, the participation of citizens and municipalities in these facilities has already been envisaged by law in the state of Mecklenburg–Western Pomerania [4]. Direct participation or subscribing to investment shares in a wind turbine with the possibility of purchasing electricity at generation cost would also be lucrative for farmers because of the low electricity generation cost. Although there is currently no general access to self-generated wind power, this paper takes wind power into account as a future alternative scenario.
- Biogas plants, as a further relevant variant of RE, will not be considered in this paper, as their operation depends very much on the availability of cheap raw and input materials, such as slurry and manure, and even then, they would only be economical with a relatively high feed-in tariff [5]. In addition, the use of batteries in biogas plants is not appropriate, as the gas storage facility already provides storage options, so batteries are obsolete.
1.1. Short Literature Review
1.2. Objective of the Paper
- Selecting the optimal scope of investments in renewable energies and dividing these into wind and PV systems;
- Selecting the optimal level of investment in batteries;
- Maintaining optimal control of electricity sales and purchases (daily sums over a year);
- Minimizing electricity costs for the operation.
1.3. Approach and Method
- Crop production (arable farming);
- Forage farm (dairy);
- Other animal husbandry (farrowing operation, piglet rearing, pig fattening, broiler fattening).
2. Electricity Generation and Storage
2.1. State of the Art
2.2. Current Costs of Electricity Generation and Storage
3. Model Calculations for Farms with Their Own Electricity Generation
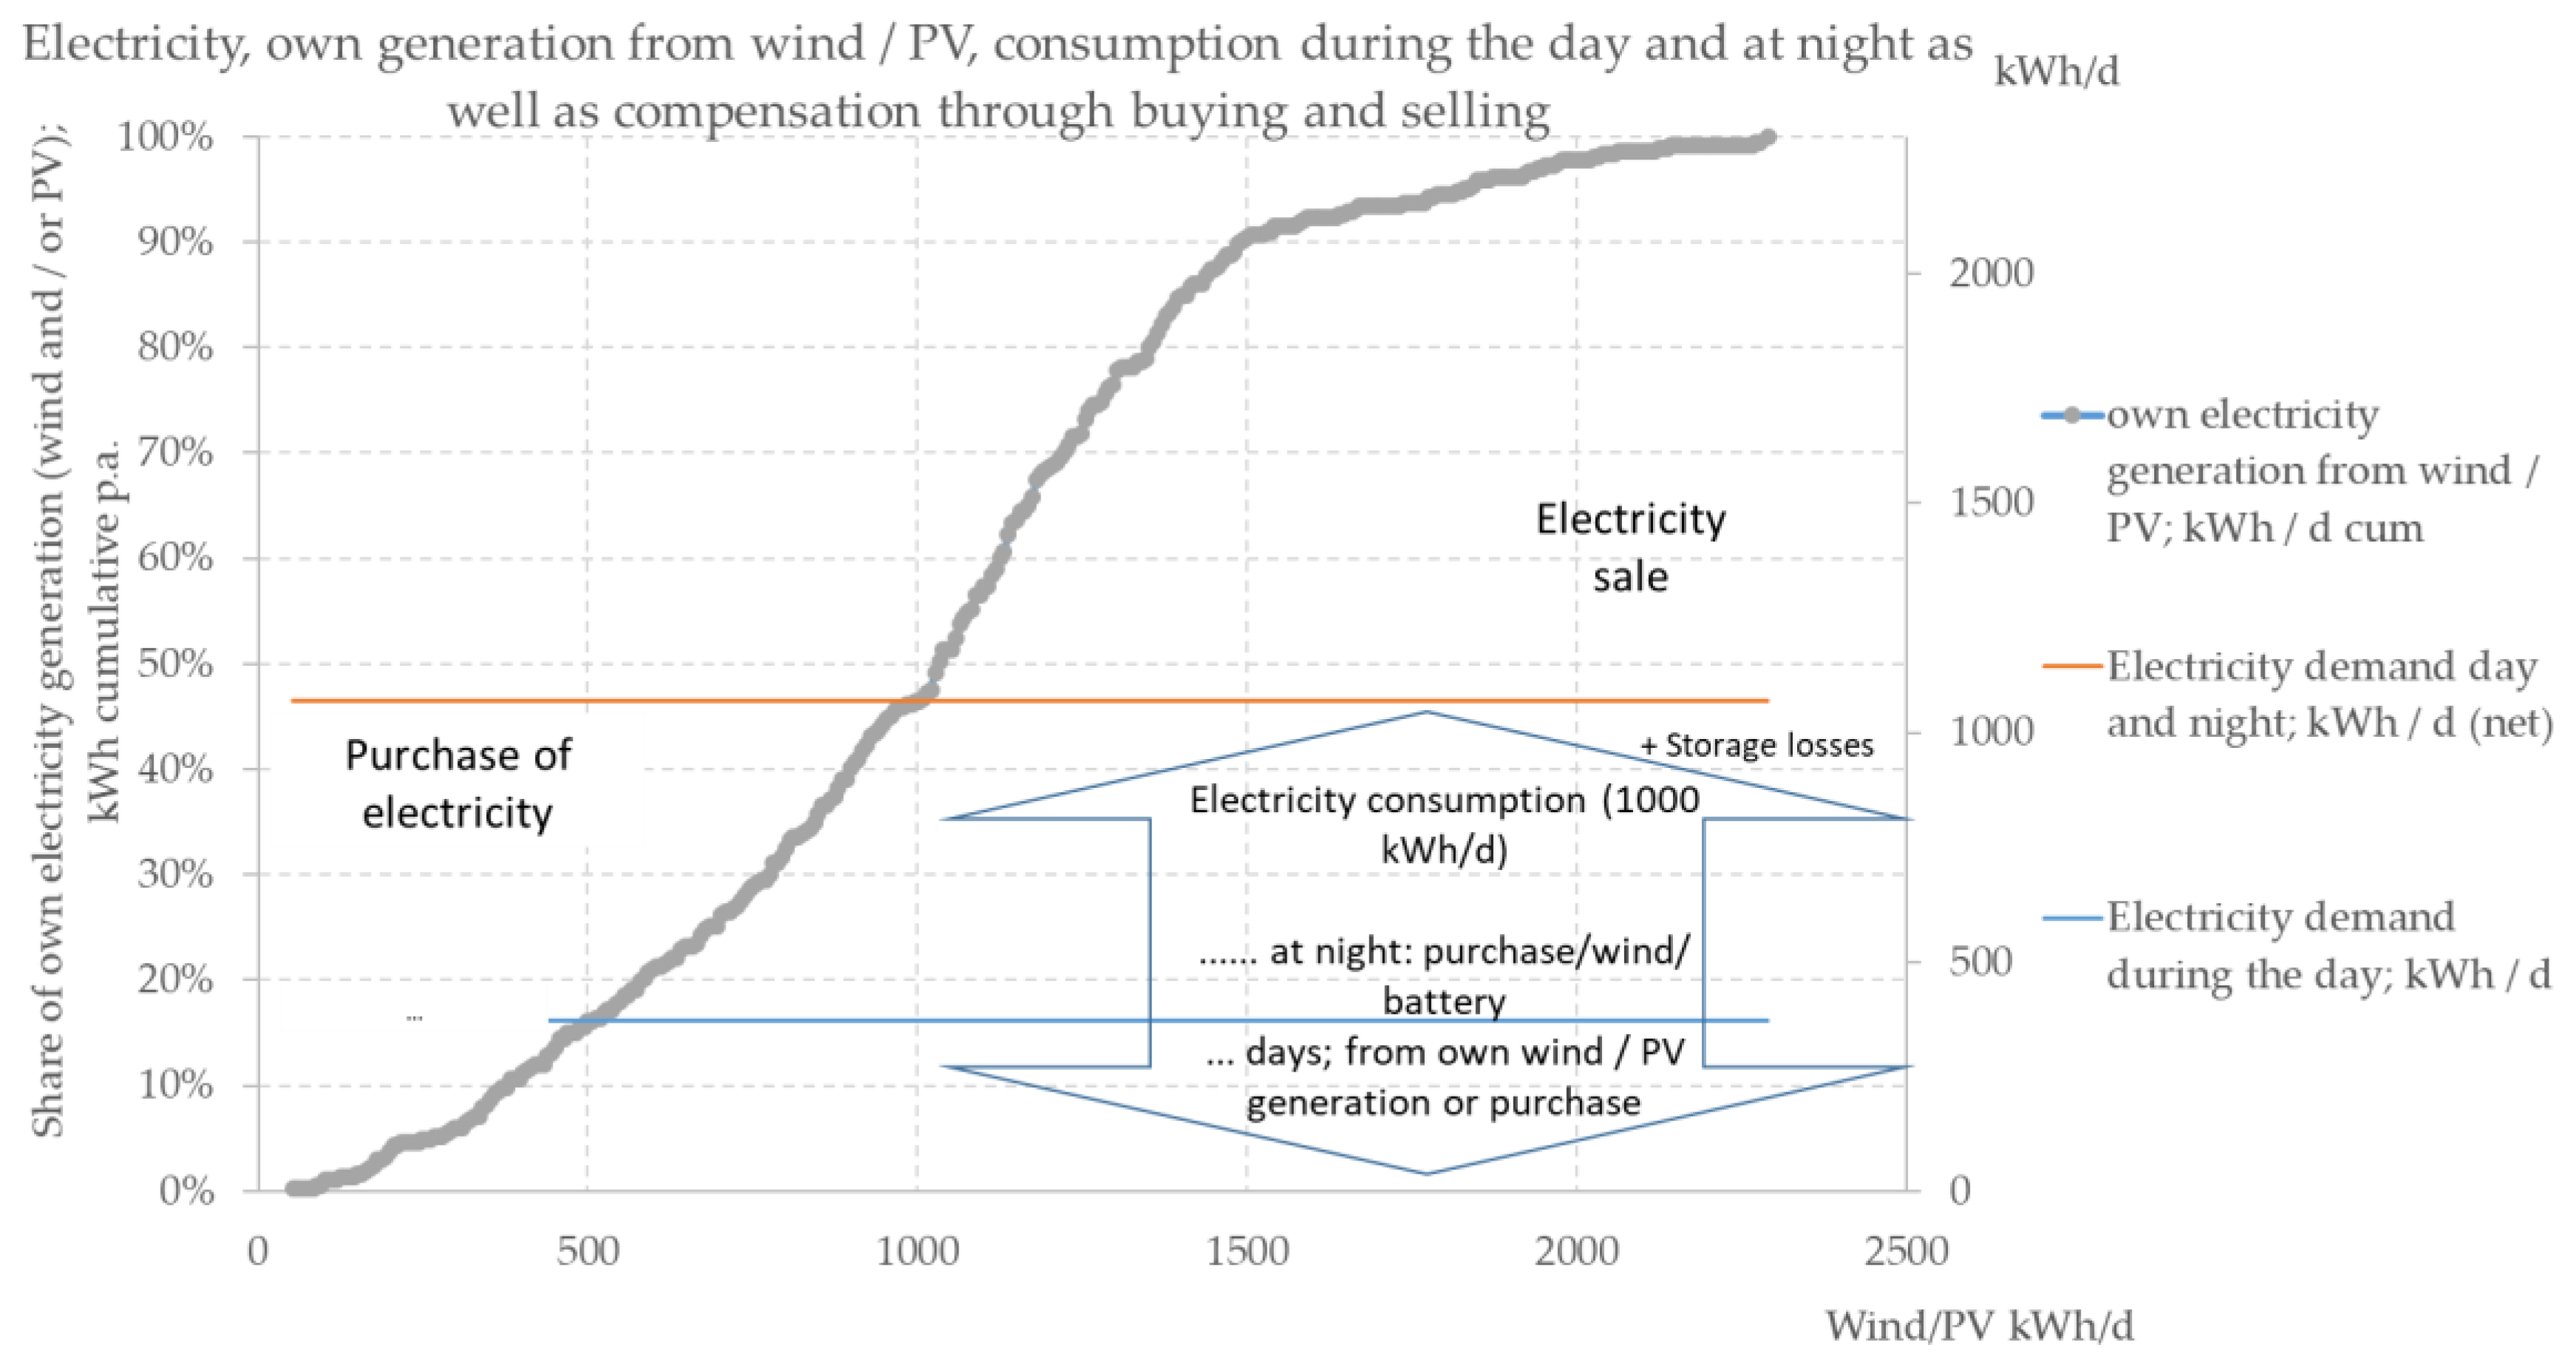
3.1. Electricity Generation with PV Systems and Wind Turbines
3.2. Battery-Compatible Load Curves from Selected Farm Operations
3.3. Calculation Approaches and Modeling Using the Example of Energy Management in Selected Companies
3.4. Questions and Scenarios
4. Results of Simulations
4.1. Optimal Investment Paths with Electricity Consumption Only during the Day
4.2. Optimal Investment Paths with Electricity Consumption Only at Night
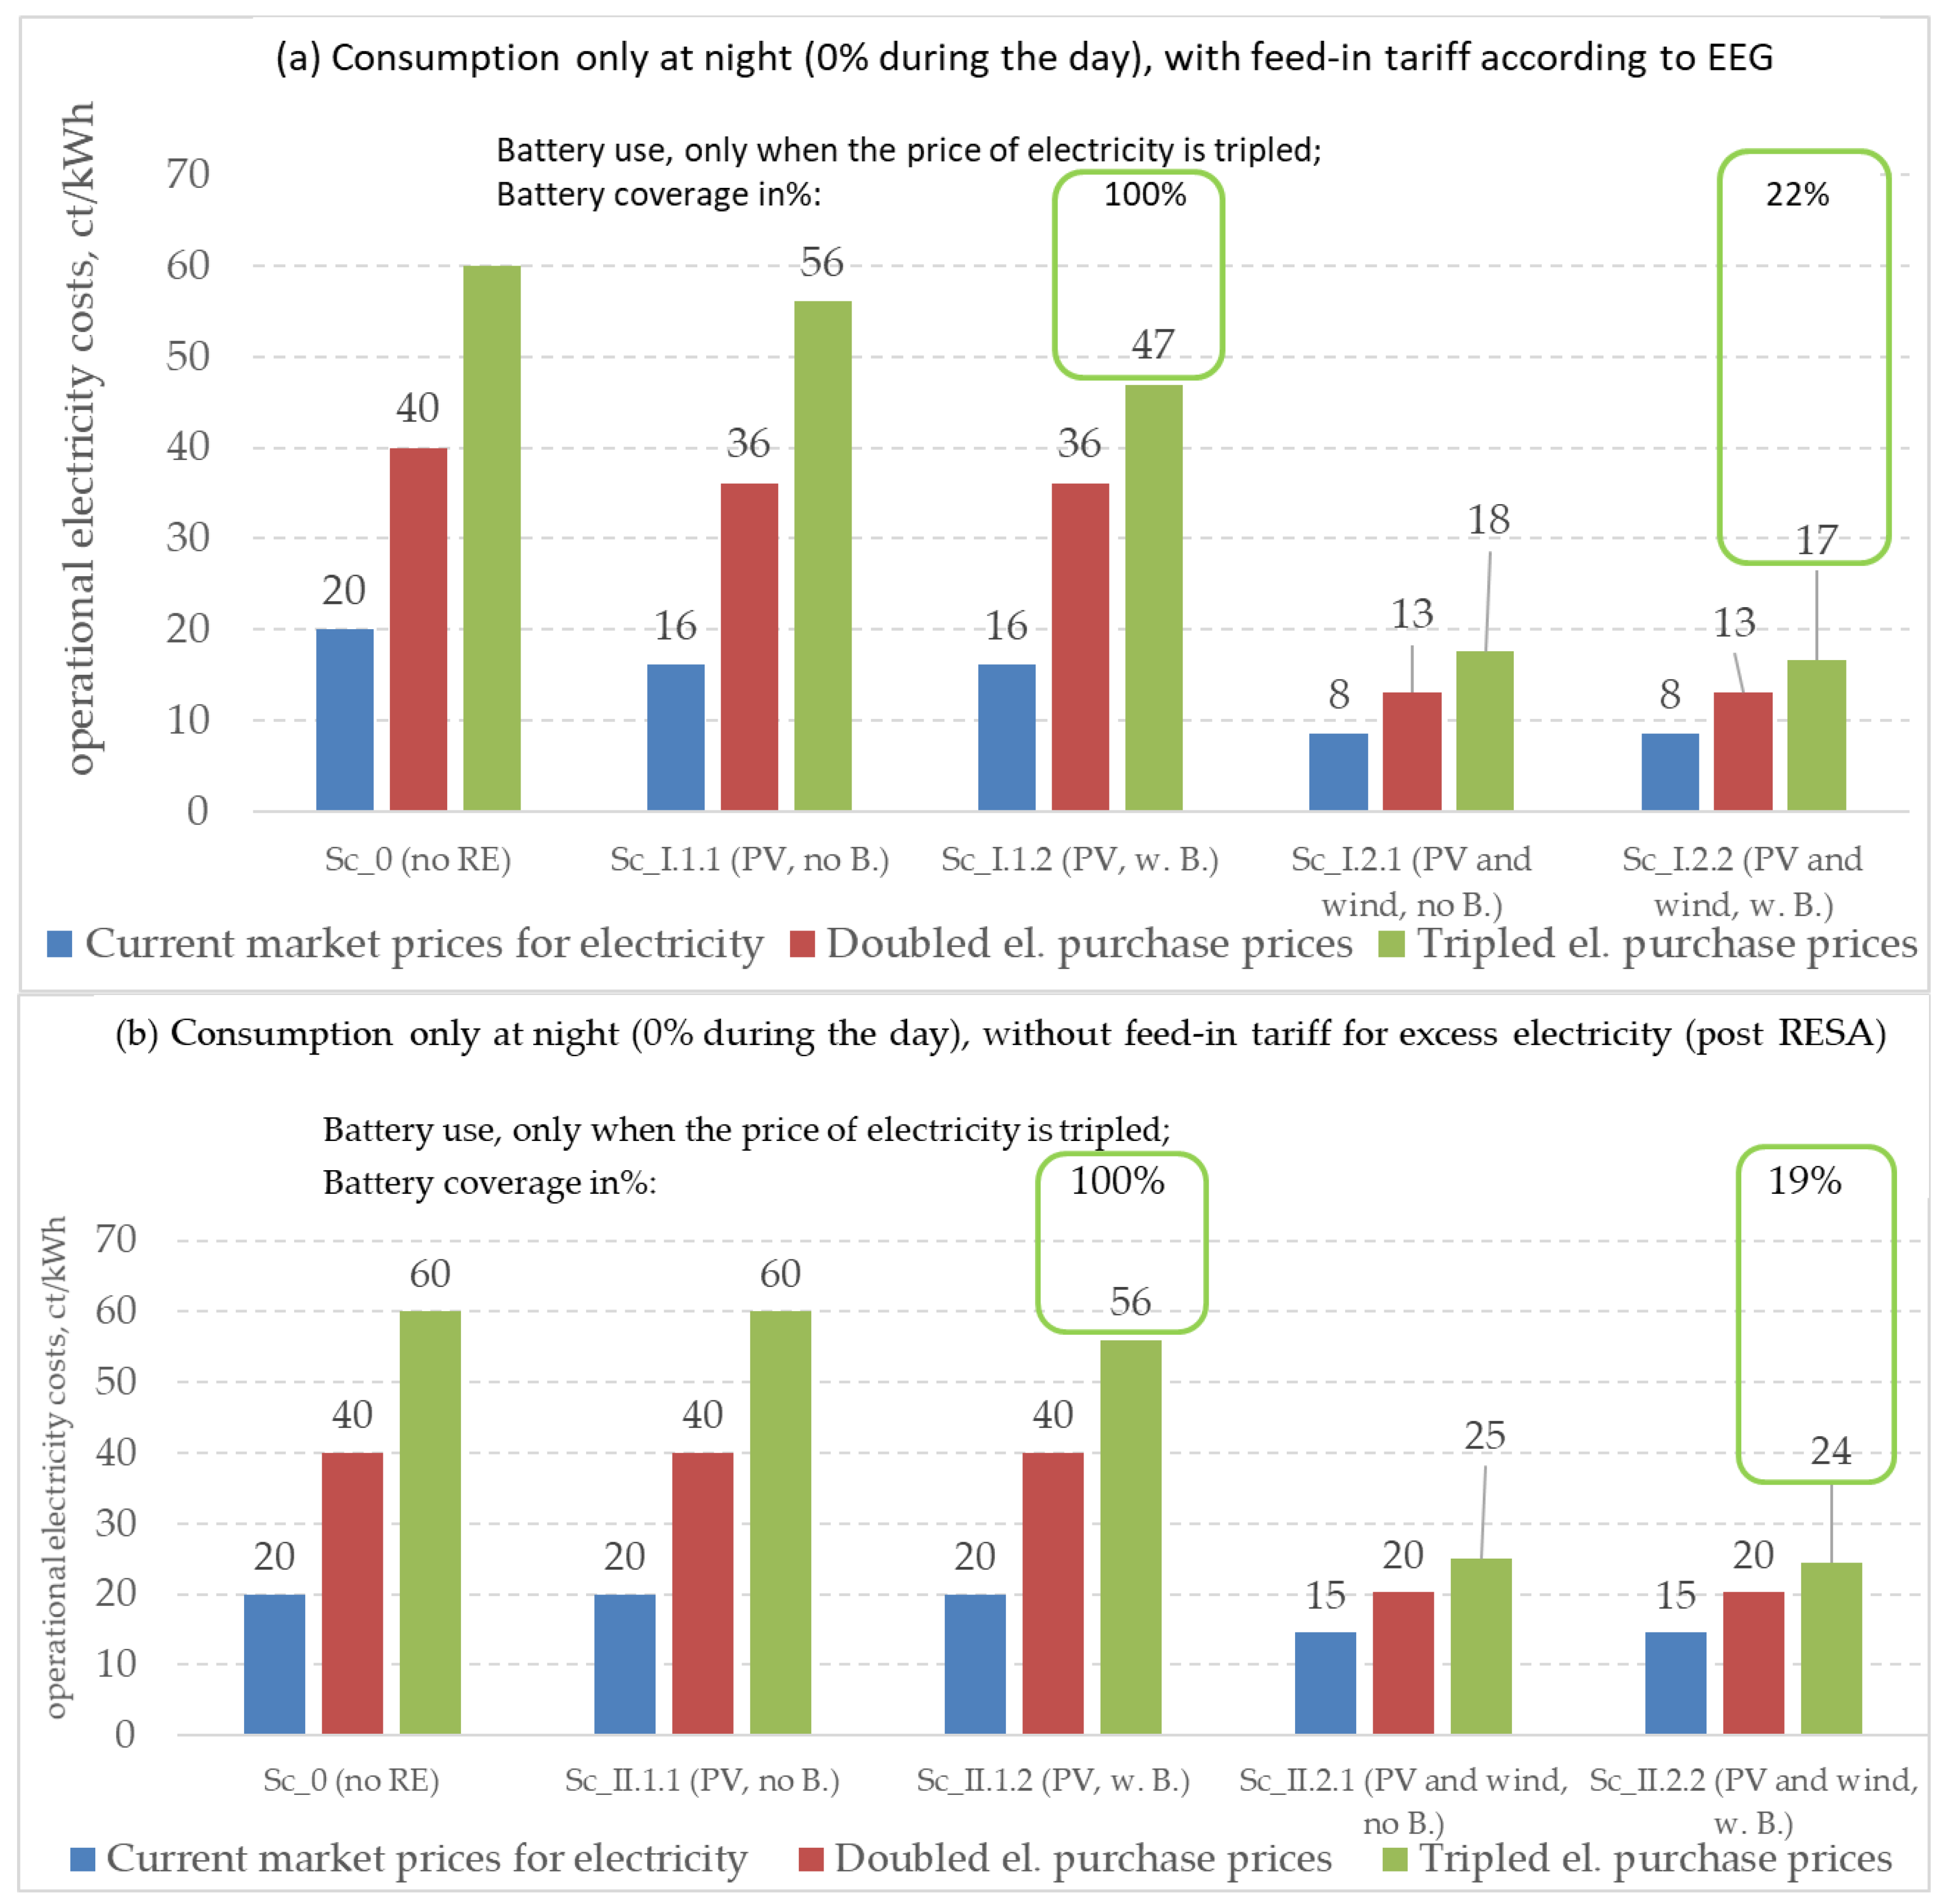
4.3. Sc_I: Electricity Costs and Benefits When Using RE with Feed-In Tariff
4.3.1. Investing in PV Systems: Sc_I.1
4.3.2. Investing in PV Systems and Wind Turbines
4.4. Sc_II: Electricity Costs and Benefits When Using RE in the Period after the RESA, without Feed-In Tariff
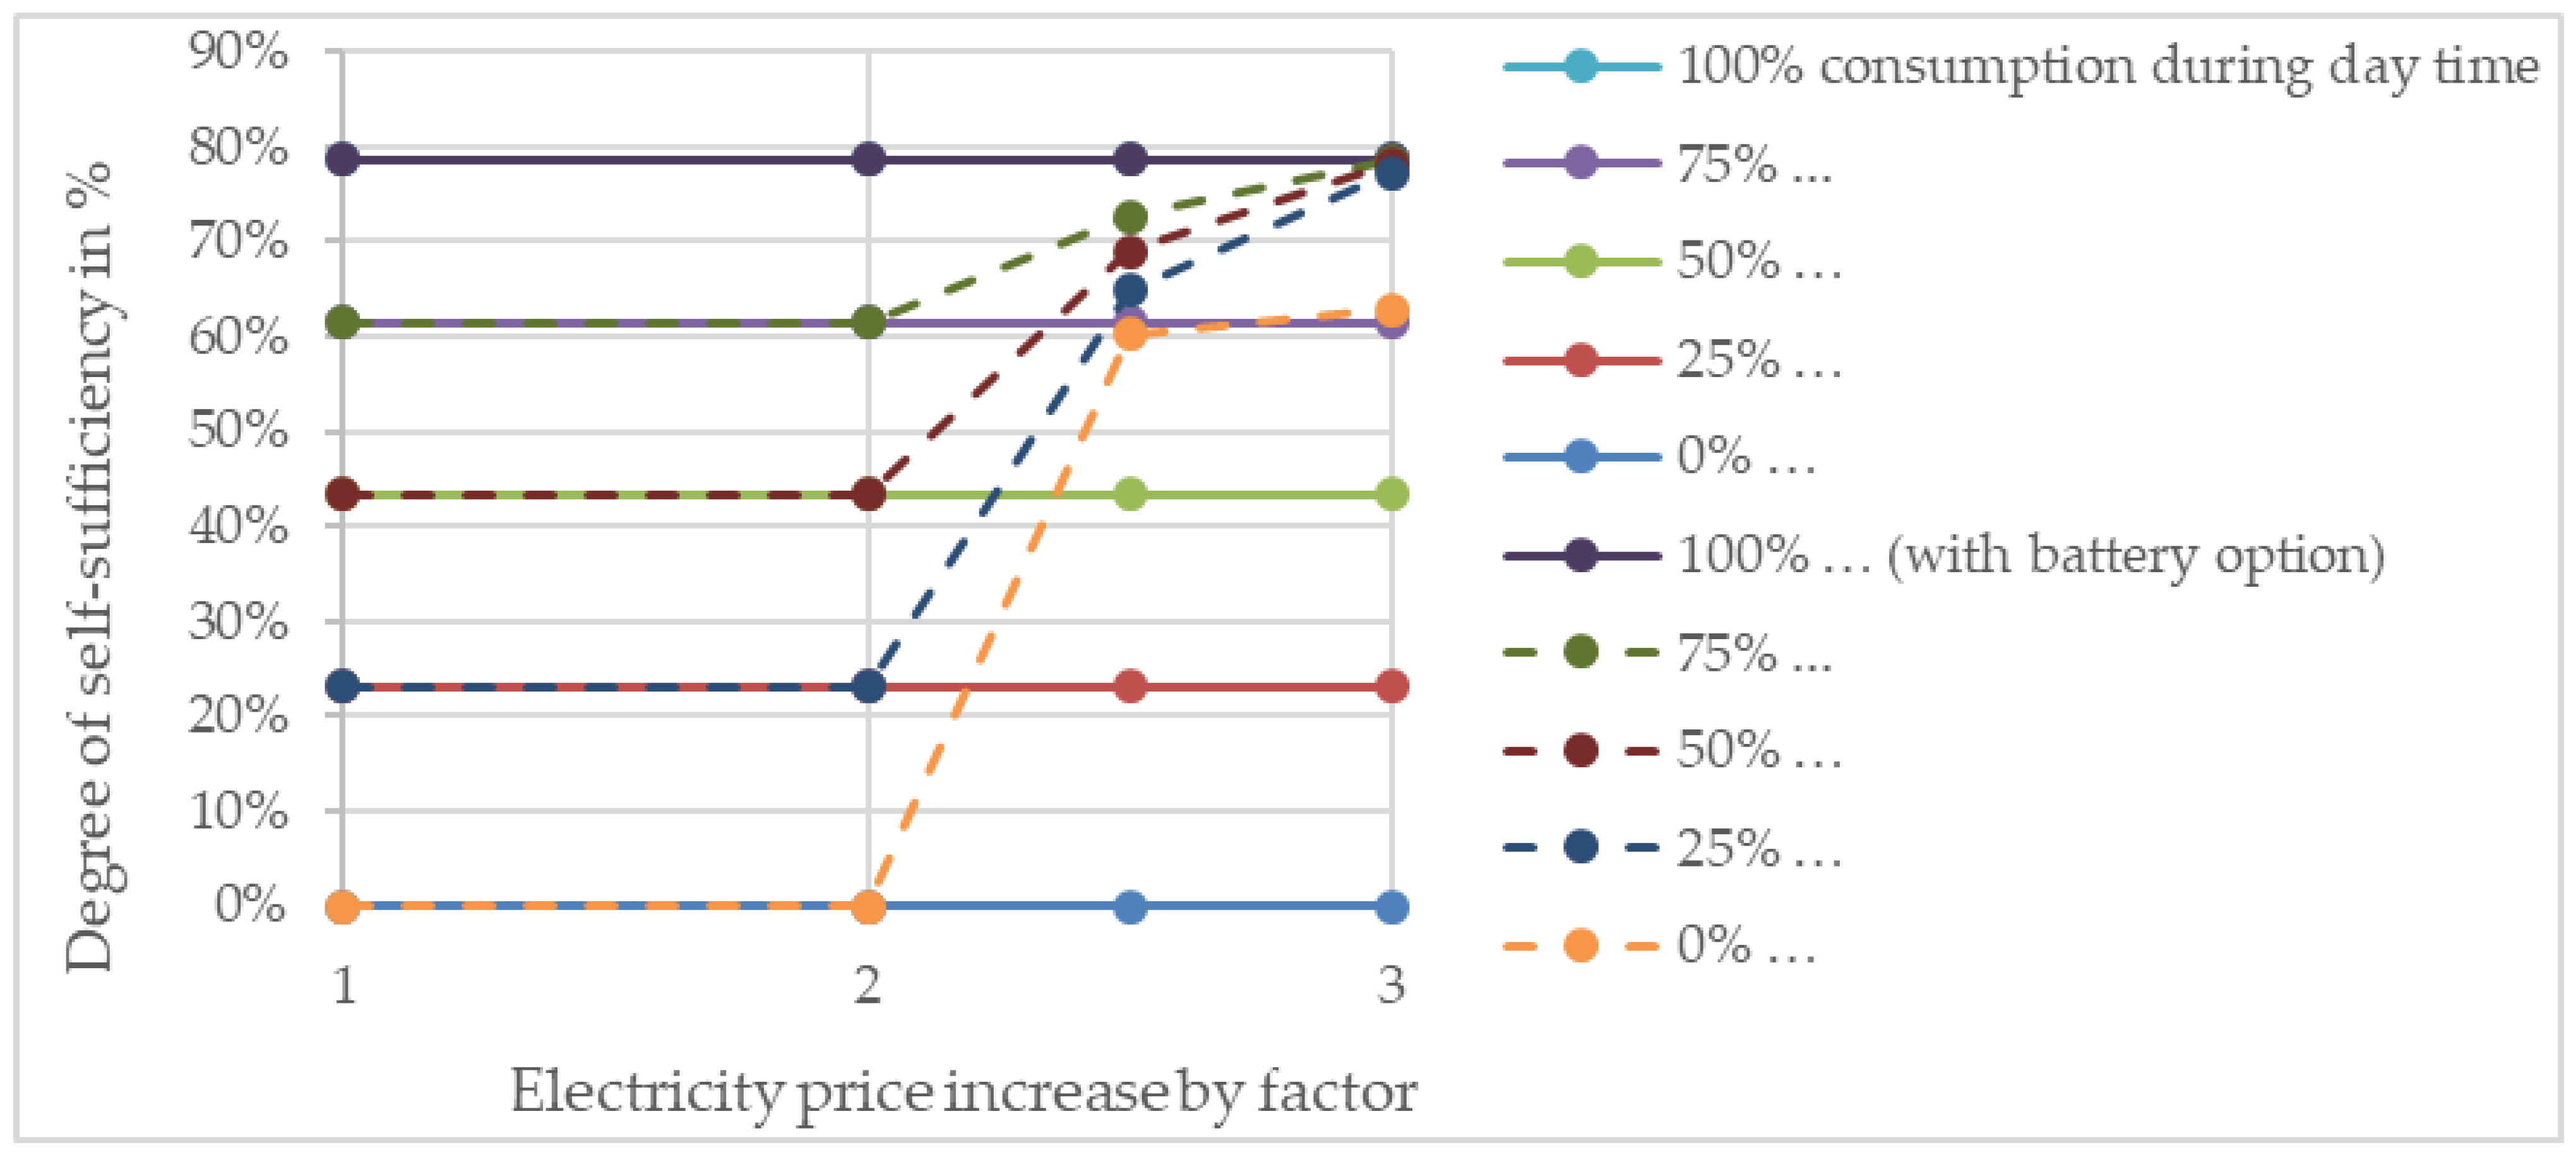
4.5. Summary Comparison of Battery Cover and Battery Usage
5. Discussion and Conclusions
5.1. Limitations of the Algorithm and the Data Used
5.2. Comparing Results and Recommendations for Agricultural and Other Businesses
Author Contributions
Funding
Institutional Review Board Statement
Informed Consent Statement
Conflicts of Interest
References
- UNFCCC. United Nations Framework Convention on Climate Change: The Paris Agreement. 2017. Available online: http://unfccc.int/paris_agreement/items/9485.php (accessed on 7 November 2020).
- EEG. Gesetz für den Vorrang Erneuerbarer Energien (Erneuerbare-Energien-Gesetz—EEG) sowie zur Änderung des Energiewirtschaftsgesetzes und des Mineralölsteuergesetzes vom 29. März 2000 (BGBl. I S. 305); Bundesministerium der Justiz und für Verbraucherschutz: Bonn, Germany, 2020. [Google Scholar]
- Statistisches Bundesamt (Destatis). Daten zur Energiepreisentwicklung. 5.8.2 Elektrischer Strom-Ct/kwh; Statistisches Bundesamt (Destatis): Wiesbaden, Germany, 2020. [Google Scholar]
- Mecklenburg-Vorpommern. Gesetz über die Beteiligung von Bürgerinnen und Bürgern sowie Gemeinden an Windparks in Mecklenburg-Vorpommern (Bürger- und Gemeindenbeteiligungsgesetz-BüGembeteilG M-V) vom 18. Mai 2016. GS Meckl.-Vorp. Gl. Nr. 230-2 vom 18. Mai 2016 (GVOBl. M-V S. 258); Justizministerium Mecklenburg-Vorpommern: Schwerin, Germany, 2016. [Google Scholar]
- Daniel-Gromke, J.N.; Rensberg, V.; Denysenko, T.; Barchmann, K.; Oehmichen, M.; Beil, W.; Beyrich, B.; Krautkremer, M.; Trommler, T.; Reinholz, J.; et al. Optionen für Biogas- Bestandsanlagen bis 2030 aus Ökonomischer und Energiewirtschaftlicher Sicht; Umweltbundesamt: Dessau-Roßlau, Germany, 2020; Available online: https://www.umweltbundesamt.de/publikationen/optionen-fuer-biogas-bestandsanlagen-bis-2030-aus;2020-01-30_texte_24-2020_biogas2030.pdf (accessed on 1 December 2020).
- Trahey, L.; Brushett, F.R.; Balsara, N.P.; Ceder, G.; Cheng, L.; Chiang, Y.-M.; Hahn, N.T.; Ingram, B.J.; Minteer, S.D.; Moore, J.S.; et al. Energy storage emerging: A perspective from the Joint Center for Energy Storage Research. Proc. Natl. Acad. Sci. USA 2020, 117, 12550–12557. [Google Scholar] [CrossRef] [PubMed]
- Um, J.H.; Ahn, C.-Y.; Kim, J.; Jeong, M.; Sung, Y.-E.; Cho, Y.-H.; Kim, S.-S.; Yoon, W.-S. From grass to battery anode: Agricultural biomass hemp-derived carbon for lithium storage. RSC Adv. 2018, 8, 32231–32240. [Google Scholar] [CrossRef] [Green Version]
- Knutel, B.; Pierzyńska, A.; Dębowski, M.; Bukowski, P.; Dyjakon, A. Assessment of energy storage from photovoltaic installations in poland using batteries or hydrogen. Energies 2020, 13, 4023. [Google Scholar] [CrossRef]
- Zhou, H.S.; Passey, R.; Bruce, A.; Sproul, A.B. Aggregated impact of coordinated commercial-scale battery energy storage systems on network peak demand, and financial outcomes. Renew. Sustain. Energy Rev. 2021, 144, 111014. [Google Scholar] [CrossRef]
- Kerry, T.-S. What is the Future of Batteries for Stationary Energy Storage? AZoCleantech. 2021. Available online: https://www.azocleantech.com/article.aspx?ArticleID=1184 (accessed on 14 April 2021).
- AG Energiebilanzen e.V. Bruttostromerzeugung in Deutschland von 1990 bis 2012 nach Energieträgern (Gross Electricity Production in Germany from 1990 to 2012 by Energy Carriers). Available online: http://www.ag-energiebilanzen.de (accessed on 16 February 2013).
- Federal Ministry for Economic Affairs and Energy. Renewable Ernery. Germany. 2021. Available online: https://www.bmwi.de/Redaktion/EN/Dossier/renewable-energy.html (accessed on 8 April 2021).
- Wesselak, V.; Schabbach, T.; Link, T.; Fischer, J. Handbuch Regenerative Energietechnik, 3rd ed.; Springer Verlag GmbH: Vieweg, Germany, 2017; p. 735. [Google Scholar]
- Quaschning, V. Erneuerbare Energien und Klimaschutz. Hintergründe-Techniken und Planung-Ökonomie und Ökologie-Energiewende. 5., aktualisierte Auflage; Carl Hanser Verlag München: München, Germany, 2020; p. 149. [Google Scholar]
- C.A.R.M.E.N.e.V. Battery Storage Market Overview. Germany. 2021. Available online: https://www.carmen-ev.de/service/marktueberblick/marktuebersicht-batteriespeicher/ (accessed on 14 April 2021).
- Theodor Remmersmann In-House Production of Electricity from Sun and Wind. Muenster. 2018. Available online: https://www.ktbl.de/fileadmin/user_upload/Allgemeines/Download/Tagungen_2019/Eigenstromproduktion.pdf (accessed on 9 September 2020).
- Hau, E. Wind Power Plants: Basics, Technology, Use, Economy, 6th ed.; Springer: Berlin/Heidelberg, Germany, 2016. [Google Scholar]
- Tesvolt Battery system TS HV 70/STP 60. 2018. Available online: https://www.tesvolt.com/en/products/ts-hv-70.html (accessed on 14 April 2021).
- Keller, L. Comparison of Theoretical and Actual Power Consumption of a Farm to Optimize Energy Management. Bachelor’s Thesis, University of Neubrandenburg, Neubrandenburg, Germany, 2016. [Google Scholar]
- Skau, K.; Fuchs, C.; Spielmann, V.; Beck, H.-P.; Bettinger, C. Renewable Energy—Opportunities for production and use of electrical power for farmers under conditions of the renewable energy act in Germany. In Proceedings of the 20th International Farm Management Congress 2015, Canada: Healthy Agriculture for a Healthy World; Proceedings, Laval University, Québec, QC, Canada, 12–17 July 2015; International Farm Management Association: Québec, PQ, Canada, 2015; pp. 429–435, ISBN 978-92-990062-3-8. Available online: http://ifmaonline.org/wp-content/uploads/2016/01/15_Skau_etal_P429-435.pdf (accessed on 1 December 2017).
- Seidel, N. Stromspeicher auch für die Landwirtschaft?! 2021. Available online: https://www.landwirtschaftskammer.de/landwirtschaft/technik/energie/photovoltaik/batteriespeicher.htm (accessed on 21 April 2021).
- Vagt, M. Stromspeicher in der Landwirtschaft auf dem Vormarsch. 2021. Available online: https://www.topagrar.com/energie/news/stromspeicher-in-der-landwirtschaft-auf-dem-vormarsch-12067981.html (accessed on 21 April 2021).
- Maschinenring. Batteriespeicher von LandEnergie. 2021. Available online: https://www.maschinenring.de/einkaufsvorteile/strom-und-erdgas/batteriespeicher (accessed on 21 April 2021).



| RE Type/Storage | Acquisition Cost (A0) | Useful Life | Interest Rate | Other Costs, % of A0 | Average Cost, EUR p.a. | Power | Cost, EUR/kWh |
|---|---|---|---|---|---|---|---|
| PV system | EUR 1300/kWp | 20 years | 3% | 2% | 110.50 | 1000 kWh p.a. | 0.1105 |
| Wind turbine | EUR 1000/kWp | 20 years | 3% | 6% | 85 | 3000 kWh p.a. | 0.0417 |
| Battery | EUR 1230/kWh | 30 years | 3% | – | 59.45 | 365 kWh per day 1 | 0.3259 |
| RE Type/Storage | Standardized Daily Electricity Demand, kWh | Annual Electricity Demand, kWh p.a. | Performance Hours (Peak), p.a. | Plant Size, kWp | Investment Amount 1, EUR |
|---|---|---|---|---|---|
| PV system | 1000 | 365,000 | 1000 | 365 | 474,500 |
| Wind turbine | 1000 | 365,000 | 3000 | 122 | 121,667 |
| Battery | 500 | 182,500 | 615,000 |
| Device | Location | System Output (kW) | Number Per Operation | Number Per Hectare | Total System Power (kW) |
|---|---|---|---|---|---|
| Light | Grain hall | 0.86 | 50 | 0.05 | 43.0 |
| High-pressure cleaner | Workshop | 2.9 | 1 | 0.001 | 2.9 |
| Light | Office | 0.06 | 2 | 0.002 | 0.1 |
| Light | Workshop | 0.86 | 4 | 0.004 | 3.4 |
| Light | Grain drying | 0.86 | 10 | 0.01 | 8.6 |
| Light | Lounge | 0.06 | 4 | 0.004 | 0.2 |
| Engine for gas station | Workshop | 0.03 | 1 | 0.001 | 0.03 |
| Electric welding device | Workshop | 0.4 | 1 | 0.001 | 0.4 |
| Computer | Office | 0.078 | 1 | 0.001 | 0.1 |
| Wheel loader (electric) | Drive motor | 15 | 1 | 0.001 | 15.0 |
| Hydraulic motor | 22 | 1 | 0.001 | 22.0 | |
| Drying fan | Grain drying system | 75 | 2 | 6.67 | 150.0 |
| Total | 245.8 |
| Key Figure | Unit | Farm Operation | ||
|---|---|---|---|---|
| Crop Production (Arable Farming) | Forage Farm (Dairy Farm) | Other Animal Husbandry (Farrowing Operation) | ||
| Size | Hectares or Animals | 1000 ha | 690 Milk Cows | 1000 Breeding Sows |
| Total system performance | kW | 245.8 | 169.4 | 67.0 |
| Annual electricity consumption | kWh p.a. | 237,331 | 470,965 | 276,308 |
| Average daily electricity consumption | ||||
| - Total | kWh/d | 650.2 | 1290.3 | 757.0 |
| - During the day | kWh/d | 491.5 | 340.0 | 331.3 |
| - Rest (night) | kWh/d | 158.7 | 950.3 | 425.7 |
| Relation day/night | ||||
| - Share day | Percent | 76% | 26% | 44% |
| - Share night | Percent | 24% | 74% | 56% |
| Consumption in 15 min | ||||
| - Minimum | kWh/15 min | 0.0 | 4.0 | 6.7 |
| - Maximum | kWh/15 min | 13.9 | 32.5 | 10.4 |
| Scenario (Sc_ 0 = no RE, I, II with RE) | Type of RE (1 = PV/2 = PV and Wind) | .1 = no/.2 = with Battery | Name | Abbreviation |
|---|---|---|---|---|
| Sc_0 | Initial situation (status quo) without RE | Sc_0 (no RE) | ||
| Sc_I | Sale of surplus electricity with feed-in tariff according to RESA | |||
| I.1 | Investment in PV systems only | |||
| I.1.1 | … without battery | Sc_I.1.1 (PV no B.) | ||
| I.1.2 | … with battery | Sc_I.1.2 (PV w. B.) | ||
| I.2 | Investment in PV systems and wind turbines | |||
| I.2.1 | … without battery | Sc_I.2.1 (PV and W no B.) | ||
| I.2.2 | … with battery | Sc_I.2.2 (PV and W w. B.) | ||
| Sc_II | Investment in renewables for own use, no/low feed-in tariff for electricity surplus | |||
| II.1 | Investment in PV systems only | |||
| II.1.1 | … without battery | Sc_II.1.1 (PV no B.) | ||
| II.1.2 | … with battery | Sc_II.1.2 (PV w. B.) | ||
| II.2 | Investment in PV systems and wind turbines | |||
| II.2.1 | … without battery | Sc_II.2.1 (PV and W no B.) | ||
| II.2.2 | … with battery | Sc_II.2.2 (PV and W w. B.) |
| Own Electricity Production with | PV, Size of Consumption in %; No Battery | PV and Battery, Battery Coverage in % of Consumption (Utilization in %) | |||||||
|---|---|---|---|---|---|---|---|---|---|
| Price increased by factor of | 1 (status quo) | 2 | 2.5 | 3 | 1 (status quo) | 2 | 2.5 | 3 | |
| Purchase price for electricity, ct/kWh | 20 | 40 | 50 | 60 | 20 | 40 | 50 | 60 | |
| Load curves: share of consumption per day, % | 0% | Same value for all variants; since investment is worthwhile, maximum specified value of 200% is achieved | 0 | 0 | 95% (79%) | 100% (79%) | |||
| 25% | 0 | 0 | 70% (75%) | 94% (72%) | |||||
| 50% | 0 | 0 | 45% (71%) | 62% (70%) | |||||
| 75% | 0 | 0 | 20% (69%) | 31% (68%) | |||||
| 100% | 0 | 0 | 0% | 0% | |||||
| Own Electricity Production with | PV (without Battery Option) | PV and Battery | |||||||
|---|---|---|---|---|---|---|---|---|---|
| Price increased by factor of | 1 (status quo) | 2 | 2.5 | 3 | 1 (status quo) | 2 | 2.5 | 3 | |
| Purchase price for electricity, ct/kWh | 20 | 40 | 50 | 60 | 20 | 40 | 50 | 60 | |
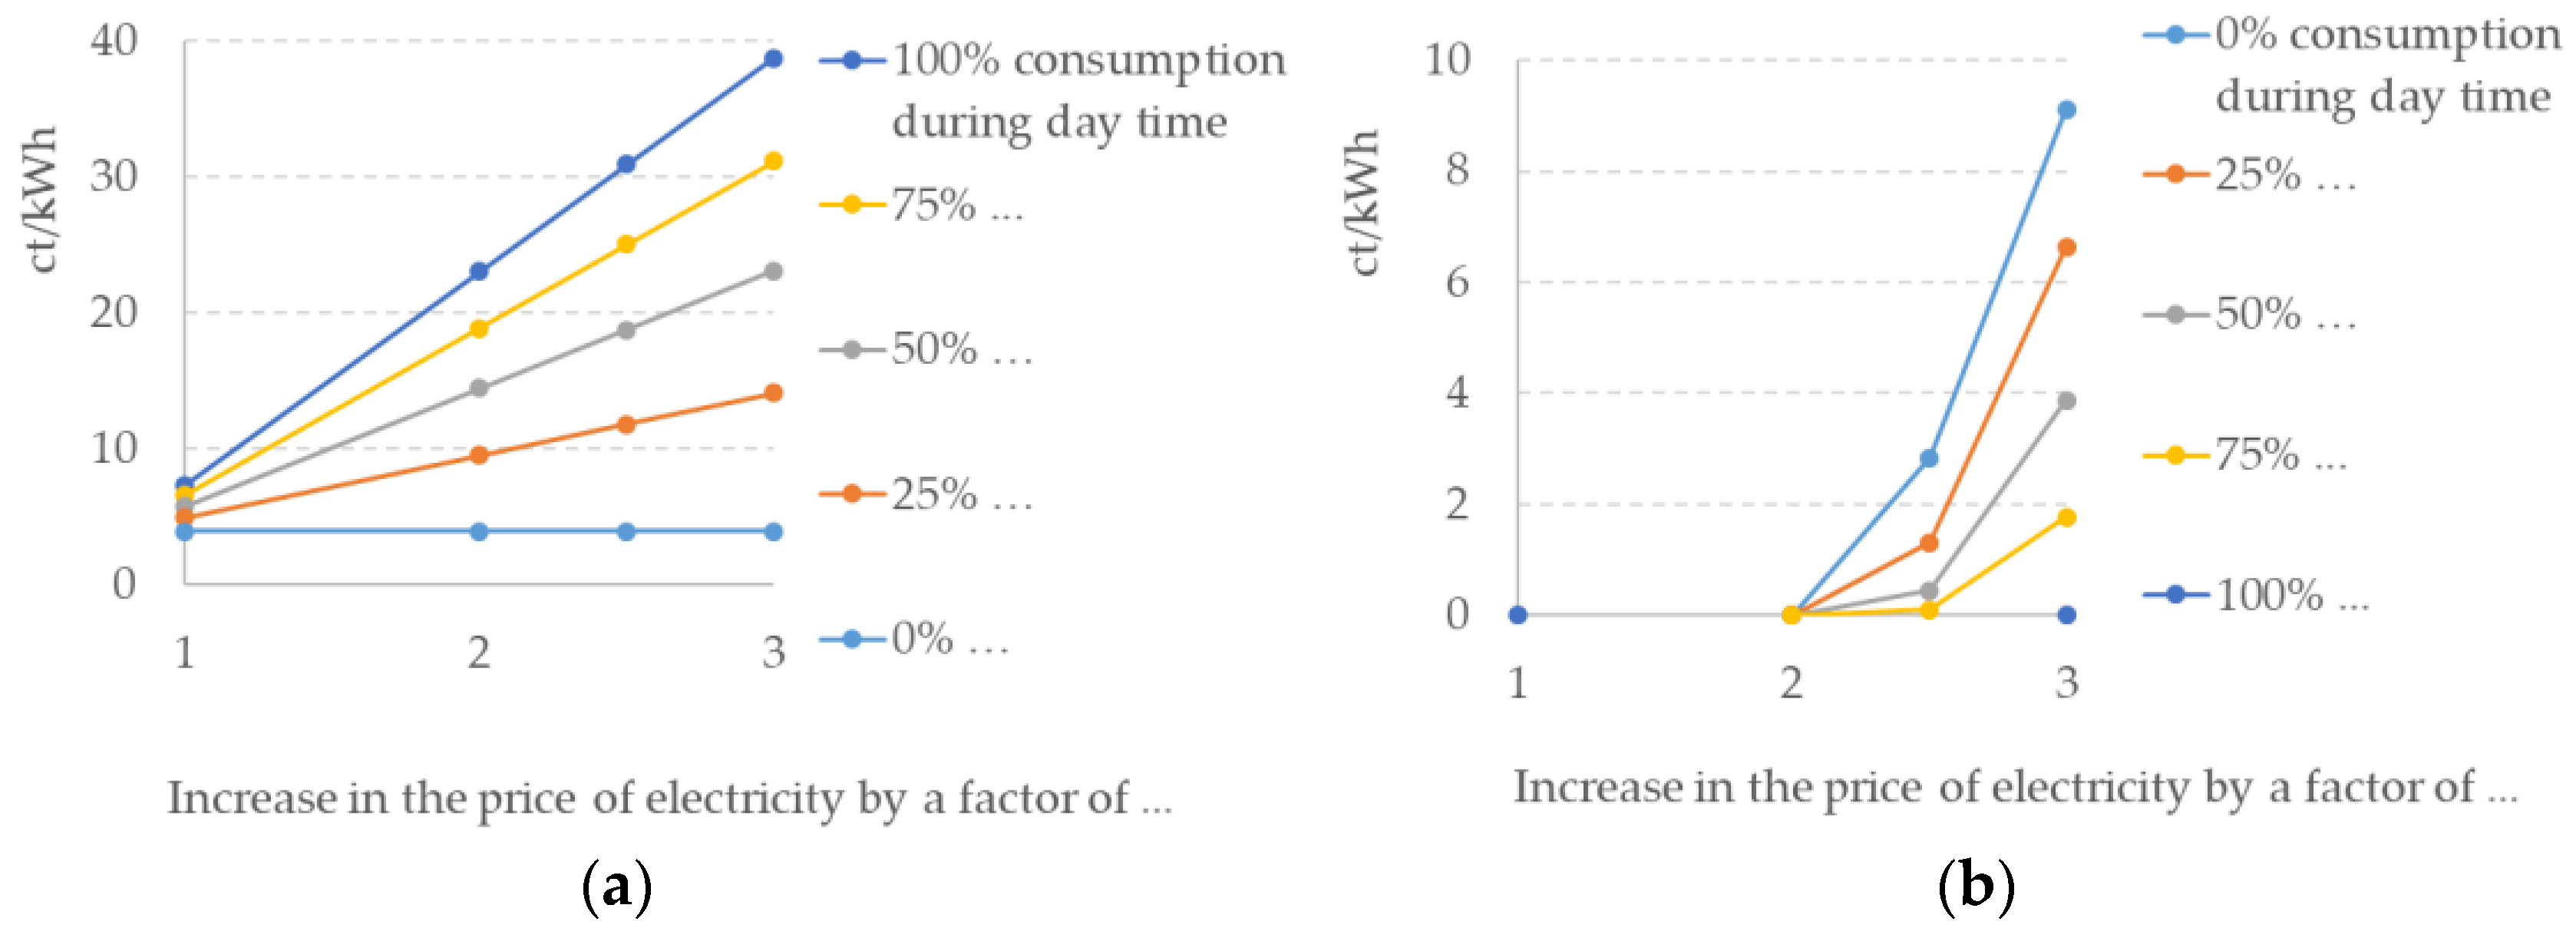
| Load curves: share of consumption per day, % | 0% | 16.1 | 36.1 | 46.1 | 56.1 | 16.1 | 36.1 | 43.2 | 47.0 |
| 25% | 15.1 | 30.5 | 38.2 | 45.9 | 15.1 | 30.5 | 36.9 | 39.2 | |
| 50% | 14.2 | 25.5 | 31.2 | 36.9 | 14.2 | 25.5 | 30.8 | 33.0 | |
| 75% | 13.4 | 21.1 | 25.0 | 28.8 | 13.4 | 21.1 | 24.9 | 27.1 | |
| 100% | 12.7 | 17.0 | 19.1 | 21.2 | 12.7 | 17.0 | 19.1 | 21.2 | |
| Own Electricity Production with | Ratio of PV System Size and Wind Capacity (Total in Each Case 100%) | Battery Coverage in % of Consumption (Utilization in %) | ||||||||
|---|---|---|---|---|---|---|---|---|---|---|
| Price increased by factor of | 1 (status quo) | 2 | 2.5 | 3 | 1 (status quo) | 2 | 2.5 | 3 | ||
| Purchase price for electricity, ct/kWh | 20 | 40 | 50 | 60 | 20 | 40 | 50 | 60 | ||
| Load curves: share of consumption per day, % | 0% | Share of PV system: Wind turbine: | 18% 72% | 21% 79% | 19% 81% | 23% 77% | 0 | 0 | 0 | 22% (52%) |
| 25% | 35% 65% | 17% 73% | 25% 75% | 25% 75% | 0 | 0 | 0 | 0 | ||
| 50% | 36% 64% | 34% 66% | 34% 66% | 34% 66% | 0 | 0 | 0 | 0 | ||
| 75% | 33% 67% | 40% 60% | 43% 57% | 46% 54% | 0 | 0 | 0 | 0 | ||
| 100% | 37% 63% | 64% 46% | 64% 46% | 66% 44% | 0 | 0 | 0 | 0 | ||
| Own Electricity Production with | Wind and PV | Wind and PV and Battery | |||||||
|---|---|---|---|---|---|---|---|---|---|
| Price increased by factor of | 1 (status quo) | 2 | 2.5 | 3 | 1 (status quo) | 2 | 2.5 | 3 | |
| Purchase price for electricity, ct/kWh | 20 | 40 | 50 | 60 | 20 | 40 | 50 | 60 | |
| Load curves: share of consumption per day, % | 0% | 8.5 | 13.1 | 15.3 | 17.6 | 8.5 | 13.1 | 15.3 | 16.6 |
| 25% | 8.3 | 11.6 | 13.2 | 14.9 | 8.3 | 11.6 | 13.2 | 14.9 | |
| 50% | 6.9 | 8.1 | 13.8 | 15.5 | 6.9 | 8.1 | 13.8 | 15.5 | |
| 75% | 8.4 | 9.7 | 10.4 | 11.0 | 8.4 | 9.7 | 10.4 | 11.0 | |
| 100% | 11.9 | 13.1 | 14.1 | 15.2 | 11.9 | 13.1 | 14.1 | 15.2 | |
| Own Electricity Production with | PV (without Battery), Size in % of Consumption | PV and Battery:PV Size and Battery Coverage in % of Consumption (Utilization in %) | |||||||
|---|---|---|---|---|---|---|---|---|---|
| Price increased by factor of | 1 (status quo) | 2 | 2.5 | 3 | 1 Status quo | 2 | 2.5 | 3 | |
| Purchase price for electricity, ct/kWh | 20 | 40 | 50 | 60 | 20 | 40 | 50 | 60 | |
| Load curves: share of consumption per day, % | 0% | – | – | – | – | – | – | – | 84% 100% (65%) |
| 25% | 15% | 20% | 22% | 24% | 15% | 20% | 28% 9% (49%) | 103% 94% (60%) | |
| 50% | 29% | 40% | 44% | 49% | 29% | 40% | 56% 17% (49%) | 102% 62% (57%) | |
| 75% | 44% | 59% | 66% | 73% | 44% | 59% | 84% 26% (49%) | 100% 31% (54%) | |
| 100% | 59% | 79% | 88% | 98% | 59% | 79% | 88% | 98% | |
| Variant | With Feed-In Tariff | Without Feed-In Tariff (Post-RESA) | ||||||
|---|---|---|---|---|---|---|---|---|
| PV and Battery | PV and Wind | PV and Battery | PV and Wind | |||||
| Electricity price increased by factor of | 1 (status quo) | 2 | 2.5 | 3 | 1 (status quo) | 2 | 2.5 | |
| Purchase price for electricity, ct/kWh | 20 | 40 | 50 | 60 | 20 | 40 | 50 | |
| Load curves: share of consumption per day, % | 0% | 95% (79%) | 100% (79%) | 22% (52%) | – | 100% (65%) | 7% (48%) | 19% (46%) |
| 25% | 70% (75%) | 94% (72%) | – | 9% (49%) | 94% (60%) | – | – | |
| 50% | 45% (71%) | 62% (70%) | – | 17% (49%) | 62% (57%) | – | – | |
| 75% | 20% (69%) | 31% (68%) | – | 26% (49%) | 31% (57%) | – | – | |
| 100% | – | – | – | – | – | – | – | |
Publisher’s Note: MDPI stays neutral with regard to jurisdictional claims in published maps and institutional affiliations. |
© 2021 by the authors. Licensee MDPI, Basel, Switzerland. This article is an open access article distributed under the terms and conditions of the Creative Commons Attribution (CC BY) license (https://creativecommons.org/licenses/by/4.0/).
Share and Cite
Fuchs, C.; Poehls, A.; Skau, K.; Kasten, J. Economics of Battery Use in Agriculture: Economic Viability of Renewable Energy Complemented with Batteries in Agriculture. Energies 2021, 14, 2430. https://doi.org/10.3390/en14092430
Fuchs C, Poehls A, Skau K, Kasten J. Economics of Battery Use in Agriculture: Economic Viability of Renewable Energy Complemented with Batteries in Agriculture. Energies. 2021; 14(9):2430. https://doi.org/10.3390/en14092430
Chicago/Turabian StyleFuchs, Clemens, Axel Poehls, Katharina Skau, and Joachim Kasten. 2021. "Economics of Battery Use in Agriculture: Economic Viability of Renewable Energy Complemented with Batteries in Agriculture" Energies 14, no. 9: 2430. https://doi.org/10.3390/en14092430
APA StyleFuchs, C., Poehls, A., Skau, K., & Kasten, J. (2021). Economics of Battery Use in Agriculture: Economic Viability of Renewable Energy Complemented with Batteries in Agriculture. Energies, 14(9), 2430. https://doi.org/10.3390/en14092430


