Article

Economics of Battery Use in Agriculture: Economic Viability of Renewable Energy Complemented with Batteries in Agriculture

Department of Agriculture and Food Sciences, University of Applied Sciences, 17033 Neubrandenburg, Germany
*
Author to whom correspondence should be addressed.
Energies 2021, 14(9), 2430; https://doi.org/10.3390/en14092430
Submission received: 2 March 2021 / Revised: 21 April 2021 / Accepted: 22 April 2021 / Published: 24 April 2021
(This article belongs to the Section F: Electrical Engineering)

Abstract

:
The production of renewable energy fluctuates in terms of sun and wind and must be supplemented by storage in the system. On an individual basis, i.e., for centralized electricity production and predominantly self-consumption, the use of batteries is considered here. Possible future development scenarios were simulated based on current price relationships (status quo). In the status quo, a selling price for PV electricity of 13 Euro cents (ct)ct/kWh was assumed with a production cost of 11 ct/kWh. The selling price of wind power is 5 ct/kWh with a production cost of 3 ct/kWh. The cost of storing electricity in a battery increases the price by 33 ct/kWh. A price of 20 ct/kWh is assumed for electricity purchases by companies. In the status quo, the use of batteries is not economical given the assumed price relationships. Changing the framework conditions, such as those of the legislature in Germany with the nuclear power phase-out and in the EU with the coal exit and decarbonization, will lead to increased availability of (fluctuating) renewable electricity, especially during the day. The purchase of electricity at other times, when the supply is scarce, can lead to increased electricity prices, especially at night. Together with falling costs for storage, the use of batteries for centralized power generators could be very interesting in the future. The method used in this study is nonlinear optimization of the target function costs of electricity supply in the developed simulation model. The results can also be transferred to other countries, as the assumed trends apply worldwide.

1. Introduction

In order to counteract climate change, in the Paris Agreement of 2015, the world community agreed on an upper limit for global warming of 1.5–2 °C [1]. In order to achieve climate goals, renewable energy (RE) is also being further expanded in Germany. The legislature in Germany introduced a restructuring of the energy sector in several steps, and RE has been promoted since 2000. Further decisive events were the decision to phase out nuclear power in 2011 and the decision to phase out coal and introduce CO2 taxation in 2019. The introduction of renewable energy in Germany is supported by the Renewable Energy Sources Act (RESA; in German, Erneuerbare-Energien-Gesetz, EEG 2000) [2]. Renewable electricity production is supported by a surcharge of about 6.5 Euro cents (ct) ct/kWh, which most electricity consumers have to pay and which increases the electricity price for consumers by around 23%. This levy, electricity generation costs and other fees, taxes and ancillary costs have led to rising electricity prices by up to 30% in the last decade (Figure 1). Comparing across Europe, electricity prices are highest in Germany, along with Belgium and Denmark, while in France, for example, electricity costs only two-thirds as much. The electricity price for households (annual consumption of 2500 kWh to less than 5000 kWh) is currently about 30 ct/kWh, while for industry (annual consumption of 2000 MWh to less than 20,000 MWh) it is only 13 ct/kWh [3]. The purchase price for electricity for farmers lies between those two prices and is currently around 20 ct/kWh (status quo). From the development and general conditions shown, it can be deduced that electricity prices will continue to rise.
Future higher electricity prices and a decrease in remuneration for electricity fed into the grid by the photovoltaic (PV) system show a tendency towards higher shares of self-consumption of generated solar electricity, especially since electricity storage systems, which are necessary for this, are relatively cheaper. An increasing proportion of self-sufficiency requires increased battery capacity.
In the meantime, i.e., since the targeted funding at the beginning of the new millennium, the technology and efficiency of RE generation have improved significantly. At the same time, the generation and consumption of solar electricity are competitive with the purchase of electricity. Renewable energy sources are becoming increasingly important, especially in agricultural operations, because this is where wind turbines, photovoltaic systems and biogas systems are primarily located. The following points can be made:
  • For individual companies and with a view to the future, PV systems are of particular interest, as they can be installed at any location and on almost any roof.
  • Modern wind turbines are so big that a single farm can use only a portion of the electricity produced. As of 2020, the permits and thus the investments in this area temporarily decreased significantly. To promote investment in new wind turbines, the participation of citizens and municipalities in these facilities has already been envisaged by law in the state of Mecklenburg–Western Pomerania [4]. Direct participation or subscribing to investment shares in a wind turbine with the possibility of purchasing electricity at generation cost would also be lucrative for farmers because of the low electricity generation cost. Although there is currently no general access to self-generated wind power, this paper takes wind power into account as a future alternative scenario.
  • Biogas plants, as a further relevant variant of RE, will not be considered in this paper, as their operation depends very much on the availability of cheap raw and input materials, such as slurry and manure, and even then, they would only be economical with a relatively high feed-in tariff [5]. In addition, the use of batteries in biogas plants is not appropriate, as the gas storage facility already provides storage options, so batteries are obsolete.
Since the supply of wind and PV power can fluctuate sharply on short notice, storage devices such as batteries are necessary to stabilize the grid or to secure the power supply during “dark doldrums”. It can be expected that farmers would prefer to use the electricity they produce themselves and store it to bridge gaps in supply. With the further construction of photovoltaic and wind power plants (also in Germany), the extent of fluctuation in potentially available electricity generation capacity increases over the course of the year due to the natural supply of wind and solar energy. To compensate for this, electricity storage systems are required, which balance the fluctuating supply and demand even before being fed into the higher-level network and guarantee efficient energy distribution. Concerning renewable energy sources, power grids could be relieved by using batteries or, to put it more correctly, accumulators. In addition, the self-sufficiency of electricity-generating farms could also be optimized through electricity storage. In addition, functionality in the sense of emergency power generators would be possible.

1.1. Short Literature Review

The storage of electricity from renewable energy is being researched internationally using various approaches. The use of lithium-ion batteries plays a prominent role here. Current research is focused more on technical development and less on economic assessment. As an example, reference is made to an international study on the storage of renewable energy, “Energy Storage Emerging: A Perspective from the Joint Center for Energy Storage Research” [6]. Reference is made to agriculture, for example, in cases where hemp-derived carbon anodes for lithium-ion batteries are developed to improve agricultural biomass use for sustainable energy storage [7]. In the article “Assessment of Energy Storage from Photovoltaic Installations in Poland Using Batteries or Hydrogen”, the economic efficiency of different investment options is compared: without energy storage, with energy installed in batteries and hydrogen, and with a polymer electrolyte membrane (PEM) fuel cell stack. The current solar potential in Poland, the photovoltaic (PV) productivity, the capacity of the energy storage in batteries and the size of the hydrogen production system were calculated [8]. The financial results on peak demand of the aggregated impact of coordinated battery storage systems on a commercial scale were analyzed for Australia [9]. The further development of battery technology also plays an important role in research, e.g., in the use of vanadium instead of lithium [10]. The economic viability of using batteries to store renewable energy for use in agricultural production processes is not explicitly the subject of international publications. In this respect, a special aspect of the overall collection of research on battery storage is being investigated as one of the most widespread technologies for storing renewable energy.

1.2. Objective of the Paper

The aim of the analysis was to explore the possibilities for minimizing the cost of a farm’s power supply. The alternatives with regard to the use of electricity are to generate the electricity oneself, to use it directly or store it for later use, to sell it or to buy it. The optimal scope of investing in systems for generating electricity from wind and sun and storing the electricity in batteries should be determined based on the load curves of different farms. In this study, however, no self-sufficient system is considered; rather, it is assumed, with a strong limitation, that the RE electricity fed into a battery during the day is (only) intended for subsequent night-time consumption. If one’s own RE electricity is insufficient during the day or at night, one should purchase electricity. At the beginning of a new day, the batteries will always be empty and have to be recharged. In order to map the availability of renewable electricity in different seasons, the use of electricity should be simulated over a whole year.
The annual cycle of electricity generation by wind turbines and PV systems is known for 15 min intervals from measurements by the municipal utility in Neustrelitz, Germany, in 2012. Analyzing the demand for electrical energy on farms at different times of the day provides data that are necessary for calculating the electricity capacity to be kept available. The use of all operational electrical units or devices should be recorded for this purpose, and the total energy requirement should be shown in 15 min intervals over 24 h. On the basis of such load curves, the need for electrical energy at different times of the day can be determined for farms with different specializations. To simplify matters, an average 24 h load curve is assumed here for different types of farms, from arable to livestock farming; i.e., seasonal fluctuations in electricity requirements on the consumer side are neglected. The reason is the still low availability of data on electricity consumption of farms.
As a result, depending on the nominal power of the wind and/or PV system and various other technical parameters, the necessary storage system must also be determined to break load peaks. The aim of the investigation was simultaneous optimization of alternative courses of action:
  • Selecting the optimal scope of investments in renewable energies and dividing these into wind and PV systems;
  • Selecting the optimal level of investment in batteries;
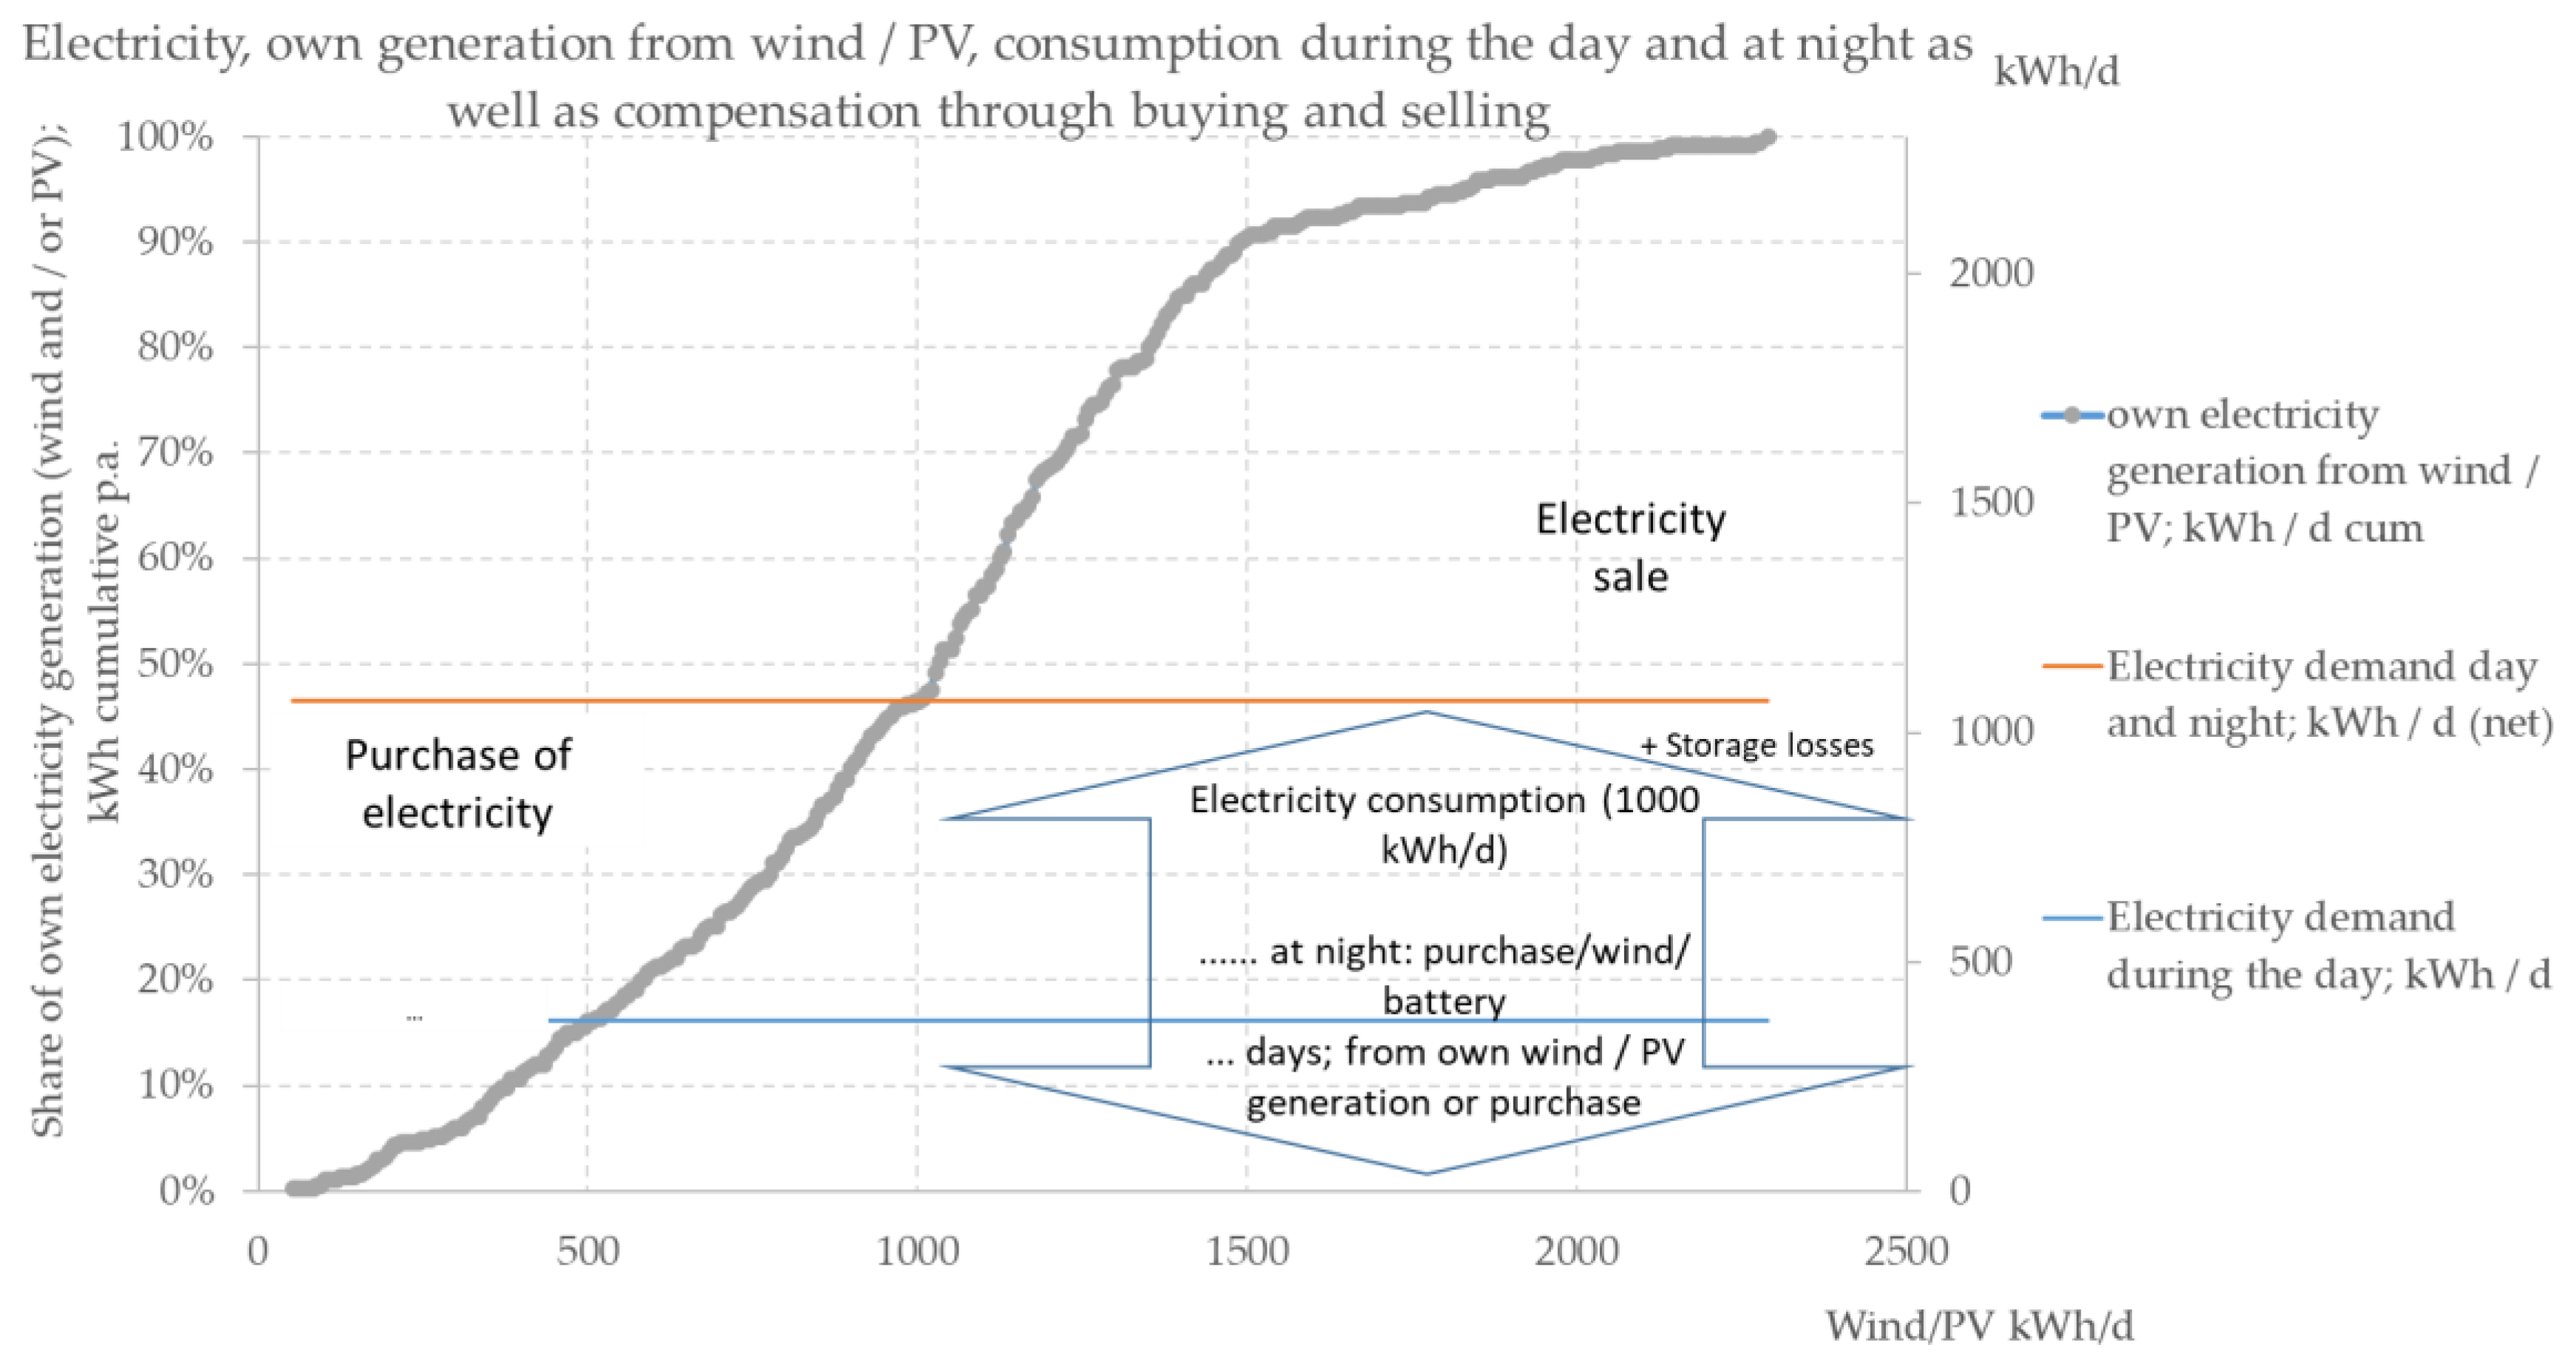
  • Maintaining optimal control of electricity sales and purchases (daily sums over a year);
  • Minimizing electricity costs for the operation.

1.3. Approach and Method

The variable renewable electricity generation over the course of the year is compared with the continuous daily electricity consumption of the farms considered here. The amount of annual electricity consumption depends not only on the type of farm (arable farming or animal husbandry, along with the production structure, the level of technology including the extent of electrically operated devices and other factors), but also on the size of the farm. In order to be able to transfer the results to different operating sizes, a standardized electricity consumption of 1000 kWh per day is assumed for the simulations. The operating parameters that represent this are shown below in the presentation of load curves. Depending on the operating mode, the standardized electricity consumption of 1000 kWh per day is used differently between day and night. This is important, because both PV systems and wind turbines tend to produce more electricity during the day than at night. The PV system and wind power curves are based on feed-in time series measured every 15 min from the municipal utility of the city of Neustrelitz, Germany, in 2012 (Figure 2). With predominant power consumption during the day, the need for and thus the economic viability of investing in storage, e.g., batteries, would be less, with higher power consumption at night also more likely.
The electricity produced by PV or wind energy systems can be used directly or fed into the grid or batteries as long as the system has not been regulated down due to the risk of grid overload. The electricity flows for self-supply from solar and battery storage systems consist of direct use or withdrawal from the storage system or, in the event that both sources are insufficient, purchasing electricity on the market.
The sequence of the distribution of electricity flows is regulated in a cascade-like manner: initially, self-generated electricity is consumed, electricity that is available can be stored in batteries and electricity produced beyond that can be sold. If the in-house production is not enough to cover the daily requirement, electricity is taken from the batteries or purchased.
The division of power consumption between day and night depends to a large extent on the type of farm operation. Recommendations for action can be derived for the various types of farm operation, which result from comparing several variants to determine the storage size required in each case. In this paper, three farms of different types are presented as examples:
  • Crop production (arable farming);
  • Forage farm (dairy);
  • Other animal husbandry (farrowing operation, piglet rearing, pig fattening, broiler fattening).
The method used is a minimization of the nonlinear target function “average costs of electricity per kWhel” in the developed simulation model. The solution algorithm used is the Microsoft Excel 2016 Excel Solver GRN-nonlinear option. On the one hand, surplus calculated as income from the sale of electricity is also included when there is a surplus of self-generated electricity. On the other hand, the yearly cost of investment (Cy) for the operational share of investments in wind turbines, PV systems and batteries is calculated according to the approximate cost and consists of depreciation, interest rate and other costs (maintenance, upkeep and repairs, etc.) (Equations (1) and (2)):
Cy = Depreciation + Interest   rate + Other   yearly   costs
Cy = A 0 Rv N + A 0 + Rv 2 i + o . Cy
where Cy is yearly cost of an investment, A0 is acquisition or investment value, Rv is residual value (here assumed to be zero for all calculations), N is service life in years, i is interest rate, and o.Cy is other yearly costs (maintenance, repairs, insurance, etc.).
The values for the individual types of investment in wind turbines, PV systems and batteries are decribed in Section 2.2.
The operating costs per kWhel also take into account annual expenses for the surcharge for self-consumption, currently 40% of the Renewable Energy Sources Act (RESA) surcharge, plus expenses for purchasing electricity, minus the proceeds from electricity sales. The sum of these annual amounts is divided by the annual electricity consumption of the farm in kWh (Equation (3)):
Cy Wind + Cy PV + Cy Battery + Cy RESA   surcharge + Cy Purchase   el . + Ry el . Annual   electricity   consumption   of   the   company   in   kWh
where Cy is the yearly cost of investment in the share of a wind turbine (Wind), the PV system (PV) and battery; CyRESA surcharge is the yearly fee for RESA surcharge for share of self-consumption; CyPurchase el. is the yearly cost for electricity purchase; and Ryel. is the yearly revenue from electricity sales.
Further definitions:
Battery   capacity   p . a . = Battery   size   kWh 365   days
Battery   coverage   in   %   of   consumption = Battery   capacity   kWh   p . a . Farms   el .   consumption   kWh   p . a .
Battery   utilization   over   the   year = Stored   amount   of   electricity   kWh   p . a . Battery   capacity   kWh   p . a .
Degree   of   self sufficiency = 1 Purchased   electricity   kWh   p . a . Farms   el .   consumption   kWh   p . a .
Limitation of the algorithm and the data available will be discussed at the end of the paper.

2. Electricity Generation and Storage

2.1. State of the Art

At the end of 2014, photovoltaic systems with a total output of approximately 38.5 GWp were installed in Germany. New solar installations are among the most affordable renewable technologies. At the end of 2018, the number of PV installations stood at 1.6 million. Around a quarter of the systems are built on the roofs of farm buildings. PV produced around 45 GW of electricity, making it the second largest source of renewable electricity after onshore wind. At present, wind energy is the driving force in expanding renewables. In 2018, onshore and offshore wind energy installations accounted for an installed capacity of 52.5 and 6.4 GW, respectively. The generation of electricity from wind turbines in Germany has now increased to around 30,000 systems. With 111.6 TWh (18.6% share of total electricity production), wind power was the leader among renewable energies in 2018 [11]. According to plans drafted by the federal government, offshore wind capacity is expected to reach 15 GW by 2030 [12].
These systems are located on agricultural land and are usually not economically linked to the farms. If wind power is available, however, this cannot be left out in an optimization plan.
This means that farms produce a significant part of their energy from their own PV systems, but much less from their own wind turbines. As already explained, the electricity output provided fluctuates over the course of a year, but also over the course of any given day (Figure 2), and is typically not available at all times when a corresponding demand is present.
For most farms it is relatively easy to install a PV system, since roof areas are usually available. In contrast, building or participating in a wind turbine is much more difficult. This is due, among other things, to the limited locations (wind suitability areas), a lengthy approval process and, last but not least, the high capital requirement. In the future, possible access to wind power will be seen in the fact that shares in wind turbines are purchased at a reduced price, comparable to the concept of public participation [4]. In this study, both variants are examined: the installation of a PV system, and the acquisition of shares in a wind turbine with the purchase of electricity at generation costs.
The prerequisite for the use of electricity is not only production, but also spatial distribution with an appropriate grid. If supply and demand do not arise at the same time, additional energy storage devices are required, which are used to stock up and store energy in order to create a temporal balance between supply and demand. There are different technical methods of storing electrical energy available. They can be divided according to the size of the nominal power and discharge time; pumped storage and stationary hydrogen (H2) storage have high nominal power, but a comparatively long discharge time. Electrochemical storage systems differ in their typical properties, such as storage capacity, storage losses and cycle stability. Among the types of accumulators, Li-ion accumulators are becoming increasingly widespread due to their comparatively favorable values (storage capacity up to 350 kWh/m³, storage losses of 0.2%/d, cycle stability up to 5000). Hydrogen storage systems, on the other hand, can achieve a storage capacity of up to 750 kWh/m³ and storage losses between 0.003 and 0.03%/d [13].
Storing energy through electrolysis and as hydrogen, which can be converted back into electricity via a fuel cell if required, is still significantly more expensive than using a battery system, so the market shares will remain low for the foreseeable future [14].
Every year the number of households and farmers who decide to buy a battery storage system increases. The 200,000th photovoltaic storage system in Germany went into operation in 2020. One reason for the strong demand is the sharp drop in battery storage costs for end users. A price drop of 50% has been observed since 2013 [15].
The numerous advantages of lithium-ion batteries (longer service life, more compact design, higher possible depth of discharge and higher efficiency value) are further possible reasons why new storage systems installed in 2017 consisted almost entirely of lithium-ion batteries. A very promising development is high-voltage battery storage, which has a compact design and can store large amounts of electricity. The parameters for characterizing batteries, such as performance, capacity, efficiency, etc., are continuously improved in the course of technical progress.

2.2. Current Costs of Electricity Generation and Storage

Calculating the storage size for electricity generated by a PV system or from the share of a wind turbine in agricultural businesses with different types of operation distinguishes between the ratio of electricity consumption during the daytime or at night and different purchase prices for electricity. The optimal additional capacity of a battery is calculated for the different scenarios. The results of the simulations represent the capacity of the PV system, the proportion of the wind turbine and the size of the battery, the costs incurred and possible proceeds from the sale of excess electricity or cost for purchasing needed electricity, the capacity utilization of the battery, the proportion of self-consumption and the degree of self-sufficiency. The acquisition costs, as of September 2018, when work on this paper started, are assumed to be EUR 1300/kW for PV systems, EUR 1000/kW for wind turbines and EUR 1230/kWh for batteries (Table 1). At 20 years, the useful life of a power generation system is based on the duration of the currently guaranteed feed-in tariff; the service life of a battery is 30 years. An interest rate of 3% is calculated. This results in electricity generation costs of 11 ct/kWh for PV electricity, 4 ct/kWh for wind power and 33 ct/kWh for battery storage (Table 1).
The farms considered below have very different annual electricity consumption due to different equipment with electrical devices and different sizes. In order to show the economic efficiency of battery use in a comparable way, the scenarios discussed later were standardized to a daily electricity requirement of 1000 kWh, as mentioned above. The results can be transferred to other operating parameters using linear scaling as long as economies of scale are negligible. The investment requirement for an average daily electricity consumption of 1000 kWh is EUR 474,500 for a PV system and EUR 121,667 for a wind turbine (Table 2). If half of this electricity, i.e., 500 kWh per day, is to be stored, an additional investment of EUR 615,000 would be necessary.
In the simulations carried out below, the RE investment is limited to 730 kWp, or 200% of the farm’s standard annual electricity consumption of 365 MWh; capacity over 100% makes sense in order to guarantee the farm’s own power supply even in unfavorable weather conditions (cloudy or calm). The reason for the limitation to 200% is that, on the one hand, the farm’s capacity, e.g., on roof areas for a PV system, is limited. On the other hand, the question of cost savings through self-generated electricity should be examined here, and not the question of whether and how a new branch of operation “energy” could be established on a farm.
By using a battery storage system, the proportion of self-consumption of the electricity generated could theoretically be increased significantly, up to an “island” solution, i.e., 100% self-consumption with complete self-sufficiency, without additional grid feed-in and purchase. Technically, such a solution is possible, but from an economic point of view, it is not practically relevant for agricultural businesses. Such a construction would not be considered a “real” island solution for the Central European climate, if only because of the unpredictable weather conditions.
In contrast, higher electricity purchase prices can be expected in the future. If the farm’s own capacity to generate electricity from renewable energy sources is insufficient, the operation must depend on purchases from the energy supplier from the grid. In this case, the farm has to pay the market price for electricity. In contrast to the expected falling generation costs for its own electricity, rising market prices can be expected for electricity purchased from the grid. This price increase is assumed in the model with a factor of 2 and 2.5 or 3.
The price level or price ratio assumed here reflects the current situation in 2020. With this work, however, future developments should also be assessed and appropriate recommendations made. Technical progress and legal regulations will have a significant influence. The decisive factor here will not be the absolute level of generation and storage costs or the purchase price for electricity, but rather the price ratio. By assuming that the purchase price for electricity will rise in the future, the price ratio will be shifted in such a way that indirectly, relatively falling generation and storage costs are simulated, as well as more fluctuating market prices for electricity. The latter is assessed in such a way that with short-time favorable weather conditions, wind and sun, a high supply of electricity on one’s own farm as well as on the electricity market could lead to low or even negative sales prices; one’s own excess electricity would be curtailed. On the other hand, unfavorable weather conditions, including dark doldrums, lead to sharply rising prices for purchasing electricity on the market and thus to an increased gap between purchase price and storage costs.
Before the optimization of the power supply for a standardized agricultural operation is presented, the course of electricity production from PV and wind energy systems and the load curves of typical agricultural operations are shown.

3. Model Calculations for Farms with Their Own Electricity Generation

The following calculations for selected farm operations are based on their own potential for generating electricity with wind turbines or PV systems. While wind turbines can potentially generate electricity during the day and night, PV systems only supply electricity during the day. The day electricity can be used directly during the day, and excess electricity can be stored in a battery for the night. In this model, the electricity fed into the battery during the day is only intended for subsequent night-time consumption. If there is insufficient electricity during the day or at night, electricity must be purchased.

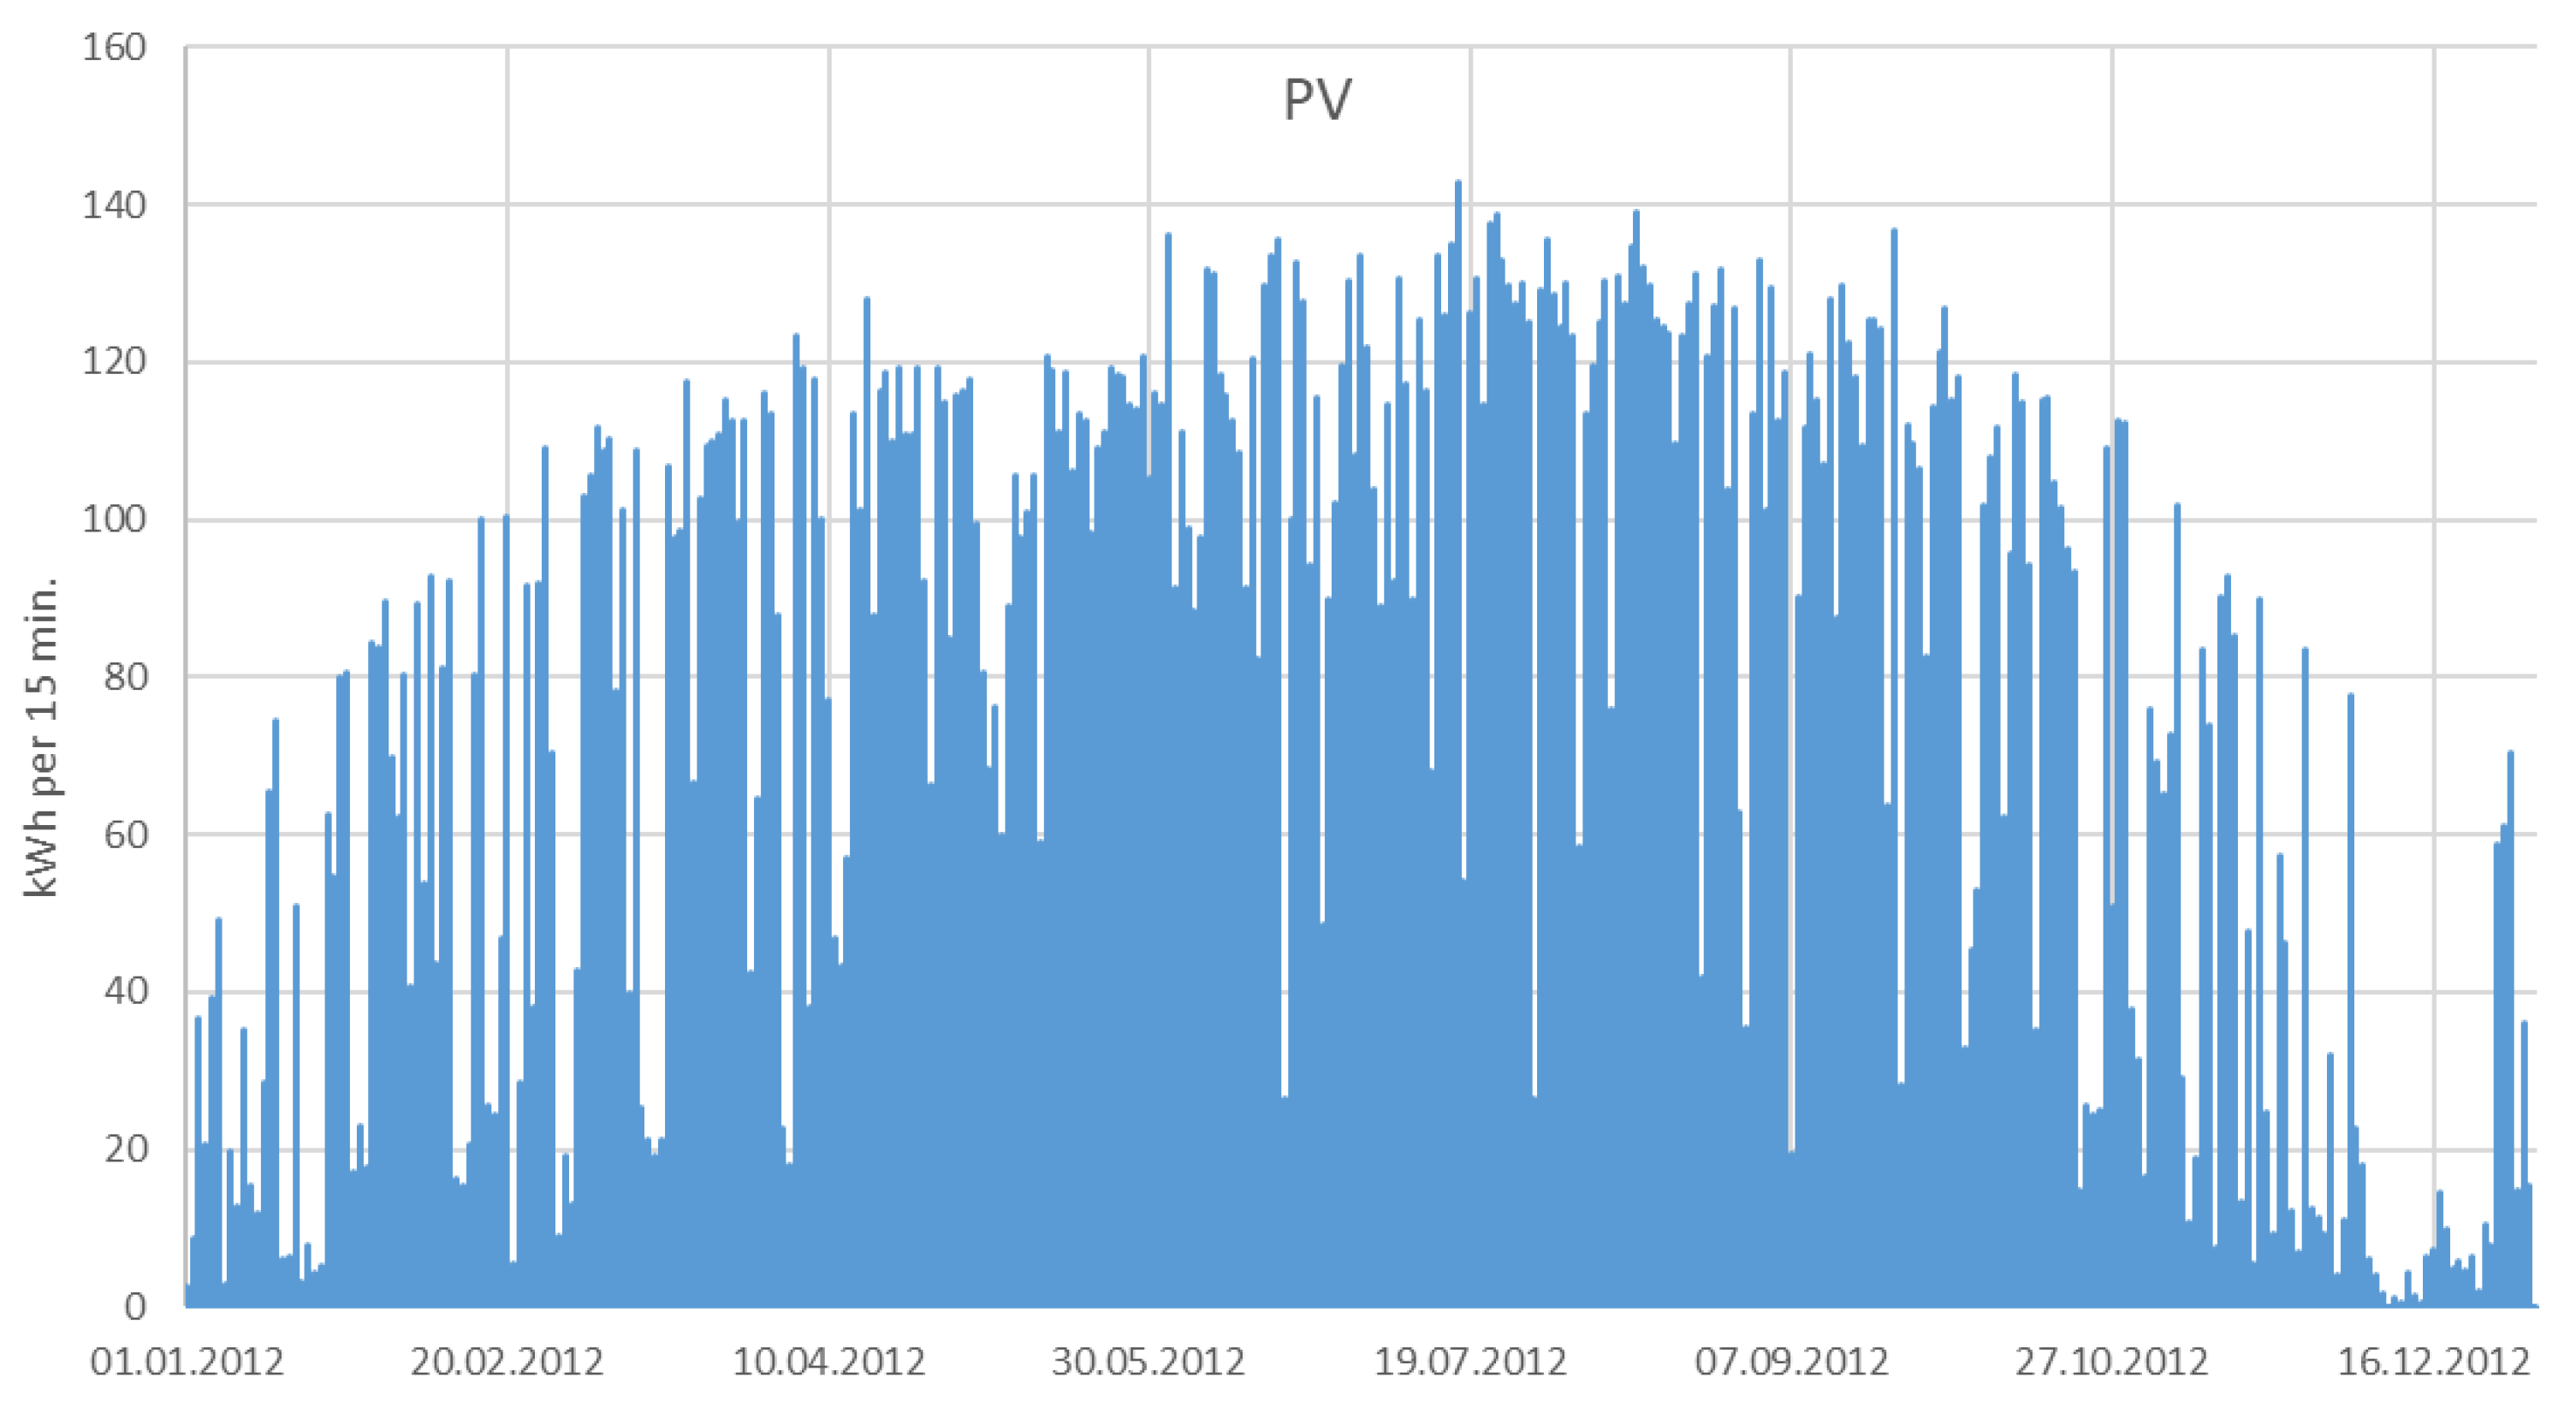
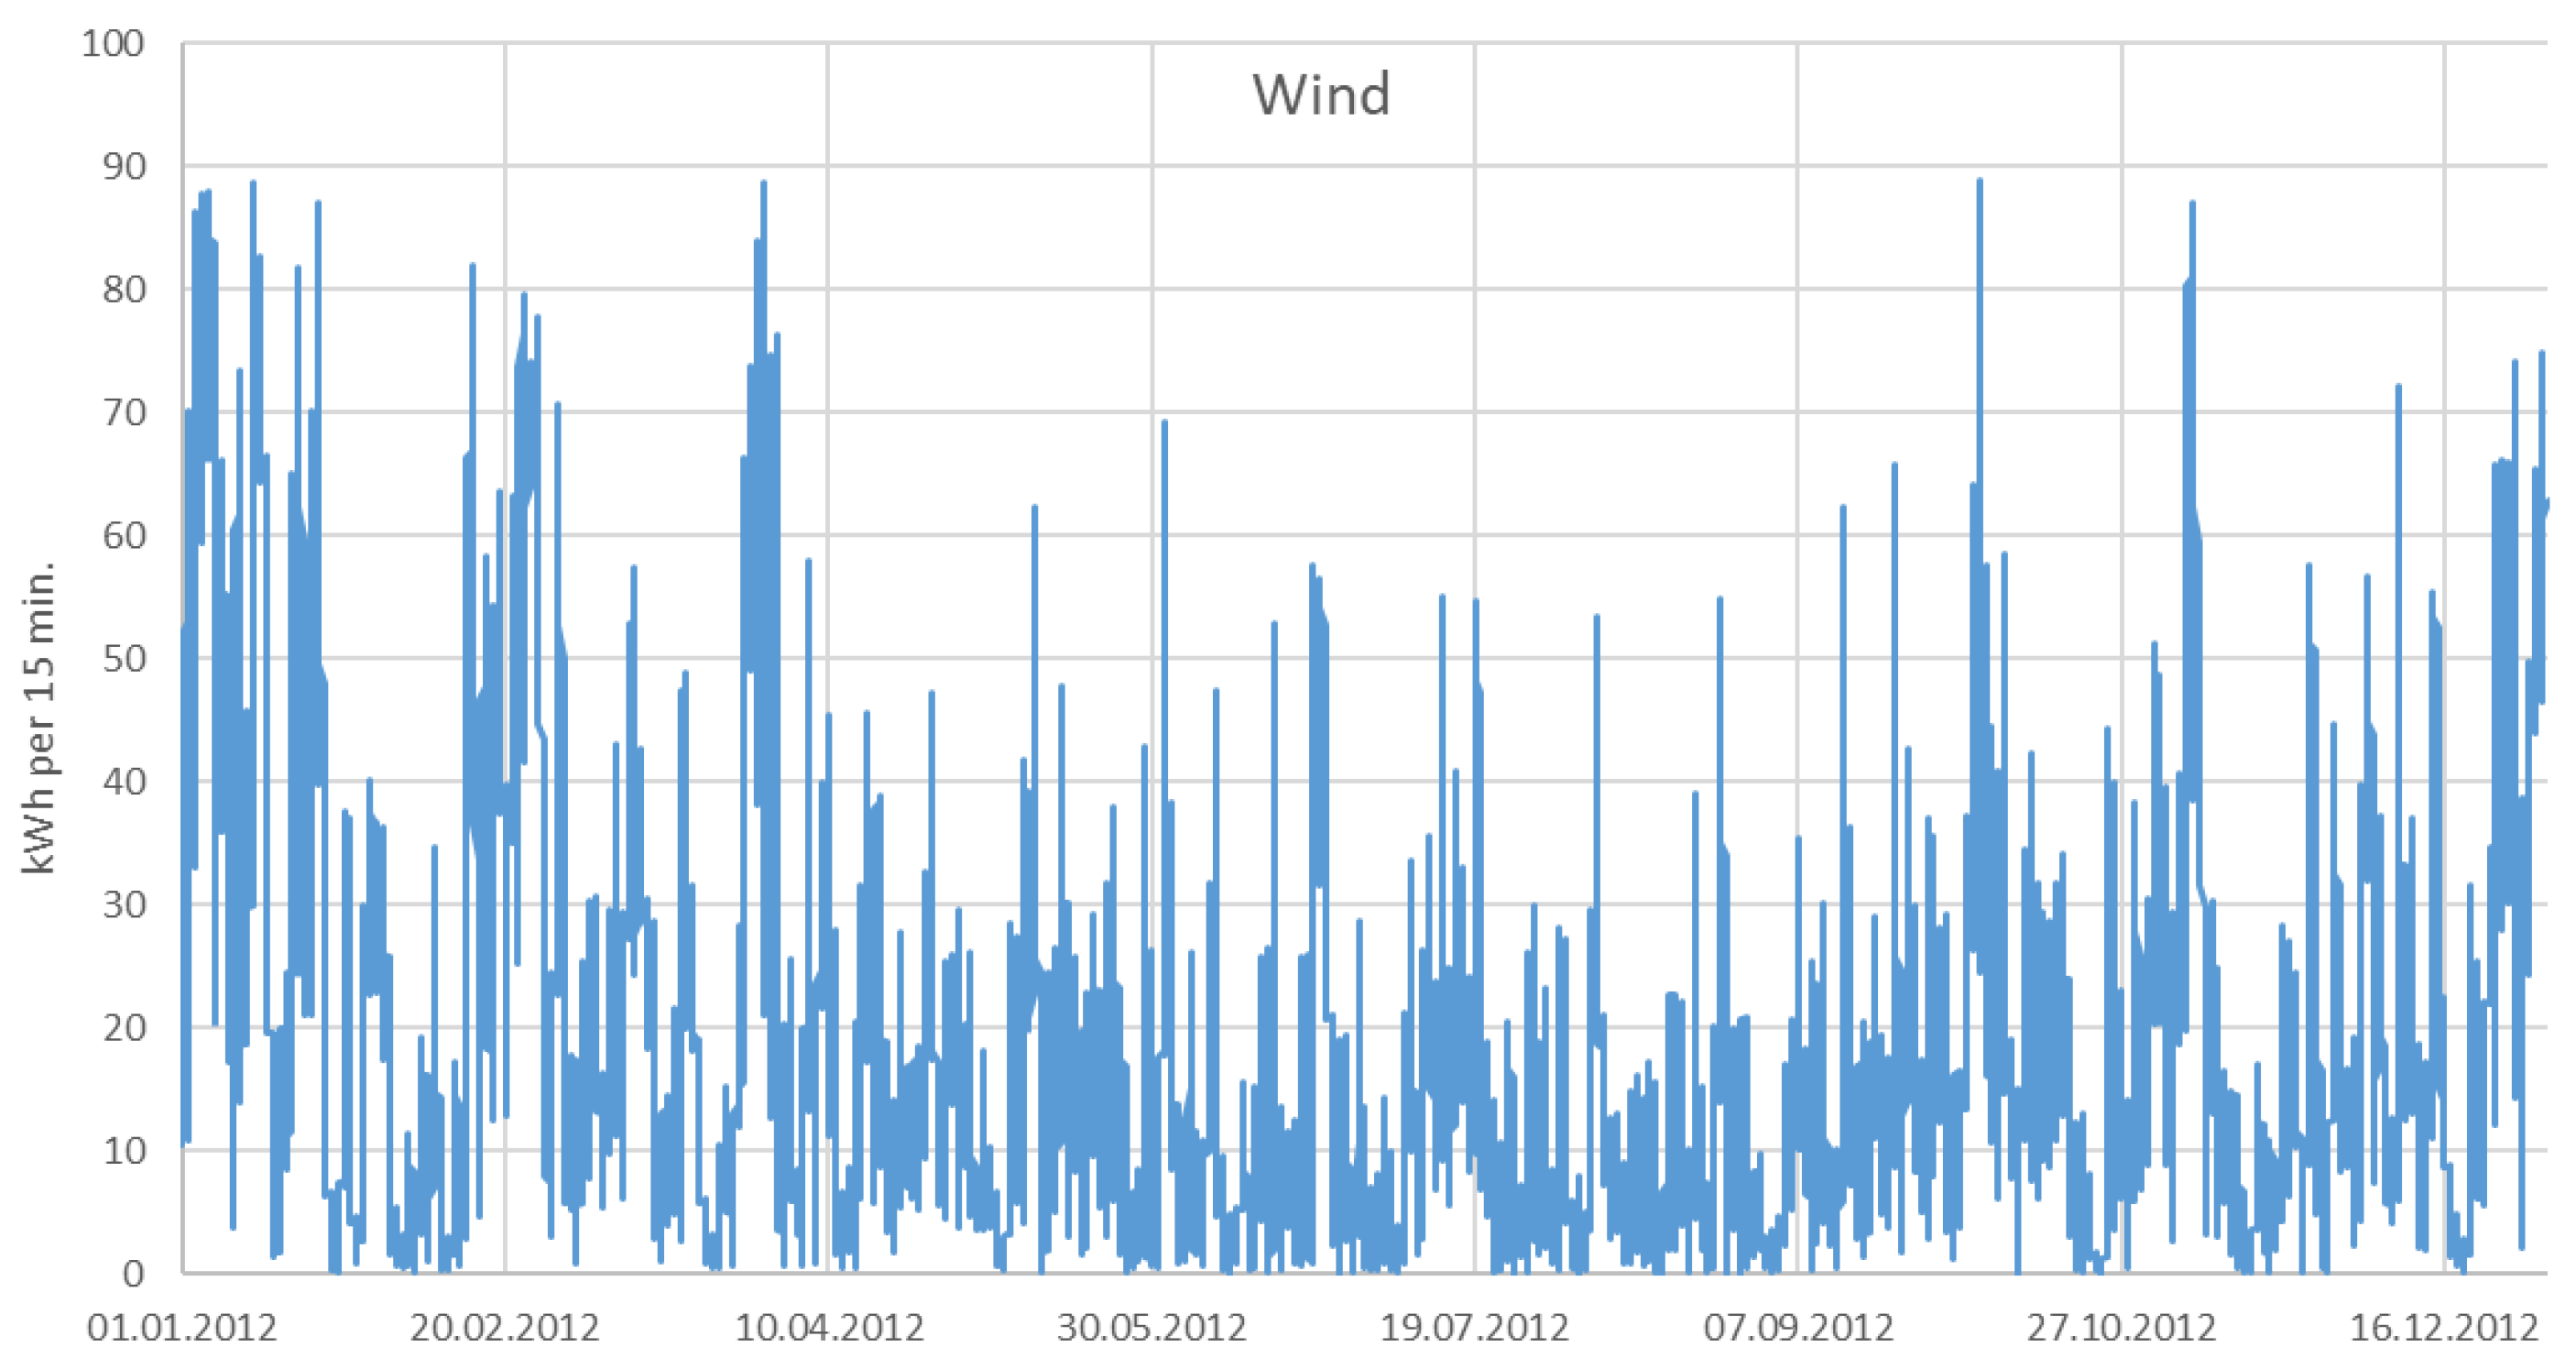
3.1. Electricity Generation with PV Systems and Wind Turbines

In the winter months in particular, electricity generation from PV systems drops significantly. As shown in Figure 3, however, it is not clear that electricity production fails completely every night. This becomes clear from the average electricity generation from PV over the course of the day (Figure 2, PV systems).
The electricity production from wind turbines is comparatively lower during the summer months than in winter (Figure 4). Viewed over the course of the day, wind power is more consistently available than solar power (Figure 2, Wind turbine).
The cumulative curve of the exemplary combination of 50% annual production of electricity from the sun (PV system, 182.5 kWp) and 50% from wind (wind turbine, 60.8 KWp) makes it clear that with continuous electricity consumption to a limited extent for a relatively short period of time, its own supply and demand match. For example, with daily electricity consumption of 1000 kWh, purchasing electricity would be necessary on approximately 20% of the days in a year (approximately 70 days), since too little of its own electricity production is achieved, and in the approximately 80% of the remaining days of the year (approximately 290 days), electricity could be sold on the market (Figure 5). If the storage is not taken into account, nearly the whole year, except for the short period of matching, would have to be balanced via the market. Depending on the size of the battery, compensation via the public grid could be limited. This type of variable renewable electricity generation is compared with relatively continuous electricity consumption of farms in the following.

3.2. Battery-Compatible Load Curves from Selected Farm Operations

Typical agricultural businesses that specialize in crop production (arable farming) or animal husbandry (dairy farming, farrowing operation, piglet rearing, pig fattening, broiler fattening) are assessed for their suitability for using batteries to compensate for the fluctuating electricity production from their own renewable energy. Of particular interest is the question of how much of the electricity produced during the daytime, especially from solar resources, can be used at night.
Agriculture is a highly seasonal business. Continuous electricity consumption is therefore very limited in arable farming. Large consumers of energy are often mobile (e.g., tractors). On the one hand, these are operated with diesel or have high power consumption for only a short time, e.g., when processing grain. On the other hand, the lighting system in the workshop and the hallways and the computers (all year round), for example, are of particular importance as continuous consumers of electricity (Table 3). High-pressure cleaners, motors at petrol stations and electric welding devices and grain dryers are mainly operated in the high seasons. In arable farming, a total system capacity of 245.8 kW is needed (Table 3). Outside of the harvest, continuous average daily electricity consumption is expected between 8:15 a.m. and 8:00 p.m., and a maximum of approximately 14 kWh of electricity is consumed every 15 min (Figure 6).
In the harvest season, using two drying fans and other electrical devices for cleaning and storage or retrieval (elevator and augers) is sometimes required during night operations.
For some machines, the power consumption is so high that even a relatively large PV system would not be enough and purchasing electricity is essential. In addition, batteries are limited in their retrieval of electrical energy in a short time. If, for example, high output is requested from powerful motors, this cannot necessarily be fully covered by the battery. Therefore, the public grid is accessed again. When selecting the right system, the power consumption of the main consumer should be known in order to select a system with sufficient discharge capacity. Conversely, the loading of the system is also limited, so if there is high electricity production, a surplus will end up in the grid. Even the very different seasonal electricity requirements are not fully taken into account in the existing standardized farm sizes and processes. Due to the specialization of the types of business considered here, with their different share of consumption during the day and at night, as well as increased electricity prices, recommendations can still be derived for a wide range of businesses.
In comparison, a dairy farm has largely continuous daily electricity consumption, which peaks during milking times. The special aspect of this is that of the three daily milking times, two of them, at 3 a.m. and 7 p.m., are at night (Figure 6). The electricity consumers are milk pump, dirty water pump, fan heater, fan, light, high-pressure cleaner, compressor and compressed air station, vacuum pump, cooling unit, milk tank, milking machine cleaner, cow brush, manure pusher and drag shovel, motor for roller blind, manure pump, heater and thermostat for the drinking troughs, automatic drinking machine, circulation pump, water pump, motor for gas station, welding machine and ZM pump, computer, biogas and ORC system, as well as apprentice room and social area. The total system size is 169.4 kW. The dairy farm recorded here, with 770 hectares of land and a herd of 360 dairy cows in three stalls, is a pioneer in renewable energy, as it already uses battery storage in addition to a biogas plant with an ORC system [19].
Finally, in other animal husbandry (farrowing operation, piglet rearing, pig fattening, broiler fattening), electricity consumption is largely constant over the course of the day, the base load of which is mainly given by heating (e.g., piglet lamps), lighting and ventilation. Additional electricity consumers are used during feeding times, usually in the morning and evening (Figure 6).
Establishments can be classified according to their ratio of electricity consumption during the day and at night. The following typical consumption pattern emerged: consumption during the day is approximately 75% for arable farms, 44% for processing farms (piglet production) and 25% for milk production with three milking times (Table 4). In the simulations, the share of electricity consumption during the day, in steps of 100, 75, 50, 25 and 0%, thus, the share of consumption at night, in steps of 0, 25, 50, 75 and 100%, varies.
Standardized electricity consumption of 1000 kWh/day would be the equivalent of an arable farm with 1540 hectares, a dairy farm with 535 dairy cows or a piglet farm with 1320 breeding sows.

3.3. Calculation Approaches and Modeling Using the Example of Energy Management in Selected Companies

Figure 7 shows a simulation for a refining operation with 50% electricity consumption during the day, corresponding to 50% at night, where standardized electricity consumption of 1000 kWh per day is assumed. The following assumptions are made: electricity production from its own generation from wind (50%) and PV (50%), consumption during the day (50%, 500 kWh) and at night (50%, 500 kWh), and balancing by a battery and buying and selling; battery power 500 kWh/d and battery utilization of 13% over the year; degree of self-sufficiency 76%.

3.4. Questions and Scenarios

We examined to what extent investing in renewable energy systems (PV and wind) and storage (batteries) is worthwhile. In order to be able to assess economic efficiency, the farm’s electricity costs are determined. The advantage of investing in renewable energy is shown as the difference between the initial situation, or the situation without investing in RE (Sc_0) (Table 5). A distinction is made as to whether investing in RE takes place under the conditions of the Renewable Energy Sources Act (RESA), i.e., with feed-in tariffs for electricity sales (Sc_I), or with the operation of PV systems and wind turbines outside the RESA, e.g., after the 20 year funding period has expired or for post-RESA times (Sc_II).
For most farms, the variant “investments exclusively in PV systems” (Sc_I.1 or Sc_II.1) will apply; additionally, the combination “investment in PV systems and wind turbines” (Sc_I.2 or Sc_II.2) is also examined. All previously presented basic scenarios are considered in two subvariants: (1) without the possibility of using batteries (Sc_I.1.1, no B.) or (2) with the possibility of investing in batteries (Sc_I.1.2, w. B.). The extent to which investments are made is decided by minimizing the objective function costs of electricity supply (Equation (2)).
In addition, the electricity price is increased in three steps: the starting level to purchase electricity on farms is 20 ct/kWh, and this is increased by a factor of 2, 2.5 and 3. A total of 350 scenario simulation runs were carried out.
First, the results with feed-in tariff (Sc_I) and without feed-in tariff (Sc_II) for the two extreme load curves, electricity consumption only during the day (100% day) (Figure 8) and electricity consumption only at night (0% day) (Figure 9), are shown. In addition, the effect of rising electricity prices by a factor of 2, 2.5 or 3 is shown. Similarly, the load curves of the types of farms presented above (crop production, dairy farm and other animal husbandry/farrowing operation), which reflect their different levels of power consumption between day and night, are described in the following sections.

4. Results of Simulations

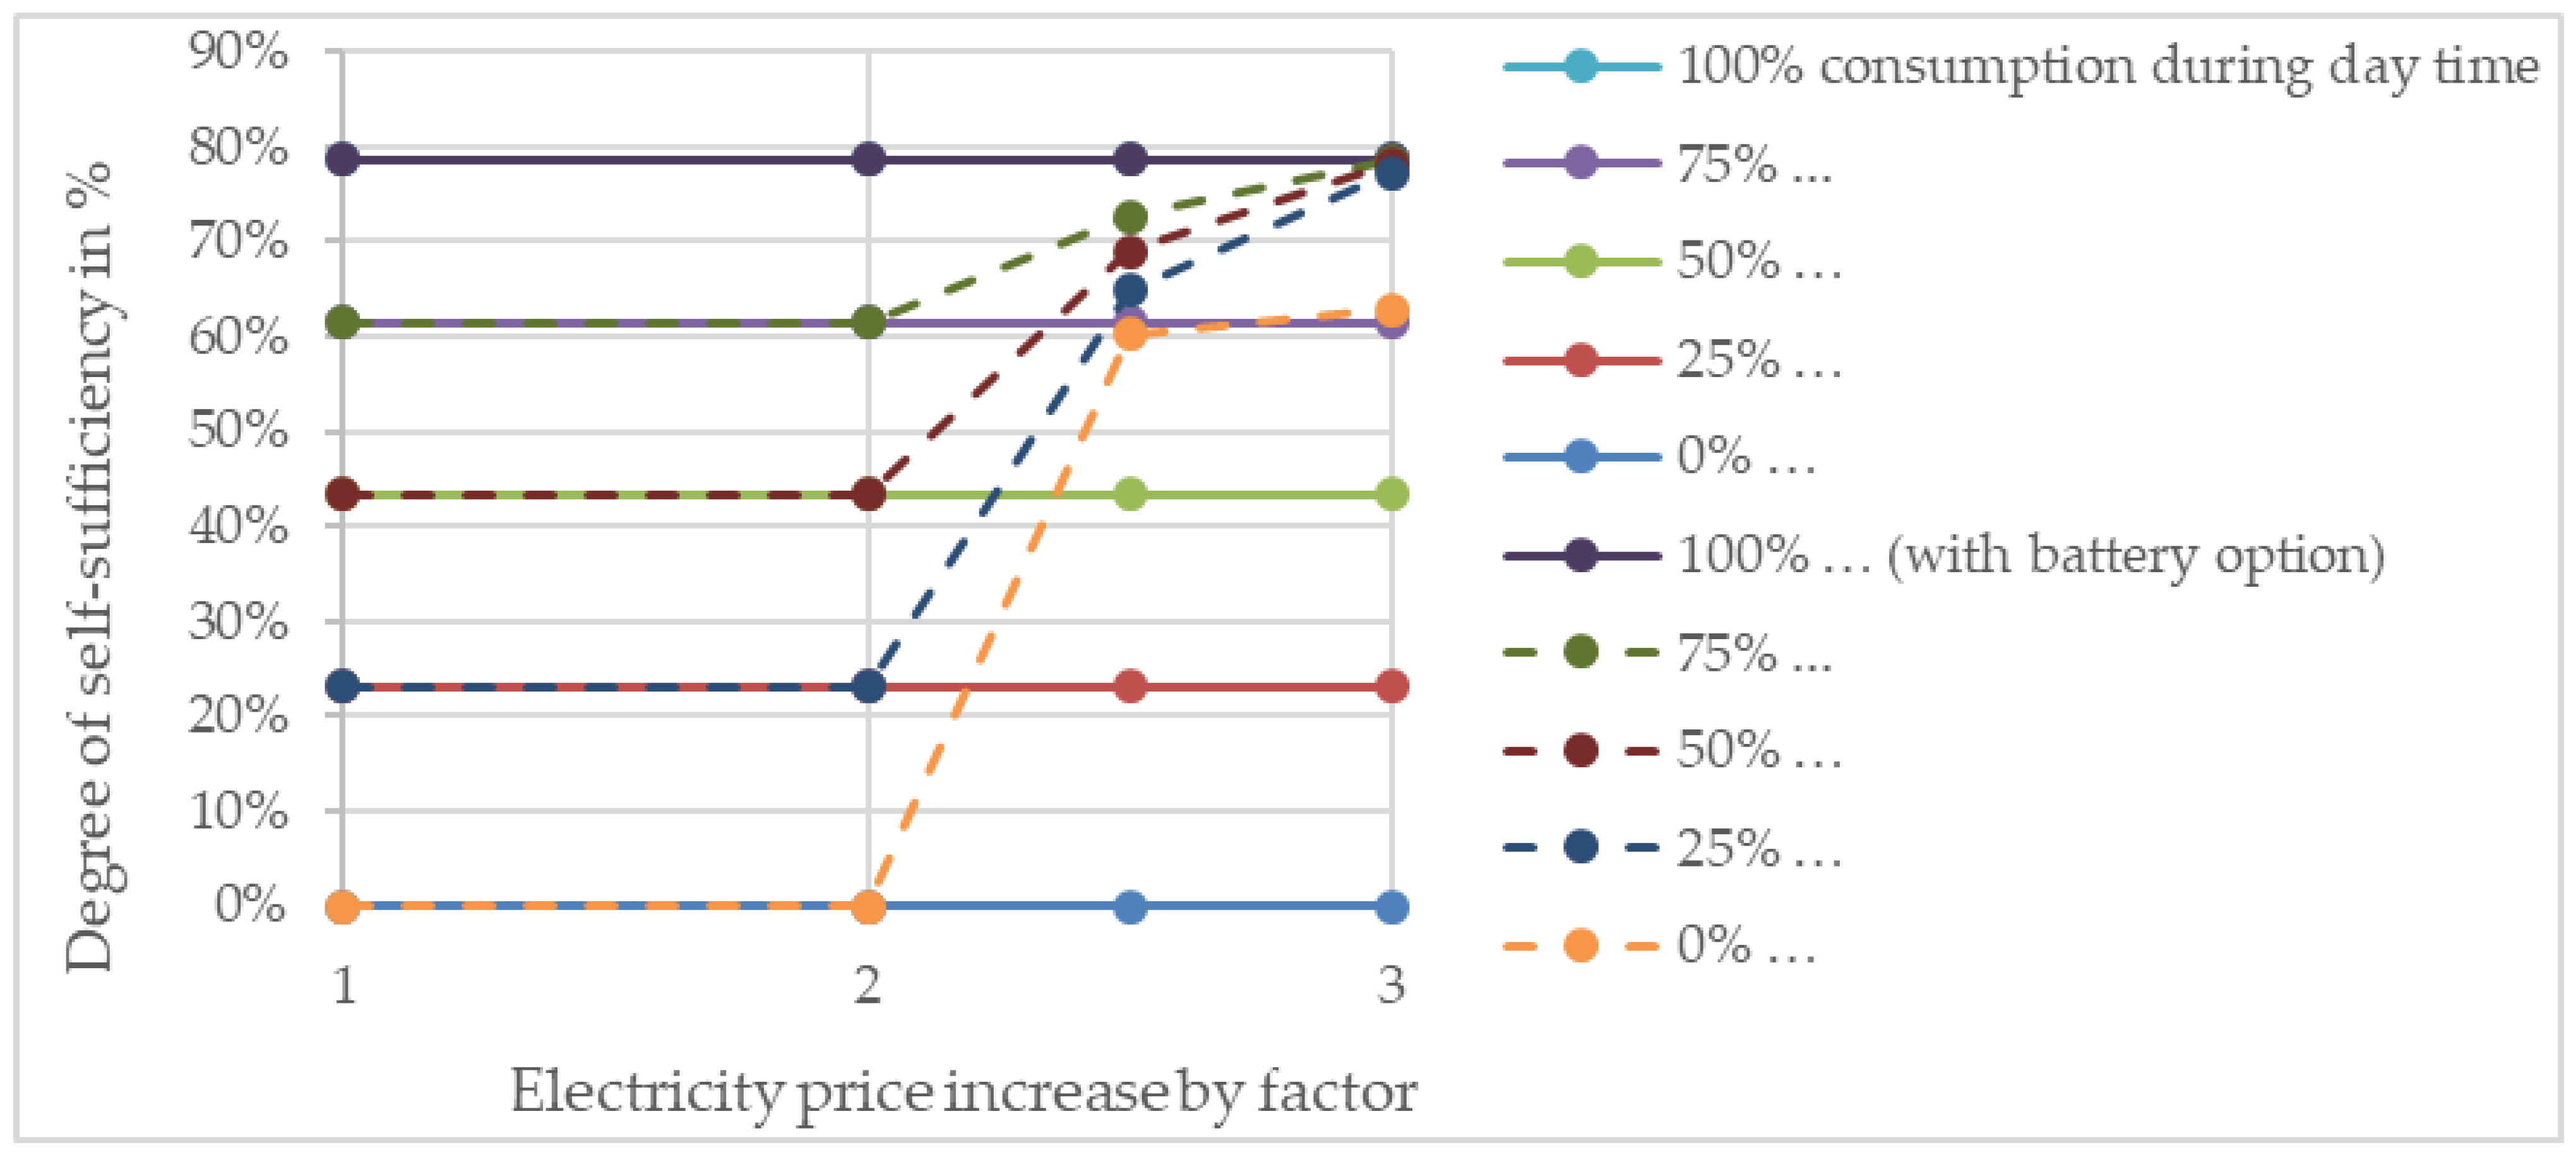
4.1. Optimal Investment Paths with Electricity Consumption Only during the Day

If electricity generation (with PV) and consumption (only during the day) largely match, electricity costs can be reduced by investing in PV systems and can be kept stable in the long term, if electricity prices rise (Figure 8). In all of the variants considered in this section (power consumption only during the day), no battery is required, since no power is consumed at night, so the option of investing in batteries is never used. Based on the current electricity price for purchasing electricity at 20 ct/kWh (Sc_0), the following savings can be made in farm electricity costs when investing in renewable energy, where the renewable energy capacity is 730 kWp, i.e., 200% of the farm’s annual electricity consumption of 365 MWh as a standard in this analysis is limited.
Sc_I: With feed-in tariff according to RESA (PV power 13 ct/kWh or wind power 5 ct/kWh; Figure 8a)
In this scenario, investments are made in renewable energy (PV or PV and wind) up to the specified maximum (200% of the annual electricity requirement), since surpluses can be generated by selling electricity that is not required for internal use.
The electricity cost drops from 20 ct/kWh when purchasing (Sc_0) to 13 ct/kWh (Sc_I.1.2, PV) when investing in a PV system with 730 kWp. By selling electricity and profiting from surplus PV electricity, the farm’s electricity costs will become cheaper under RESA conditions with guaranteed feed-in tariffs (Figure 8a).
The additional use of wind energy, i.e., participating in investments in wind turbines with purchase rights for electricity at a production cost of 4.72 ct/kWh, would reduce the farm’s electricity cost even further to 12 ct/kWh (Sc_I.2.2, PV and wind). With this combination of PV and wind, with low electricity prices (purchase for 20 ct/kWh), a smaller proportion (37%) is invested in PV capacity and more (65%) in wind turbines. As the purchase price for electricity increases (factor 2, doubling, or 3, tripling), the proportion of PV capacity increases to 54% and 56%, respectively.
Sc_II: Without feed-in tariff for excess electricity
If the feed-in tariff ceases, PV capacity is expanded only approximately 60% (58.5% = 214 kWp compared to annual electricity consumption of 365 MWh). The farm’s electricity cost rises by 4 ct to 17 ct/kWh (Sc_II.1.2, PV), because the cost of PV electricity generation is 11.5 ct/kWh, but the missing electricity is purchased for 20 ct/kWh (Figure 8b). Rising electricity prices lead to further expansion of PV capacity to approximately 80% (when the price is doubled) and 100% (when the price is tripled) of annual electricity consumption.
The additional use of wind energy, i.e., participating in investments in wind turbines with the right to purchase electricity at a production cost of 4.72 ct/kWh, would reduce the farm’s electricity cost even further, to 17 ct/kWh (Sc. II. 2.2, PV and wind). Renewable energy capacity is divided roughly between PV systems and wind turbines. The expansion of RE capacity increases with rising electricity purchase price to 146% (double) or to 167% (triple).
In summary, it can first be stated that rising market prices for purchased electricity—double or even triple—lead to increasing electricity costs for farms, driven by the cost share of the purchase. If it were possible to invest in only PV systems and not in the more lucrative combination of PV and wind, the electricity generation cost could be stabilized in the event of a price doubling to at least 25 ct/kWh, and if the market price were tripled at 32 ct/kWh (Sc_II.1.2, PV).
Batteries would, in principle, be a possible investment variant, but this is not (yet) economical in all consumption variants shown in Figure 8 (only during the day). This is quite different for the variant that examines power consumption only at night (0% day).

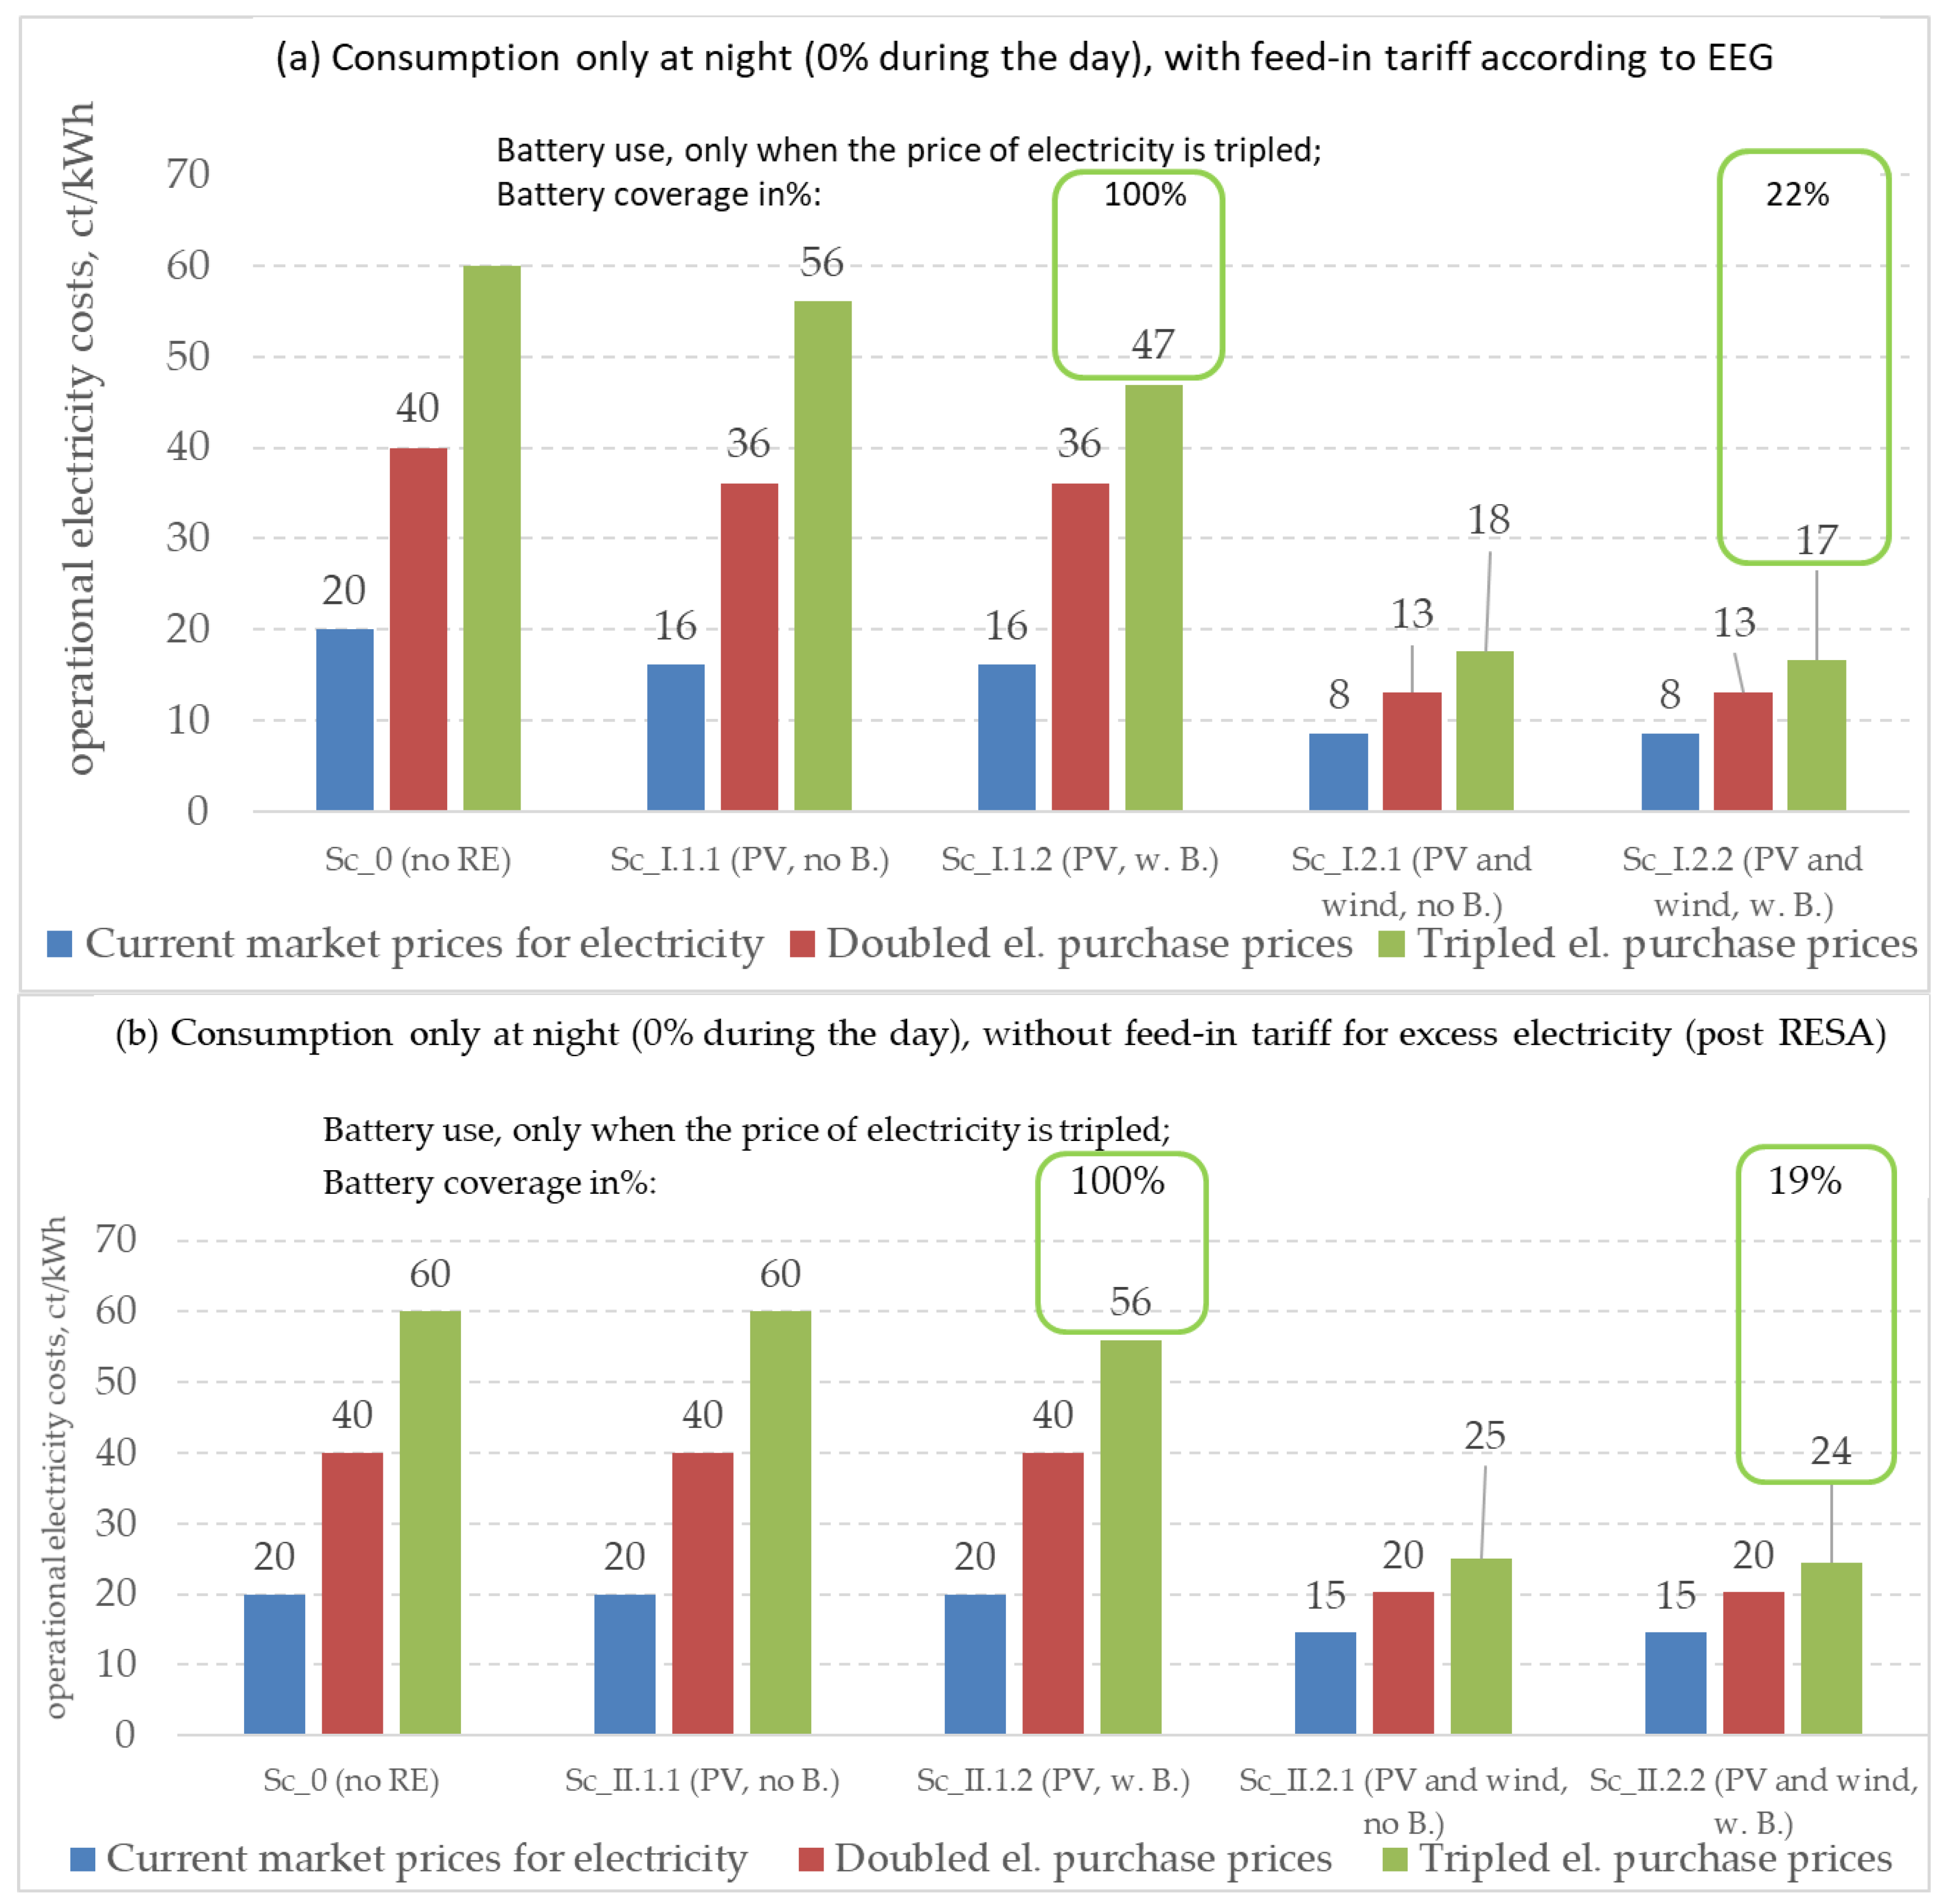
4.2. Optimal Investment Paths with Electricity Consumption Only at Night

With the pattern of a load curve with electricity consumption only at night (0% during the day), the demand can only be met by purchasing electricity, from either a wind or PV system, the latter if it feeds the electricity into batteries. A small profit could be achieved if the PV electricity were marketed according to the RESA. However, larger increases in the purchase price can only be averted if wind power can be used in order to limit the increase in electricity costs (Figure 9).
Based on the current price when purchasing electricity at 20 ct/kWh (Sc_0), the following savings can be made in electricity costs for farms:
Sc_I: With feed-in tariff according to RESA (PV power 13 ct/kWh or wind power 5 ct/kWh), the cost drops from 20 ct/kWh when purchasing (Sc_0) to 16 ct/kWh (Sc_I.1.1 and Sc_I.1.2, PV) when investing in a PV system, and the electricity is fed in according to the RESA. It is assumed here that the PV capacity can be expanded to a maximum of twice the usual capacity (200% = 730 kWp compared to annual electricity consumption of 365 MWh). Here, too, there is a kind of cross-subsidization through the sale of electricity and profit from all PV electricity (Figure 9a). If the electricity price rises sharply (triple), one can invest in a battery that can cover 100% of the electricity requirement. However, since electricity has to be purchased at times when there is no sunshine, a degree of self-sufficiency of only approximately 63% is achieved.
The additional use of wind energy, i.e., participating in investments in wind turbines with purchase rights for electricity at a production cost of 4.72 ct/kWh, would reduce the electricity cost even further to 8 ct/kWh (Sc_I.2.1 and Sc_I.2.2, PV and wind). The share of RE capacity from PV and wind power is divided into approximately 20–30% PV and 80–70% wind (Sc_I.2.2, PV and wind).
SC_II: Without feed-in tariff for excess electricity
If the RESA feed-in tariff ceases (Figure 9b), no PV system would be built as long as market prices are not expected to rise (by at least three times). The latter variant (Sc_II.1.2, PV) is based on a 306 kWp PV system, which is sufficient to cover 84% of a farm’s electricity requirements and only works in combination with a battery. The battery should then cover 100% of the PV current.
The additional use of wind energy, i.e., participating in investments in wind turbines with the right to purchase electricity at a production cost of 4.72 ct/kWh, would reduce the electricity cost even further, to 15 ct/kWh at the current market price for purchasing electricity.
If the purchase price for electricity was doubled or tripled (Sc_II.2.1 and Sc_II.2.2, PV and wind), the electricity cost would rise to 20 or 25 ct/kWh. With current electricity prices and with a doubling of the price, only wind power would be used; when the electricity price is tripled, PV and wind are combined, with proportions of 9% PV and 91% wind (Sc_II.2.2, PV and wind), in combination with a battery (battery coverage 19%). A degree of self-sufficiency of 84% could be achieved here.
In the previous sections, the possible use of batteries for the two extreme scenarios of electricity consumption only during the day and only at night was analyzed. In the following sections, the intermediate variants with 75, 50 and 25% electricity consumption during the day are presented, as well as the effect of a 2.5-fold increase in electricity price. The latter is included because it has been found that investing in batteries would only be worthwhile if the price of electricity increased by more than double.

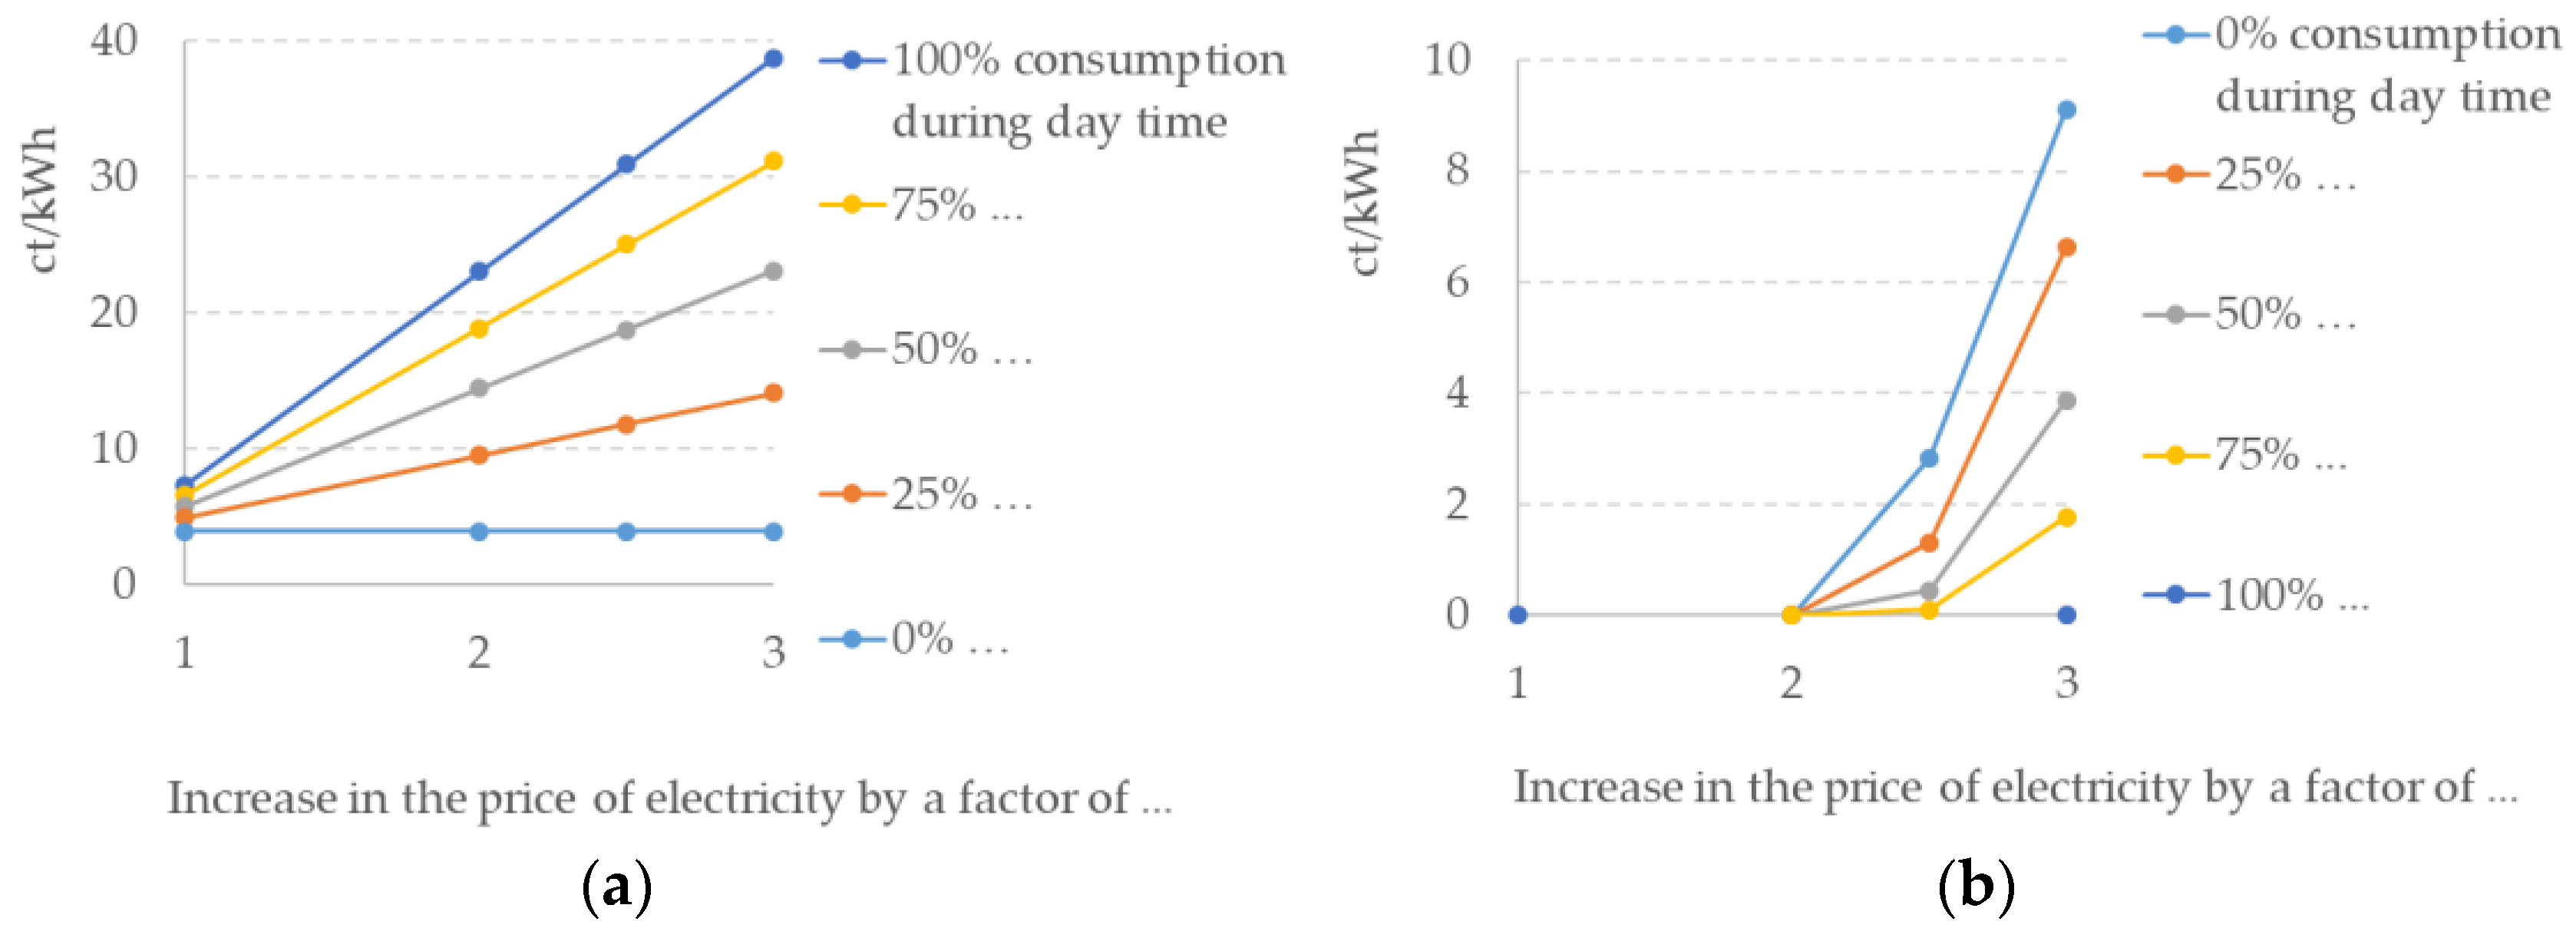
4.3. Sc_I: Electricity Costs and Benefits When Using RE with Feed-In Tariff

4.3.1. Investing in PV Systems: Sc_I.1

Under the currently valid conditions of the RESA and its regulations for feeding electricity into the public grid, investing in PV systems makes economic sense as long as (as assumed here) the generation cost for electricity (11 ct/kWh) is below the feed-in tariff (13 ct/kWh). The size of the PV system is then only limited by the available roof areas, and it is assumed here that this limit is 200% of the farm’s electricity requirement, i.e., 730 kWp. Regardless of the load curves and increases in electricity prices, the farm’s potential to invest in this type of renewable energy should be exploited. As already stated, investing in a battery is recommended when the price of electricity rises (or battery cost decreases) and power consumption increases at night. With this development in mind, the optimal battery coverage increases from 20% (75% electricity consumption during the day and 2.5 times increase in electricity price) to 100% (0% electricity consumption during the day and 3 times increase in electricity price). Over the course of the year, the battery capacity is between 70 and 80% (Table 6).
The degree of self-sufficiency is between zero and approximately 80% if a PV system, initially considered without batteries, is used. The higher the electricity consumption during the day, the higher the autonomy achieved. As already explained, an electricity price that is higher by a factor of 2.5 leads to a profitable use of batteries; this also increases the degree of self-sufficiency, initially to values between 60 and 80%, and in all cases to approximately 80% when the electricity price is three times higher (Figure 10).
In the status quo without RE (Sc_0), the cost of the farm’s power supply is 20 ct/kWh. If the farm invests in a PV system, the price can initially drop to 12.7 ct/kWh with 100% consumption during the daytime, and then rise to 56.1 ct/kWh when consumption increases at night and the electricity price is three times higher (Table 7). In extreme cases, this can save around 9 ct/kWh (56.1 minus 47.0 ct/kWh). As already shown in Table 6, the additional use of a battery is worthwhile with a 2.5-fold increase in electricity price and if at least 25% of the electricity is consumed at night, which means less than or 75% at daytime.
The advantage of investing in a PV system is higher when more electricity can be used during the day (Figure 11a). The additional benefit of a battery only becomes apparent when there are certain price differences for purchasing electricity, especially when there is increased night-time consumption (Figure 11b).

4.3.2. Investing in PV Systems and Wind Turbines

Very few companies will have access to such “cheap” wind power as assumed here. In the long term, this cannot be ruled out, especially if scenario Sc_II.2.2 occurs, namely that wind turbines older than 20 years and not suitable for repowering will also be excluded from further funding by the RESA (Fuchs et al. 2020). What is interesting about this question is the initial division of RE capacity and the scope of investments in PV systems or wind turbines.
In principle, as in all the cases described above, it is always the case that with profitable electricity production under the conditions of the RESA, i.e., with guaranteed feed-in tariffs, the maximum investment volume for the farm is recommended.
Furthermore, it is noticeable that investments are made predominantly in the variant that is cheaper per kWh, wind turbines. When the electricity is used predominantly during the day (100%) and when the electricity price rises, 64% of the share or more is generated by PV. With the combination of PV systems and wind turbines, the use of batteries is even more restricted to scenarios with a high purchase price (about three times the current electricity price) and electricity consumption at night (Table 8). The degree of self-sufficiency is generally somewhat higher than with pure PV systems, and in extreme cases increases to 94% with predominantly night-time consumption (Figure 12).
The cost of the farm’s power supply with the combination of PV and wind is again lower than with only a PV system. The effect can even be observed here that the electricity cost falls again if more electricity is used at night (Table 9). This is due to the nocturnal electricity yield of the wind turbines. Because of the relatively high degree of self-sufficiency mentioned above, the increase in cost is also limited in the event of a price increase on the electricity market, which would result in an even greater economic advantage compared to the status quo (without renewables). The use of batteries would be avoided in the scenarios last considered.
The advantage of investing in and thus using renewable energy from PV systems combined with wind turbines increases from about 10 Ct/kWh to about 50 Ct/kWh when the electricity purchase price rises threefold (Figure 13a). Only in the considered scenario Sc_I.2.2 (PV and wind with batteries) and with a threefold increase in electricity price, investing in a battery would be profitable, but the advantage of 1 Ct/kWh would be nearly negligible (Figure 13b). In this case, the battery coverage would be 22% and usage 52%.

4.4. Sc_II: Electricity Costs and Benefits When Using RE in the Period after the RESA, without Feed-In Tariff

The following scenarios not only cover the situation in Germany for the period post-RESA, but also can be transferred to other countries that do not have a comparable regulation. As already shown, in the case of investing in renewable energy that is only intended to serve the farm’s own self-sufficiency, the capacity of electricity production would be adapted to the farm’s needs. This means that PV capacity is built up to the level of the farm’s consumption (Table 10). In the case of possibly investing in shares of wind turbines, oversubscription (by up to 100% at the highest assumed electricity price) would also be economical, and a significantly larger part would then have to be curtailed. In the case of scenario Sc_II.2 (without feed-in tariff), a detailed presentation of the results of the technical design of a combined investment in PV systems and wind turbines is not given here, since the essential relationships have already been presented.
If renewable energy systems fall out of the RESA subsidy, i.e., if less electricity can be sold at guaranteed prices, then the farm’s electricity supply becomes more expensive. The cost of the power supply would increase by 4 to 6 ct in the status quo scenario (current market prices) and up to 10 ct if the electricity price increases by a factor of three.

4.5. Summary Comparison of Battery Cover and Battery Usage

The use of batteries becomes economically profitable as soon as a certain amount of the electricity produced during the day is required at night and the spread between the cost of electricity production including storage and the purchase price for electricity continues to increase. For example, with 25% power consumption at night and the electricity price increased by a factor of 2.5, the simulations result in optimal battery coverage of 20% of consumption, and capacity utilization of 69% of the battery could be achieved. In addition, battery coverage for load curves with predominant consumption at night and a further increased purchase price for electricity would be economical up to a degree of 100% (Table 11). It should be noted that in the assumed scenarios, under no circumstances can full self-sufficiency be achieved (Figure 12). If there is the possibility of proportional investment in a wind turbine with the purchase of electricity at production cost, the use of a battery loses its importance to a large extent.

5. Discussion and Conclusions

5.1. Limitations of the Algorithm and the Data Used

Limitations are primarily not in the mathematical optimization model, but in the available data as there are seasonally fluctuating energy demand and changing price relations in the course of technical development and legal regulations on climate protection.
High seasonal energy consumption by large electricity consumers within a short period of time, e.g., drying, storage and retrieval of grain, diesel consumption is not considered in the model. Further research is done on the climate neutral use of diesel fuel for tractors by production of sun fuel with electrolysis and further processing to green diesel, which is currently already technically possible, but still uneconomical.
The yearly sums of electricity supply and demand also may differ, e.g., differences between years and regions; e.g., in southern Germany more solar yield and less wind yield occur than in northern Germany, the region under investigation. Due to rapidly changing price relations, decreasing investment costs and increase in electricity purchase prices and ecotaxes the calculation results represent a snapshot, but give an indication of long-term trends. The nonlinear solution algorithm with Excel Solver can be applied to other framework conditions, so mathematical limitations are not seen.
The present simulation is an ex post consideration, which combines both long-term investments and determination of the capacities of PV systems, wind turbines and battery storage, but also gives short-term decision support (daily charging of the battery, sale of the remaining electricity, purchase of missing electricity quantities) simultaneously in one model. For operational forecasts, a continuously recurring algorithm, e.g., weekly with feed-in of data from a weather report, would have to be applied. In addition, flexibility in controlling of variable power consumption should be built into such a model, e.g., feed preparation of milling and mixing on days and hours when high solar irradiation is expected. Such models have already been developed, but are not yet applicable in practice due to the lack of interfaces to concrete electricity measurement in the farm and to missing weather forecasting links [20].

5.2. Comparing Results and Recommendations for Agricultural and Other Businesses

Due to the international climate agreements [1] and e.g., the requirements of the EU on climate targets (80% RE by 2050), the issue presented here is also relevant for other regions and countries, even if different detailed legal regulations are effective. As already mentioned in Section 1.1., the international literature search found few papers on battery use in agriculture. At the national level, a great deal is written about the topic in professional journals, although economic analyses of battery use over a period of an entire year are lacking. Recent publications report of the possibilities of saving electricity through self-generation and self-consumption, whereby in the case of a PV system, a high level of self-consumption is only possible with a storage device, e.g., a battery [21]. The chambers of agriculture, associations and advisory organizations, as well as associations of the common use of machinery give numerous recommendations in this regard. Most of the analyses mention the particular interest to livestock farmers, which coincides with the statements in this study, although such a well-founded analysis with the scenarios presented here is lacking. Battery use seems to be on the cusp of widespread practical use [15,21,22,23].
Concluding, it is noted that energy storage devices are needed in order to be able to realize a higher proportion of self-consumption of the electrical energy generated during the operation of photovoltaic systems or wind power plants. Examining the question of whether such a strategic investment leads to economically positive effects depends in principle on the development of the price of feeding unused self-generated electricity into the public grid on the one hand, purchasing electricity from the public grid on the other hand and the electricity storage cost. Since the foreseeable tendency is that electricity prices will rise, the remuneration for feeding electrical energy generated during operation into the grid will decrease and the cost for installing storage technology will also decrease, it is recommended to consider the conditions and requirements of farms concerning the emergent economic effect and carry out corresponding model calculations.
At present, given the framework conditions described, in particular because of the still relatively high cost of storage technology, it can be assumed that these investments are not economically justifiable. However, development tendencies such as those mentioned can already be identified today, which will lead to different results when assessing the costs and benefits of largely self-sufficient energy systems. Developments in storage technology, especially concerning technologies and investment costs, should be observed with particular interest.
Under current price conditions (sales price for PV electricity of 13 ct/kWh with production cost of 11 ct/kWh; sales price for wind power of 5 ct/kWh with production cost of 3 ct/kWh; cost of storing electricity in a battery of 33 ct/kWh; purchase of electricity at 20 ct/kWh) investing in RE makes sense for individual companies, but using batteries is still unprofitable. The decarbonization of the economy with the increasing availability of a (volatile) supply of renewable electricity could lead to increased electricity prices, especially at night. Together with falling costs for storage, the use of batteries for decentralized power generators could become quite interesting. In general, companies with high night-time power requirements and existing PV systems or wind turbines would be the first to invest in batteries. In the event of a 2.5-fold increase in electricity prices or a ceteris paribus adequate reduction in storage costs, an initial economic threshold would be exceeded and battery capacity to store 20% of the electricity required for one day would make sense. With this higher electricity purchase price, investing in battery capacity of 45% of the daily requirement would be appropriate in animal husbandry (farrowing operation, piglet rearing, pig fattening, broiler fattening) with over 50% electricity requirement at night. For the latter example, the cost savings by investing in a PV system alone would amount to 37.6% compared to without the farm’s own renewable energy, and using batteries could save about another 1% in the farm’s power supply cost. The investigation shows that the many investments that have already been made in renewable energy are already paying off for farmers today, but the use of batteries on farms is currently and for the near future only useful to a limited extent. Cheaper battery technology and rising electricity prices will accelerate the use of batteries. In order to avert risks, e.g., an emergency power failure, it may be advisable to use batteries as a backup. Clemens Fuchs Axel Poehls, Katharina Skau and Joachim Kasten.

Author Contributions

Conceptualization, all authors; methodology and data collection, K.S.; calculation, C.F.; writing—original draft preparation, C.F. and A.P.; writing—review and editing, J.K. All authors have read and agreed to the published version of the manuscript.

Funding

The authors would like to thank Neubrandenburg University of Applied Sciences, which sponsored this work as part of its internal research funding in 2018 under project title “Battery use in agricultural electricity production”. We acknowledge support for the Article Processing Charge from the Deutsche Forschungsgemeinschaft (DFG, German Research Foundation, 414051096) and the Open Access Publication Fund of the Hochschule Neubrandenburg (Neubrandenburg University of Applied Sciences).

Institutional Review Board Statement

Not applicable.

Informed Consent Statement

Not applicable.

Conflicts of Interest

The authors declare no conflict of interest.

References

  1. UNFCCC. United Nations Framework Convention on Climate Change: The Paris Agreement. 2017. Available online: http://unfccc.int/paris_agreement/items/9485.php (accessed on 7 November 2020).
  2. EEG. Gesetz für den Vorrang Erneuerbarer Energien (Erneuerbare-Energien-Gesetz—EEG) sowie zur Änderung des Energiewirtschaftsgesetzes und des Mineralölsteuergesetzes vom 29. März 2000 (BGBl. I S. 305); Bundesministerium der Justiz und für Verbraucherschutz: Bonn, Germany, 2020. [Google Scholar]
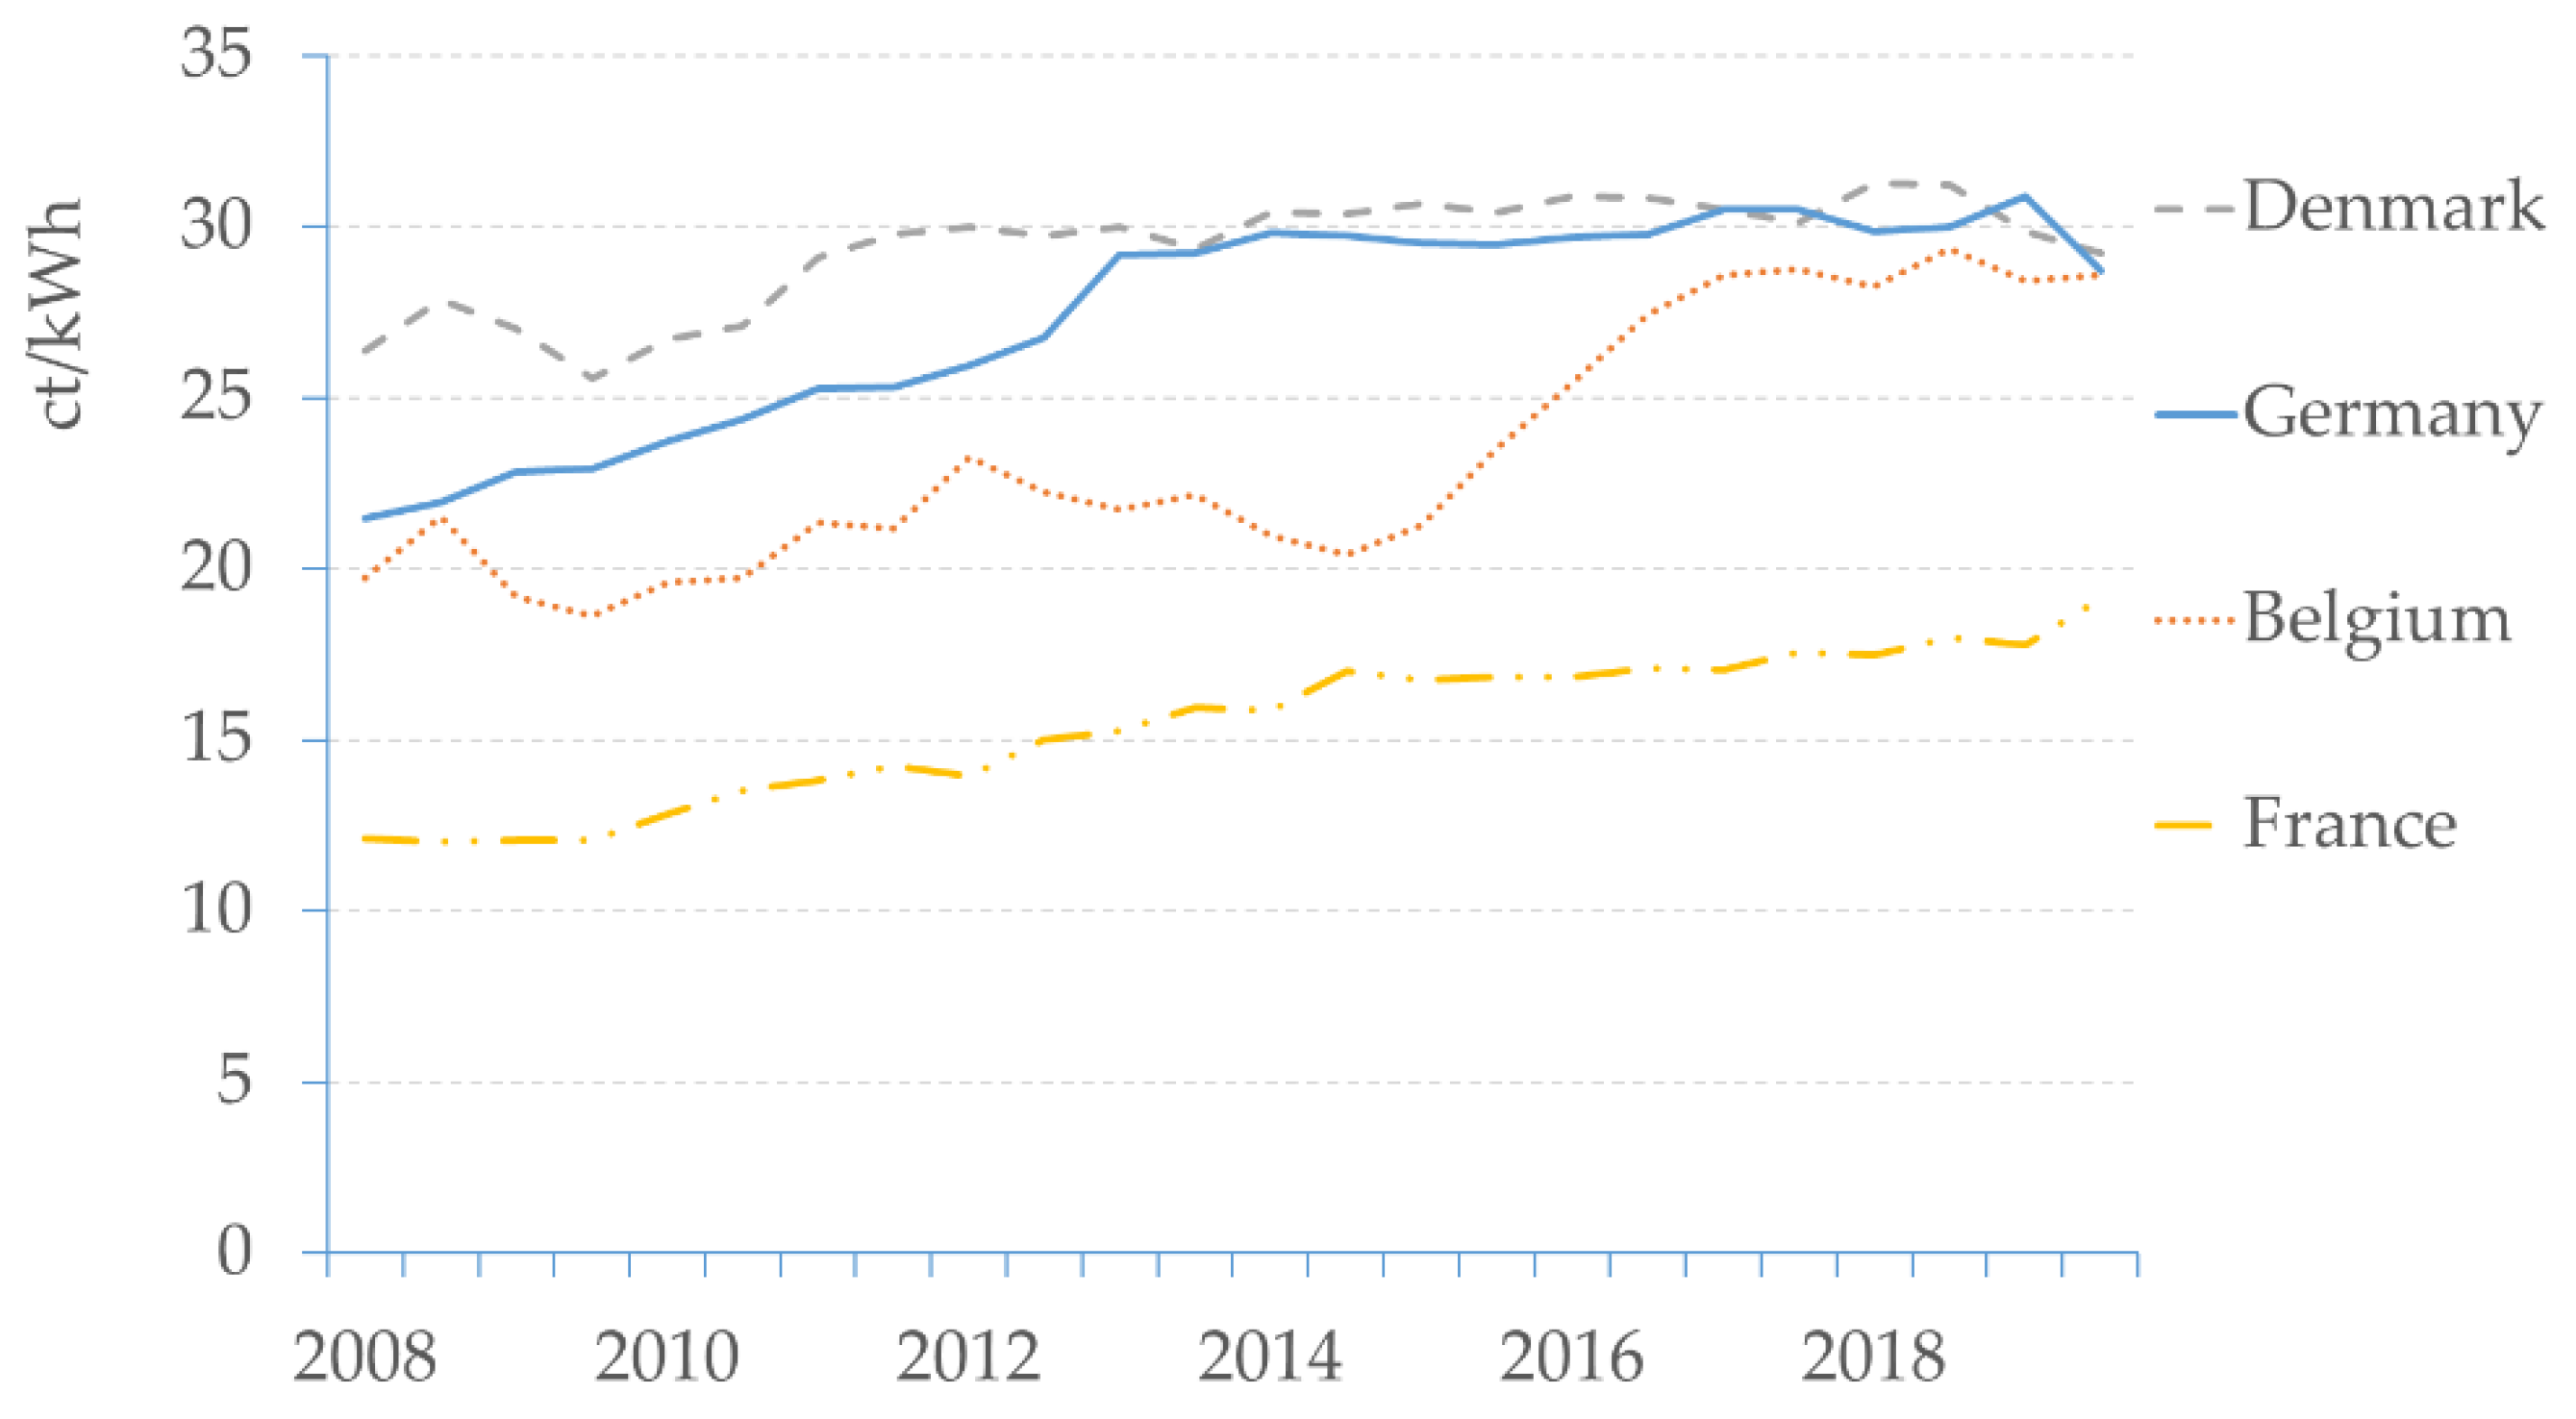
  3. Statistisches Bundesamt (Destatis). Daten zur Energiepreisentwicklung. 5.8.2 Elektrischer Strom-Ct/kwh; Statistisches Bundesamt (Destatis): Wiesbaden, Germany, 2020. [Google Scholar]
  4. Mecklenburg-Vorpommern. Gesetz über die Beteiligung von Bürgerinnen und Bürgern sowie Gemeinden an Windparks in Mecklenburg-Vorpommern (Bürger- und Gemeindenbeteiligungsgesetz-BüGembeteilG M-V) vom 18. Mai 2016. GS Meckl.-Vorp. Gl. Nr. 230-2 vom 18. Mai 2016 (GVOBl. M-V S. 258); Justizministerium Mecklenburg-Vorpommern: Schwerin, Germany, 2016. [Google Scholar]
  5. Daniel-Gromke, J.N.; Rensberg, V.; Denysenko, T.; Barchmann, K.; Oehmichen, M.; Beil, W.; Beyrich, B.; Krautkremer, M.; Trommler, T.; Reinholz, J.; et al. Optionen für Biogas- Bestandsanlagen bis 2030 aus Ökonomischer und Energiewirtschaftlicher Sicht; Umweltbundesamt: Dessau-Roßlau, Germany, 2020; Available online: https://www.umweltbundesamt.de/publikationen/optionen-fuer-biogas-bestandsanlagen-bis-2030-aus;2020-01-30_texte_24-2020_biogas2030.pdf (accessed on 1 December 2020).
  6. Trahey, L.; Brushett, F.R.; Balsara, N.P.; Ceder, G.; Cheng, L.; Chiang, Y.-M.; Hahn, N.T.; Ingram, B.J.; Minteer, S.D.; Moore, J.S.; et al. Energy storage emerging: A perspective from the Joint Center for Energy Storage Research. Proc. Natl. Acad. Sci. USA 2020, 117, 12550–12557. [Google Scholar] [CrossRef] [PubMed]
  7. Um, J.H.; Ahn, C.-Y.; Kim, J.; Jeong, M.; Sung, Y.-E.; Cho, Y.-H.; Kim, S.-S.; Yoon, W.-S. From grass to battery anode: Agricultural biomass hemp-derived carbon for lithium storage. RSC Adv. 2018, 8, 32231–32240. [Google Scholar] [CrossRef] [Green Version]
  8. Knutel, B.; Pierzyńska, A.; Dębowski, M.; Bukowski, P.; Dyjakon, A. Assessment of energy storage from photovoltaic installations in poland using batteries or hydrogen. Energies 2020, 13, 4023. [Google Scholar] [CrossRef]
  9. Zhou, H.S.; Passey, R.; Bruce, A.; Sproul, A.B. Aggregated impact of coordinated commercial-scale battery energy storage systems on network peak demand, and financial outcomes. Renew. Sustain. Energy Rev. 2021, 144, 111014. [Google Scholar] [CrossRef]
  10. Kerry, T.-S. What is the Future of Batteries for Stationary Energy Storage? AZoCleantech. 2021. Available online: https://www.azocleantech.com/article.aspx?ArticleID=1184 (accessed on 14 April 2021).
  11. AG Energiebilanzen e.V. Bruttostromerzeugung in Deutschland von 1990 bis 2012 nach Energieträgern (Gross Electricity Production in Germany from 1990 to 2012 by Energy Carriers). Available online: http://www.ag-energiebilanzen.de (accessed on 16 February 2013).
  12. Federal Ministry for Economic Affairs and Energy. Renewable Ernery. Germany. 2021. Available online: https://www.bmwi.de/Redaktion/EN/Dossier/renewable-energy.html (accessed on 8 April 2021).
  13. Wesselak, V.; Schabbach, T.; Link, T.; Fischer, J. Handbuch Regenerative Energietechnik, 3rd ed.; Springer Verlag GmbH: Vieweg, Germany, 2017; p. 735. [Google Scholar]
  14. Quaschning, V. Erneuerbare Energien und Klimaschutz. Hintergründe-Techniken und Planung-Ökonomie und Ökologie-Energiewende. 5., aktualisierte Auflage; Carl Hanser Verlag München: München, Germany, 2020; p. 149. [Google Scholar]
  15. C.A.R.M.E.N.e.V. Battery Storage Market Overview. Germany. 2021. Available online: https://www.carmen-ev.de/service/marktueberblick/marktuebersicht-batteriespeicher/ (accessed on 14 April 2021).
  16. Theodor Remmersmann In-House Production of Electricity from Sun and Wind. Muenster. 2018. Available online: https://www.ktbl.de/fileadmin/user_upload/Allgemeines/Download/Tagungen_2019/Eigenstromproduktion.pdf (accessed on 9 September 2020).
  17. Hau, E. Wind Power Plants: Basics, Technology, Use, Economy, 6th ed.; Springer: Berlin/Heidelberg, Germany, 2016. [Google Scholar]
  18. Tesvolt Battery system TS HV 70/STP 60. 2018. Available online: https://www.tesvolt.com/en/products/ts-hv-70.html (accessed on 14 April 2021).
  19. Keller, L. Comparison of Theoretical and Actual Power Consumption of a Farm to Optimize Energy Management. Bachelor’s Thesis, University of Neubrandenburg, Neubrandenburg, Germany, 2016. [Google Scholar]
  20. Skau, K.; Fuchs, C.; Spielmann, V.; Beck, H.-P.; Bettinger, C. Renewable Energy—Opportunities for production and use of electrical power for farmers under conditions of the renewable energy act in Germany. In Proceedings of the 20th International Farm Management Congress 2015, Canada: Healthy Agriculture for a Healthy World; Proceedings, Laval University, Québec, QC, Canada, 12–17 July 2015; International Farm Management Association: Québec, PQ, Canada, 2015; pp. 429–435, ISBN 978-92-990062-3-8. Available online: http://ifmaonline.org/wp-content/uploads/2016/01/15_Skau_etal_P429-435.pdf (accessed on 1 December 2017).
  21. Seidel, N. Stromspeicher auch für die Landwirtschaft?! 2021. Available online: https://www.landwirtschaftskammer.de/landwirtschaft/technik/energie/photovoltaik/batteriespeicher.htm (accessed on 21 April 2021).
  22. Vagt, M. Stromspeicher in der Landwirtschaft auf dem Vormarsch. 2021. Available online: https://www.topagrar.com/energie/news/stromspeicher-in-der-landwirtschaft-auf-dem-vormarsch-12067981.html (accessed on 21 April 2021).
  23. Maschinenring. Batteriespeicher von LandEnergie. 2021. Available online: https://www.maschinenring.de/einkaufsvorteile/strom-und-erdgas/batteriespeicher (accessed on 21 April 2021).
Figure 1. Electricity price development when sold to private households (annual consumption of 2500 kWh to less than 5000 kWh), first half-year 2008 to second half-year 2019, comparing selected EU countries [3].
Energies 14 02430 g001
Figure 2. Model with components of electricity generation and storage, representation of electricity market (with price increase) and the farm’s own consumption with variable day/night consumption shares.
Energies 14 02430 g002
Figure 3. Daily electricity production with the help of a 645 kWp PV system, measured based on 15 min values from Neustrelitz solar park, Germany, 2012; annual output approximately 645,000 kWh.
Energies 14 02430 g003
Figure 4. Daily electricity production from a wind turbine, scaled down to 215 kWp, measured based on 15 min values from Neustrelitz wind park, Germany, 2012; annual output approximately 645,000 kWh.
Energies 14 02430 g004
Figure 5. Distribution of daily output of a combination of wind turbine (60.8 KWp) and PV system (182.5 KWp) in 2012; daily consumption 1000 kWh, annual 365,000 kWh.
Energies 14 02430 g005
Figure 6. Typical load curves of various farm operations; continuous average daily electricity consumption in intervals of 15 min.
Energies 14 02430 g006
Figure 7. Annual electricity production potential from the farm’s own generation (50% wind and 50% PV), consumption during the day and at night, balancing by a battery, buying and selling. Requirement values, 50% during the day and 50% at night; battery power 500 kWh/d; battery utilization over the year 13%; self-sufficiency 76%.
Energies 14 02430 g007
Figure 8. Cost of electricity for a farm with consumption only during the day (100% day) for status quo (0.20 ct/kWh) and when price is doubled or tripled, as well as investments in PV or PV and wind, showing batteries are not worth the investment: (a) Sc_I: with feed-in tariff according to RES Act (PV power 13 ct/kWh or wind power 5 ct/kWh) (b) Sc_II: without feed-in tariff for excess electricity (post-RESA).
Energies 14 02430 g008
Figure 9. Costs of electricity consumption for an operation with consumption only at night (0% day) for status quo (0.20 ct/kWh) and when electricity price is doubled or tripled and when investing in PV or PV and wind; only when prices triple, with PV power and 100% battery coverage, and with wind and PV and 22% battery coverage (within RESA, a) or 19% battery coverage (post RESA, b).
Energies 14 02430 g009
Figure 10. Degree of self-sufficiency for investing in PV systems (Sc_I.1) with and without batteries, depending on the proportion of daytime electricity consumption.
Energies 14 02430 g010
Figure 11. (a) Economic advantages of investing in a PV system for a farm’s power supply and (b) additional benefits of investing in batteries.
Energies 14 02430 g011
Figure 12. Degree of self-sufficiency for investing in PV and wind turbines (Sc_I.2) with and without batteries.
Energies 14 02430 g012
Figure 13. (a) Economic advantages of investing in PV and wind systems for operational power supply and (b) additional benefits of investing in batteries.
Energies 14 02430 g013
Table 1. Cost calculation for generation and storage of renewable electricity.
RE Type/StorageAcquisition Cost (A0)Useful LifeInterest RateOther Costs, % of A0Average Cost, EUR p.a.PowerCost, EUR/kWh
PV systemEUR 1300/kWp20 years3%2%110.50 1000 kWh p.a.0.1105
Wind turbineEUR 1000/kWp20 years3%6%85 3000 kWh p.a.0.0417
BatteryEUR 1230/kWh30 years3%59.45 365 kWh per day 10.3259
1 With daily use of battery/useful capacity (net storage capacity in kWh) [16,17,18].
Table 2. Investment requirements to generate 1000 kWh of renewable electricity and store 500 kWh (usable capacity/storage capacity net in kWh) per day.
RE Type/StorageStandardized Daily Electricity Demand, kWhAnnual Electricity Demand, kWh p.a.Performance Hours (Peak), p.a.Plant Size, kWpInvestment Amount 1, EUR
PV system1000365,0001000365474,500
Wind turbine1000365,0003000122121,667
Battery500182,500 615,000
1 Calculation: plant size (column 5) × acquisition (A0) in EUR (column 2 in Table 1).
Table 3. Selection of electrical equipment in arable farming (farm size 1000 ha).
DeviceLocationSystem Output (kW)Number Per OperationNumber Per HectareTotal System Power (kW)
LightGrain hall0.86500.0543.0
High-pressure cleanerWorkshop2.910.0012.9
LightOffice0.0620.0020.1
LightWorkshop0.8640.0043.4
LightGrain drying0.86100.018.6
LightLounge0.0640.0040.2
Engine for gas stationWorkshop0.0310.0010.03
Electric welding deviceWorkshop0.410.0010.4
ComputerOffice0.07810.0010.1
Wheel loader (electric)Drive motor1510.00115.0
Hydraulic motor2210.00122.0
Drying fanGrain drying system7526.67150.0
Total 245.8
Table 4. Typical average daily electricity consumption of various farm operations: regular electricity consumption without variable additional power consumption for forage farm (dairy farm) and other animal husbandry (farrowing operation, piglet rearing, pig fattening, broiler fattening).
Key FigureUnitFarm Operation
Crop Production
(Arable Farming)
Forage Farm
(Dairy Farm)
Other Animal Husbandry
(Farrowing Operation)
SizeHectares or Animals1000 ha690 Milk Cows1000 Breeding Sows
Total system performancekW245.8169.467.0
Annual electricity consumptionkWh p.a.237,331470,965276,308
Average daily electricity consumption
- TotalkWh/d650.21290.3757.0
- During the daykWh/d491.5340.0331.3
- Rest (night)kWh/d158.7950.3425.7
Relation day/night
- Share dayPercent76%26%44%
- Share nightPercent24%74%56%
Consumption in 15 min
- MinimumkWh/15 min0.04.06.7
- MaximumkWh/15 min13.932.510.4
Table 5. Overview of scenarios for simulation.
Scenario (Sc_ 0 = no RE, I, II with RE)Type of RE (1 = PV/2 = PV and Wind).1 = no/.2 = with BatteryNameAbbreviation
Sc_0 Initial situation (status quo) without RESc_0 (no RE)
Sc_I Sale of surplus electricity with feed-in tariff according to RESA
I.1 Investment in PV systems only
I.1.1… without batterySc_I.1.1 (PV no B.)
I.1.2… with batterySc_I.1.2 (PV w. B.)
I.2 Investment in PV systems and wind turbines
I.2.1… without batterySc_I.2.1 (PV and W no B.)
I.2.2… with batterySc_I.2.2 (PV and W w. B.)
Sc_II Investment in renewables for own use, no/low feed-in tariff for electricity surplus
II.1 Investment in PV systems only
II.1.1… without batterySc_II.1.1 (PV no B.)
II.1.2… with batterySc_II.1.2 (PV w. B.)
II.2 Investment in PV systems and wind turbines
II.2.1… without batterySc_II.2.1 (PV and W no B.)
II.2.2… with batterySc_II.2.2 (PV and W w. B.)
Table 6. Power generation technology: size of PV system and battery, and battery utilization, in %, when limited to a maximum of 200% of farm consumption.
Own Electricity Production withPV, Size of Consumption in %; No BatteryPV and Battery, Battery Coverage in % of Consumption (Utilization in %)
Price increased by factor of1 (status quo)22.531 (status quo)22.53
Purchase price for electricity, ct/kWh2040506020405060
Load curves: share of consumption per day, %0%Same value for all variants; since investment is worthwhile, maximum specified value of 200% is achieved0095% (79%)100% (79%)
25%0070% (75%)94% (72%)
50%0045% (71%)62% (70%)
75%0020% (69%)31% (68%)
100%000%0%
Table 7. Costs of farm’s power supply.
Own Electricity Production withPV (without Battery Option)PV and Battery
Price increased by factor of1 (status quo)22.531 (status quo)22.53
Purchase price for electricity, ct/kWh2040506020405060
Load curves: share of consumption per day, %0%16.136.146.156.116.136.143.247.0
25%15.130.538.245.915.130.536.939.2
50%14.225.531.236.914.225.530.833.0
75%13.421.125.028.813.421.124.927.1
100%12.717.019.121.212.717.019.121.2
Table 8. Technology of electricity production with renewable energy from wind and PV with battery: size of shares in wind turbine, PV system and battery, and battery utilization in % when limited to a maximum of 200% of farm’s electricity consumption.
Own Electricity Production withRatio of PV System Size and Wind Capacity (Total in Each Case 100%)Battery Coverage in % of Consumption (Utilization in %)
Price increased by factor of1 (status quo)22.531 (status quo)22.53
Purchase price for electricity, ct/kWh2040506020405060
Load curves: share of consumption per day, %0%Share of PV system:
Wind turbine:
18%
72%
21%
79%
19%
81%
23%
77%
00022% (52%)
25%35%
65%
17%
73%
25%
75%
25%
75%
0000
50%36%
64%
34%
66%
34%
66%
34%
66%
0000
75%33%
67%
40%
60%
43%
57%
46%
54%
0000
100%37%
63%
64%
46%
64%
46%
66%
44%
0000
Table 9. Costs of farm’s power supply with combined PV and wind, ct/kWh.
Own Electricity Production withWind and PVWind and PV and Battery
Price increased by factor of1 (status quo)22.531 (status quo)22.53
Purchase price for electricity, ct/kWh2040506020405060
Load curves: share of consumption per day, %0%8.513.115.317.68.513.115.316.6
25%8.311.613.214.98.311.613.214.9
50%6.98.113.815.56.98.113.815.5
75%8.49.710.411.08.49.710.411.0
100%11.913.114.115.211.913.114.115.2
Table 10. Power generation technology: size of PV system and battery, and battery utilization in % post-RESA.
Own Electricity Production withPV (without Battery), Size in % of ConsumptionPV and Battery:PV Size and Battery Coverage in % of Consumption (Utilization in %)
Price increased by factor of1 (status quo)22.531 Status quo22.53
Purchase price for electricity, ct/kWh2040506020405060
Load curves: share of consumption per day, %0%84%
100% (65%)
25%15%20%22%24%15%20%28%
9% (49%)
103%
94% (60%)
50%29%40%44%49%29%40%56%
17% (49%)
102%
62% (57%)
75%44%59%66%73%44%59%84%
26% (49%)
100%
31% (54%)
100%59%79%88%98%59%79%88%98%
– No own RE; investment in PV systems or batteries only in specified cases.
Table 11. Battery coverage in % of consumption (and utilization in %).
VariantWith Feed-In TariffWithout Feed-In Tariff (Post-RESA)
PV and BatteryPV and WindPV and BatteryPV and Wind
Electricity price increased by factor of1 (status quo)22.531 (status quo)22.5
Purchase price for electricity, ct/kWh20405060204050
Load curves: share of consumption per day, %0%95% (79%)100% (79%)22% (52%)100% (65%)7% (48%)19% (46%)
25%70% (75%)94% (72%)9% (49%)94% (60%)
50%45% (71%)62% (70%)17% (49%)62% (57%)
75%20% (69%)31% (68%)26% (49%)31% (57%)
100%
– Indicates no battery use.
Publisher’s Note: MDPI stays neutral with regard to jurisdictional claims in published maps and institutional affiliations.

