
A Gate-to-Gate Life Cycle Assessment for the CO2-EOR Operations at Farnsworth Unit (FWU)


Abstract
:
1. Introduction
1.1. Geological and Reservoir Description of FWU
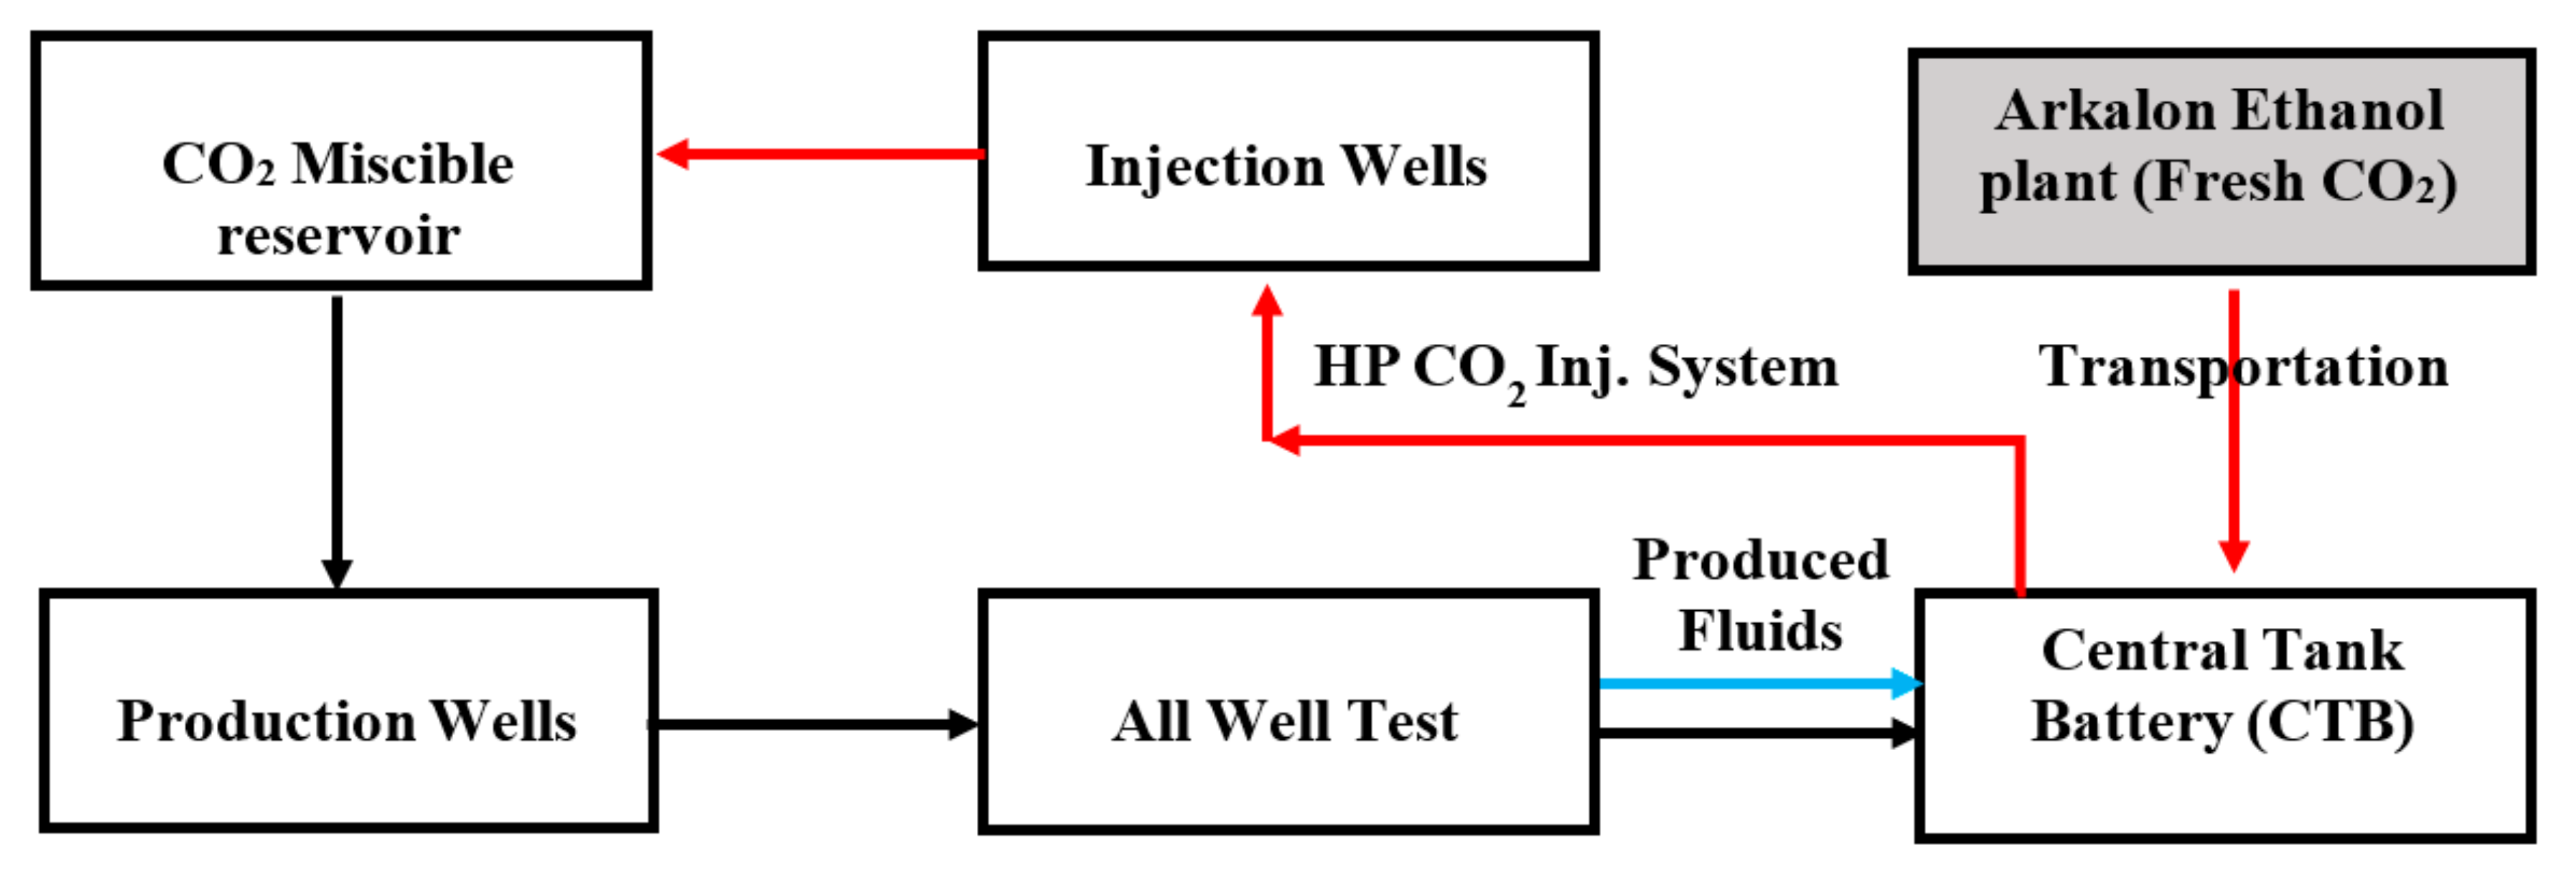
1.2. Overview of CO2-EOR Operations on the FWU
2. Materials and Methods
- ○
- For general CO2-EOR, gas separation would be considered but not in the case for FWU because all recycled gases are reinjected.
- ○
- The percentage of water content in gas is insignificant hence a dehydration component is not included in study.
- ○
- There is an insignificant percentage of CO2 and lighter hydrocarbons in separated crude oil and water hence estimates of gases or volatile oil components (VOC) vented on storage are omitted.
- ○
- Based on the geological description and study, it is very unlikely for formation leakages to occur.
- ○
- A flexible compressor capacity—expanded to meet large volumes of recycled CO2, thus flaring or venting of excess recycled gases would occur only during maintenance periods (due to high cost of backup compressors).
- ○
- Conversion of existing water injectors to WAG wells to add to existing WAG wells.
- ○
- All purchased and produced gases would be reinjected within the 12-year period.
- ○
- All produced water is reinjected in the WAG process, hence treatment of produced water is omitted.
- ○
- Surveillance is put in place (pipelines, wellheads, wells and other surface equipment) to meet requirements in the Texas Administrative Code (TAC) rules for the Texas Railroad Commission (TRRC) Oil and Gas Division to report and quantify leaks, and to minimize leakage of GHG from surface equipment.
- ○
- The option for gas powered/energy efficient compressors other than electric power is also considered.
2.1. Life Cycle Inventory
Summary of Forecasting Model Description
2.2. Emissions/Emission Factor Estimations
3. Results and Discussion
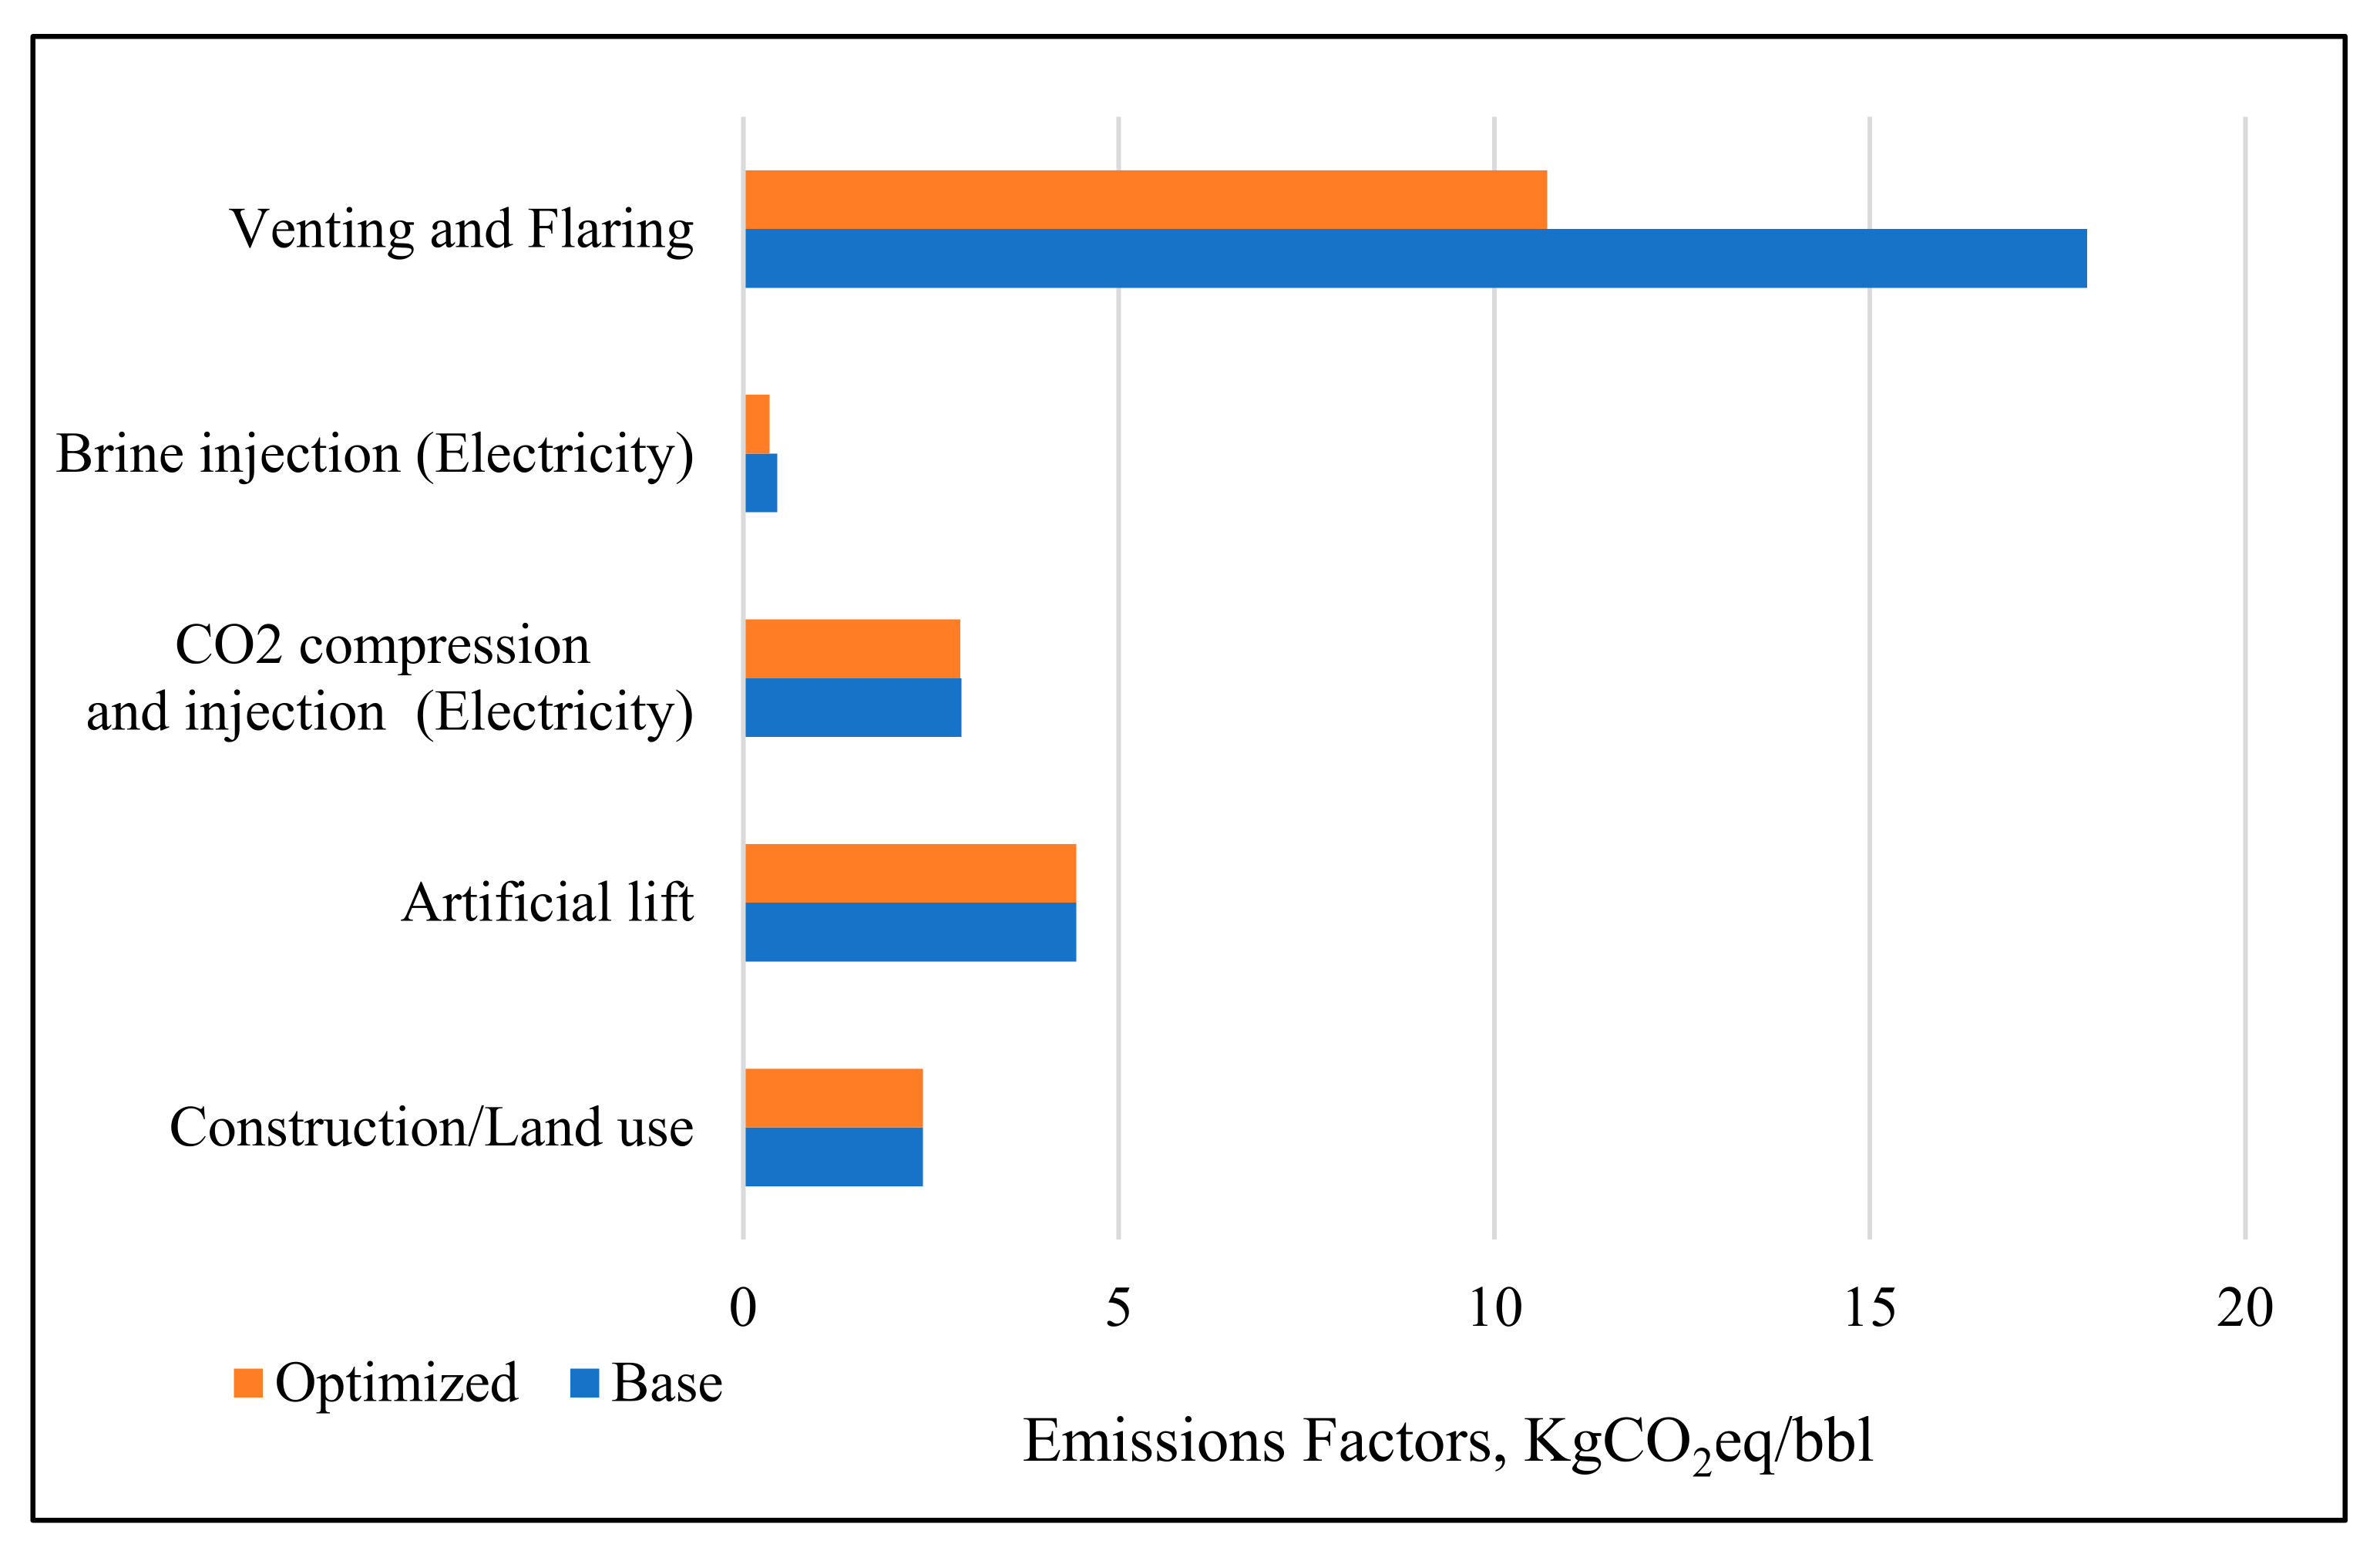
3.1. Scenario 1
3.2. Scenario 2
4. Summary and Conclusions
Author Contributions
Funding
Conflicts of Interest
References
- Khoo, H.H.; Tan, R.B.H. Environmental Impact Evaluation of Conventional Fossil Fuel Production (Oil and Natural Gas) and Enhanced Resource Recovery with Potential CO2 Sequestration. Energy Fuels 2006, 20, 1914–1924. [Google Scholar] [CrossRef]
- Farajzadeh, R.; Eftekhari, A.A.; Dafnomilis, G.; Lake, L.W.; Bruining, J. On the sustainability of CO2 storage through CO2—Enhanced oil recovery. Appl. Energy 2020, 261, 114467. [Google Scholar]
- Herzog, H.; Golomb, D. Carbon Capture and Storage from Fossil Fuel Use. Encycl. Energy 2004, 1, 277–287. [Google Scholar] [CrossRef]
- United States Environmental Protection Agency. Inventory of U.S. Greenhouse Gas Emissions and Sinks; United States Environmental Protection Agency: Washington, DC, USA, 1990.
- Aycaguer, A.-C.; Lev-On, M.; Winer, A.M. Reducing Carbon Dioxide Emissions with Enhanced Oil Recovery Projects: A Life Cycle Assessment Approach. Energy Fuels 2001, 15, 303–308. [Google Scholar] [CrossRef]
- Gale, J.; Metz, B.; Davidson, O.; de Coninck, H.; Loos, M.; Meyer, L. Carbon Dioxide Capture and Storage. Intergovernmental Panel on Climate Change; Cambridge University: Cambridge, UK, 2005. [Google Scholar]
- National Petroleum Council. Enhanced Oil Recovery, An Analysis of the Potential for Enhanced Oil Recovery from Known Fields in the United State; Library of Congress Catalog No. 76-62538; National Petroleum Council: Washington, DC, USA, 1976. [Google Scholar]
- Kuuskraa, V.; Wallace, M. CO2-EOR set for growth as new CO2 supplies emerge. Oil Gas J. 2014, 112, 92. [Google Scholar]
- Sminchak, J.R.; Mawalkar, S.; Gupta, N. Large CO2 Storage Volumes Result in Net Negative Emissions for Greenhouse Gas Life Cycle Analysis Based on Records from 22 Years of CO2-Enhanced Oil Recovery Operations. Energy Fuels 2020, 34, 3566–3577. [Google Scholar] [CrossRef]
- Imanovs, E.; Krevor, S.; Mojaddam Zadeh, A. CO2-EOR and Storage Potentials in Depleted Reservoirs in the Norwegian Continental Shelf NCS. In Proceedings of the 82nd EAGE Annual Conference & Exhibition, Amsterdam, The Netherlands, 18–21 October 2021. [Google Scholar]
- Chamwudhiprecha, N.; Blunt, M.J. CO2 Storage Potential in the North Sea. In Proceedings of the International Petroleum Technology Conference, Bangkok, Thailand, 15–17 November 2011. [Google Scholar]
- Wickramathilaka, S.; Morrow, N.; Howard, J. Effect of Salinity on Oil Recovery by Spontaneous Imbibition. In Proceedings of the 24th International Symposium of Core Analysts, Halifax, NS, Canada, 4–7 October 2010. [Google Scholar]
- Melzer, L.S. Carbon Dioxide Enhanced Oil Recovery (CO2 EOR): Factors Involved in Adding Carbon Capture, Utilization and Storage (CCUS) to Enhanced Oil Recovery; Center for Climate and Energy Solutions: Arlington, VA, USA, 2012. [Google Scholar]
- Gaspar, A.T.F.S.; Suslick, S.B.; Ferreira, D.F.; Lima, G.A.C. Economic Evaluation of Oil-Production Project with EOR: CO2 Sequestration in Depleted Oil Field. In SPE Latin American and Caribbean Petroleum Engineering Conference; Society of Petroleum Engineers: Rio de Janeiro, Brazil, 2005; p. 13. [Google Scholar]
- Skone, T.J.; James, R.E., III; Cooney, G.; Jamieson, M.; Littlefield, J.; Marriott, J. Gate-to-Gate Life Cycle Inventory and Model of CO2-Enhanced Oil Recovery; National Energy Technology Laboratory: Pittsburgh, PA, USA, 2013. [Google Scholar]
- International Standards Organization. ISO 14041: Environmental Management—Life Cycle Assessment—Goal and Scope Definition and Inventory Analysis; International Standards Organization: Geneva, Switzerland, 1998. [Google Scholar]
- Baumann, H.; Tillman, A.-M. The Hitch Hicker’s Guide to LCA. An Orientation in Lifecycle Assessment Methodology and Application; Studentlitteratur: Lund, Sweden, 2004. [Google Scholar]
- CORE LABORATORIES, INC. Petroleum Reservoir Engineering, Core Summary and Calculated Recoverable Oil; Lawton State No. 2 well; CORE LABORATORIES, INC.: Dallas, TX, USA, 1956; Available online: https://geoinfo.nmt.edu/libraries/subsurface/search/scans/API/30-025-01613/CA_30-025-01613.pdf (accessed on 23 April 2021).
- Ampomah, W.; Balch, R.S.; Grigg, R.B.; Will, R.; Dai, Z.; White, M.D. Farnsworth Field CO2-EOR Project: Performance Case History. In SPE Improved Oil Recovery Conference; Society of Petroleum Engineers: Tulsa, OK, USA, 2016; p. 18. [Google Scholar]
- Ross-Coss, D.; Ampomah, W.; Cather, M.; Balch, R.S.; Mozley, P.; Rasmussen, L. An Improved Approach for Sandstone Reservoir Characterization. In SPE Western Regional Meeting; Society of Petroleum Engineers: Anchorage, AK, USA, 2016; p. 15. [Google Scholar]
- Sun, Q.; Ampomah, W.; Kutsienyo, E.; Appold, M.; Adu-Gyamfi, B.; Dai, Z.; Soltanian, M. Assessment of CO2 trapping mechanisms in partially depleted oil-bearing sands. Fuel 2020, 278, 118356. [Google Scholar] [CrossRef]
- Ampomah, W.; Balch, R.S.; Grigg, R.B.; McPherson, B.; Will, R.A.; Lee, S.-Y.; Dai, Z.; Pan, F. Co-optimization of CO2-EOR and storage processes in mature oil reservoirs. Greenh. Gases Sci. Technol. 2017, 7, 128–142. [Google Scholar] [CrossRef]
- Gunda, D.; Ampomah, W.; Grigg, R.; Balch, R. Reservoir Fluid Characterization for Miscible Enhanced Oil Recovery. Presented at the Carbon Management Technology Conference, Sugar Land, TX, USA, 17–19 November 2015; p. 17. [Google Scholar]
- Azzolina, N.A.; Hamling, J.A.; Peck, W.D.; Gorecki, C.D.; Nakles, D.V.; Melzer, L.S. A Life Cycle Analysis of Incremental Oil Produced via CO2 EOR. Energy Procedia 2017, 114, 6588–6596. [Google Scholar] [CrossRef]
- Cooney, G.; Littlefield, J.; Marriott, J.; Skone, T.J. Evaluating the Climate Benefits of CO2-Enhanced Oil Recovery Using Life Cycle Analysis. Environ. Sci. Technol. 2015, 49, 7491–7500. [Google Scholar] [CrossRef] [PubMed]
- Koornneef, J.; Van Keulen, T.; Faaij, A.; Turkenburg, W. Life cycle assessment of a pulverized coal power plant with post-combustion capture, transport and storage of CO2. Int. J. Greenh. Gas Control. 2008, 2, 448–467. [Google Scholar] [CrossRef] [Green Version]
- Suebsiri, J.; Wilson, M.; Tontiwachwuthikul, P. Life-Cycle Analysis of CO2EOR on EOR and Geological Storage through Economic Optimization and Sensitivity Analysis Using the Weyburn Unit as a Case Study. Ind. Eng. Chem. Res. 2006, 45, 2483–2488. [Google Scholar] [CrossRef]
- Azzolina, N.A.; Peck, W.D.; Hamling, J.A.; Gorecki, C.D.; Ayash, S.C.; Doll, T.E.; Nakles, D.V.; Melzer, L.S. How green is my oil? A detailed look at greenhouse gas accounting for CO2-enhanced oil recovery (CO2-EOR) sites. Int. J. Greenh. Gas Control. 2016, 51, 369–379. [Google Scholar] [CrossRef]
- DOE/NETL. Advanced Carbon Dioxide Capture R&D Program: Technology Update, May 2011 edition (p. 118). National Energy Technology Laboratory. Available online: http://www.netl.doe.gov/technologies/coalpower/ewr/pubs/CO2Handbook (accessed on 23 April 2021).
- Xiao, T.; McPherson, B.; Pan, F.; Esser, R.; Jia, W.; Bordelon, A.; Bacon, D. Potential chemical impacts of CO2 leakage on underground source of drinking water assessed by quantitative risk analysis. Int. J. Greenh. Gas Control. 2016, 50, 305–316. [Google Scholar] [CrossRef] [Green Version]
- Xiao, T.; McPherson, B.; Bordelon, A.; Viswanathan, H.; Dai, Z.; Tian, H.; Esser, R.; Jia, W.; Carey, W. Quantification of CO2-cement-rock interactions at the well-caprock-reservoir interface and implications for geological CO2 storage. Int. J. Greenh. Gas Control. 2017, 63, 126–140. [Google Scholar] [CrossRef]
- DOE/NETL. Complete Unit Process Library Listing. Available online: https://netl.doe.gov/node/2573 (accessed on 23 April 2021).
- Electricity Reliability Council of Texas. ERCOT Analysis of the Impacts of the Clean Power Plan; Electricity Reliability Council of Texas: Austin, TX, USA, 2014. [Google Scholar]
- You, J. Multi-Objective Optimization of Carbon Dioxide Enhanced Oil Recovery Projects Using Machine Learning Algorithms. Ph.D. Thesis, New Mexico Tech, Socorro, NM, USA, 2020. Unpublished doctoral dissertation. [Google Scholar]


| Reservoir Properties | Values |
|---|---|
| Oil initially in place | 120 MM STB |
| Gas initially in place | 41.48 BSCF |
| Reservoir pressure | 2217.7 psia |
| Bubble point | 2073.7 psia |
| Formation volume factor | 1.192 RB/STB |
| Reservoir temperature | 168 °F |
| Reservoir drive | Solution gas drive |
| Parameter | Unit | Value |
|---|---|---|
| Max cumulative oil production | MM bbl | 19.3 |
| Max cumulative CO2 storage | MM tonnes | 2.98 |
| Max % Storage of purchased CO2 | percentage | 92.9% |
| Parameters | Unit | Values | Reference |
|---|---|---|---|
| Crude oil produced | bbl crude | Operator/forecast | |
| Crude oil density | kg crude/bbl | 135 | Operator/forecast |
| Net CO2 utilization rate | Mscf CO2/bbl | Operator/forecast | |
| Purchased CO2 requirement | kg CO2 | Operator/forecast | |
| Fugitive loss rate of purchased CO2 | % | 2.0% | [13] |
| CO2 produced (recycled) | kg CO2 | Operator/forecast | |
| CO2 injected | kg CO2 | Operator/forecast | |
| CO2 stored | kg CO2 | Operator/forecast | |
| CO2 leakage rate from storage over 100-year time period | % CO2 stored | 0.5% | [25] |
| Hydrocarbon gas production rate | kg gas/kg crude | Operator/forecast | |
| Brine production rate | kg brine/kg crude | Operator/forecast | |
| Well footprint | Acre | 0.25 | [25] |
| Number of wells | Count | 49 | Operator/forecast |
| Emissions per m2 of repurposed land | kg CO2eq/m2 | 7.5 | [32] |
| Water disposal well construction | kg CO2eq/bbl | 1.0 | [32] |
| Injection well construction | kg CO2eq/bbl | 1.2 | [32] |
| artificial lift pump electricity rate | kWh/kg crude | 1.18 × 10⁻¹ | [32] |
| Compressor power factor | MW/[tonne recycled CO2/day] | 2.70 × 10⁻³ | [25] |
| CO2 pump power factor | MW/[tonne injected CO2/day] | 1.91 × 10⁻⁴ | [25] |
| Compressor CO2 emissions rate (direct to atmosphere) | kg CO2eq/MW-day | 63.6 | [25] |
| Brine injection pump electricity rate | kWh/kg brine injected | 7.87 × 10⁻⁴ | [34] |
| VOC uncontrolled emissions rate to venting and flaring | kg VOC/kg crude | 8.70 × 10⁻³ | [25] |
| Flare rate (% of vented VOC that is flared) | % | 95% | [25] |
| Combustion efficiency | % | 99% | [15] |
| Natural gas usage rate | kg natural gas/kg crude | 3.09 × 10⁻³ | [32] |
| Natural gas delivered CO2 emissions factor | kg CO2/kg natural gas | 1.68 × 10⁻¹ | [32] |
| Natural gas delivered CH4 emissions factor | kg CH4/kg natural gas | 1.81 × 10⁻² | [32] |
| Natural gas delivered N2O emissions factor | kg N2O/kg natural gas | 4.60 × 10⁻⁶ | [34] |
| Natural gas combustion CO2 emissions factor | kg CO2/kg natural gas combusted | 2.75 | [32] |
| Natural gas combustion CH4 emissions factor | kg CH4/kg natural gas combusted | 5.26 × 10⁻⁵ | [32] |
| Natural gas combustion N2O emissions factor | kg N2O/kg natural gas combusted | 5.03 × 10⁻⁵ | [32] |
| Produced water methane content | kg CH4/bbl water | 1.50 × 10⁻³ | [32] |
| Brine disposal pump electricity rate | kWh/kg brine disposal injected | 3.30 × 10⁻³ | [32] |
| ERCOT mix, electricity delivered carbon emission factor | kg CO2eq/MWh | 4.11 × 10² | [32] |
| Factors (kgCO2eq/bbl) | |||
|---|---|---|---|
| Fract/Ref | Ryan-Holmes | Membrane | |
| Electricity | 1.4988 | - | 2.3641 |
| Natural gas upstream | 0.0004 | 1.3608 | 33.3343 |
| Natural gas combustion | 0.0014 | 12.0493 | 15.6464 |
| Diesel Usage | - | 0.1933 | - |
| Fugitive emissions | - | - | 0.1815 |
| SUM | 1.5006 | 13.6035 | 51.5262 |
| Emission (kgCO2eq) | |||
|---|---|---|---|
| Frac/Refr | Ryan-Holmes | Membrane | |
| Electricity | 7,137,323 | - | 11,257,801 |
| Natural gas upstream | 1892 | 64,80,307 | 158,738,878 |
| Natural gas combustion | 6661 | 57,379,327 | 74,508,567 |
| Diesel Usage | - | 920,532 | - |
| Fugitive emissions | - | - | 864,146 |
| SUM | 7,145,875 | 64,780,167 | 245,369,392 |
| Unit Processes | Emission 106 kg CO2eq | Factors kg CO2eq/bbl |
|---|---|---|
| Construction/Land use | 14.18 | 2.98 |
| Artificial lift | 21.12 | 4.44 |
| CO2 compression, and injection (Electricity) | 35.31 | 7.41 |
| Brine injection (Electricity) | 3.43 | 0.72 |
| Brine disposal (Electricity) | 1.11 | 0.23 |
| Flared/Vented | 117.52 | 24.68 |
| Total Emissions | Net Storage | Purchased Stored | |
|---|---|---|---|
| 106 kgCO2eq | 106 kgCO2eq | % | |
| Refrigeration/fractionation | 217.53 | −1161.86 | 78.80 |
| Ryan-Holmes | 275.16 | −1104.22 | 74.95 |
| Membrane | 454.93 | −924.46 | 62.94 |
| FWU (No Gas Separation) | 210.38 | −1169.00 | 79.28 |
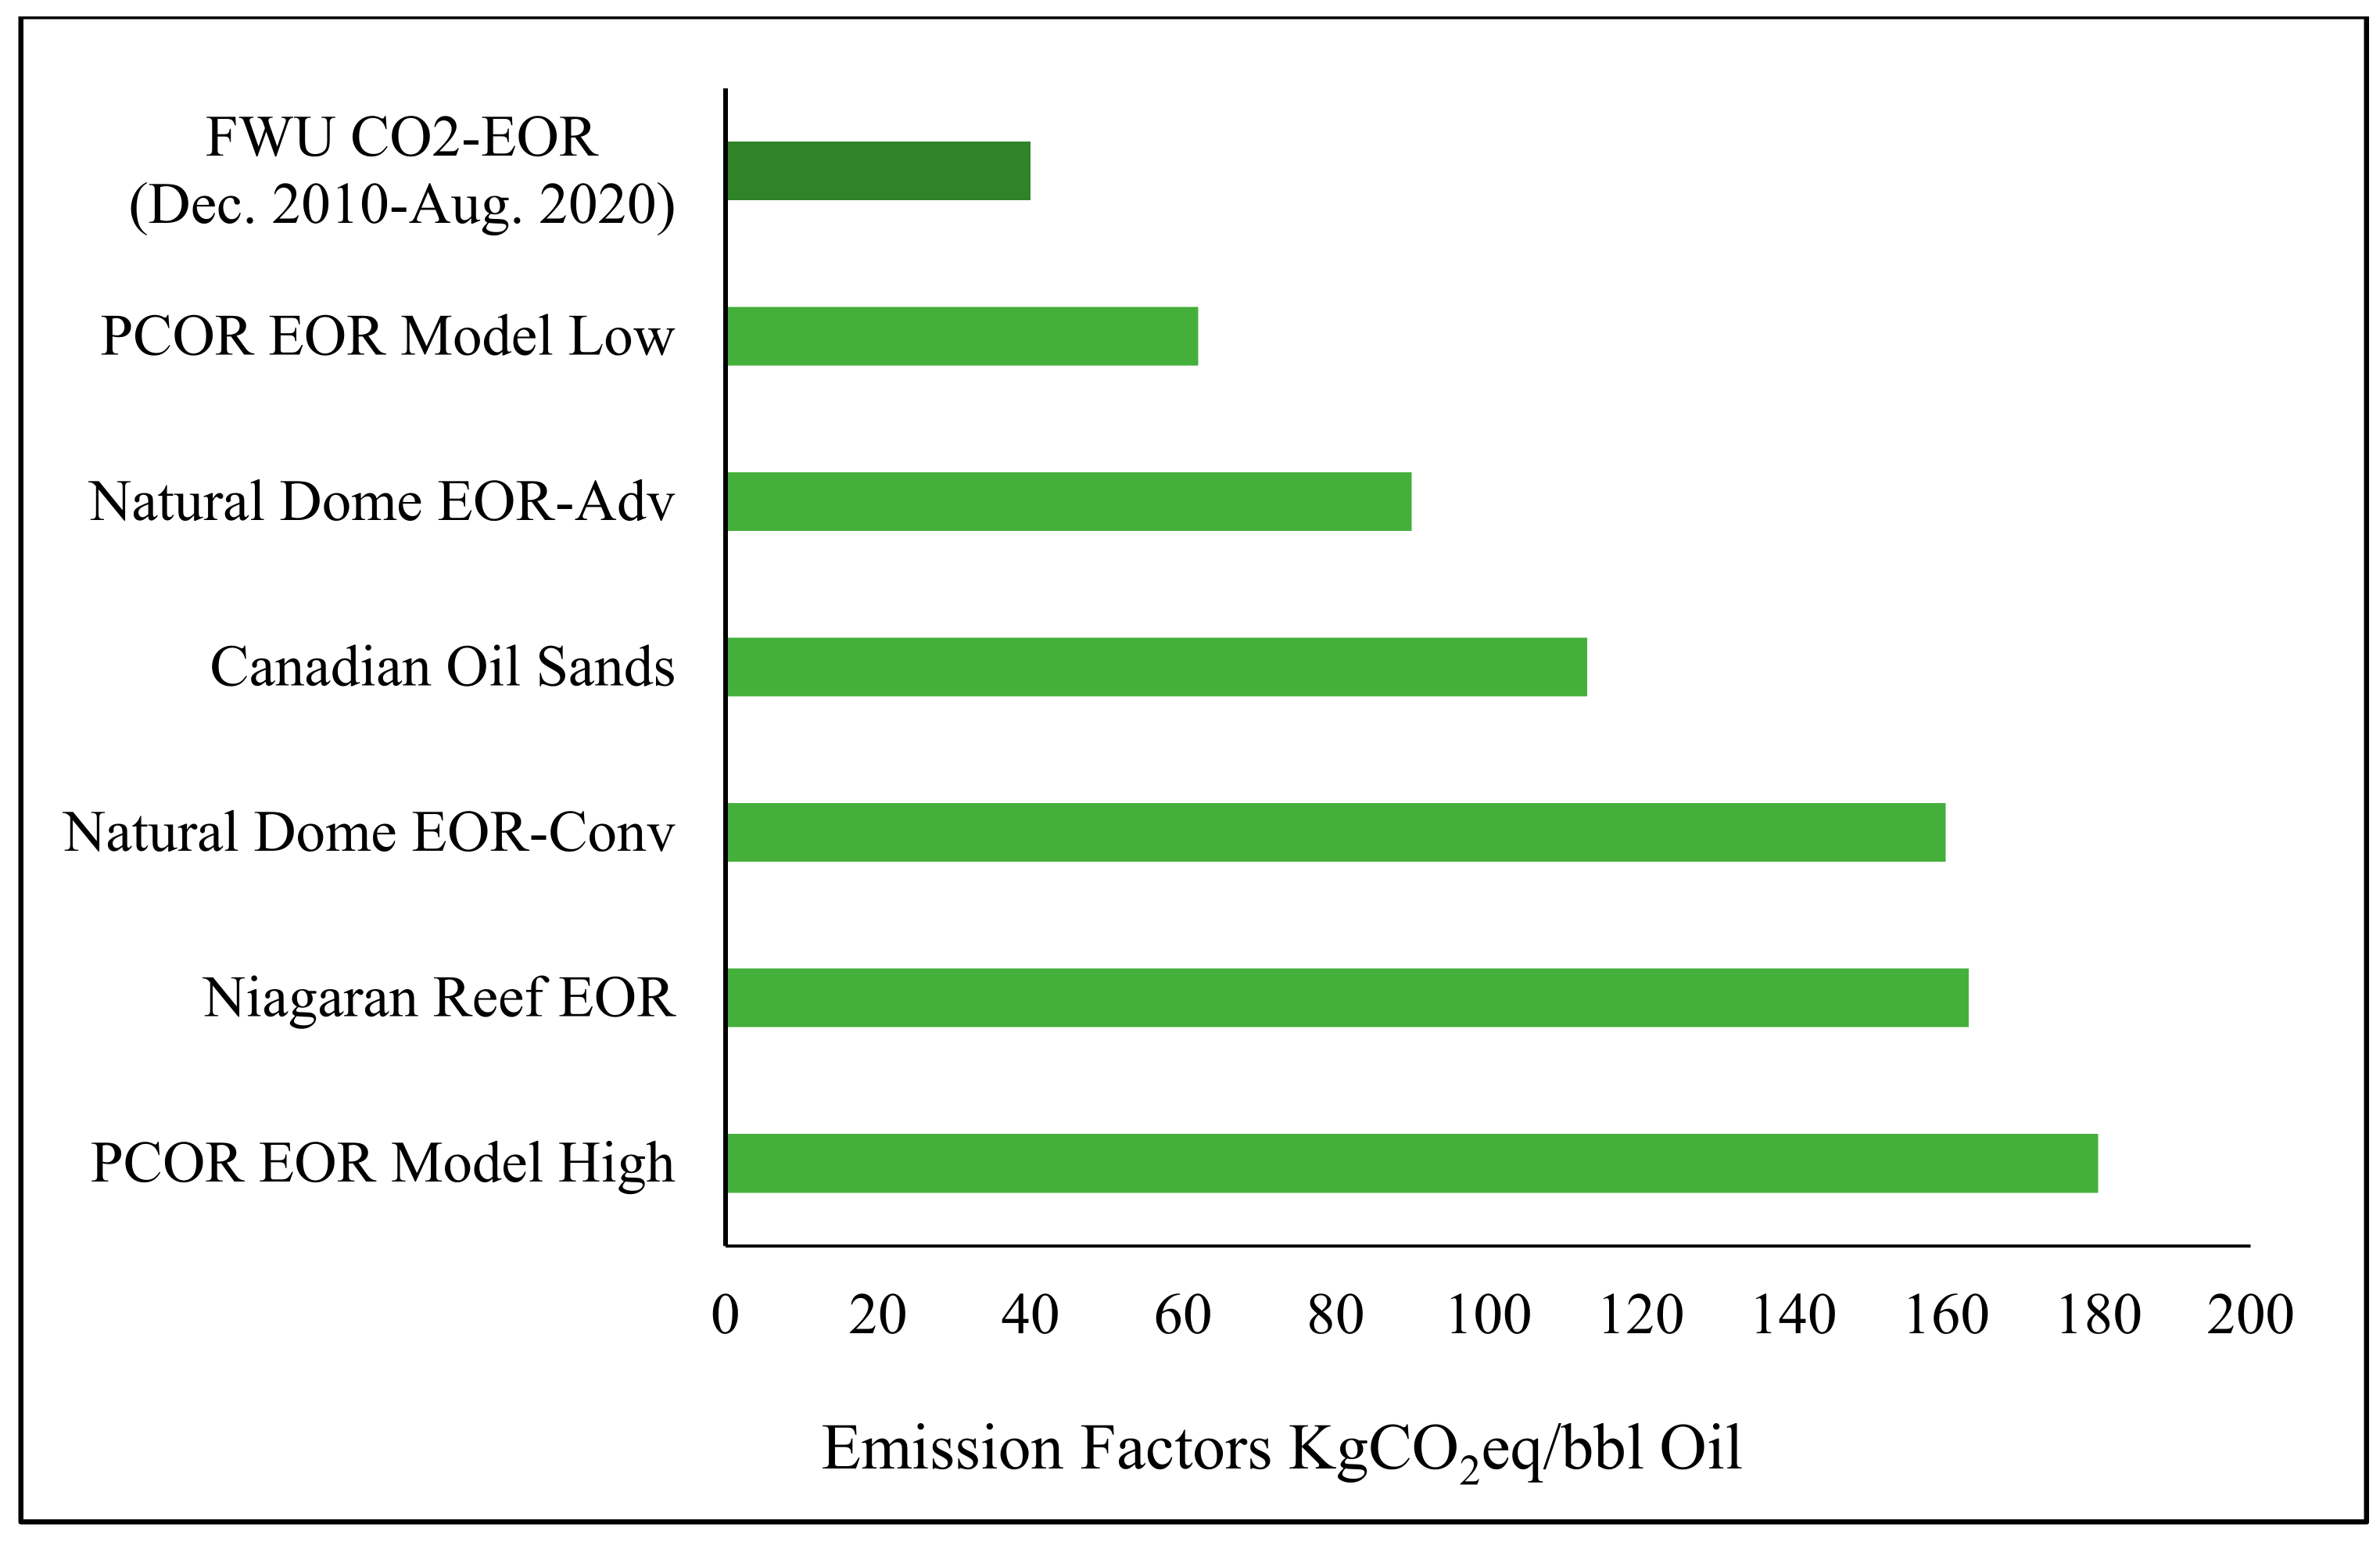
| Process | Emission Factor kgCO2eq/bbl | Net Storage Factor kgCO2eq/bbl |
|---|---|---|
| Refrigeration/fractionation | 42 | −247.70 |
| Ryan-Holmes | 54 | −235.60 |
| Membrane | 92 | −197.85 |
| FWU (No Gas Separation) | 40 | −249.20 |
| FWU (Forecast-opt) | 10 | −130.01 |
| FWU (Forecast-Base) | 28 | −112.00 |
Publisher’s Note: MDPI stays neutral with regard to jurisdictional claims in published maps and institutional affiliations. |
© 2021 by the authors. Licensee MDPI, Basel, Switzerland. This article is an open access article distributed under the terms and conditions of the Creative Commons Attribution (CC BY) license (https://creativecommons.org/licenses/by/4.0/).
Share and Cite
Morgan, A.; Grigg, R.; Ampomah, W. A Gate-to-Gate Life Cycle Assessment for the CO2-EOR Operations at Farnsworth Unit (FWU). Energies 2021, 14, 2499. https://doi.org/10.3390/en14092499
Morgan A, Grigg R, Ampomah W. A Gate-to-Gate Life Cycle Assessment for the CO2-EOR Operations at Farnsworth Unit (FWU). Energies. 2021; 14(9):2499. https://doi.org/10.3390/en14092499
Chicago/Turabian StyleMorgan, Anthony, Reid Grigg, and William Ampomah. 2021. "A Gate-to-Gate Life Cycle Assessment for the CO2-EOR Operations at Farnsworth Unit (FWU)" Energies 14, no. 9: 2499. https://doi.org/10.3390/en14092499