Abstract
Cellulosic biorefineries have attracted interest due to the growing energy security and environmental concerns related to fossil fuel-based energy and chemicals. Using pelleted biomass as a biorefinery feedstock can reduce their processing inputs while improving biomass handling and transportation. However, it is still questionable whether energy and emission savings from feedstock transportation and processing can justify pelletization. A life cycle assessment approach was used to compare energy consumption and greenhouse gas (GHG) emissions from pelleted and non-pelleted corn stover as a biorefinery feedstock. Operations considered were pelleting, transportation, and soaking in aqueous ammonia (SAA) pretreatment. Despite greater GHG emissions (up to 25 times higher than the transportation) generated from the pelleting process, the model showed a significant opportunity to offset and even reduce overall GHG emissions considering the pretreatment process benefits. Our process energy analysis showed that SAA pretreatment of pelleted biomass required significantly lower energy inputs (56%) due to the lower-severity pretreatment’s effectiveness. Higher pretreatment solid loadings are allowed when pelleted biomass is used and this reduces the process chemicals and water requirements by 56% and 49%, respectively. This study demonstrated that the SAA pretreatment of pelleted biomass might be a feasible option as the cellulosic biorefinery feedstock.
1. Introduction
Biobased energy development has the potential to enhance energy independence, rural economic growth, and environmental benefits. However, the large quantities of low-density baled or loose biomass required to supply an industrial-scale cellulosic biorefinery can cause significant challenges for biomass transportation, handling, and storage. Despite the interest in uniform feedstock and better supply logistics, densified biomass has not widely been considered as feedstock for biorefineries. Previous studies [1,2] assume that feedstock’s densification costs primarily offset feedstock transportation cost savings. However, the interactions or trade-offs between densification and conversion processing within the system were overlooked. Recent studies reported process synergies between densification and pretreatment efficacy, suggesting that using pelleted biomass could lead to lower pretreatment costs [3,4].
Pretreatment, a crucial processing step in reducing the natural recalcitrance of biomass for biological processing, still poses a significant economic challenge due to the costs and environmental effects associated with severe pretreatment process conditions, including high temperature, time, and chemical inputs. Though pretreatment accounts for almost 20% to 30% of the total cost of biofuel production [5], very few studies have looked at the critical role of energy consumption during different pretreatment processes. Our previous study [3] reported that pelletizing corn stover could reduce pretreatment temperature, time, and ammonia concentrations for soaking in aqueous ammonia (SAA) pretreatment. Evaluating energy consumption reductions associated with such reduced severity pretreatments of densified biomass can provide a better understanding of the economic and environmental benefits of processing densified biomass.
Although several studies [3,4,6,7,8] reported higher hydrolysis yields due to pelleting, no studies have quantified pelleting impact on pretreatment in terms of energy and greenhouse gas (GHG) savings. This study aims to analyze the energy requirement and GHG emission trade-offs for the transportation and processing of pelleted and non-pelleted biomass in a cellulosic biorefinery using soaking in aqueous ammonia (SAA) pretreatment. Corn stover (Zea mays L.) is used as a model feedstock because it is considered a potential large-scale biorefinery feedstock in the US due to high corn production [9,10]. Documenting the process synergies of pelleted and non-pelleted forms of biomass will provide insights into improving system efficiency and reduce the environmental impact for an industrial-scale biorefinery.
2. Materials and Methods
A life cycle assessment (LCA) approach was used to assess the fossil energy input and GHG emission impacts of transporting and processing pelleted biomass compared to non-pelleted biomass delivered as bales following the ISO guide [11,12]. Inventory data were compiled from laboratory results, relevant literature, and Greenhouse Gases, Regulated Emissions, and Energy Use in Transportation (GREET) databases [13,14,15]. Life cycle energy inputs and GHG emissions were calculated in a Microsoft Excel spreadsheet.
2.1. The Goal, System Boundaries, and Functional Unit
This study investigates the energy inputs and GHG emissions for conducting a comparative LCA of using non-pelleted (base case scenario) and pelleted (densification scenario) forms of corn stover. The system boundaries include feedstock transportation, densification (as per scenario), and pretreatment to reach 90% theoretical glucose yields with enzymatic hydrolysis (Figure 1).
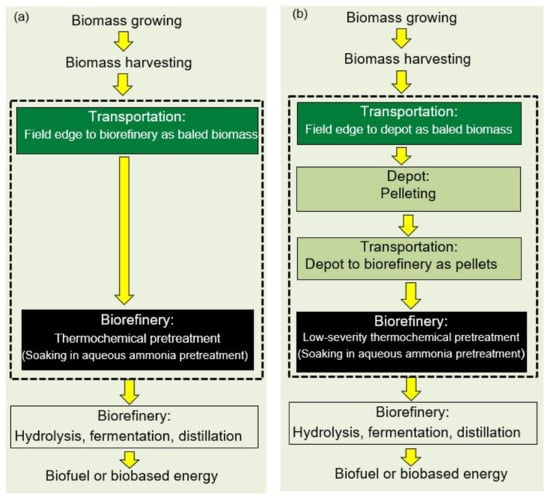
Figure 1.
Supply and processing systems for (a) base case scenario (non-pelleted biomass) and (b) densification scenario (pelleted biomass). Only the process stages in a dotted box were included in this study.
In both scenarios, biomass is ground with a hammer mill before pretreatment and subsequent enzymatic hydrolysis to produce fermentable sugars, which can be fermented to biofuel or other chemicals.
The boundary for the base case scenario (Figure 1a) includes transportation of baled biomass from the field edge to the biorefinery and pretreatment sufficient to reach 90% glucose yields. The system boundary for the densification scenario (Figure 1b) includes transportation of baled biomass to the nearest depot for pre-processing and pelleting, delivering the pelleted biomass to the biorefinery, and pretreatment to reach 90% glucose yields. Nahar and Pryor [3] modeled the hydrolysis yields of pelleted biomass as a function of pretreatment conditions and showed that the pelleted biomass can reduce the severity of SAA pretreatment while still producing glucose yields above 90%. Cellulase, β-glucosidase, and hemicellulase were assumed to be 15 FPU/g glucan, 15 CBU/g glucan, and 300 XU/g glucan, respectively, for enzymatic hydrolysis [3]. Because the amount of sugar generated from each feedstock is the same for both scenarios, results can be compared on a feedstock mass basis. Therefore, the functional unit of the assessment is considered as 1 Mg of biomass.
The primary goal of this study was to quantify differences in energy inputs and carbon emissions associated with transportation, densification, and biomass processing, using SAA as an example of pretreatment. Pretreatment is the most energy-intensive processing step, and primary processing varies based on feedstock form. A comparison of the different process conditions for the pretreatment of both non-pelleted and pelleted biomass was included in this study. Energy consumption and GHG emissions were accounted for within the system boundaries. Life cycle GHG emissions related to the transportation, pelleting, and pretreatment were calculated as kg of CO2 equivalent (CO2 eq)/Mg of delivered feedstock using the 100-year global warming potential (GWP). The term CO2eq is the sum of CO2, CH4, and N2O emissions weighted with the accepted global warming potential factors of 1, 25, and 298, respectively [14].
This study is a gate-to-gate study, where the model starts at the farm gate and ends at the end of the biomass pretreatment step. The feedstock production system was excluded from the system boundary in this study because the agricultural inputs are identical in both scenarios. Similarly, GHG fluxes associated with indirect land-use change (ILUC) impacts are not considered here as they will not affect the comparative LCA of our study because agricultural production and hydrolysis yields are assumed identical.
Impact categories included in this study were fossil energy and GHG emissions. Impacts were assessed for input diesel fuel and electricity production, as well as for pretreatment chemical inputs. Fossil energy and GHG emissions were collected from the GREET model developed by the Argonne National Laboratory [13,15] and are listed in Table 1. Embodied energy for the facility structure and equipment, including pellet mills, reactors, and transportation vehicles, was assumed to have a minor contribution over the project term and was ignored in this study.

Table 1.
Fossil energy and GHG emissions for different inputs from GREET [15].
2.2. Life Cycle Inventory (LCI)
Life cycle inventory data were collected from the GREET model developed by the Argonne National Laboratory [13], peer-reviewed literature, and laboratory experiments (Table 2). The data for pretreatment conditions required for 90% glucose yield production were taken from our laboratory studies. Process differences between feedstock forms (non-pelleted and pelleted) included feedstock transportation, densification, and pretreatment conditions.
Table 2.
Data required for the studied systems.
2.2.1. Feedstock Availability
Corn stover is one of the most abundant lignocellulosic resources available and is widely considered a primary feedstock for cellulosic biofuels [9,10]. Corn stover consists of the stalks, cobs, and husks, and leaves left in the field to dry following grain harvest. We assume that corn stover is field-dried to 15% moisture content (w.b.) when collecting bales from the field edge during transportation.
An annual biomass supply of 1,000,000 Mg/year (dry basis) was assumed for both scenarios. All assumptions made for corn stover availability and collection are given in Table 3. Supply radius for a biorefinery depends on corn stover availability, which depends on many factors including grain yield, stover to grain ratio, available stover collection fraction based on soil conservation requirements, percent of acreage growing corn, and the proportion of farmers participating. All of these factors may vary significantly across regions. We assumed that corn stover was uniformly distributed and collected from a circular area around the biorefinery. We also assumed that the biomass was uniformly distributed within the circular area. Based on the assumptions in Table 3, an 87 km (54 miles) radius is necessary to collect 1,000,000 Mg biomass for the base case. Collection area, transportation distance, and other aspects of each scenario were calculated based on the required supply of 1,000,000 Mg/year baled or pelleted corn stover delivered to a biorefinery.
Table 3.
Assumptions and calculated values used for a commercial-scale cellulosic biorefinery (1,000,000 Mg/year).
2.2.2. Transportation
Identifying the transportation distance is vital as biomass densification can significantly reduce the cost and energy associated with this step of the supply chain. Baled corn stover from the field edge is loaded on trucks and transported directly to the biorefinery in the base case scenario or to a processing depot for pelleting in the densification scenario.
For the base case scenario, a heavy-duty diesel truck with a capacity of 16 Mg [25] was assumed to deliver baled biomass from the field edge to the biorefinery. The average distance between the center of a circle and any other point within the circle is 2/3rd of the full radius [26]. Therefore, the average delivery distance (field edge to biorefinery) for all biomass within the collection area is 58 km (36 miles).
In the densification scenario, most corn stover is assumed to be transported from field edge to a pelleting depot within a 16 km (10 miles) draw radius as baled biomass and then from pelleting depot to biorefinery as pelleted biomass. The biomass produced within 22 km of the biorefinery (7% of total biomass) was assumed to be delivered directly to the biorefinery as bales, where biomass can be pelleted on-site before pretreatment. Pellet mills are distributed at distances of 38 km and 70 km from the biorefinery, resulting in two collection rings around the biorefinery (Figure 2). The stover produced farther than 22 km from the biorefinery (93% of total biomass) was only transported for an average of 10 km from the field edge to the pelleting depot as bales. The stover transported in pelleted form from the pellet mill to the biorefinery is thus either 38 km (33% of total biomass) or 70 km (60% of total biomass) (Figure 2). The first set of 10 pellet mills was assumed to be located 38 km away from the biorefinery to collect all biomass produced between 22 and 54 km away from the biorefinery (Figure 2). The second set of 19 pellet mills was located 70 km away from the biorefinery to collect biomass between 54 and 87 km (Figure 2). Each pelleting depot would have a capacity of 34,000 Mg/year (Table 4). The pelleting depot size would need to process biomass at 4.1 Mg/h, assuming 24-h pelleting operation on 350 days a year.
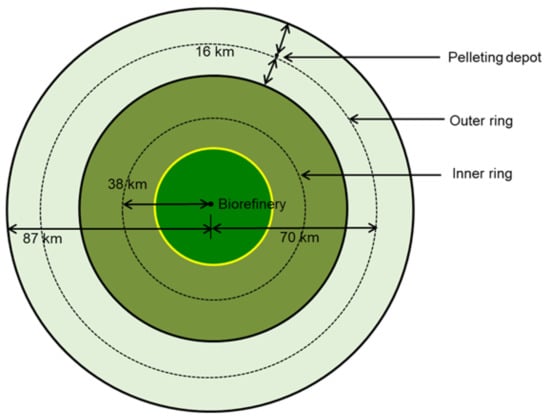
Figure 2.
Schematic of pelleting depot and transportation in densification scenario (not to scale). Dotted lines represent the location of the pelleting depot, and solid lines represent the boundary for corn stover collection.
Table 4.
Life cycle analysis (LCA) system assumptions for transportation.
In the densification scenario, pelleted biomass was assumed to be transported to the biorefinery via a heavy-duty diesel truck with a capacity of 27.3 Mg as used for corn grain [18]. A tortuosity factor of 1.3 was used for both scenarios to account for nonlinear paths from the depot to the biorefinery [19,20]. The average fuel efficiency of 2.76 km/L was considered in this study, which was the average of high and low efficiency (3.4 km/L and 2.13 km/L) of commercial semi-trucks, assuming low efficiency when the truck is loaded and high efficiency on the empty return trip [18]. The assumptions made for transportation are listed in Table 4.
2.2.3. Pelletization
Pellet production includes a combination of sequential operations: grinding, pelleting, cooling, and screening. Dried corn stover (15% moisture) is milled in a hammer mill (6-mm screen) before feeding to the pellet mill. The ground feedstock is then fed into a pelleting chamber, where additional grinding occurs, and rollers force the material through holes on the inside face of a 6.3 mm die. High pressures and temperatures generated in the pellet mill soften lignin and bind the biomass particles together to make uniform and durable pellets. Finally, the pellets are cooled before further handling and transportation.
The biomass pelleting requires electricity for milling, pelleting, cooling, and screening. Pelleting process energy was taken from Sokhansanj and Fenton [1] and only included energy for the pellet mill, cooling, and screening. Drying and grinding were not modeled in the pellet production process for two reasons: i) stover was assumed to be field-dried to a moisture content of 15% (w.b.) for both scenarios, and ii) biomass grinding using a hammer mill with a 6-mm screen was assumed to be required before pelleting in the densification scenario or as the first step of bale processing at the biorefinery in the base case scenario.
The pelleting process requires only energy (electricity) and corn stover as inputs and produces pellets as the single output. Small amounts of liquid water or steam are sometimes added to improve the pelleting process, but this input was not included in this study. Pelletization does not create any solid waste stream. All residues from the process are recycled, and airborne particulate emissions (dust) were assumed to be insignificant and not included in the analysis.
2.2.4. Pretreatment
In soaking in aqueous ammonia (SAA) pretreatment, biomass is submerged in a diluted ammonia solution for hours at a relatively low temperature. Our previous study [3] quantified the pretreatment parameters (solid pretreatment loadings, temperature, time, and ammonia concentration) required to reach 90% glucose yields at 24 h of enzymatic hydrolysis for pelleted biomass. Pretreatment parameters to achieve 90% glucose yields at 24 h for non-pelleted biomass were taken from preliminary lab experiments. Preliminary study tested the SAA pretreatment efficacy of non-pelleted loose stover at 40, 50, and 60 °C for 24 h with 15% ammonia and found that 90% yield was only achieved with the SAA pretreatment at 60 °C for 24 h. The enzymes cellulase, β-glucosidase, and hemicellulase were added at 15 FPU/g glucan, 15 CBU/g glucan, and 300 XU/g glucan, respectively, for both non-pelleted and pelleted biomass. The pretreatment parameters for the base case and densification scenarios are listed in Table 5.
Table 5.
Soaking aqueous ammonia (SAA) pretreatment parameters for the base case and densification scenarios.
Soaking in aqueous ammonia pretreatment requires a simple reactor configuration for holding the biomass slurry at a moderate temperature. A cylindrical steel reactor (Table 6), as described for hydrolysis by Humbird et al. [19], was assumed as an SAA pretreatment reactor in this study.
Table 6.
Soaking aqueous ammonia (SAA) pretreatment reactor specifications (adapted from Humbird et al. [19]).
Biomass is first mixed with aqueous ammonia to obtain 10% solid loading for non-pelleted biomass and 20% solid loading for pelleted biomass [3]. The mixture is heated with steam to the desired pretreatment time and temperature, as outlined in Table 5. Once the pretreatment is completed, pretreated biomass is discharged into a flash tank for cooling and neutralization with sulfuric acid. After neutralizing, the mixture is transferred to another reactor for enzymatic hydrolysis. The intermediate time for reactor set-up was assumed to be 4 h for both scenarios.
The energy requirement for pretreatment is assumed to be supplied from steam generated by burning biomass lignin residue. Energy from lignin combustion exceeding heating needs would be used to produce electricity. Pretreatment energy requirements were calculated using the energy necessary to increase the temperature from 25 °C to the assumed pretreatment temperature and the energy required to maintain this temperature throughout pretreatment based on reactor contents, geometry, and insulation [27].
The supply of steam to the pretreatment reactor to reach the desired temperature with non-pelleted or pelleted corn stover was calculated using Equation (1):
where Q1 is the energy to increase the pretreatment temperature in MJ/Mg; m is the mass of the reactor contents in kg; Cp is the specific heat capacity for the ammonia [28] and biomass [29] mixture in KJ/(kgK); ∆T is the pretreatment temperature increase depending on the biomass forms in °C (environmental temperature was set at 25 °C).
For the pretreatment reactor, the assumption was that heating to maintain the temperature is equal to heat loss during the process. Heat loss was considered constant through the sidewall and the top and bottom of the cylindrical reactor. The total heat necessary to maintain the temperature during the pretreatment process was calculated considering the pretreatment residence time using Equation (2).
where Q2 is the energy to maintain the pretreatment temperature, MJ/Mg; U is the overall heat transfer coefficient for the insulated reactor in W/(m2K); A is the area of the reactor in m2; ∆T is the pretreatment temperature increase depending on the biomass forms in °C; t is the pretreatment time (h), 24 h (base case scenario) and 4 h (densification scenario).
Overall heat transfer coefficient calculation included conduction for stainless steel reactor, conduction for insulation, and convection of outside of the reactor. However, convective heat transfer inside the reactor was not included. The overall heat transfer coefficient for the cylindrical wall and the top and bottom of the reactor was calculated using Equation (3):
where U is the overall heat transfer coefficient in W/(m2K); r1 is the inside radius of the reactor in m (2.9 m); r2 is the outside radius of the reactor in m (2.906 m); r3 is the outside radius of the reactor with insulation in m (2.956 m); k1 is the thermal conductivity of stainless steel in W/(m.K) (16 W/(m.K) [30]); k2 is the thermal conductivity of glass wool in W/(m.K) (0.038 W/(m.K) [31]); L is the reactor height in m (36.57 m); h is the convective heat transfer coefficient of the outside insulation surface in W/m2K (50 W/(m2K) [29]).
3. Results and Discussion
3.1. Energy and Chemical Requirements
Energy consumption for pelleting and transportation for the base case and densification scenarios is shown in Table 7. Although bale transportation requires 34% more energy than pellet transportation, energy inputs for the pelleting process were 3.5 times more than the energy needed for transporting bales. However, the amount of energy used to produce pellets is only 3% of the biomass’s total energy content (17,000 MJ/Mg [32]). Electricity is the primary energy source for the pellet mill. The pelleting energy inputs were taken from Sokhansanj and Fenton [1], as detailed pelleting unit processes and corresponding energy requirements were specified in this study. A pelleting energy requirement of 287 MJ/Mg was assumed, in the form of electricity, which included energy consumption for the pellet mill, in addition to cooling and screening [1]. Drying and grinding energy requirements were not included in the total pelleting process energy as biomass was assumed to be field-dried, and the grinding energy would be the same for both scenarios.
Table 7.
Energy required for the base case and densification scenarios within the system boundary.
Although trucks can carry 70% more biomass as pellets than in bale form, the transportation energy requirement is only 25% less for pelleted biomass. Total trucking distance for transporting 1,000,000 Mg of biomass in the base case scenario (4,714,916 km/year, one way) is 75% higher than for the densification scenario; lower trucking capacity for baled biomass leads to a higher number of trips to transport the same total mass. Transportation energy saving in the densification scenario is moderated because biomass still needs to be transported in bale form to the pellet mill before the transportation efficiencies can be realized. Truck transportation was considered because it is used almost exclusively for biomass transportation in North America. However, dependence on truck delivery may be challenging for a large-scale biorefinery due to the higher transportation costs and traffic congestion [33,34].
Pretreatment input parameters (temperature, time, and ammonia concentration) required to achieve 90% of theoretical glucose yields for the densification scenario were assumed to be lower than for the base case scenario (Table 5) based on the previous study [3]. Additionally, total pretreatment solid loading was twice as high for pelleted biomass in the densification scenario than for non-pelleted biomass in the base case (Table 5). Higher solid loading resulted in pretreating 87% more pelleted biomass in the same-sized reactor. Assuming a biorefinery with 350 operating days per year and a 4 h interval for reactor unloading and loading, only nine pretreatment reactors would be needed to pretreat 1,000,000 Mg of pelleted biomass. Pretreating this amount of non-pelleted biomass at the given solid loading and with the same reactor downtime would require 59 reactors of the same size. From a processor’s perspective, the considerable number of pretreatment reactors necessary for processing non-pelleted biomass is non-economical and unrealistic.
The doubling of the solid loading enabled by the use of biomass pellets not only significantly lowers the heating energy needs and the number of required reactors but substantially reduces the energy needs and GHG emissions associated with pretreatment chemical use (Figure 3). Similarly, the gross water requirement for pretreating pelleted biomass is reduced by 49% compared with what would be needed for non-pelleted biomass. Requirements for ammonium hydroxide, the main chemical for SAA pretreatment, are reduced by 60% when pretreating pelleted biomass, while the sulfuric acid for neutralization is reduced by 37%.
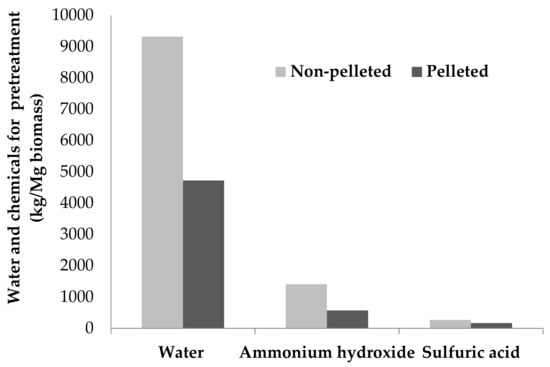
Figure 3.
Required chemicals (kg/Mg biomass) for pretreatment of non-pelleted and pelleted biomass.
The analysis of total energy required for heating the pretreatment reactor shows that the energy needed for the initial temperature increase was 98% or higher of total heating energy for pretreating either form of biomass (Figure 4). The heating energy required for pretreatment for combining increasing and maintaining the reactor temperature was 1681 MJ/Mg for non-pelleted biomass, comparable with the NREL-reported energy of around 1692 MJ/Mg for loose corn stover pretreatment.
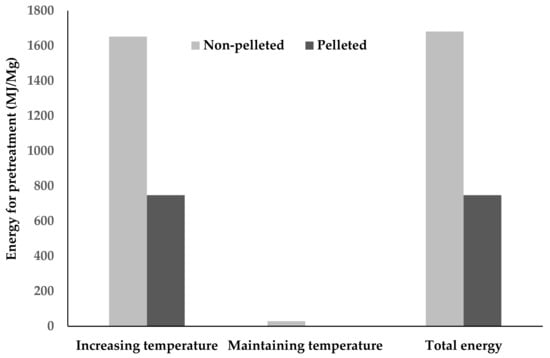
Figure 4.
The energy required for pretreatment of non-pelleted and pelleted corn stover.
Models showed that by increasing solid loadings from 10% to 20% and reducing pretreatment time from 24 h to 4 h in the densification scenario for pelleted biomass, the overall pretreatment heating energy requirements were reduced by around 56% compared with the base case of using non-pelleted biomass (Figure 4).
In cellulosic biorefinery models, lignin residue is assumed to generate sufficient steam and electricity for all on-site energy needs [19]. The energy content of corn stover is around 17,000 MJ/Mg [32], and we assume that roughly 30% of this energy (5000 MJ/Mg) would remain in lignin and other solid residues such as undigested cellulose, hemicellulose, protein, etc., to generate steam and electricity. The modeled pretreatment energy requirement for SAA pretreatment of pelleted biomass required significantly less heating energy (748 MJ/Mg) than non-pelleted biomass in the base case scenario (1681 MJ/Mg). Steam and heat produced from combusting lignin residues from pelleted biomass in the densification scenario should be sufficient to cover pretreatment reactor heating and probably other heating needs in downstream processing. The lower energy requirement and fewer required pretreatment reactors both indicate that SAA pretreatment of pelleted biomass may be a feasible option. However, the amount of ammonia recovered and recycled through the system will affect GHG emissions, economics, and, thus, the overall process feasibility. Information on ammonia recovery from SAA has not been reported in the literature, although recovery of up to 93% of liquid ammonia (NH3) from AFEX pretreatment has been suggested by Tao et al. [35]. However, processes and equipment required to recover pretreatment chemicals will also contribute to the overall pretreatment system energy and capital costs [35].
3.2. Greenhouse Gas Emissions
The GHG emissions data considered in this study were those associated with pelletization (electricity), transportation (diesel fuel), and pretreatment inputs (chemicals). Because electricity is the primary energy source for pelleting, the source of the fuel used for electricity generation is essential in determining the environmental impacts of these processes. Electricity inputs for this study were taken from GREET [15], as outlined in Table 1. Electricity production in GREET identified the primary electricity generation sources such as natural gas (40%), renewable energy (21%), nuclear (19%), and coal (19%) on average in the US. As the primary fuel sources for electricity generation in the US were fossil fuels (59%), these inputs significantly influence GHG emissions. Total GHG emissions for pellet production in this study were 34 kg CO2eq/Mg biomass (Table 8).
Table 8.
Greenhouse gas (GHG) emissions for non-pelleted and pelleted corn stover.
The emissions from transportation fuel consumption are significantly lower (25%) for pelleted biomass than non-pelleted biomass due to fewer truck trips necessary for pellet transportation in the densification scenario (Table 8). This correlates directly with transportation energy reductions. However, Table 8 shows that the transportation-related GHG emissions for both scenarios are a minor component compared to the emissions associated with other processing steps within the system boundaries. This result agrees with Daystar et al. [36], who also found transportation to be a minor contributor (~1.4%) in the overall GHG emissions.
Greenhouse gas emissions from pelleting were 18 to 24 times higher than the emissions from transporting biomass. Relative to pelletizing and transportation steps, significantly more emissions were associated with pretreatment chemical production (Table 8). Emissions from chemical production were 52 times and 21 times higher than emissions from pelleting in the base case and densification scenario, respectively. However, recycling and reuse of chemicals were not accounted for in this estimation. The higher magnitude of GHG emissions related to chemical production shows the importance of recycling and reuse of ammonia for SAA pretreatment. Pretreatment heating energy is not included because we assume that energy would come from lignin residues rather than an external energy source.
3.3. Interpretation
One of the primary goals of the current renewable energy policy is the reduction of GHG emissions. Previous research using SAA pretreatment for cellulosic biomass showed high yields with this pretreatment [3,37,38,39]. Other aspects of the practical feasibility of SAA and many different experimental pretreatments have not been considered extensively. The selection of the appropriate pretreatment techniques for a biorefinery not only depends on yields but also economic feasibility and environmental indicators. In this aspect, pelleted biomass shows more realistic potential as a biorefinery feedstock. In particular, the higher solid loadings and significantly lower pretreatment residence times that are only possible with pelleted biomass make SAA pretreatment a feasible option.
The results of this study emphasize the importance of reducing pretreatment residence times for SAA and other pretreatments. If pretreatment residence time could be reduced from 24 h to 4 h for non-pelleted corn stover, total pretreatment heating energy would be reduced by 56%. Lowering the pretreatment temperature from 60 °C to 56 °C, as used for pelleted biomass, would only reduce energy needs by 12%. However, further reductions are still possible by varying temperature, residence time, and ammonia concentrations while maintaining pretreatment effectiveness. The pretreatment energy and emissions are much lower with the conditions tested using pelleted biomass, but these are not the only conditions possible. Conversely, additional benefits could be gained for pelleted biomass by increasing the temperature beyond 60 °C while reducing pretreatment residence time. Pretreatment residence time had the most substantial influence on energy requirements; hence, pretreating at a higher temperature might allow lowering the pretreatment residence time well below the 4 h modeled here, which would further reduce both the number of required reactors and the pretreatment energy requirements.
There are no other publications that have conducted an LCA using SAA or different alkaline pretreatments with pelleted biomass. Kumar and Murthy [40] conducted a comparative LCA of dilute acid, steam explosion, hot water, and alkali pretreatment. Their study showed that alkali pretreatment had the highest fossil energy use and GHG emissions. Their study simulated alkali (NaOH) pretreatment at an operating temperature of 180 °C with 15-min residence time, whereas the base case scenario in this study considered pretreatment at 60 °C for 24 h. Mahmud and Rosentrater [41] compared low-moisture anhydrous ammonia (LMAA), autohydrolysis, soaking in aqueous ammonia (SAA), and soaking in sodium hydroxide (NaOH) pretreatments for making biobutanol from lignocellulosic feedstock. They reported that SAA pretreatment demonstrated lower GHG emissions than autohydrolysis but higher emissions than LMAA and soaking in sodium hydroxide. Variation in process technologies, system boundaries, and functional units between studies makes the comparison of life cycle studies challenging. For example, system boundaries for ethanol production in Kumar and Murthy [40] included biomass pre-processing, alkali pretreatment, simultaneous saccharification and co-fermentation, and ethanol recovery. However, they did not identify fossil energy use for individual processing steps. Therefore, it is difficult to determine what percentage of total energy was explicitly used for the pretreatment. Several assumptions were made for estimating pretreatment energy in this study using the same functional unit (MJ/MJ): 36% glucan content in biomass, 90% hydrolysis efficiency, 95% fermentation efficiency for glucose. Our study’s pretreatment heating energy requirement for non-pelleted and pelleted biomass was 0.38 MJ/ MJ and 0.17 MJ/MJ, respectively.
Life cycle assessments of cellulosic biorefineries based on actual process data are not available since industrial-scale biorefineries have not been established yet. The literature on pretreatment technologies consists mainly of lab-scale experiments and techno-economic models. Although techno-economic models provide valuable information, these are also based on a wide variety of assumptions. Currently, NREL’s model is the most widely used techno-economic model [19] to predict cellulosic ethanol’s performance based on dilute acid (DA) pretreatment. Differences between DA and SAA pretreatment processes will strongly influence the overall cost. Lower-severity SAA pretreatment requires less costly pretreatment reactor materials than DA reactors. However, lower SAA pretreatment temperatures require longer residence times than higher-temperature pretreatments, which will increase the required reactor volume and energy requirements. Inhibitory product separation with DA pretreatment also needs to be accounted for in cost comparison between DA and SAA pretreatments. Therefore, a comparative LCA along with techno-economic analysis for different types of pretreatment with densified and non-densified biomass would provide valuable insights into the potential environmental and economic performance of cellulosic biorefineries.
4. Conclusions
This study shows remarkable differences in fossil energy requirements, GHG emissions, and water and chemical use for SAA pretreatment of pelleted and non-pelleted biomass. Soaking in aqueous ammonia pretreatment appears unrealistic for non-pelleted biomass but potentially feasible with biomass pellets despite high energy requirements in the pelleting process. Energy inputs and total reactor volume for SAA pretreatment of non-pelleted biomass are the most significant problem areas. The majority of system-wide energy reductions from processing pelleted biomass are due to lower pretreatment severity, precise temperature, time, and higher pretreatment solid loadings. Higher pretreatment solid loadings for pelleted biomass not only reduce the amount of chemicals, water, and energy inputs for the pretreatment, but the required pretreatment reactor volume is reduced by 85%. The use of pelleted biomass may allow effective, but otherwise unrealistic, pretreatment technologies to be realistically considered for a cellulosic biorefinery.
Author Contributions
Conceptualization, N.N. and S.W.P.; methodology, N.N.; software, N.N. and D.R.; formal analysis, N.N., R.P.; investigation, N.N.; resources, S.W.P., D.R. and G.P.; writing—original draft preparation, N.N.; writing—review and editing, N.N., S.W.P., D.R., G.P., R.P.; visualization, N.N.; supervision, S.W.P.; project administration, S.W.P.; funding acquisition, S.W.P. All authors have read and agreed to the published version of the manuscript.
Funding
This work was partially supported by the USDA National Institute of Food and Agriculture Hatch project ND01476.
Data Availability Statement
The raw data presented in this study are available upon request.
Acknowledgments
The authors would like to thank Novozymes, Inc. for providing enzymes. The authors also would like to thank Igathinathane Cannayen (North Dakota State University) for making the corn stover pellets.
Conflicts of Interest
The authors declare no conflict of interest. The funders had no role in the design of the study; in the collection, analyses, or interpretation of data; in the writing of the manuscript, or in the decision to publish the results.
References
- Sokhansanj, S.; Fenton, J. Cost Benefit of Biomass Supply and Pre-Processing; Research Integration Program Reports; The BIOCAP Canada Foundation: Kingston, ON, Canada, 2006; 33p. [Google Scholar]
- Sultana, A.; Kumar, A.; Harfield, D. Development of agri-pellet production cost and optimum size. Bioresour. Technol. 2010, 101, 5609–5621. [Google Scholar] [CrossRef] [PubMed]
- Nahar, N.; Pryor, S.W. Effects of reduced severity ammonia pretreatment on pelleted corn stover. Ind. Crop. Prod. 2017, 109, 163–172. [Google Scholar] [CrossRef]
- Nahar, N.; Pryor, S.W. Reduced pretreatment severity and enzyme loading enabled through switchgrass pelleting. Biomass Bioenergy 2014, 67, 46–52. [Google Scholar] [CrossRef]
- Yang, B.; Wyman, C.E. Pretreatment: The key to unlocking low-cost cellulosic ethanol. Biofuels Bioprod. Biorefin. 2008, 2, 26–40. [Google Scholar] [CrossRef]
- Guragain, Y.N.; Wilson, J.; Staggenborg, S.; McKinney, L.; Wang, D.; Vadlani, P.V. Evaluation of pelleting as a pre-processing step for effective biomass deconstruction and fermentation. Biochem. Eng. J. 2013, 77, 198–207. [Google Scholar] [CrossRef]
- Li, Y.; Li, X.; Shen, F.; Wang, Z.; Yang, G.; Lin, L.; Zhang, Y.; Zeng, Y.; Deng, S. Responses of biomass briquetting and pelleting to water-involved pretreatments and subsequent enzymatic hydrolysis. Bioresour. Technol. 2014, 151, 54–62. [Google Scholar] [CrossRef] [PubMed]
- Rijal, B.; Igathinathane, C.; Karki, B.; Yu, M.; Pryor, S.W.; Cannayen, I. Combined effect of pelleting and pretreatment on enzymatic hydrolysis of switchgrass. Bioresour. Technol. 2012, 116, 36–41. [Google Scholar] [CrossRef]
- Aden, A.; Ruth, M.; Ibsen, K.; Jechura, J.; Neeves, K.; Sheehan, J.; Wallace, B. Lignocellulosic Biomass to Ethanol Process Design and Economics Utilization Co-Current Dilute Acid Prehydrolysis and Enzymatic Hydrolysis for Corn Stover; NREL Report TP-510; National Renewable Energy Laboratory: Golden, CO, USA, 2002.
- Perlack, R.D.; Wright, L.L.; Turhollow, A.F.; Graham, R.L.; Stokes, B.J.; Erbach, D.C. Biomass as Feedstock for a Bioenergy and Bioproducts Industry: The Technical Feasibility of a Billion-Ton Annual Supply; Oak Ridge National Laboratory: Oak Ridge, TN, USA, 2005.
- ISO. ISO 14040: Environmental Management—Life Cycle Assessment—Principles and Framework; International Organisation for Standardisation: Geneva, Switzerland, 2006. [Google Scholar]
- ISO. ISO 14044, Environmental Management—Life Cycle Assessment—Requirements and Guidelines; ISO: Geneva, Switzerland, 2006. [Google Scholar]
- GREET. The Greenhouse Gases, Regulated Emissions, and Energy Use in Transportation; Model v1.3.0; Argonne National Laboratory: Argonne, IL, USA, 2016.
- IPCC. IPCC Guidelines for National Greenhouse Gas Inventories; Houghton, J.T., Filho, L.G.M., Lim, B., Treanton, K., Mamaty, I., Bonduki, Y., Griggs, D.J., Callender, B.A., Eds.; IGES: Hayama, Japan, 2006. [Google Scholar]
- Wang, M.; Elgowainy, A.; Lee, U.; Bafana, A.; Benavides, P.; Burnham, A.; Cai, H.; Dai, Q.; Gracida-Alvarez, U.R.; Hawkins, T.; et al. Summary of Expansions and Updates in GREET®2020; Argonne National Lab. (ANL): Argonne, IL, USA, 2020. [CrossRef]
- Ebadian, M.; Sokhansanj, S.; Webb, E. Estimating the required logistical resources to support the development of a sustainable corn stover economy in the USA. Biofuels Bioprod. Biorefin. 2017, 11, 129–149. [Google Scholar] [CrossRef]
- Perlack, R.; Turhollow, A. Feedstock cost analysis of corn stover residues for further processing. Energy 2003, 28, 1395–1403. [Google Scholar] [CrossRef]
- Wilson, J.M.; McKinney, L.J.; Theerarattananoon, K.; Ballard, T.C.; Wang, D.; Staggenborg, S.A.; Vadlani, P.V. Energy and cost for pelleting and transportation of select cellulosic biomass feedstocks for ethanol production. Appl. Eng. Agric. 2014, 30, 77–85. [Google Scholar]
- Humbird, D.; Davis, R.; Tao, L.; Kinchin, C.; Hsu, D.; Aden, A.; Schoen, P.; Lukas, J.; Olthof, B.; Worley, M.; et al. Process Design and Economics for Biochemical Conversion of Lignocellulosic Biomass to Ethanol: Dilute-Acid Pretreatment and Enzymatic Hydrolysis of Corn Stover; NREL/TP-5100-47764; National Renewable Energy Laboratory: Golden, CO, USA, 2011.
- Perlack, R.D.; Turhollow, A.F. Assessment of Options for the Collection, Handling, and Transport of Corn Stover; Report No. ORNL/TM-2002/44; Oak Ridge National Laboratory: Oak Ridge, TN, USA, 2002.
- Wu, M.; Wang, M.; Huo, H. Fuel-Cycle Assessment of Selected Bioethanol Production Pathways in the United States; ANL/ESD/ 06-7; Argonne National Laboratory: Argonne, IL, USA, 2006.
- Wu, M.; Wu, Y.; Wang, M. Energy and Emission Benefits of Alternative Transportation Liquid Fuels Derived from Switchgrass: A Fuel Life Cycle Assessment. Biotechnol. Prog. 2006, 22, 1012–1024. [Google Scholar] [CrossRef]
- USDA (United States Department of Agriculture). Crop Production; National Agricultural Statistics Service (NASS), Agricultural Statistics Board, USDA: Washington, DC, USA, 2017.
- Rosburg, A.; McFadden, J.; Miranowski, J. Managing Feedstock Supply Risk for the Development of a US Stover Biofuel Industry. Bioenergy Res. 2017, 10, 671–687. [Google Scholar] [CrossRef]
- Krishnakumar, P.; Ileleji, K.E. A Comparative Analysis of the Economics and Logistical Requirements of Different Biomass Feedstock Types and Forms for Ethanol Production. Appl. Eng. Agric. 2010, 26, 899–907. [Google Scholar] [CrossRef]
- Morey, R.V.; Kaliyan, N.; Tiffany, D.G.; Schmidt, D.R. A Corn Stover Supply Logistics System. Appl. Eng. Agric. 2010, 26, 455–461. [Google Scholar] [CrossRef]
- Holman, J.P. Heat Transfer, 7th ed.; Mc.Graw-Hill: Singapore, 1992; 712p. [Google Scholar]
- Engineering Toolbox, Liquids, and Fluids—Specific Heats. 2013. Available online: http://www.engineeringtoolbox.com/specific-heatfluids-d_151.html (accessed on 5 November 2020).
- Mafe, O.A.; Davies, S.M.; Hancock, J.; Du, C. Development of an estimation model for the evaluation of the energy requirement of dilute acid pretreatments of biomass. Biomass Bioenergy 2015, 72, 28–38. [Google Scholar] [CrossRef]
- Engineering Toolbox, Overall Heat Transfer Coefficient. Thermal Conductivity of Common Materials and Gases. Available online: https://www.engineeringtoolbox.com/overall-heat-transfer-coefficient-d_434.html (accessed on 10 June 2020).
- Woiciechowski, A.L.; Nitsche, S.; Pandey, A.; Soccol, C.R. Acid and enzymatic hydrolysis to recover reducing sugars from cassava bagasse: An economic study. Braz. Arch. Biol. Technol. 2002, 45, 393–400. [Google Scholar] [CrossRef]
- Sokhansanj, S.; Mani, S.; Tagore, S.; Turhollow, A. Techno-economic analysis of using corn stover to supply heat and power to a corn ethanol plant—Part 1: Cost of feedstock supply logistics. Biomass Bioenergy 2010, 34, 75–81. [Google Scholar] [CrossRef]
- Kumar, A.; Cameron, J.B.; Flynn, P.C. Pipeline transport and simultaneous saccharification of corn stover. Bioresour. Technol. 2005, 96, 819–829. [Google Scholar] [CrossRef] [PubMed]
- Kumar, A.; Cameron, J.B.; Flynn, P.C. Large-Scale Ethanol Fermentation Through Pipeline Delivery of Biomass. Appl. Biochem. Biotechnol. 2005, 121, 0047–0058. [Google Scholar] [CrossRef]
- Tao, L.; Aden, A.; Elander, R.T.; Pallapolu, V.R.; Lee, Y.; Garlock, R.J.; Balan, V.; Dale, B.E.; Kim, Y.; Mosier, N.S.; et al. Process and technoeconomic analysis of leading pretreatment technologies for lignocellulosic ethanol production using switchgrass. Bioresour. Technol. 2011, 102, 11105–11114. [Google Scholar] [CrossRef]
- Daystar, J.; Gonzalez, R.; Reeb, C.; Venditti, R.A.; Treasure, T.; Abt, R.; Kelley, S. Economics, Environmental Impacts, and Supply Chain Analysis of Cellulosic Biomass for Biofuels in the Southern US: Pine, Eucalyptus, Unmanaged Hardwoods, Forest Residues, Switchgrass, and Sweet Sorghum. BioResources 2013, 9, 393–444. [Google Scholar] [CrossRef][Green Version]
- Kim, T.H.; Lee, Y.Y. Pretreatment of corn stover by soaking in aqueous ammonia. Appl. Biochem. Biotechnol. 2005, 121, 1119–1131. [Google Scholar] [CrossRef]
- Kim, T.H.; Lee, Y.Y. Pretreatment of corn stover by soaking in aqueous ammonia at moderate temperatures. Appl. Biochem. Biotechnol. 2007, 137, 81–92. [Google Scholar] [PubMed]
- Ko, J.K.; Bak, J.S.; Jung, M.W.; Lee, H.J.; Choi, I.-G.; Kim, T.H.; Kim, K.H. Ethanol production from rice straw using optimized aqueous-ammonia soaking pretreatment and simultaneous saccharification and fermentation processes. Bioresour. Technol. 2009, 100, 4374–4380. [Google Scholar] [CrossRef]
- Kumar, D.; Murthy, G.S. Life cycle assessment of energy and GHG emissions during ethanol production from grass straws using various pretreatment processes. Int. J. Life Cycle Assess. 2012, 17, 388–401. [Google Scholar] [CrossRef]
- Mahmud, N.; Rosentrater, K.A. Life-Cycle Assessment (LCA) of Different Pretreatment and Product Separation Technologies for Butanol Bioprocessing from Oil Palm Frond. Energies 2019, 13, 155. [Google Scholar] [CrossRef]


Publisher’s Note: MDPI stays neutral with regard to jurisdictional claims in published maps and institutional affiliations. |
© 2021 by the authors. Licensee MDPI, Basel, Switzerland. This article is an open access article distributed under the terms and conditions of the Creative Commons Attribution (CC BY) license (https://creativecommons.org/licenses/by/4.0/).