Article

A New Approach of Dedusting for IGCC by a Two-Stage Moving Granular Bed Filter

1
Department of Mechanical Engineering, National Central University, Zhongli District, Taoyuan City 320317, Taiwan
2
Department of Mechanical Engineering, Oriental Institute of Technology, Banciao District, New Taipei City 22061, Taiwan
3
Graduate Institute of Energy Engineering, National Central University, Zhongli District, Taoyuan City 320317, Taiwan
*
Author to whom correspondence should be addressed.
Energies 2021, 14(9), 2534; https://doi.org/10.3390/en14092534
Submission received: 18 March 2021 / Revised: 24 April 2021 / Accepted: 26 April 2021 / Published: 28 April 2021
(This article belongs to the Section B: Energy and Environment)

Abstract

:
We propose a dust removal technology in which a two-stage moving granular bed filter was employed using coarse and fine filtering granules. The pressure drop, collection efficiency, and dust particulate size distributions were investigated using various mass flow rates for coarse and fine granules at room temperature. In addition, the ratio of mass consumption was used to reveal the actual mass flow. The ratio of mass consumption influenced the pressure drop, collection efficiency, and dust particulate size distributions. Particulates larger than 1.775 μm were removed by the filter. Our results showed that a mass flow of 330 g/min for coarse granules and a mass flow of 1100 g/min for fine granules provided optimal collection efficiency and particulate size distribution. The proposed design can aid the development of high-temperature systems in power plants.

1. Introduction

Coal is a general fossil fuel used in steel and power plants and industrial facilities due to its abundance, requiring a low capital investment. However, greenhouse gas emissions generated from the combustion of coal have harmful effects on human life and the environment. The International Agency for Research on Cancer of the World Health Organization announced that particulate matter in coal combustion residuals is carcinogenic [1]. To mitigate the effects of coal on human health and protect the environment, coal-cleaning technologies have attracted attention to protect the environment [2]. Pressurized fluidized bed combustion (PFBC) and integrated gasification combined cycle (IGCC) systems are the most promising coal-cleaning technologies for coal gasification [3,4,5,6,7]. However, synthesis gases generated by PFBC and IGCC emit particulate matter, such as sulfur oxides (SOX) and nitrogen oxides (NOX), which are released by gasification processes. These emissions damage downstream gas turbines and pollute the environment.
Ceramic barrier filters are among the well-known technologies for protecting the environment by removing particulates. However, economic concerns, discontinuous operation, and thermal fracture mechanisms have been reported for ceramic filters [8,9]. Compared to ceramic filters, granular bed filters (GBFs) are more advantageous, offering cheaper filter granules, continuous operation, and functionality under low-pressure conditions [10]. Therefore, GBFs are used in hot gas cleaning applications.
Previous studies [8,11,12,13] involved experimental and simulation results regarding the collection efficiency, pressure drop, surface velocity of the filtering granule free surface, mass flow rates of filtering granules, and filter bed depth of GBFs involving mono-sized filtering granules. However, mono-sized filtering granules fall short of providing sufficient collection efficiency. Decreasing the size of the filtering granules can thus appropriately increase the pressure drop and collection efficiency. Thus, two-stage or multi-stage filters have been developed [14,15], especially for water treatment systems using ultrafine particles [16,17]. By using different granule sizes in the same filtering system, better filtering efficiency and flow behavior were observed in comparison with using mono-sized granules. In addition, the collection efficiency was improved, and pressure drops were reduced [18]. With the powder–grain level, the combined dual-layer GBF demonstrated better collection efficiency (99.835%) than those of individual layers (96.240% and 89.905%) [19]. Based on the vertical configuration of dual-layer GBFs, the collection efficiency was 1.3 times better than that of single-layer GBFs with particulate diameters of 1–10 μm [20]. These studies [14,15,16,17,18,19,20] showed that two-stage or multi-stage filters improve collection efficiency, increase dust loading, and offer acceptable pressure drops. However, these filters cause operational problems in long-term industrial applications [10] because prior studies have focused on the fixed-bed mode; limited studies have been dedicated to developing moving beds.
This study introduced a novel concept for the three-dimensional movement and continuity of filtering granules. The two-stage moving granular bed filter (MGBF) in our previous study [21] used a two-dimensional asymmetrical geometric design for two granule sizes, which vertically flow from the upper hopper to the lower filter, thus diminishing stagnant zones. The three-dimensional apparatus of the two-stage MGBF was built from a two-dimensional setup for cold filtration tests (Figure 1). A series of cold tests with a two-stage MGBF were conducted to investigate its dust collection efficiency. Five mass flow rates for coarse granules and one mass flow rate for fine granules and vice versa have been examined in real time, and pressure drops, collection efficiencies, and particulate size distributions (D50) were determined. Furthermore, the ratio of mass consumption (mass of coarse granules divided by the mass of fine granules) was analyzed. The real-time experimental results obtained from this study show that the designed two-stage MGBF can be deployed in high-temperature environments [22].

2. Experimental Methodology
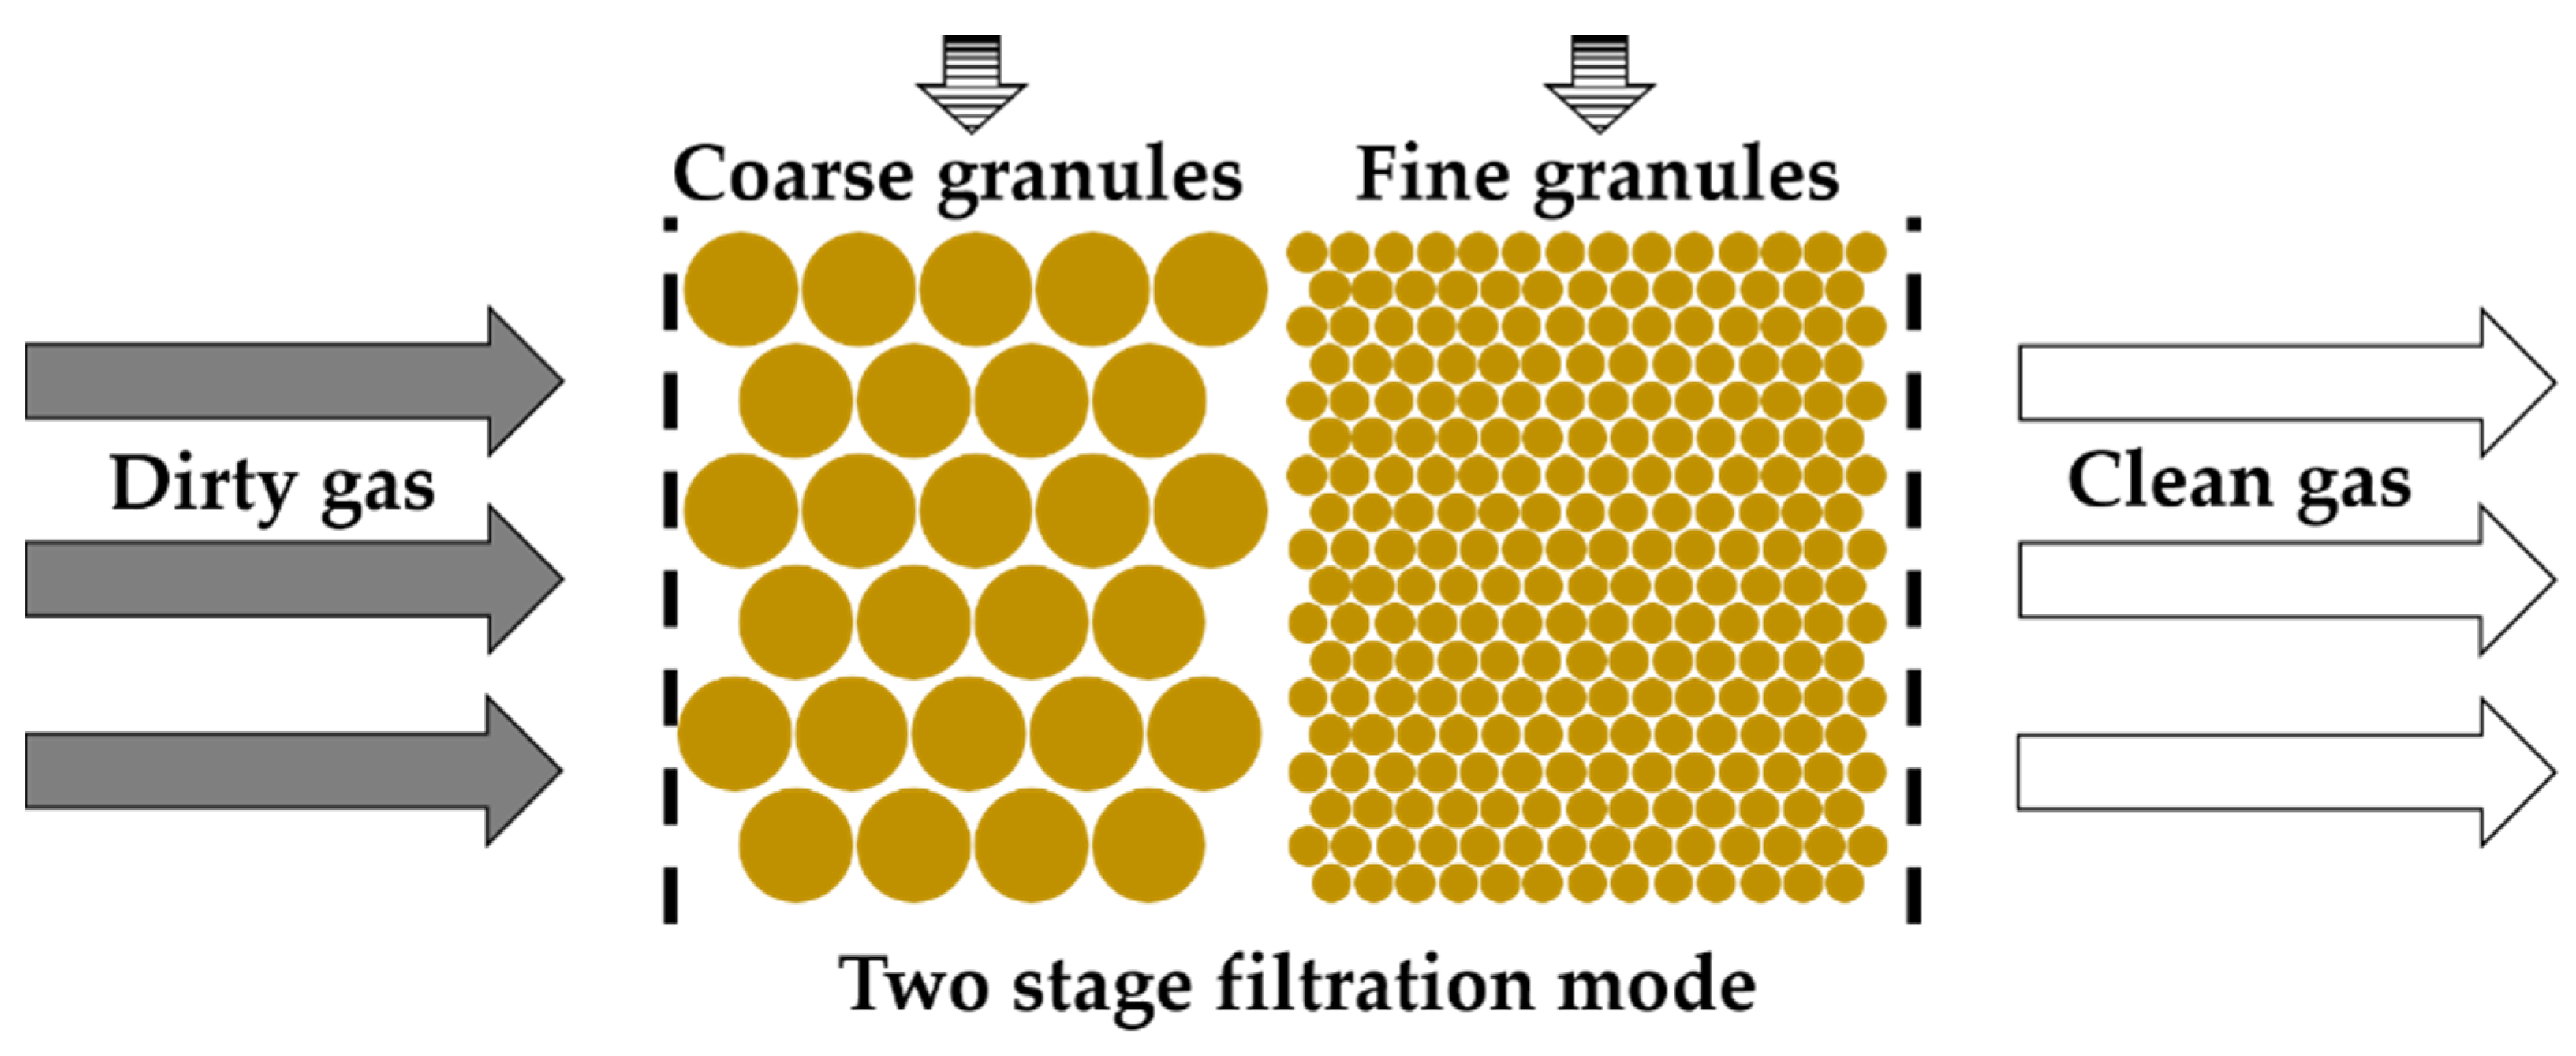
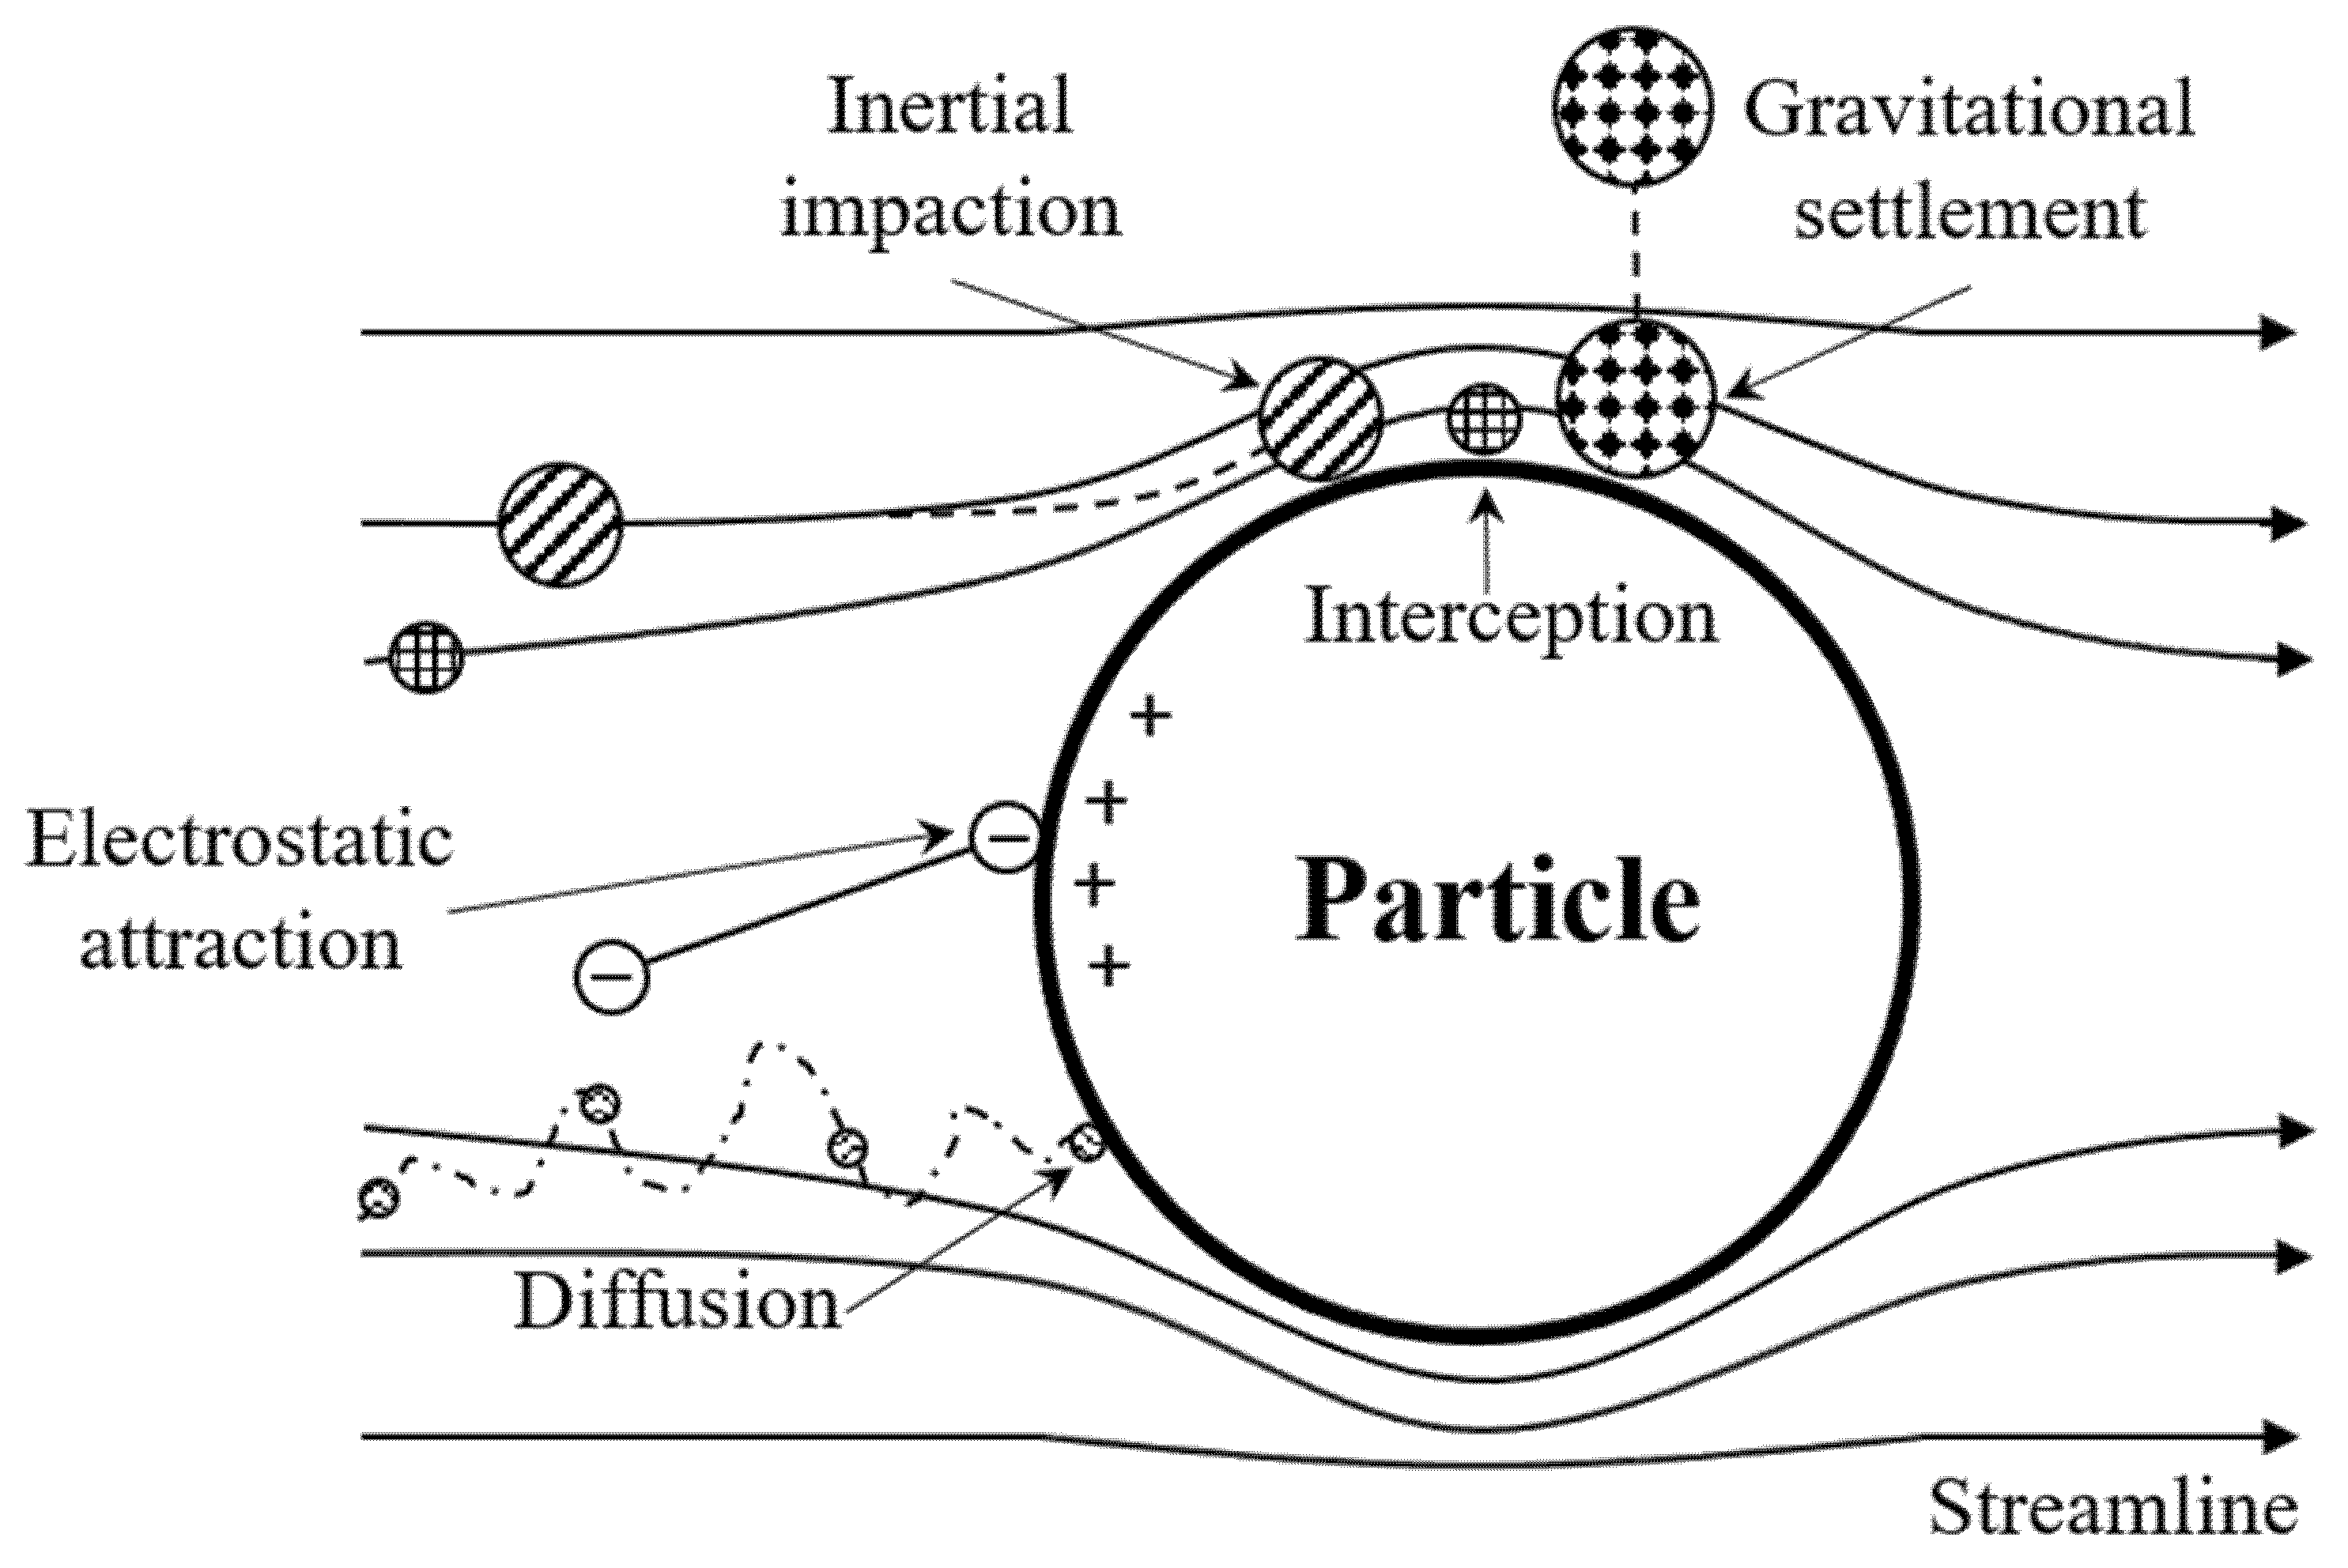
The two-stage MGBF used in this study consisted of an upper hopper, an MGBF, a conveyer (585 mm × 1090 mm × 600 mm, rated frequency: ~0–60 Hz) for mass flow rate control, an air compressor (Fusheng, Model: FTA-150II, 15 HP), a dust feeder (500 mm × 300 mm × 300 mm, capacity: 10 kg, feeding amount: max 200 g/min), and a process particle counter (PPC, Process Metrix, LLC. Model: PPC-P), as shown in Figure 2. The designed MGBF was based on quasi-two-dimensional tests reported in our previous study [21]. The dimensions were 1570 mm (height), 380 mm (width), and 500 mm (depth). An asymmetrical flow-corrective insert was placed in the MGBF, and clean filter granules were stored in the upper hopper, which was connected to the MGBF. These filtering granules flew from the top to the bottom of the filter due to gravity. Accordingly, a cross-flow filtration mechanism occurred as the clean air flew horizontally through the filter from the left side to the right side. Table 1 shows two groups of mass flow rates: C and F groups. The C group included various mass flow rates (110, 330, 440, 550, and 1100 g/min) of coarse granules (C) and a fixed mass flow rate of fine granules (for C1, C2, C3, C4, and C5, respectively). Conversely, the F group included various mass flow rates (110, 330, 440, 550, and 1100 g/min) of fine granules (F) and a fixed mass flow rate of coarse granules (for F1, F2, F3, F4, and F5, respectively). A mass flow rate of 330 g/min was concluded to be the optima setup, as determined in our previous study [21]. These coarse and fine granules were controlled by two variable-frequency conveyers located under the MGBF. The ratio of mass consumption (RM) was used to characterize the total mass consumption by coarse and fine granules:
R M = M C , 3 h o u r s M F , 3 h o u r s
where MC,3hours is the total mass consumption of coarse granules, and MF,3hours is the total mass consumption of fine granules in three hours of a moving-bed phase.
Fine granules had a diameter from 0.2 to 0.5 mm (D50 = 0.412 mm), whereas the diameter of coarse granules ranged from 2 to 4 mm (D50 = 2.483 mm). Table 2 shows the properties of coarse and fine granules. The granules comprised silicon dioxide (95%) and additional chemicals (Al2O3, Fe2O3, MgO, CaO, and NaO, 5%). The fixed filtration superficial velocity of the filtering granule free surface was 7.4 cm/s, which was maintained using an air compressor at the inlet of the filter. The pressure drops were measured by pitot tubes between the inlet and outlet of the filter. The concentration of dust particulates was stimulated via the dust feeder, which provided a fixed value of 15,000 ppmw at the inlet, and the raw data of the concentration from the outlet was measured by the PPC. The source of dust particulates was obtained from a coal-fired plant in Linkou, Taiwan. The size of dust particulates ranged from 3.905 to 344.206 μm with a nearly Gaussian distribution. The mass median diameter (D50) of dust particulates was 41.043 μm, and the bulk density of the dust was 898.56 kg/m3. The size distribution of dust particulates is shown in Figure 3.
Before filtration, first, coarse granules were introduced into the whole filter until the vessel was full. Secondly, fine granules were placed in the part of the outlet on the right side of the filter until the right side of the vessel was full. Subsequently, the two granule types were left to circulate for two hours to achieve a steady two-stage flow because a steady circulation of filtering granules flowing without the dust in the filter is necessary. In other words, a steady flow of two-stage granules was realized before the filtration test. For moving-bed tests, C and F were controlled using two different conveyers. The air and dust were mixed in the dust feeder to simulate the dirty synthesis gas, which was then released into the filter. Using the cross-flow mechanism, the dust in the air is caught and separated through the clean filter granules. The concentration of particulates in the filtrated air was measured using a PPC device, and a flow chart of the procedures is shown in Figure 4.

3. Mechanism of GBF

Based on the constant value of the inlet concentration in this study, the removal filtration of a filter was determined by the outlet concentration, which was measured using a PPC. Thus, the collection efficiency was expressed as follows:
η ( % ) = [ 1 ( C o u t / C i n ) ] × 100
where η is the mass of the collection efficiency, Cout is the mass of the concentration at the outlet, and Cin is the mass of the concentration at the inlet. The collection efficiency is the weight ratio of the dust concentration measured by the introduced dust concentration.
The collection mechanisms could include diffusion, gravitational settlement, interception, inertial impaction, and electrostatic attraction (Figure 5) [23]. Among these mechanisms, inertial impaction is the most important mechanism for GBFs and can be characterized by the Stokes number, St, which is expressed as follows [24]:
S t = 2 ρ p r p 2 U C / 9 μ r g
where ρp is the dust particulate density, rp is the dust particulate radius, U is the superficial velocity, C is the Cunningham correction factor, μ is the gas viscosity, and rg is the radius of a filter granule. The inertial impaction effect is negligible when the Stokes number is lower than 0.1 [25]. Nevertheless, the contribution of inertial impaction is significant for collecting fine particulates (5–50 μm) on filter granules larger than 1 mm [12]. According to the theory of inertial impaction, the aerosol particulate flows in a suspending airstream and keeps moving straight due to its inertia. When the suspending airstream passes around a larger granule, the aerosol particulate tends to keep flowing toward the granule and attach to it. The inertial impaction was the main mechanism observed in this study, explaining the tackling of micron-sized particulates in the cross-section of the GBF. The particulates can be tackled efficiently by a single granule due to the inertial impaction that depends on the relative velocity between particulates versus granules and the size of target granules. In this study, the different mass flow rates of coarse and fine granules affected the relative mass flow rate between coarse granules versus fine granules and dust particulates versus filtration granules.

4. Results and Discussion

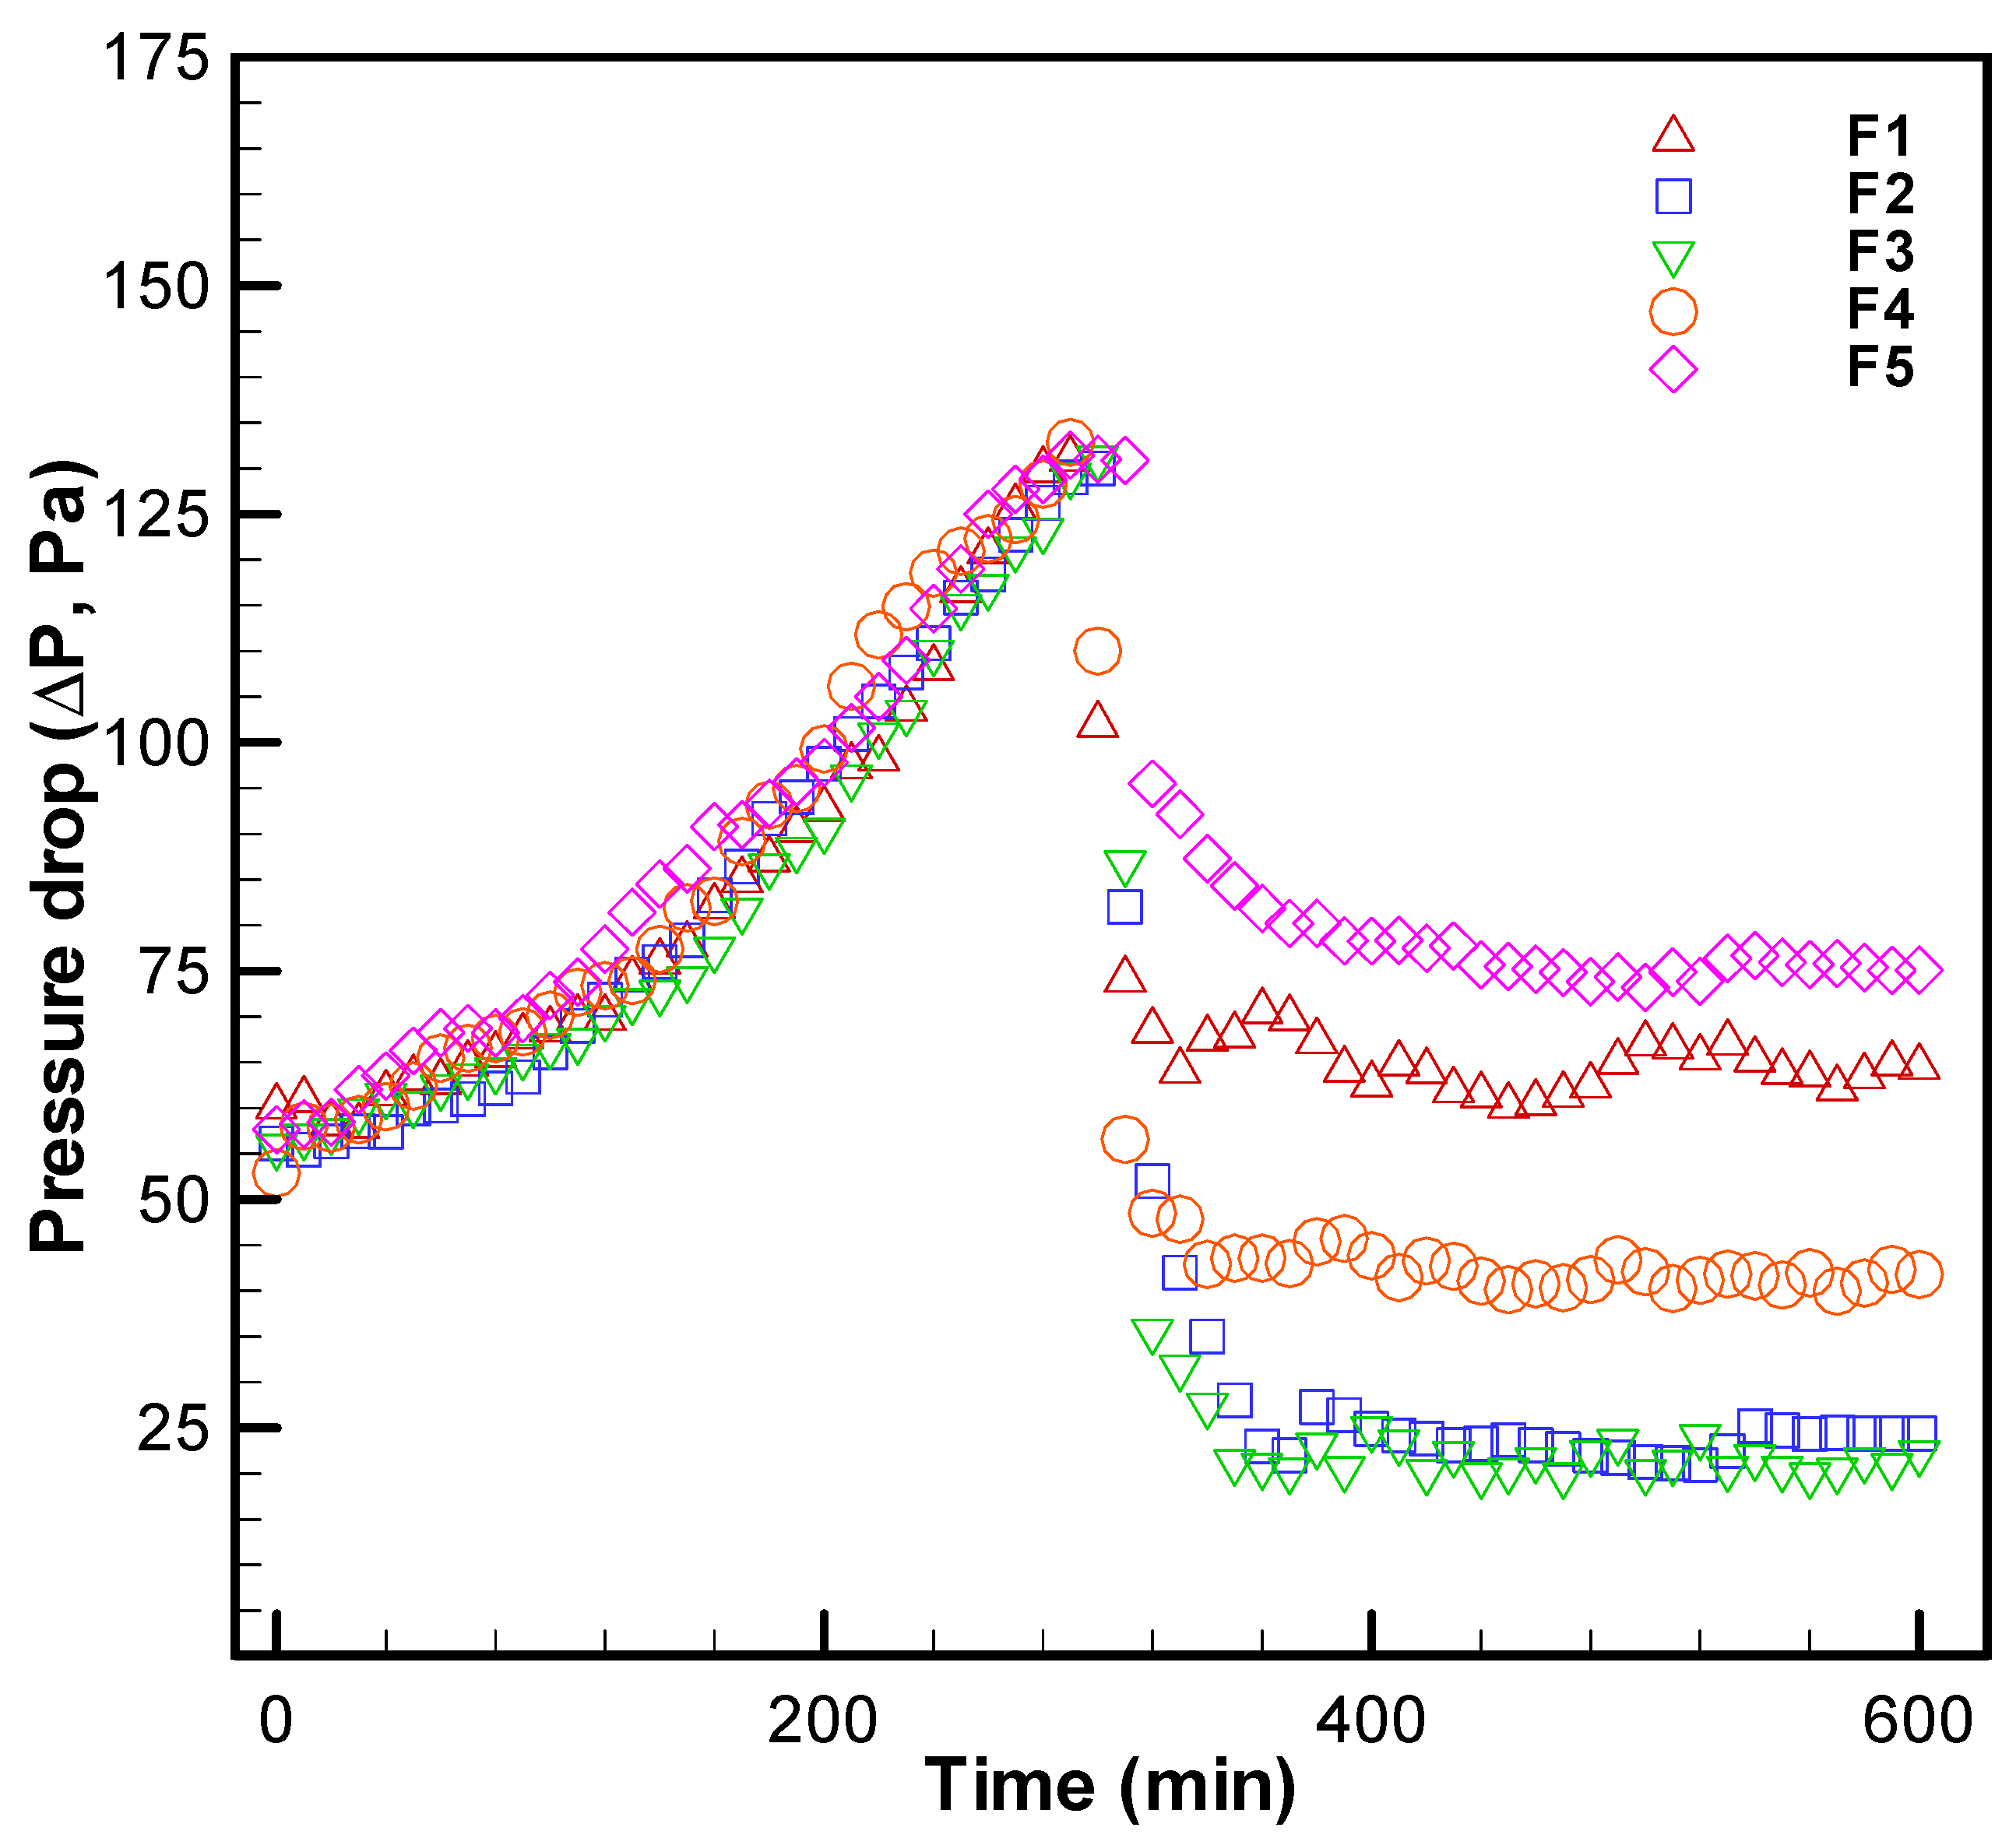
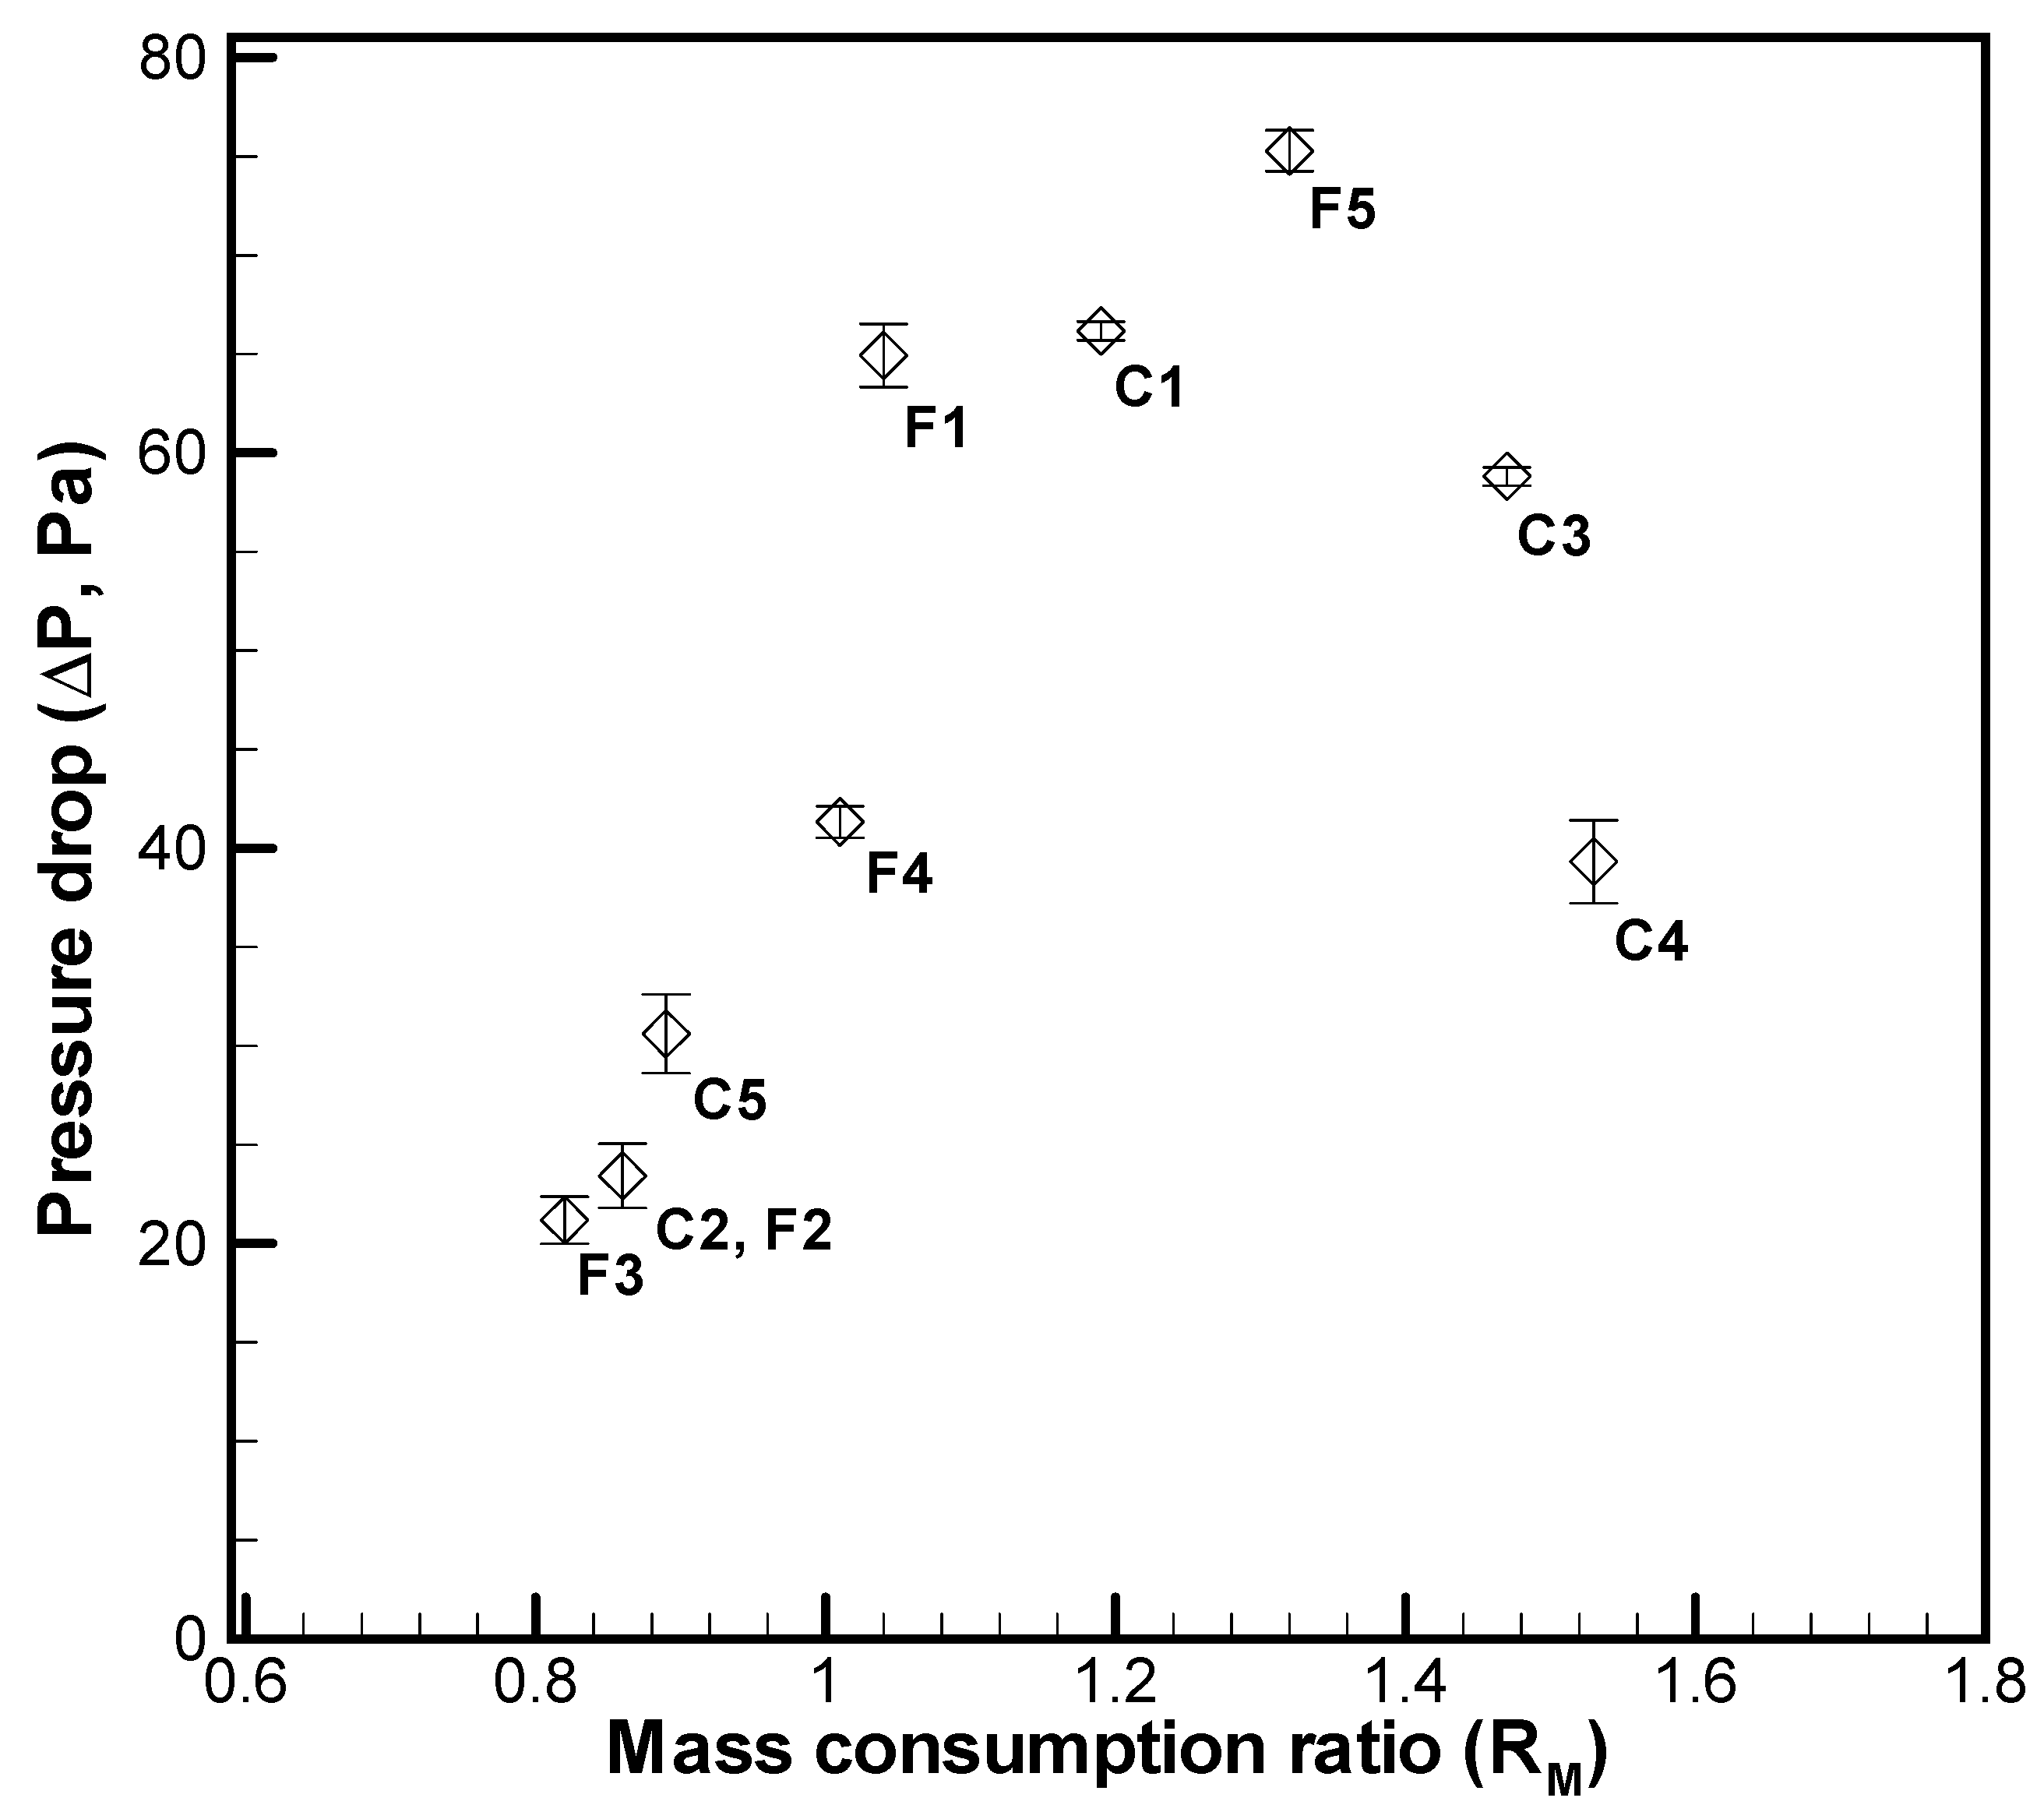
4.1. Pressure Drop under Different Mass Flow Rates of Coarse and Fine Granules

Pressure drop measurements over time at a fixed superficial velocity (7.4 cm/s) are shown in Figure 6, where the results were obtained using five C values (110, 330, 440, 550, and 1100 g/min) and one F (330 g/min) for fine granules. As shown in the figure, the pressure drop tendency did not change greatly until the pressure reached around 130 Pa at 300 min during the fixed-bed phase. In the fixed-bed phase, dust particulates continually passed through the fixed bed and were trapped by filtering granules; hence, the pressure drop increased over time. The depositional dust particulates in the fixed bed became saturated slowly as they accumulated in the bed, while the slope of the increase became smaller. Consequently, the operation of the fixed-bed phase was changed into a moving-bed phase. When the moving-bed phase started at around 300 min, the pressure drop rapidly fell for all tests. The rate of reduction was more significant from 300 to 330 min with the higher mass flow rates before reaching a steady state. This phenomenon was only seen for the C group of tests because the higher mass flow rate of coarse granules caused higher granule porosity, facilitating the airstream passing through the filter to the outlet. In addition, comparing the C group tests with the F group test, we found that the coarse/fine granules affected each other during the moving-bed phase. Thus, the behavior of pressure drops was not affected simply due to using only one C or F. Test C1 had the highest mass flow rate and, as a result, the largest steady pressure drop; this was followed by, in order, tests C3, C4, C5, and C2. (see more details of discussion in the next paragraph).
Figure 7 shows pressure drop variations at a fixed superficial velocity (7.4 cm/s) over time by employing an F of 110, 330, 440, 550, and 1100 g/min and an C of 330 g/min. During the fixed-bed phase, the pressure drop tendency was similar to that shown in Figure 6.
After the pressure drops continued until 440 min, they remained steady with slight oscillations at the end of the tests. Unlike Group C, tests from Group F required less than 50 min to reach a steady state for two reasons. First, the variation parameters for fine granules in Group C were located on the right side of the filter, i.e., the second stage, causing the pressure drop response to be relatively slow than group C. Second, the fine granules have a higher bulk density and, as a result, a higher flow resistance than coarse granules. The dust particulates in the airstream encountered higher flow resistance (lower porosity) passing through the filter to the outlet and thus took more time to reach a steady state. Notably, Test F5 with the highest pressure drop gave a different result of pressure drop in the steady state from that of Test C1. The pressure drops by the order of the rest mass flow rates from high to low were F1, F4, F2, and F3. Generally, a low-mass flow rate led to a high pressure drop because of the superficial velocity against the high residence by slowing granules. In the present study, the C and F affected with each other because of the mixed zone existing below the flow-corrective insert at the lower region of a filter. Thus the overall porosity of the filter cannot be demonstrated by single C or F. When the difference was too large between the original setup of the C/F (e.g., 110/330, 330/1100 g/min, see Table 1), the actual C or F started to change in the mixed zone, thereby the overall porosity of the filter was changed. Table 1 lists the mass consumed for both coarse and fine granules during the entire test. The ratio stood for the ratio of mass consumption by the mass of coarse granules divided by the mass of fine granules. Hence, the ratio of mass consumption could reflect the actual flow behaviors of coarse and fine granules. According to this point of view, the porosity of overall granules during the moving-bed phase depended on the actual flow behaviors of coarse and fine granules.
In Figure 8, the pressure drop as a result of various mass consumption ratios is shown. Here, the average pressure drop was collected from steady pressure drops over 500–600 min for all the tests (Tests C2 and F2 had the same setup). The pressure drop increased with an increase in the ratio of mass consumption from 0.82 to 1.32, reaching a peak value at a ratio of 1.32, but then rapidly decreased afterward at the ratios of 1.47 and 1.53 At the steady state, the largest pressure drop was seen during test C1, which had the lowest mass flow rate, followed by, in order, C3, C4, C5, and C2. As seen in Figure 6, the pressure drop is caused by the overall porosity in the filter during a moving-bed phase. As the mass consumption ratio (RM) increased, the interaction between coarse and fine granules became more intense, thereby increasing the mixing effect in the mixed zone below the flow-corrective insert in the lower region of the filter. As this mixing effect became stronger as RM increased, the local porosity became smaller, thereby increasing the pressure drop. The pressure drop thus decreased with decreasing RM, in order, as C1, C5, and C2. As shown in Figure 7, the pressure drops of tests from Group F were similar to those of Group C before RM = 1.32. At the highest RM (i.e., in Test F5), the largest pressure drop occurred. As RM decreased, so did the pressure drop (in decreasing order, F1, F4, F2, and F3), as was seen in Group C.
Figure 9 might explain why the pressure drops of C3 and C4 did not increase proportionally with the increase in the mass consumption ratio. The airstream flew through Sections A (upper part of filter) and B (lower part of filter) equally when the pressure drop difference between coarse and fine granules in the mixed zone was small, i.e., when RM < 1.32. When RM > 1.32, the pressure drop increased more in the mixed zone of Section B than in Section A; hence, part of the airstream bypassed Section B and flew through Section A more easily, shortening the path of the airstream flowing through the filter. This explains why the pressure drop did not increase with the increase in RM and instead decreased with RM > 1.32.

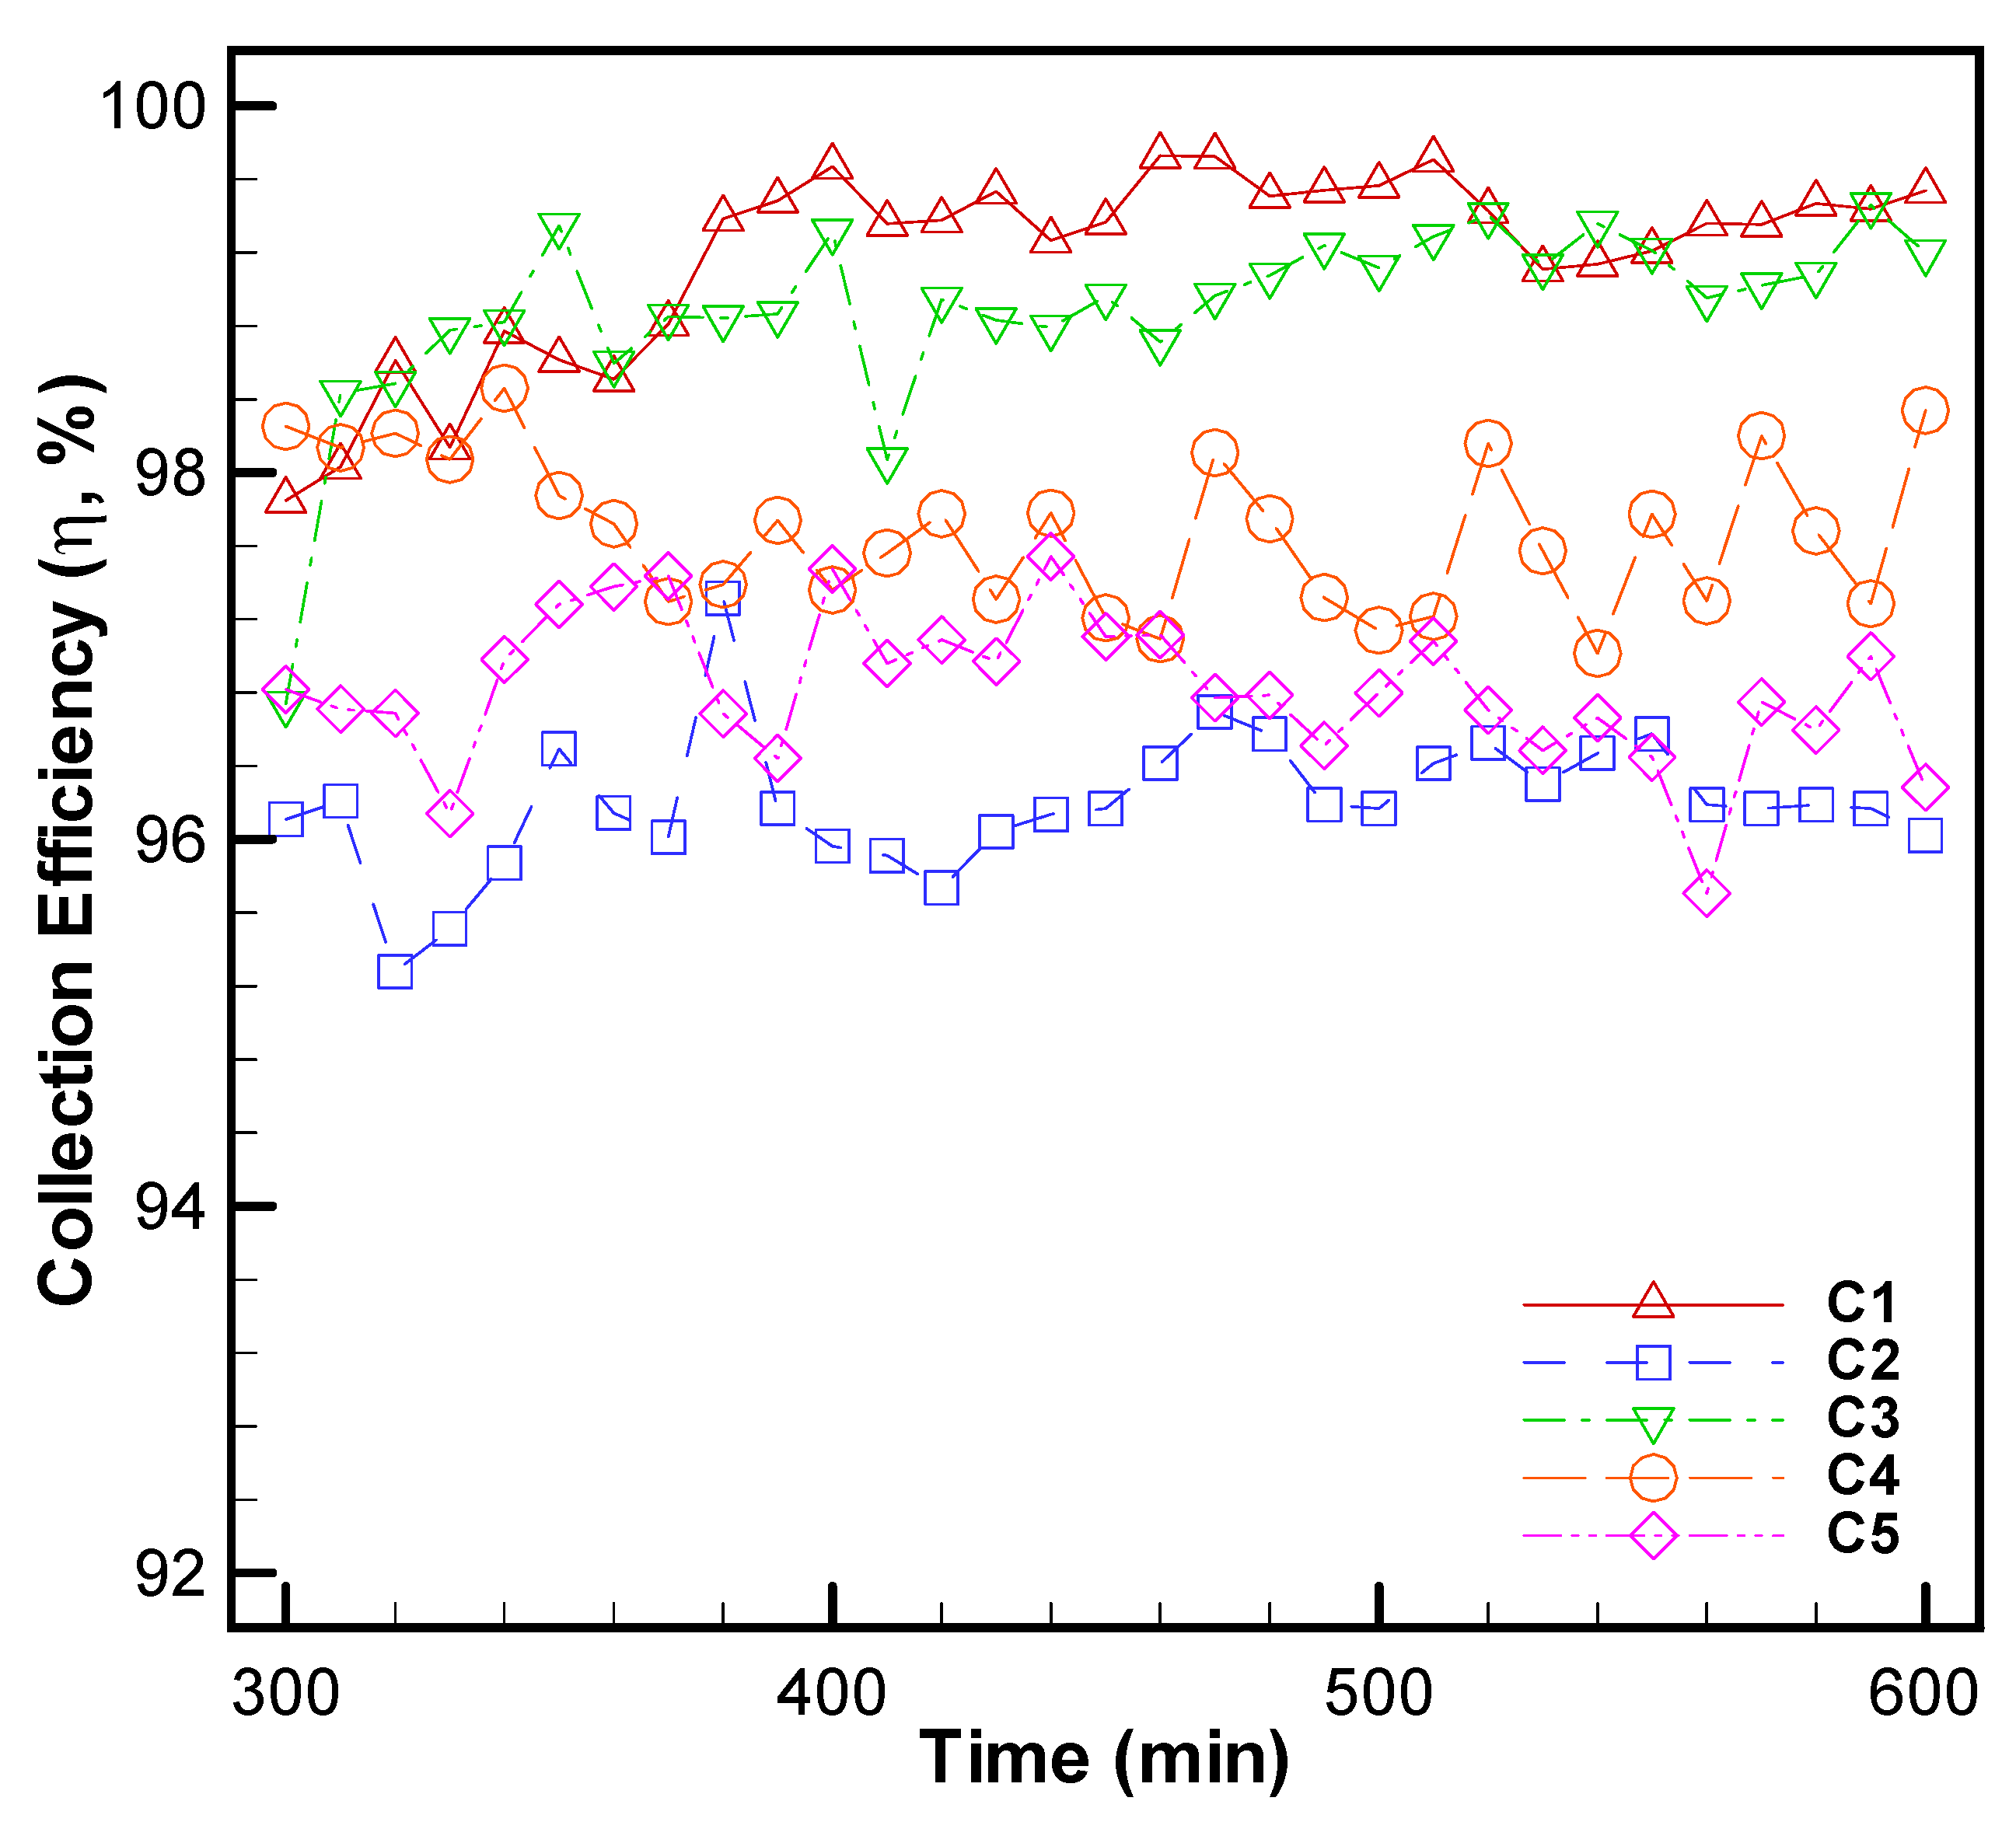
4.2. Collection Efficiency under Different Mass Flow Rates of Coarse and Fine Granules

Variations in collection efficiency at a fixed superficial velocity (7.4 cm/s) over time are shown in Figure 10, where the results were obtained using the C values of 110, 330, 440, 550, and 1100 g/min and an F of 330 g/min. The use of the PPC system detected the real-time collection efficiency in a moving-bed phase from 300 to 600 min. The collection efficiency was the best in C1, followed by C3 and C4. In addition, higher pressure drop normally led to higher collection efficiency. When the overall porosity decreased because of the dust particulates being trapped by filtering granules in the filter, the pressure drop increased. The higher pressure drop then brought the higher collection efficiency, and the results of Figure 10 agreed well with the results of pressure drops (Figure 6). Figure 11 demonstrates the variations in collection efficiency using five different values of F of 110, 330, 440, 550, and 1100 g/min at fixed C (330 g/min) while employing a fixed superficial velocity (7.4 cm/s) over time. The figure showed that the collection efficiencies of F5 and F3 were the highest and lowest in this group, respectively. In comparison with the highest collection efficiency (99.18%) obtained in Test C1 in the C group (C1–C5), the highest collection efficiency (99.75%) obtained in Test F5 in the F group (F1–F5) was 0.571% higher, and the worst collection efficiency (96.20%) of the C group (C2) had 0.489% higher efficiency than the worst collection efficiency (95.73%) of the F group (F3).
Figure 12 shows the relationship between the collection efficiency and the ratio of mass consumption. The collection efficiency grew from the ratio of 0.82 to the highest ratio of 1.32 and then fell rapidly from the peak ratio of 1.32 to the ratio of 1.67. The highest ratio of 1.32 reached a collection efficiency of 99.75%, which is the best performance in all tests, and the ratio of 0.82 had the worst collection efficiency (95.73%). According to these results, the figure illustrated a tendency of peak point that was similar to the tendency seen for pressure drops (Figure 8). Based on Figure 9, a larger pressure drop difference of coarse and fine granules forced the airstream that included dust particulates to bypass Section B. Thus, the airstream flew through less area in the whole filter and passed through the cross-flow filtration area more quickly. The chance of dust particulates being attracted to filtering granules decreased, and therefore, the effect of inertia impaction decreased to reduce the overall collection efficiency. Figure 13 shows that the collection efficiency improved with the pressure drop. For the applications of IGCC, high collection efficiency is strongly correlated with a high pressure drop. However, sacrificing the high pressure drop brings higher energy loss and reduces the efficiency of gas turbines [8], requiring further consideration.

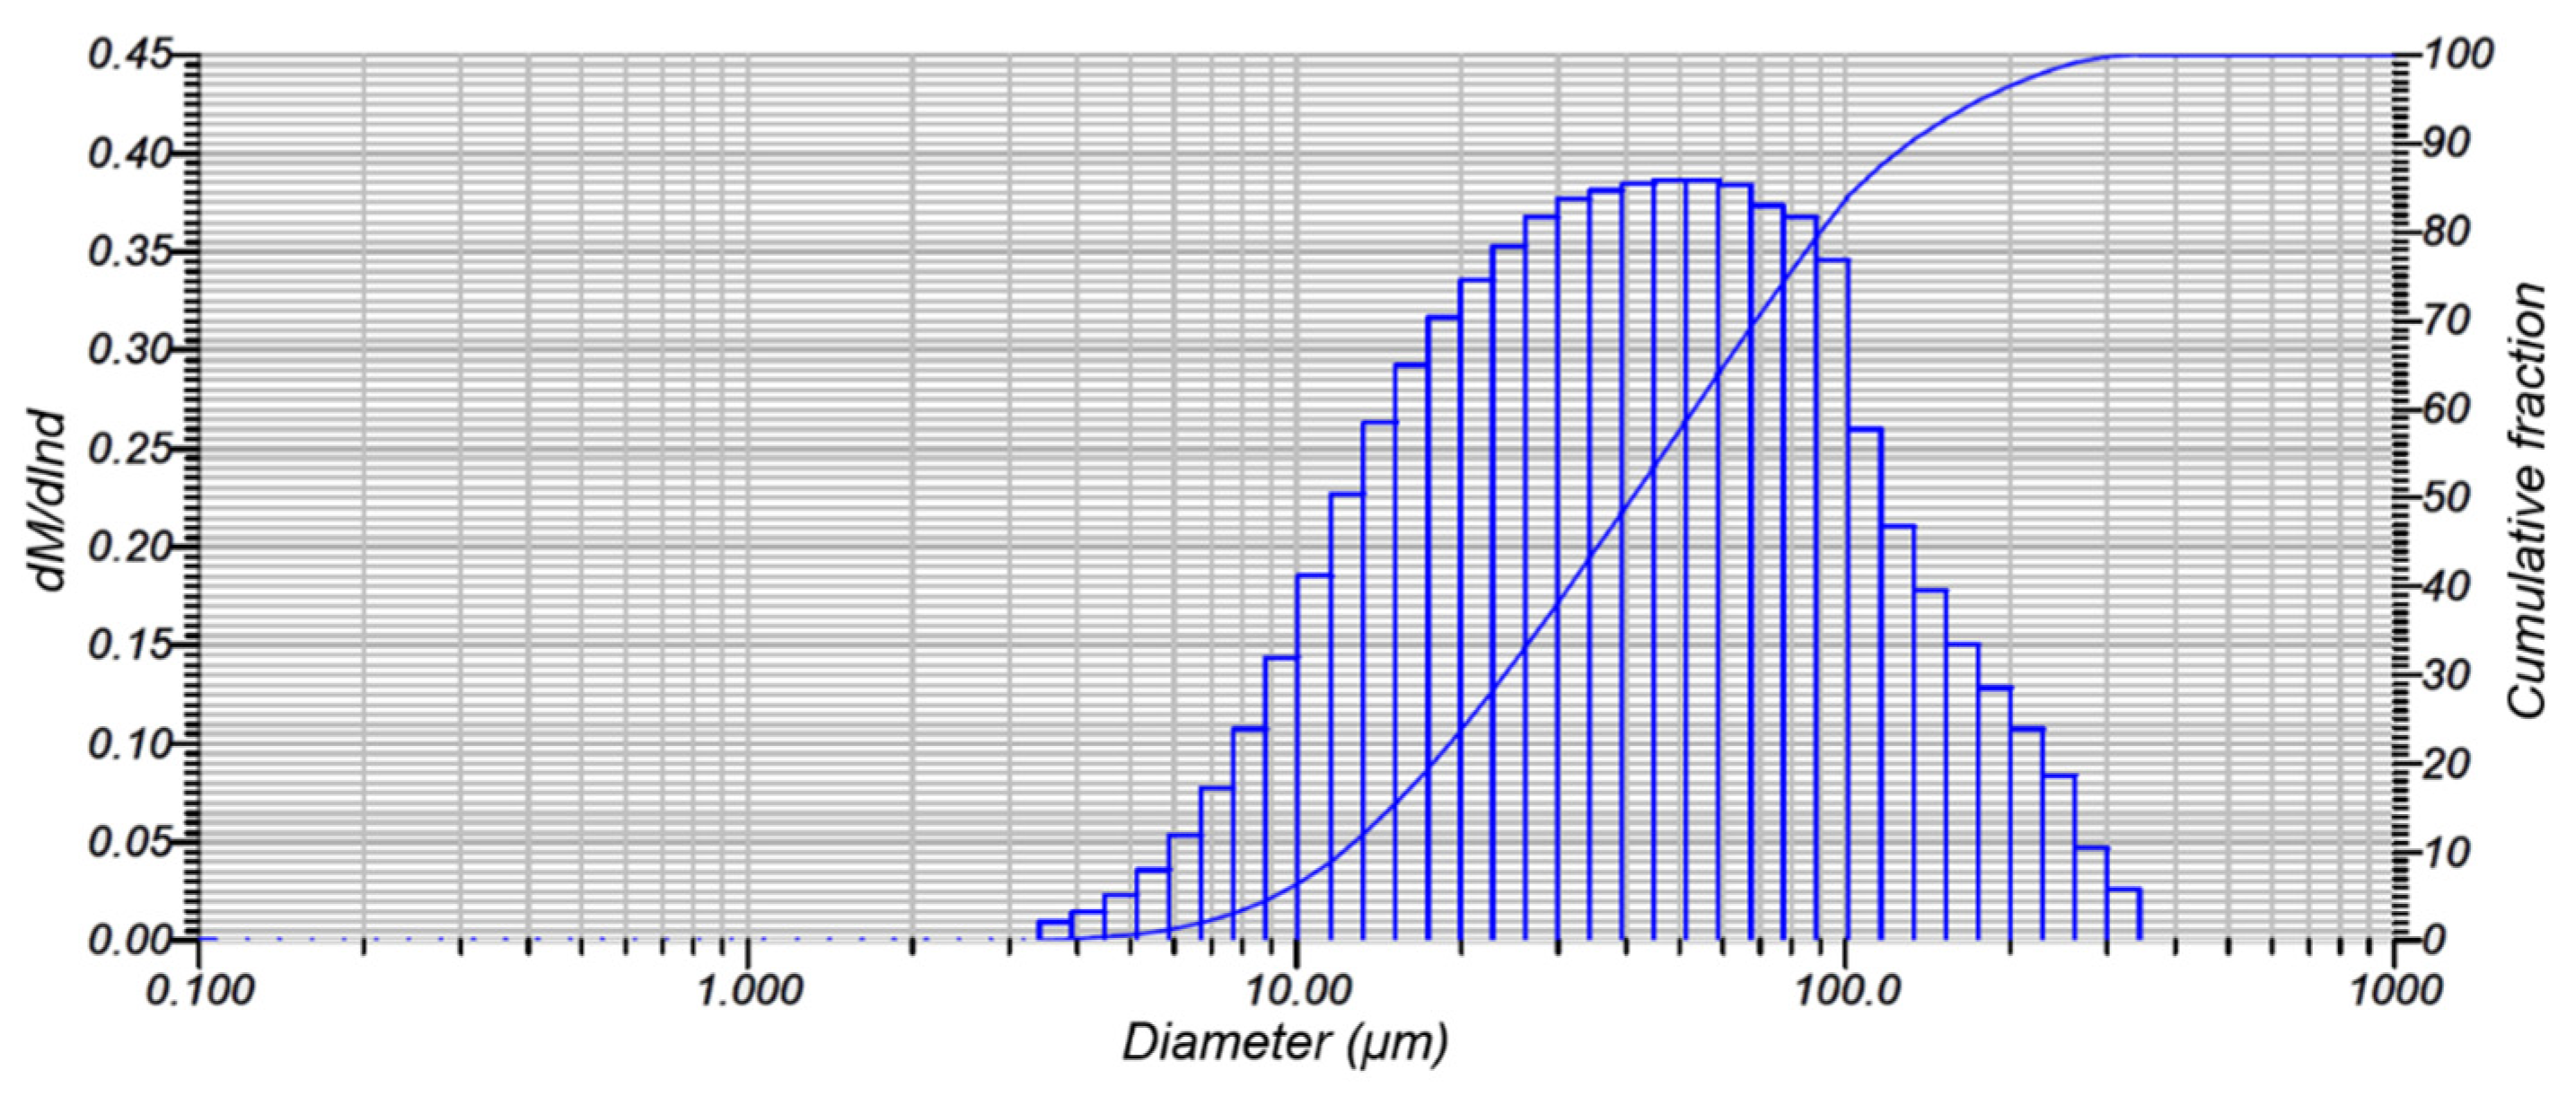
4.3. Size Distribution of Dust Particulates under Different Mass Flow Rates

The size distributions of dust particulates (D50) flowing from the outlet for the different mass flow rates of the two-stage mode were concluded. Figure 14a shows the results of various C values with a fixed F, which ranged from 1.660 to 1.775 μm. Test C1 especially demonstrated lower size distributions, which reached a collection efficiency of 99.18%. Because higher pressure drop follows higher collection efficiency, the size distribution results obtained from the smaller overall porosity of filtration granules owing to the higher pressure drop. Because of the small overall porosity of filtration granules, the effect of inertia impaction was more important here, especially for small dust particulates. However, the rest of the results of the size distribution did not support the above discussion. Tests C3 and C4 had relatively higher particulate size distributions in the group, and Tests C2 and C5 had relatively lower particulate size distributions in the group. It might be concluded that the particulates’ size distributions were also influenced by the ratio of mass consumption being larger than 1.32. Figure 14b demonstrates that the particulates’ sizes ranged from 1.474 to 1.765 μm, while different F values with a fixed C values were employed. Test F5, which achieved a collection efficiency of 99.75%, attained lower size distributions. Test F1 and Test F4 reached the second level of particulates size distributions, which had collection efficiencies of 98.92% and 97.89%, respectively. Note that oscillations in F1 and F4 from 400 to 500 min might be caused by the clogging of the long-period filtration test of the fine granules. F2 and F3 had rather high particulate size distributions in the test, reaching collection efficiencies of 96.20% and 95.73%, respectively. The mass consumption ratios in F1 and F4 were higher than 1, but on the contrary, mass consumption ratios in F2 and F3 were lower than 1. Figure 15 shows variations in particulate sizes versus mass consumption ratios. The results revealed a different tendency from the results of the pressure drop versus the ratio of mass consumption (Figure 8) and the collection efficiency versus the mass consumption ratio (Figure 12), indicating that the particulate size distribution is not correlated with the collection efficiency or pressure drop. However, it was still influenced by the ratio of mass consumption. According to the results of particulate size distributions shown in Figure 14a,b, these results both attained a level that overall particulate sizes were lower than 1.775 μm. These results were far below the 10 μm standard for safe application in gas turbines [26]. Dust particulates have been an important issue in the recent decade and are among the factors that may lead to cardiopulmonary morbidity diseases. The results also denoted that the dust particulate was smaller than 1.775 μm in all tests. Dust particulates (fly ash) were efficiently controlled owing to the dense granules of the two-stage mode with a ratio of mass consumption around 1 or higher. It can be concluded that the overall particulate size distributions decreased with the increase in the ratio of mass consumption; hence, the emission standards of IGCC systems were satisfied.

5. Conclusions

We proposed a novel dust removal technology for cold filtration in which two-stage granules in a moving granular bed were employed. Experimental tests using different C values with a fixed F and different F values with a fixed C were performed. The resulting pressure drop, collection efficiency, and particulates size distributions were analyzed, and the following conclusions were drawn.
  • The pressure drop was affected by the interaction of coarse and fine granules in the mixed zone. The pressure drop increased with the increase in the mass consumption ratio until a mass consumption ratio of 1.32 but then decreased (i.e., Cases C3 and C4). Thus, a mass consumption ratio of 1.32 provided the maximum pressure drop.
  • The highest collection efficiency reached 99.75% at a mass consumption ratio of 1.32, which was enhanced by the pressure drop. The higher energy loss due to the high pressure drop might be critical to address in gas turbine applications.
  • In all setups of this study, the particulate size distribution of the dust at the filter’s outlet was <1.775 μm; this value is within a standard of 10 μm watershed required for the safe application of gas turbines.
  • Better collection efficiency and particulate size distributions were achieved when F = 1100 g/min and C = 330 g/min.

Author Contributions

Conceptualization, C.C. and S.H.; methodology, Y.C. and C.C.; formal analysis, Y.C., L.S. and C.C.; investigation, C.C.; resources, S.H. and C.C.; data curation, Y.C. and C.C.; writing—original draft preparation, C.C.; writing—review and editing, Y.C., L.S. and C.C.; supervision, S.H.; project administration, S.H.; funding acquisition, S.H. All authors have read and agreed to the published version of the manuscript.

Funding

This research was funded by MOST, grant number 109-3116-F-008-008-CC1.

Institutional Review Board Statement

Not applicable.

Informed Consent Statement

Not applicable.

Data Availability Statement

Not applicable.

Acknowledgments

The authors would like to thank Smid for the concept support.

Conflicts of Interest

The authors declare no conflict of interest.

References

  1. Sax, S.N.; Zu, K.; Goodman, J.E. Air pollution and lung cancer in Europe. Lancet Oncol. 2013, 14, e439–e440. [Google Scholar] [CrossRef]
  2. Seville, J.P.K. Rigid ceramic filters for hot gas cleaning. KONA Powder Part J. 1993, 11, 41–56. [Google Scholar] [CrossRef] [Green Version]
  3. Smith, D.H.; Ahmadi, G. Problems and progress in hot-gas filtration for pressurized fluidized bed combustion (PFBC) and integrated gasification combined cycle (IGCC). Aerosol. Sci. Technol. 1998, 29, 163–169. [Google Scholar] [CrossRef] [Green Version]
  4. Xiao, G.; Wang, X.; Yang, G.; Ni, M.; Gao, X.; Cen, K. An experimental investigation of electrostatic precipitation in a wire–cylinder configuration at high temperatures. Powder Technol. 2015, 269, 166–177. [Google Scholar] [CrossRef]
  5. Melchior, T.; Madlener, R. Economic evaluation of IGCC plants with hot gas cleaning. Appl. Energy 2012, 97, 170–184. [Google Scholar] [CrossRef]
  6. Li, G.; Wang, L.; Wang, C.; Wang, C.; Wu, P.; Che, D. Experimental study on coal gasification in a full-scale two-stage entrained-flow gasifier. Energies 2020, 13, 4937. [Google Scholar] [CrossRef]
  7. Hasegawa, T. Gas turbine combustion and ammonia removal technology of gasified fuels. Energies 2010, 3, 335–449. [Google Scholar] [CrossRef]
  8. Chen, Y.S.; Hsiau, S.S.; Lai, S.C.; Chyou, Y.P.; Li, H.Y.; Hsu, C.J. Filtration of dust particulates with a moving granular bed filter. J. Hazard. Mater. 2009, 171, 987–994. [Google Scholar] [CrossRef]
  9. Kamiya, H.; Sekiya, Y.; Horio, M. Thermal stress fracture of rigid ceramic filter due to char combustion in collected dust layer on filter surface. Powder Technol. 2001, 115, 139–145. [Google Scholar] [CrossRef]
  10. Xiao, G.; Wang, X.; Zhang, J.; Ni, M.; Gao, X.; Luo, Z.; Cen, K. Granular bed filter: A promising technology for hot gas clean-up. Powder Technol. 2013, 244, 93–99. [Google Scholar] [CrossRef]
  11. Wenzel, B.M.; Porciúncula, C.B.; Marcilio, N.R.; Menegolla, H.B.; Dornemann, G.M.; Godinho, M.; Martins, C.B. Filtration of dust in an intermittent moving granular bed filter: Performance and modeling. Sep. Purif. Technol. 2014, 133, 108–119. [Google Scholar] [CrossRef]
  12. El-Hedok, I.A.; Whitmer, L.; Brown, R.C. The influence of granular flow rate on the performance of a moving bed granular filter. Powder Technol. 2011, 214, 69–76. [Google Scholar] [CrossRef]
  13. Chen, Y.S.; Hsiau, S.S. Cake formation and growth in cake filtration. Powder Technol. 2009, 192, 217–224. [Google Scholar] [CrossRef]
  14. Böehm, L.; Jordan, S. On the filtration of sodium oxide aerosols by multilayer sand bed filters. J. Aerosol. Sci. 1976, 7, 311–318. [Google Scholar] [CrossRef]
  15. Stechkina, I.B.; Kirsh, V.A. Optimization of parameters of filters in a multistage system of fine gas filtration. Theor. Found. Chem. Eng. 2003, 37, 218–225. [Google Scholar] [CrossRef]
  16. Ochieng, G.M.M.; Otieno, F.A.O.; Ogada, T.P.M.; Shitote, S.M.; Menzwa, D.M. Performance of multistage filtration using different filter media against conventional water treatment systems. Water SA 2004, 30, 361–367. [Google Scholar] [CrossRef] [Green Version]
  17. Charvet, A.; Wingert, L.; Monnier, N.B.; Pacault, S.; Fournier, F.; Bemer, D.; Thomas, D. Multi-staged granular beds applied to the filtration of ultrafine particles: An optimization of collector diameters. Powder Technol. 2019, 342, 341–347. [Google Scholar] [CrossRef] [Green Version]
  18. Yu, Y.S.; Tao, Y.B.; Ma, Z.; He, Y.L. Experimental study and optimization on filtration and fluid flow performance of a granular bed filter. Powder Technol. 2018, 333, 449–457. [Google Scholar] [CrossRef]
  19. Shi, K.Y.; Yang, G.H.; Huang, S.; Tian, S.R.; Hu, Z.F.; Huang, B.L. Study on filtering characteristics of aerosol particulates in a powder-grain dual-layer granular bed. Powder Technol. 2015, 272, 54–63. [Google Scholar] [CrossRef]
  20. Chen, J.L.; Li, X.F.; Huai, X.L.; Zhou, J.Z. Collection efficiency in a three-dimensional randomly arranged dual-layer granular bed filter. Particuology 2020, 49, 88–94. [Google Scholar] [CrossRef]
  21. Chang, C.W.; Hsiau, S.S.; Chen, Y.S.; Chyou, Y.P.; Smid, J. Study of flow patterns in two-stage mode of moving granular bed filter. Aerosol. Air Qual. Res. 2017, 17, 2691–2704. [Google Scholar] [CrossRef] [Green Version]
  22. Chen, Y.S.; Chyou, Y.P.; Li, S.C. Hot gas clean-up technology of dust particulates with a moving granular bed filter. Appl. Therm. Eng. 2015, 74, 146–155. [Google Scholar] [CrossRef]
  23. Zevenhoven, C.A.P. Particle Charging and Granular Bed Filtration for High Temperature Application. Ph.D. Thesis, Delft University, Delft, The Netherlands, 1992. [Google Scholar]
  24. Gal, E.; Tardos, G.; Pfeffer, R. A study of inertial effects in granular bed filtration. AIChE J. 1985, 31, 1093–1104. [Google Scholar] [CrossRef]
  25. Lee, K.W. Maximum penetration of aerosol particles in granular bed filters. J. Aerosol. Sci. 1981, 12, 79–87. [Google Scholar] [CrossRef]
  26. Cicero, D.C.; Dennis, R.A.; Geiling, D.W.; Schmidt, D.K. Hot-gas cleanup for coal based gas turbines. Mech. Eng. 1994, 116, 70–75. [Google Scholar]
Figure 1. Schematic of the two-stage filtration mode.
Energies 14 02534 g001
Figure 2. Schematic of the apparatus. The red and green arrows represent the direction of the airstream and filtration granules, respectively.
Energies 14 02534 g002
Figure 3. Size distribution of dust particulates.
Energies 14 02534 g003
Figure 4. Schematic of the two-stage filtration testing.
Energies 14 02534 g004
Figure 5. Schematic illustration of filtration mechanisms.
Energies 14 02534 g005
Figure 6. Variation in pressure drop versus time for tests C1, C2, C3, C4, and C5, where C = 110, 330, 440, 550, and 1100 g/min, respectively, and F = 330 g/min.
Energies 14 02534 g006
Figure 7. Variation in pressure drop versus time for tests F1, F2, F3, F4, and F5, where F = 110, 330, 440, 550, and 1100 g/min, respectively, and C = 330 g/min.
Energies 14 02534 g007
Figure 8. Pressure drop versus mass consumption ratio for tests C1–C5 and F1–F5.
Energies 14 02534 g008
Figure 9. Schematic illustration of actual flows under different values of C and F in Section A and Section B of a filter at a ratio of coarse/fine granules (a) smaller than 1.32 and (b) larger than 1.32. The vertical red dashed line represents the mixed zone between coarse and fine granules. Once the difference in pressure drop became relatively larger in the mixed zone of Section B than the pressure drop in Section A, the part of the airstream started to bypass Section B.
Energies 14 02534 g009
Figure 10. Variation in collection efficiency versus time for tests C1, C2, C3, C4, and C5, where C = of 110, 330, 440, 550, and 1100 g/min, respectively, and F = 330 g/min.
Energies 14 02534 g010
Figure 11. Variation in collection efficiency versus time for tests F1, F2, F3, F4, and F5, where F = of 110, 330, 440, 550, and 1100 g/min, respectively, and C = 330 g/min.
Energies 14 02534 g011
Figure 12. Variation in collection efficiency versus mass consumption ratios of coarse and fine granules for tests C1–C5 and F1–F5.
Energies 14 02534 g012
Figure 13. Correlation between pressure drop and collection efficiency using mass flow rates for tests C1–C5 and F1–F5 (C2 has the same setup as F2).
Energies 14 02534 g013
Figure 14. Variation in particulate size versus time for tests (a) C1–C5, where C = 110, 330, 440, 550, and 1100 g/min, respectively, and F = 330 g/min; (b) F1–F5, where F = 110, 330, 440, 550, and 1100 g/min, respectively, and C = 330 g/min.
Energies 14 02534 g014
Figure 15. Variation in particulate size versus mass consumption ratio.
Energies 14 02534 g015
Table 1. Experimental setups for different mass flow rates of coarse granules and fine granules.
TestMass Flow Rate (g/min)Mass Consumption (kg)Ratio
Coarse
Granules
Fine
Granules
Coarse
Granules
Fine
Granules
C111033074.462.51.19
C233077.890.50.86
C3440138.594.21.47
C4550157.1102.71.53
C51100198.6223.10.89
F133011069.767.01.04
F2 133077.890.50.86
F3440103.0125.60.82
F4550123.5122.31.01
F51100235.0178.01.32
1 Test F2 has the same setup as Test C2.
Table 2. Properties of coarse granules and fine granules.
Coarse GranulesFine Granules
Mean size, D50 (mm)2.4830.412
Wall friction angle, ϕ w (°)15.7820.90
Bulk density, ρ b (kg/m3)14201530
Publisher’s Note: MDPI stays neutral with regard to jurisdictional claims in published maps and institutional affiliations.

