1. Introduction
Knowledge regarding the purity of liquid lithium flowing inside metal pipes, such as those typically constituting the loops used in fusion applications, is of primary importance, since it is well known [
1,
2,
3,
4,
5,
6] that the presence of impurities, particularly non-metallic elements, greatly enhances the corrosion action exerted by lithium itself on wet pipe surfaces. Therefore, it is necessary to keep as low as possible the concentration of non-metallic elements in lithium such as carbon, oxygen, hydrogen and, particularly, nitrogen, which is the most corrosion-affecting element among them. For this purpose, a device or a technique able to quantify their concentrations is necessary.
In the IFMIF (International Fusion Materials Irradiation Facility) project, the maximum allowed concentration value for each of the aforementioned elements had been set to 10 wppm [
7]. The same value was also chosen for the IFMIF-DONES (Demo-Oriented NEutron Source) plant [
8], even if the possibility to allow a higher nitrogen limit is under evaluation, for instance 30 wppm or more, depending on the results of the corrosion validation activities [
9], which are still ongoing.
Unfortunately, the quantification of the non-metals concentration in lithium is not possible for almost all of them. Only for nitrogen has a specific procedure been implemented, but it is in any case an offline procedure, the sample entailing a small amount (a few grams) of lithium from the loop and the performance of a batch chemical analysis on it. This requires many hours and the availability of a chemistry-trained operator [
10].
An online (real-time) individual analysis of nitrogen as well as of the other non-metallic elements is not available. Nonetheless, an overall evaluation of the amount of total impurities can be given by the Resistivity Meter (RM). The RM measures the electrical resistance of lithium and relates it to the purity of the alkaline metal, since the higher the concentration of total impurities, the higher the electrical resistance.
The first part of this paper describes the measurement principle of the RM and the issues presently encountered with the instrument. The second part deals with the design and the constructive details of a new, improved RM, possibly giving a more stable, precise and sensitive measurement output; this new RM, once constructed, will be then tested, installed and employed in the IFMIF-DONES Impurity Control System (ICS) loop.
2. The Current Resistivity Meter
The Resistivity Meter is a device able to online monitor the electric resistance of flowing lithium. It was developed at the University of Nottingham in collaboration with ENEA Brasimone and relies on the variation of the metal resistivity produced by the dissolved anions: the higher the concentration of impurities in lithium, the higher the resistivity (α) [
11,
12,
13,
14,
15]. Clearly, each kind of impurity affects the resistivity value to a different extent. However, taking into account their relative effects and their solubility in lithium, it is possible to almost entirely ascribe the variation of α to hydrogen and nitrogen, the latter being the most corrosion-affecting non-metal impurity.
The current RM, shown in
Figure 1, has been installed and operated inside the Lifus 6 plant at the ENEA Brasimone Centre since 2014 [
16,
17]; its particular location (the purification loop upstream of the Cold Trap), permits one to analyse the less purified lithium flowing throughout the plant so as to avoid underestimation of the total impurities’ concentration value.
Lifus 6 RM is made of AISI 316L and is an all TIG welded assembly. The main components are:
The source lithium pipe, from which a small fraction is picked for monitoring;
The electromagnetic pump (EMP), which drives lithium through the capillary tube;
The capillary tube (φo= 4.8 mm, φi= 3.0 mm), where the measurement current is applied and has the shape of a loop continuously fed with flowing liquid lithium.
The electrical resistance is measured between two metal plates (40 mm × 40 mm, 2 mm thickness, 150 mm one from the other), which intersect the measurement capillary and where silver electrical leads are connected both to bring the electrical current and to acquire the voltage drop (BINT 20024 Precision Nano-ohmmeter is employed for this purpose). From
Figure 1, it is also possible to see that all the apparatus is housed inside a steel parallelepiped box, and that along the lateral inner walls of this box are mounted four heating elements (two on each side), which permit one to control the desired temperature inside. The box, open in the figure, is closed during normal operation in order to minimize the heat losses to the external environment.
During plant operation, the current configuration of the resistivity meter has evidenced two relevant issues [
18]:
The heaters installed inside the box to avoid thermal losses from the capillary are not able to guarantee isothermal conditions around the capillary. The four heating elements heat the air inside the box and not directly the capillary tube. Additionally, due to the vertical orientation of the box, warm air inside the box moves upward originating a convective heat flux and a stratification in the Li flow direction. Since resistivity is highly sensitive to temperature, this thermal instability introduces an important and troublesome contribution to the acquired signal;
The electromagnetic pump devoted to lithium circulation in the capillary gives rise to parasitic currents, which when added to the measurement current produce a significant noise on the acquired electrical signal. Despite its negative effect, the EMP must in any case be always kept on, otherwise the lithium would be static inside the RM capillary, and the RM output would not be a real-time measurement of the impurity concentration in the flowing lithium.
All of these issues reduce the accuracy of the measurements performed with this instrument and introduce a relevant noise affecting the resistance value.
4. CFD Analysis: Models and Methods
A CFD computational model of the upgraded resistivity meter was built to perform CFD simulations. The general-purpose code ANSYS CFX (V.19.2, Canonsburg, PA, USA) was used for all the numerical simulations presented in this paper [
19].
The code employs a coupled technique, which simultaneously solves all the transport equations in the whole domain through a false time-step algorithm. The linearized system of equations is preconditioned in order to reduce all the eigenvalues to the same order of magnitude. The multi-grid approach reduces the low frequency error, converting it to a high frequency error at the finest grid level; this results in a great acceleration of convergence. Although with this method a single iteration is slower than a single iteration in the classical decoupled (segregated) SIMPLE approach, the number of iterations necessary for a full convergence to a steady state is generally of the order of 102, against typical values of 103 for decoupled algorithms.
The discretization scheme of the convective terms used for energy and momentum equation variables was the high-resolution scheme (second order-like scheme) [
20].
The SST (Shear Stress Transport)
k-ω model by Menter [
21] is extensively used in this paper. It is formulated to solve the viscous sub-layer explicitly and requires several computational grid points inside this latter. The model applies the
k-ω model close to the wall, and the
k-ε model (in a
k-ω formulation) in the core region, with a blending function in between. It was originally designed to provide accurate predictions of flow separation under adverse pressure gradients, but it was applied to a large variety of turbulent flows and is now the default and most-used model in CFX-19 and other CFD codes.
The CFD model developed (
Figure 3) includes the Venturi suction described in the previous paragraph, the U tube capillary (the pipe inner/outer diameter of 3/4.8 mm and the curvature radius of 32 mm were kept from the previous configuration) with the two steel measuring plates (again at a distance of 150 mm from each other) and the air in the box surrounding both the capillary and the main pipe. The RM box is a parallelepiped flat oriented 30 cm long and 10 cm × 6 cm rectangular rounded base. The whole model includes three main domains: the lithium flowing in the RM, the piping steel inside the box and the air inside the RM box. The conjugate heat transfer between lithium, steel and air is set owing to the General Grid Interface (GGI) algorithm that links nodes on different domains (solid and fluid) facing each other. No heat source was included in the RM air box looking for an estimation of the thermal losses.
Liquid lithium properties were implemented as temperature dependent in ANSYS CFX code according to [
22] while air and piping steel were set as constant property materials in the code.
The RM box has a horizontal orientation for limiting the thermal stratification of the air inside it.
On the external surfaces of the air domain, a constant heat transfer coefficient boundary condition of 1.5 W/m2/K was set (considering 30 mm thermal insulator and stagnant outside air) and an outside temperature of 15 °C. Buoyancy forces were set in the air domain (Boussinesq approximation) for heat exchange between the hot pipes and the cold external walls.
Being interested in average thermal-hydraulic results (pressure drop, heat transfer rate, temperature gradients) and not in point values, full convergence of the simulation is declared when all the Root Mean Square (RMS) residuals reach 1E-5 (according to the CFX User Manual [
19] for simulations focused on reliable average quantities but not on detailed point values) and the monitoring points on: lithium pressure drop, thermal loss from air and local velocity values attain a stable value.
Regarding the boundary conditions adopted in the model, it has to be highlighted that the new RM is supposed to be installed inside the future IFMIF-DONES lithium loop. Therefore, its operative parameter will be different from those adopted in Lifus 6 experiments. Unfortunately, a stable definition of the new loop parameters has not been performed yet; thus, two limit cases have been considered here.
The first case assumes the original values set for the IFMIF-DONES plant. These imply a lithium inlet temperature equal to 273 °C (i.e., the same temperature of the plant hot leg, the cold leg being set at 250 °C) and a flow rate of 0.065 L/s (i.e., 10% of the total lithium flow rate trough the ICS, with the residual 90% going through the traps system).
The second case reflects instead the change in the IFMIF-DONES main lithium loop operating parameters, which was proposed to minimize the possible 7Be accumulation inside the loop. The new values for the temperature and the flow rate of lithium entering the RM circuit are, respectively, 330 °C and 0.108 L/s (1/9 of the lithium flow rate through the trap system).
Prior to any CFD case simulation, an appropriate mesh sensitivity analysis was performed. Three different meshes were generated adopting the same mesh strategy but different element sizes. Mesh A has a coarse grid resolution, both in the lithium and in the air domain; it has about 398,000 elements and 294,000 nodes. Mesh B is an average mesh with 1.4 million elements and 866598 nodes. Mesh C has a fine mesh, both in the air and lithium domain; it has 2.65 million elements and 1.87 million nodes.
The first case boundary conditions are imposed on the three meshes for the mesh sensitivity analysis (0.182 m/s inlet lithium velocity, 273 °C inlet lithium temperature, 0 bar relative pressure on the lithium outlet surface).
Different data were compared: the pressure drop across the whole model (Δp), the heat losses through the RM box (Q), the average lithium velocity inside the capillary (u), the average lithium outlet temperature from the capillary (T
out). The general comparison between the meshes is reported in
Table 1. As illustrated in the table comparison, the outlet temperature from the capillary is not affected by the mesh. Heat losses and lithium velocity in the capillary are marginally affected with about 1% difference between coarse mesh A and average mesh B. The most interesting comparison seems to be the total pressure drop across the CFD model that tends to converge between average mesh B and fine mesh C with a percentage difference of 1.6.
Due to the very good convergence of the heat losses, average capillary velocity, outlet temperature and the negligible pressure drop difference (barely measurable or not measurable with the instruments) between mesh B and mesh C, mesh B was selected for all the simulations presented in this paper.
As an insight into the selected mesh B (
Figure 4), the grid is fully structured in the lithium domain (red) and in the capillary pipe, while it is unstructured in the solid domain (grey) that includes the pipes and the measuring plates on the capillary.
For the air domain in the box, the mesh is unstructured with node inflation on the surface boundaries. Other interesting mesh details are reported in
Table 2. Mesh parameters such as skewness, orthogonal quality and aspect ratio are declared excellent for the structured domain lithium and good for the tetrahedral/unstructured domains air and steel [
19].
5. Results and Discussion
5.1. First Case: Boundary Conditions and Results
The boundary conditions imposed are:
Inlet lithium temperature: 273 °C.
Inlet lithium flow rate: 0.065 L/s, corresponding to an average inlet velocity of 0.182 m/s.
Relative pressure at the outlet: 0 bar.
The first parameter to assess in the post-processing phase is the pressure drop of the upgraded component. As we can see in
Figure 5, the overall pressure drop is about 308 Pa (3 mbar), but it is not possible to calculate from the contour plot the different contributions due to the variation of the kinetic/hydrostatic energy component in the pipes. Considering both the pressure and the kinetic energy variation in the lithium between two generic sections
i and
j, it is possible to obtain the pressure drop ∆
p with the following expression (Bernoulli equation):
where
pi (
pj) is the pressure on the generic section i (
j),
is the lithium density and
vi (
vj) is the lithium velocity. It was found that:
111.2 Pa (36% of the total pressure drop) is lost in the sudden flow area reduction;
54.6 Pa (18% of the total pressure drop) is lost in the ¼ ̎ pipe;
142.1 Pa (46% of the total pressure drop) is lost in the 10° enlargement and in the outlet section.
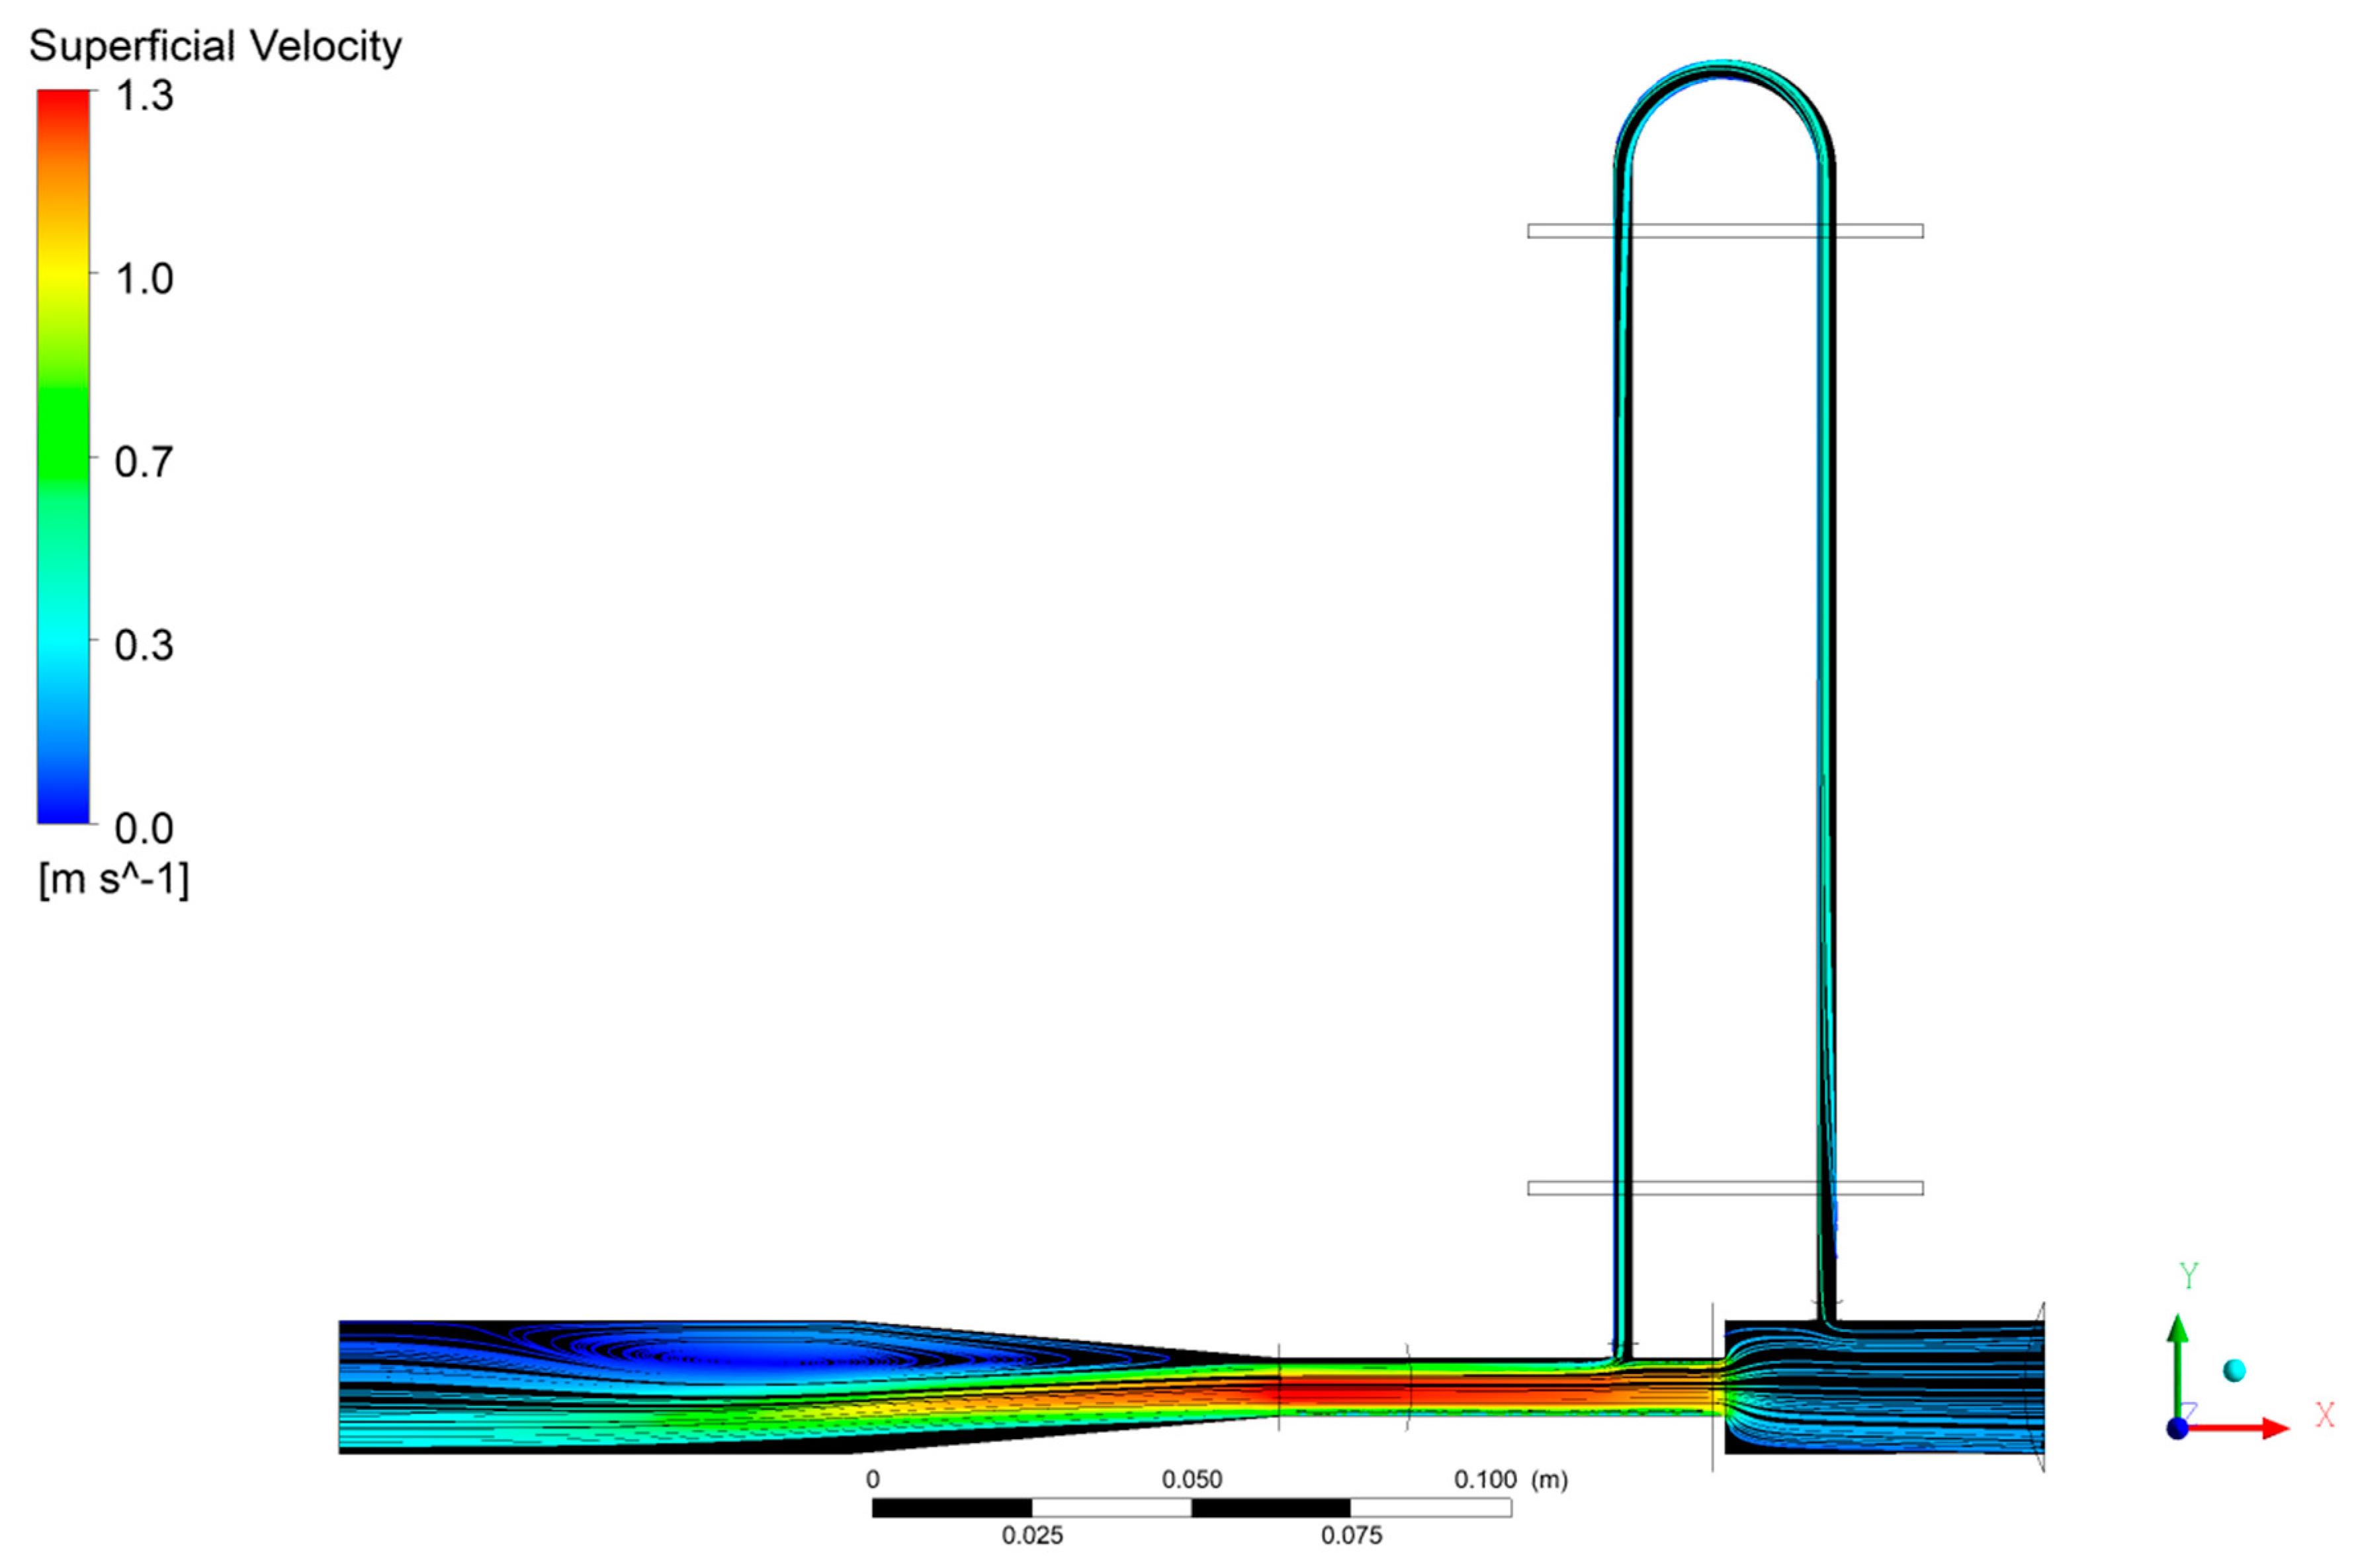
Concerning the velocity field inside the lithium fluid, it must be highlighted that:
The maximum lithium velocity is 1.3 m/s, and it is reached in the ¼ ̎ pipe (
Figure 6).
The average lithium velocity inside the capillary pipe is around 0.35 m/s, meaning that lithium takes about 1 s to fully travel it (in this way, the 1 Hz sampling frequency of the measurement device is kept).
There is a long vortex near the outlet section due to the entrain of lithium from the capillary.
It must be highlight that the pressure drop inside the model is mainly concentrated in the 10° enlargement section due to the lithium entrainment from the capillary and the recirculation vortex produced (
Figure 6). The only possible way to reduce this effect would be to increase the ¼ ̎ pipe length downstream of the capillary to reach a fully developed flow (at least tripling the current length), but this solution would increase both the pressure drop inside the ¼ ̎ pipe and the resistivity meter length, obtaining a negligible effect on the total pressure drop.
Regarding lithium velocity, the maximum lithium velocity inside the model (1.3 m/s) is not a concern for the IFMIF-DONES loop, where the average lithium velocity in the main loop is 5–6 m/s.
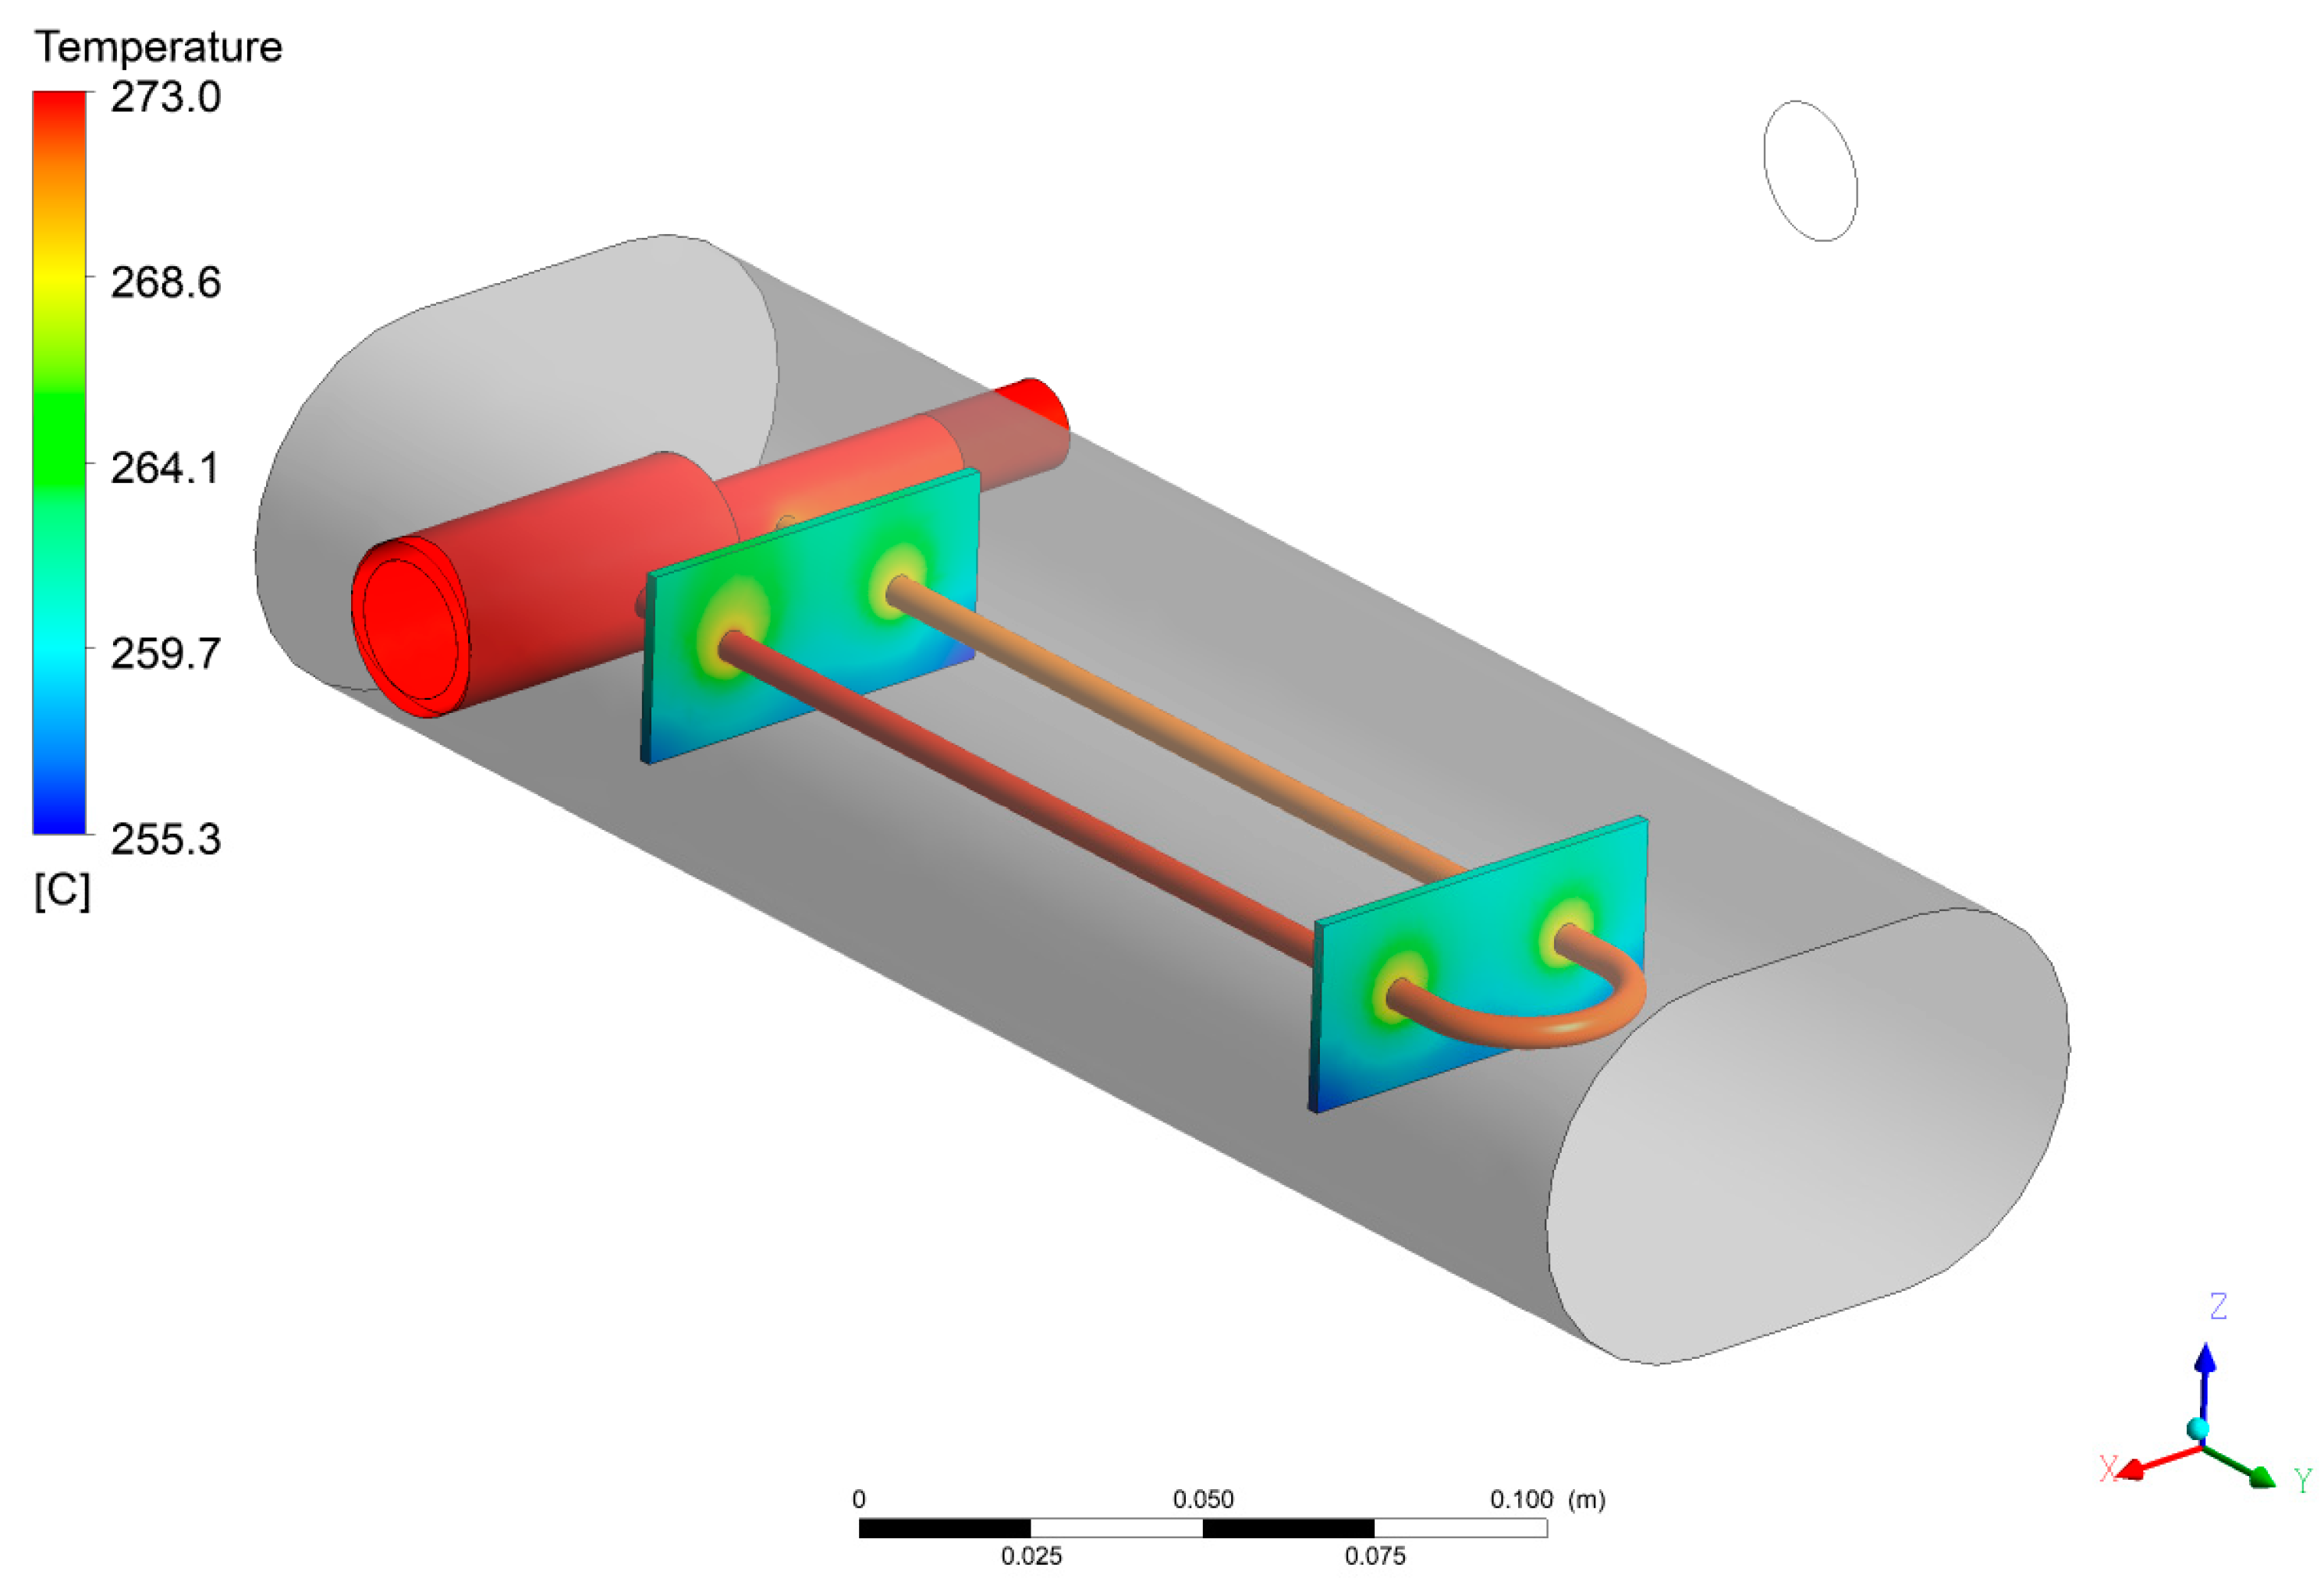
Regarding the temperature field (
Figure 7), the lithium flowing inside the main pipe (Venturi suction) is kept at the inlet temperature, while the lithium flowing in the capillary loses about 2 °C because of the thermal losses in the box.
The higher lithium cooling inside the capillary has two root causes: one is the reduced dimensions of the capillary pipe that give rise to a remarkable volume to surface ratio for the lithium flowing inside, the other is due to the two measuring plates along the capillary that act as thermal bridge enhancing the heat exchange like a finning surface (
Figure 8).
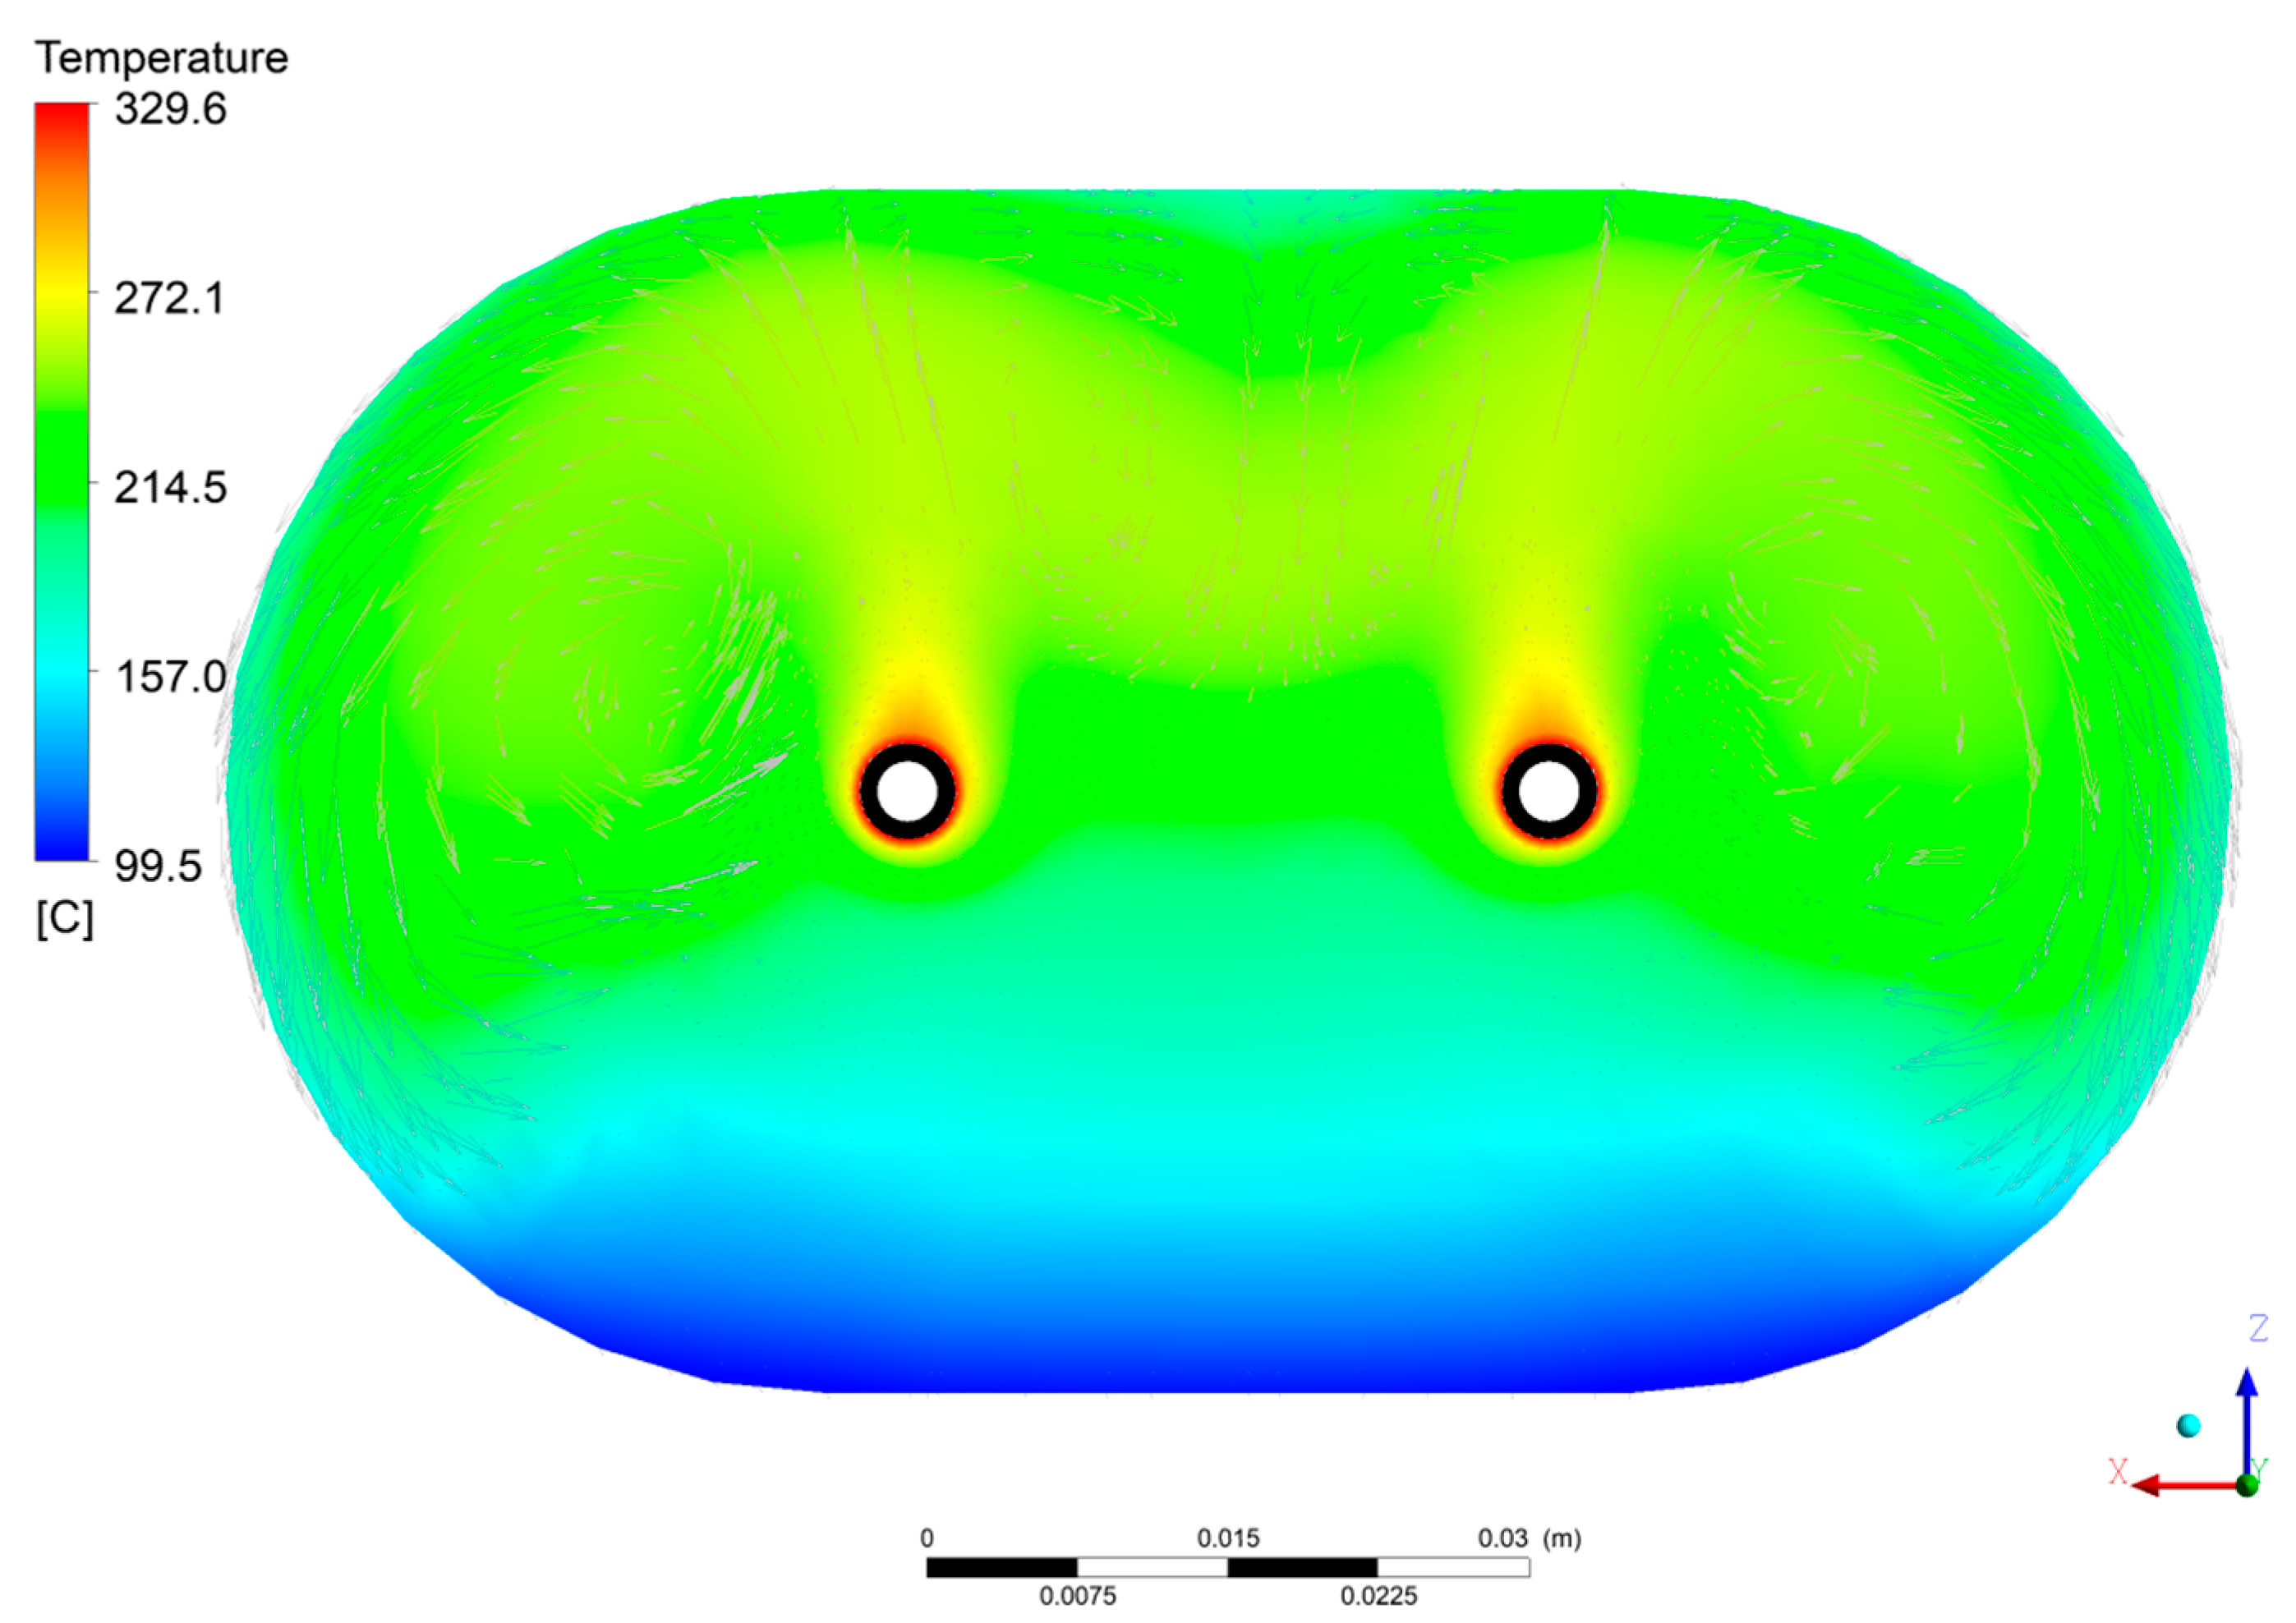
Regarding the temperature field in the air domain, the temperature contour of
Figure 9 highlights a high temperature gradient from 82 °C on the lower surface to about 170 °C on the upper one; this remarkable temperature gradient is a perfect example of how natural circulation works. In the upper air region, the buoyancy forces produce air convective vortices over the capillary (granting a temperature mixing), while the lower air volume under the capillary is stagnant because the cold box surface is under the hot capillary and natural circulation cannot take place.
Owing to its horizontal orientation, the capillary pipe is surrounded by a constant temperature of about 175 °C that avoids an uneven heat exchange along the capillary (one of the issues of the previous configuration characterized by a vertical capillary).
The heat losses, mainly concentrated in the upper surface of the box, are estimated as 18 W.
The small heat losses do not require any heating element inside the box; however, a heating cable or infrared device should be installed in the box for the pre-heating (start-up) phase of the facility to avoid lithium freezing inside the capillary.
5.2. Second Case: Boundary Conditions and Results
The boundary conditions imposed in this case are the following:
Inlet lithium temperature: 330 °C.
Inlet lithium flow rate: 0.108 L/s, corresponding to an average inlet velocity of 0.303 m/s.
Relative pressure at the outlet surface: 0 bar.
The total pressure drop of the resistivity meter is about 777 Pa. Applying Equation (1) as in the previous case, it was found that (
Figure 10):
301.3 Pa (39% of the total pressure drop) is lost in the sudden flow area reduction;
If we compare first case and second case pressure drop results, it is possible to preliminarily assess the hydraulic behavior of the component. A velocity/mass flow increase (from 0.182 m/s to 0.303 m/s) through the resistivity meter leads to a redistribution of the percentage pressure drop contributions inside the component. The sudden flow area reduction percentage increases (+3%) against the 10° enlargement one, perhaps because it is more sensitive to mass flow variation, while the distributed pressure loss in the ¼ ̎ pipe keeps the same percentage contribution.
Moving to the velocity field inside the lithium fluid (
Figure 11), the folowing must be highlighted:
The maximum lithium velocity inside the model is 2.1 m/s, and it is reached in the ¼ ̎ pipe;
The average lithium velocity inside the capillary pipe is around 0.64 m/s (twice the value of the previous settings), determining half the residence time inside the capillary (0.5 s) if compared to the first case velocity;
As in the previous case, there is a long vortex near the outlet section due to the entrain of lithium from the capillary.
As previously mentioned, the 2.1 m/s peak velocity inside the ¼ ̎ pipe is not a concern for erosion and corrosion issues for the IFMIF-DONES due to the low lithium velocity inside the capillary (0.64 m/s). This second case set-up shows a favorable effect on the measuring device granting a better lithium sampling; in fact, by keeping the 1 Hz sampling frequency of the current RM configuration, it is possible to always measure a different lithium sample in a normal operation phase.
Regarding the temperature field (
Figure 12), lithium flowing inside the main pipe (Venturi suction) keeps its inlet temperature, while lithium flowing in the capillary experiences about 1.5 °C decrease because of the thermal losses in the box, 25% less if compared with previous results but with a higher velocity (mass flow) through the capillary. As for the previous case, in
Figure 12 one can clearly observe, from the contour bands across them, the thermal effect of the steel plates on the flowing lithium enhancing thermal losses to the surrounding air.
As for the temperature field in the air domain, the temperature contour of
Figure 13 highlights a high temperature gradient (104 °C, +18% increase), ranging from 96 °C on the lower surface to about 200 °C on the upper one. This higher gradient is mainly due to the higher lithium circulation temperature (imposed as a boundary condition) inside the instrument that generates a better natural circulation of heat transfer with the upper “cold” surface of the box; this phenomenon increases the upper air temperature, while it has only minor effect on the lower air temperature because no circulation takes place here. In conclusion, the thermal gradient increase inside the box is not symmetric but unbalanced towards the hot region.
The heat losses mainly concentrated in the upper surface of the box (due to the natural circulation of air in the upper air region) are estimated as 19.4 W (7% more than the previous test case); this is due to the combination of three opposed effects (compared to the first case): the higher velocity inside the capillary, the lower density due to the higher inlet/circulation temperature, the lower temperature difference across the capillary.
6. Conclusions
The purity of liquid lithium flowing inside a loop pipe is of primary importance, especially in fusion applications such as the IFMIF-DONES plant, due to corrosion issues on contact surfaces. An appropriate device called the “Resistivity Meter” was developed by the University of Nottingham and procured by ENEA to monitor lithium impurities in Lifus 6 loop. Unfortunately, the device has shown some measuring issues during its operation that reduce its accuracy and introduce relevant background noise.
An upgrade strategy is proposed in this paper to overcome the aforementioned problems, and a CFD assessment of the fluid-dynamic behavior of the new layout was developed. Without fixed parameters for the boundary condition of the device, two limit cases have been considered: a low mass flow and low temperature case (first case) and a high mass flow and high temperature case (second case).
The CFD simulations of both the situations have demonstrated that it is possible to move lithium through the capillary measurement without using a dedicated electromagnetic pump upstream of the capillary. This will permit one to suppress the noxious noise introduced by the pump on the resistivity meter signal, which was largely evidenced with the old configuration. The resulting lithium speed inside the capillary is, in both cases, largely enough to completely replace all the lithium inside the capillary during the time span between two successive signal acquisitions (set as 1 s).
The comparison of the two simulation results was also adopted as sensitivity analysis to better understand the component behavior with different lithium mass flow and inlet temperature. Regarding mass flow, the comparison highlighted that the sudden flow restriction placed at the inlet is more sensitive to the mass flow variation if compared to the 10° enlargement placed at the outlet. As for temperature sensitivity, the comparison points out that an inlet temperature increase leads to a higher non-symmetric thermal gradient (+18%) inside the air box.
The simulations have additionally shown that during the operations there is no need to employ an external heating element to keep the proper lithium temperature inside the capillary.
Since the residence time of lithium will be very short (about 1 s or 0.5 s, depending on its flow rate), its thermal losses will be limited to about 2 or 1.5 °C and will be constant over time, provided a good thermal shielding of the RM box may be assured.
Nonetheless, an external heater will be necessary and employed in the following situations:
During the resistance measurement of the steel capillary alone, i.e., when the capillary has not been filled by lithium yet. In this situation, in fact, due to the absence of lithium, it is necessary to employ an additional heating in order to measure the resistance variation of the steel at the relevant temperature;
During the first filling with lithium to avoid its freezing inside the pipe;
Similarly, after stopping lithium circulation inside the capillary, the lithium will probably remain trapped inside the capillary (due to its narrow section, a complete draining cannot be assured), and then it cools down at room temperature to a solid state. When the RM restarts, the external heaters will be necessary in order to melt this trapped lithium and avoid the incoming liquid fluid finding a solid clog blocking its circulation.


