Article

A Flow Rate Dependent 1D Model for Thermally Stratified Hot-Water Energy Storage

1
Multifunctional Equipment Research Group, Oak Ridge National Laboratory, Oak Ridge, TN 37830, USA
2
Department of Mechanical and Industrial Engineering, Texas A&M University Kingsville, Kingsville, TX 78363, USA
3
Southwest Research Institute, San Antonio, TX 78238, USA
4
Argonne National Laboratory, Lemont, IL 60439, USA
*
Author to whom correspondence should be addressed.
Energies 2021, 14(9), 2611; https://doi.org/10.3390/en14092611
Submission received: 31 March 2021 / Revised: 29 April 2021 / Accepted: 30 April 2021 / Published: 2 May 2021
(This article belongs to the Special Issue Heat Transfer, Refrigeration and Heat Pumps)

Abstract

:
Stratified tank models are used to simulate thermal storage in applications such as residential or commercial hot-water storage tanks, chilled-water storage tanks, and solar thermal systems. The energy efficiency of these applications relates to the system components and the level of stratification maintained during various flow events in the tank. One-dimensional (1D) models are used in building energy simulations because of the short computation time but often do not include flow-rate dependent mixing. The accuracy of 1D models for plug flow, plug flow with axial conduction, and two convection eddy-diffusivity models were compared with experimental data sets for discharging a 50-gal residential tank and recharging the tank with hot water from an external hot-water source. A minimum and maximum relationship for the eddy diffusivity factor were found at Re <2100 and >10,000 for recirculation of hot water to the top of the tank and vertical tubes inletting cold water at the bottom. The root mean square error decreased from >4 °C to near 2 °C when considering flow-based mixing models during heating, while the exponential decay of the eddy diffusion results in a root mean square error reduction of 1 °C for cone-shaped diffusers that begin to relaminarize flow at the inlet.

1. Introduction

The study aimed to identify a flow-rate dependent 1D thermally stratified tank model for building energy simulations that compute faster than 3D models. These 1D models can still include the mixing flow dynamics related to the inlet turbulence. In the search for 1D models, many approaches have been taken and been successful for their specific geometry, water temperature, inlet device, and flow rate. To avoid numerical diffusion in the stratified region that can match the physics based mixing due to internal waves, an explicit eddy diffusion model was selected. For the most robust 1D models, nondimensional base models were reviewed in detail as they contain the many physical parameters mentioned above. Within the 1D nondimensional models, at least 11 nondimensional numbers were found to affect the performance of thermally stratified sensible storage; these were Archimedes, Aspect Ratio, Atwood, Biot, Froude, Grashof, Peclet, Rayleigh, Reynolds, Richardson, and the stratification number [1]. There are many valid choices of nondimensional numbers or combinations of numbers to model thermally stratified flows with a 1D equation. The complexity is in choosing valid nondimensional numbers to develop correlations for a robust range of flow-rates experienced in hot-water tanks (e.g., 0.5 GPM to 3 GPM).
This manuscript validates a new correlation for the modeling of a vertical tube with outlets below a thermocline and shows that the mixing decay as a function of height is specific to the geometry vertical tube outlet: Notably, hyperbolic decay for outlets that create local turbulence and mixing; and exponential decay for outlets that relaminarize the flow.

1.1. Literature Overview

Models for hot-water tanks have been studied by many authors over the past half-century, and a few successful approaches are the momentum decomposition based on buoyancy and jet momentum by Steinert et al. [2], discharge efficiency by Lavan and Thompson [3], maximum analytical efficiency of stratification by Homan [4], and exergy-based analysis for cooling of a cylindrical tank, which found that a 1:1 aspect ratio had the highest exergy efficiency, Bai et al., [5]. Njoku et al. [6] reviewed energy and exergy modeling methods in which the entropy generation number was suggested as being superior to energy-based modeling. Wang et al. [7] included phase change material (PCM) balls into a solar tank and quantified the exergy efficiency for various laminar flow rates. A similar study by Huang et al. [8] examined the supercooling of PCM balls. In a large-volume cold storage study, Lake and Rezaie [9] found the inlet turbulence shown by the Richardson number to be very small, and the Peclet and Fourier numbers adequately predicted the stratification behavior in a cold storage tank.
The Archimedes number quantifies the external body forces to the internal viscous forces. Kaloudis et al. [10] used the number to describe a large underground stratified storage. In a rectangular tank, the Archimedes number was used by Kursen and Okten [10] to describe the stratification enhancement based on the tank position. Spall [11] used the Archimedes number to study a cylindrical thermal storage tank under laminar flow rates. Jordan and Furbo [12] used the number to model a small solar hot-water system, and Bahnfleth [13] the same for laminar flow rates in a chilled-water tank. Kaloudis et al. [14] used the number (in a rectangular thermal storage tank) within a large eddy simulation that tracked the eddy diffusion in a separate term, which allowed for turbulent flow rates to be modeled. Similarly, Garbrecht [15] studied various heated plate orientations using the Archimedes number in a large eddy simulation that included turbulent regimes. The Archimedes number has seen a wide range of applications. Using the Archimedes number to describe flow in a stratified tank assumes that the stratified region behaves as a bluff body, which appears to be true for only laminar cases, or in the unique models in which the internal waves are handled elsewhere (e.g., large eddy simulations).
The Atwood number quantifies the density difference to that of the sum of the fluid densities. Matulka et al. [16] used the number to quantify the initial state of a stratified tank before the inclusion of entrainment. Tinaikar et al. [17] used the Atwood number in a model to include successive laminar vortex pairs in which the Atwood number described the stratification strength. The Atwood number includes less information than the Archimedes and is simpler to calculate.
The Biot number can be used as a check to determine if heat losses are significant [18]. It is also essential when the conductivity of the fluid is high, such as in the case of thermal oils [19]. A modified Biot number was used in a parametric study of chilled-water storage by Nelson et al. [20] to determine the axial convection to the conduction wall conduction.
The Froude number is also a popular choice for the 1D modeler [21]. The Froude number in the densiometric form is mathematically related to the Richardson number [22]. Furthermore, when the Grashof is combined with the Reynolds, it forms the Richardson number or the Froude number. The Grashof number was an early choice for modeling thermally stratified water tanks by Lavan and Thompson [3], as well as the natural convection inside of a tank due to convection losses [10] during periods of no bulk flow.
The Peclet number can be used to relate the internal convection to the conduction heat transfer for laminar flows [23]. The modified Peclet number can also be used to model additional convection in the stratified region compared with the conduction in the water [24], which is similar to a convection eddy-diffusivity (CED) model and might be considered a turbulent Peclet relationship.
A review of the 11 numbers showed Richardson and Reynolds numbers to be the most applicable for the flow rates, insulation level, and aspect ratio of most commercial and residential hot-water tanks [1]. The Richardson number contains the Archimedes number’s information and flow-based information (e.g., velocity gradient). The Richardson number is used extensively throughout tank stratification models, but definitions vary widely for length scale, locations of property evaluation (e.g., thermal diffusivity, temperature), and most importantly, the velocity of inlet or vertical bulk flow [25].
Further convoluting the applicability of using nondimensional numbers, in the extensive review, the vertical-tube inlet’s (VTI’s; dip-tube’s) effect on thermal stratification is rarely mentioned. Only Cole and Bellinger [26] wrote that dip-tubes (VTIs) negatively impact thermal stratification. Recent comparisons of two different 1D models showed variations in their predicted accuracy [27]. Furthermore, the 1D models tended to lack the addition of a thermocline layer (or the formation of one), resulting in a drift from the actual size of the thermocline in space or time. Therefore, we conclude that the addition of eddy diffusivity could improve the model’s predictions.
Previous reviews of 1D models have also been conducted over the past 30 years. Kleinbach et al. [28] reviewed stratified tank models from the 1970s to 1990. In 1991, Zurigat et al. [29] focused on the inlet mixing in tank models. Han et al. [30] reviewed stratification in solar hot-water systems due to variable radiation. Recent experimental work has been carried out to inform better 1D models and nonstandard hot-water tanks, such as coil-wrapped tanks with stratification remarks by Gluesenkamp and Bush [31], as well as coil-wrapped tank with 3D modeling by Elatar et al. [32]. 1D modeling efforts of the system and components of a heat pump water heater was introduced by Shen et al. for Energy Plus [33] and then improved for stratified tanks [34] and finally a hardware-based model in 2019 [35]. Further examples include optimization of new refrigerants in wrapped heat pump water heaters Nawaz et al. [36,37], immersed coils for both hot and cold loops Rahman [38], for supercritical coiled heat exchangers Paradis et al. [39], for with improved tank geometry Padovan et al. [40], and sensible and latent tanks for metal hydride hydrogen storage Ye et al. [41], with microencapsulated PCM Neri et al. [42], and with PCM studied from the viewpoint of enthalpy Ahmed et al. [43]. Recent 1D stratified tank models include Lago et al. [44], for a large-scale tank with different horizontal inlets and charge/discharge configurations and various packed bed configurations Raccanello et al. [45]. The EnergyPlus model was based on an implicit scheme by Duffie and Beckman [46] and is used for many longitudinal studies of building energy performance. The review of the literature shows many valid approaches for 1D stratified tank modeling and a gap for modeling vertical tube inlets at variable inlet flowrates that accounts for the mixing in the lower portion of the tank and additional mixing in the thermocline region due to turbulent eddies developed at the tube outlet.

1.2. Findings

Ten sets of experimental data were compared with two 1D models from the literature and two convection eddy diffusion (CED) models. Five different VTIs were used during discharge to test the models in the literature and to develop a new correlation for eddy diffusivity as a function of height. The correlation for hot-water tanks being externally charged with the hot-water entering the top of the tank was also compared with the CED models. The comparison was made by calculating the root-mean-square error between the model and the experimental data.
The major findings of this work are that CED models are more accurate than explicit plug-flow models for charging and discharge of hot-water storage tanks. Within the CED models, the accuracy can be modified by selecting hyperbolic or exponential decay of eddy diffusion based on the inlet type. The exponential CED model decays the eddy turbulence quicker and is more accurate for a diffuser that aims to relaminarize the inlet flow. The accuracy of plug-flow and CED models decreases significantly when cold water enters above the thermocline. This work adds correlations for the charge cycle of hot-water tanks for empirical models started by Oppel et al. [47] for stratified water tanks.
The study also compares experimental data to the modeled eddy diffusivity decay relationships specific to modern vertical inlet devices used in commercial and residential hot-water storage and shows the CED models to be more accurate and robust because the mixing during the charge and discharge cycle is a flow rate dependent phenomenon not captured accurately in most 1D simulations.

2. Materials and Methods

The governing equation for the model further developed in this work is the eddy diffusion equation (Equation (1)), which accounts for eddy heat flux (turbulent mixing due to eddies) in the energy equation. For 1D flows into quiescent fluid and the empirical factor, eddy diffusivity factor (EDF) for the inlet was established in Equation (2) by Oppel et al. [47]. The combination of Equations (1) and (2) is shown in Equation (3). With the additional term of heat lost to the environment for the time step period, Equation (3) is the general equation used for the CED models used in this paper.
v T ¯ y = y [ ( α + H ) T ¯ y ]
E D F = ( α + H ) α = A ( R e R i ) B
v T y = α   E D F   2 T y 2   losses   ( d t )
The ε inlet is calculated once based on an initial overall Richardson number for the tank and decayed by a hyperbolic, linear, or exponential function [47,48]. The average heat loss power ( U A ) was measured over 12 h for a tank that was initially at 57 °C for use in Equation (3).
This model handles the inlet mixing by decreasing the eddy diffusion by an exponential factor away from the inlet of the heating source and similarly during a draw from the cold source. The equation used in the modeling is the turbulent eddy diffusion/convection equation. The eddy diffusion factors are significantly different between the source heating loop and the draw loop, and both eddy diffusion factors follow exponential allometric relationships based on the Reynolds number divided by the Richardson number [25].
The experimental work tested 45 flow rates with Reynolds (Re) numbers ranging between 170 and 22,300, as well as Richardson (Ri) numbers between 0 and 376. For Richardson numbers greater than 5, the tank was characterized as stable, and the best correlations were found at 2300 < Re < 10,000 and Ri > 5 for the VTIs. In total, 9 VTIs were characterized for the CED model. Four were modeled in this paper to show the difference in the turbulent diffusion and accuracy based on tube location [25]. For solving for inlet ε from empirical data [25], a smoothing function was used over 5 points in space for data taken every section to calculate the first and second derivatives. For the simulation, the previous temperature solution was used in an explicit method that stepped a Courant number equal to 1 for the ε model that decreases ϵ i n l e t by 1/ n to exponent B for heating and 1/ ( N n ) to the exponent 1/ B for draws. The Δ t associated with the first step was larger for the first and last space step to match the temperature probe layout of the experimental setup shown in Figure 1 with 0.5 °C instrument error—when all instrument and statistical error was propagated for the setup the uncertainly was less than 4% [1,25]. The temperature measurements were 16 thermocouple probes strung vertically through the center of the tank. The probes have a very small thermal mass to reduce errors when measuring the temperature in hot-water tanks [49].
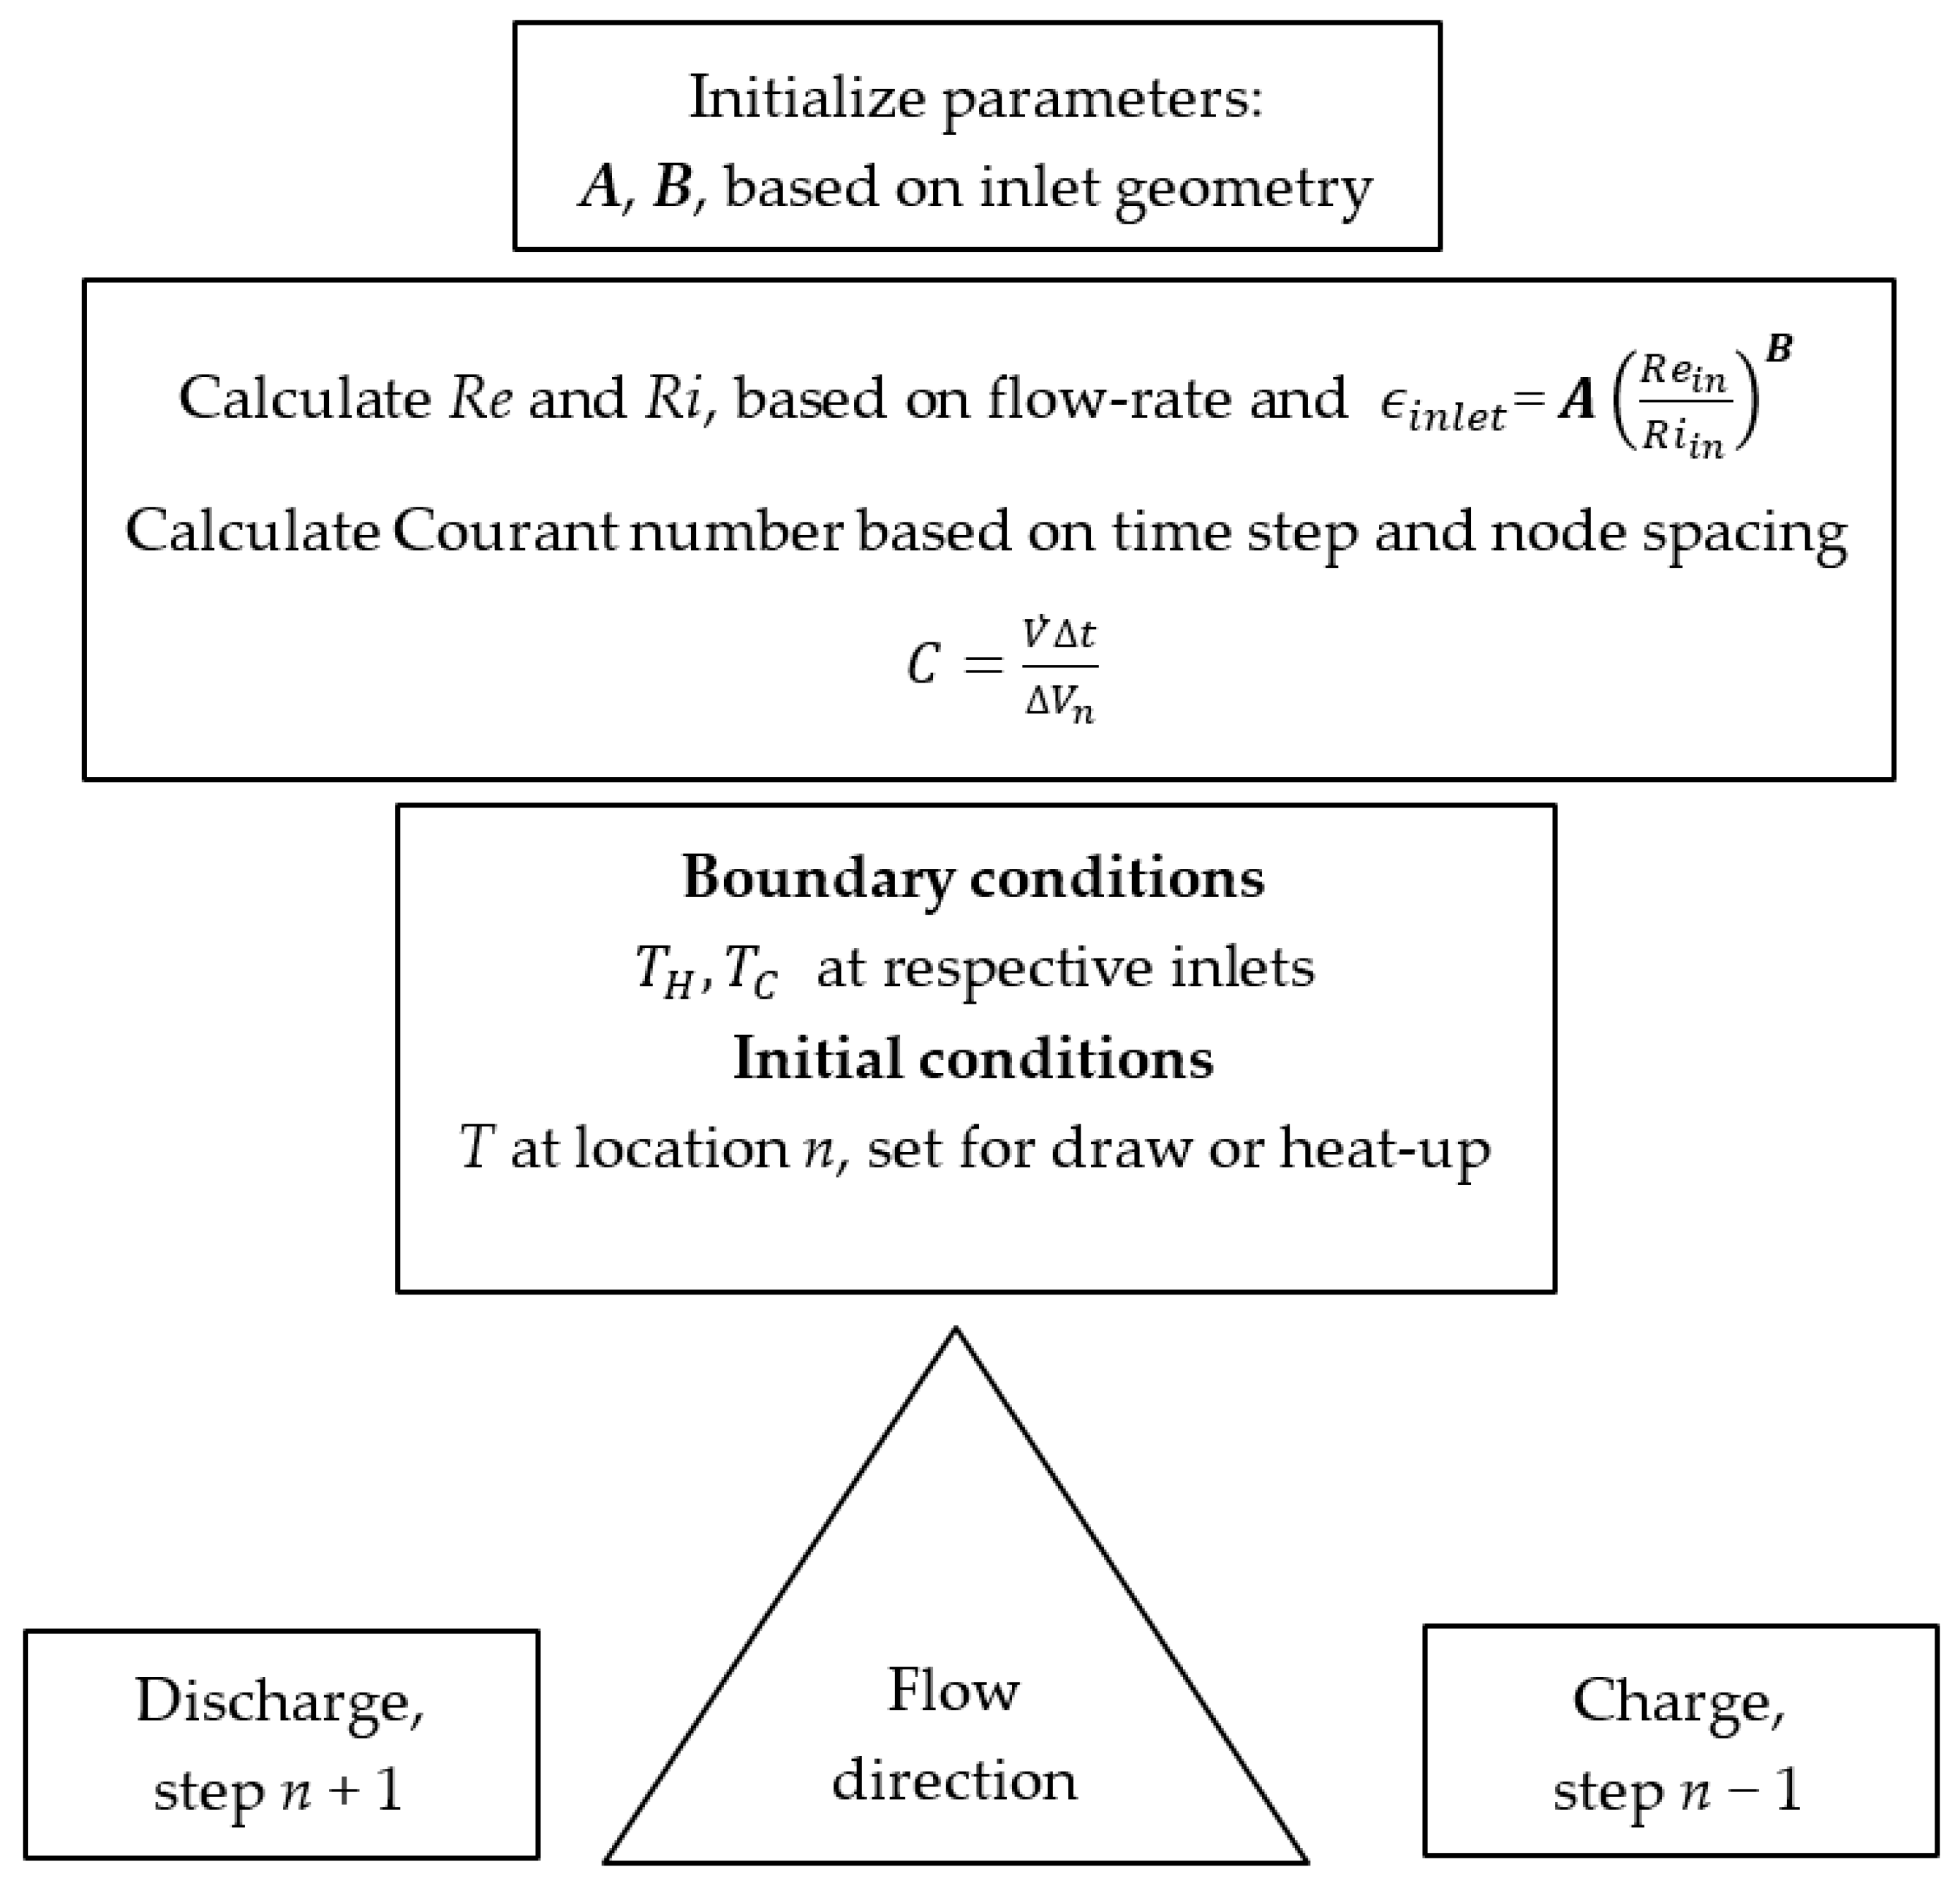
The model is a quasi-steady-state for ε values as a function of height, explicit or forward Euler in time, and central-difference in space model called the “convection ε-diffusion model”. The computational flow diagram is as follows for the charge and discharge conditions shown in Figure 2. The model steps one equal volume increment n, which correlates to a temperature measurement location.
The pseudo-code for the new temperature in time and space, T n , t is shown in Equation (4) for discharge and Equation (5) for charging of the hot-water tank with exponential decay. The exponential factor B from the ϵ i n l e t is used in the exponential decay; the hyperbolic decay relationship can be found from Oppel [47].
T n , t = V ˙ Δ t Δ V n T n + 1 , C 1 + V ˙ Δ t Δ V n ϵ i n l e t ( 1 N n ) 1 / B α ( T n , C 1 2 T n + 1 , C 1 + T n + 2 , C 1 ) / Δ y 2 U A n ( T n + 1 , C 1 T a m b )   Δ t
T n , t = V ˙ Δ t Δ V n T n 1 , C 1 + V ˙ Δ t Δ V n ϵ i n l e t ( 1 n ) B α ( T n , C 1 2 T n 1 , C 1 + T n 2 , C 1 ) / Δ y 2 U A n ( T n 1 , C 1 T a m b )   Δ t
The first term on the right-hand-side of either equation is the advection term without mixing. The second term is the initial ε from the inlet, decayed by the exponential relationship of distance (e.g., node number n) from the empirical fitting parameter B [25], all multiplied by the linearized second derivative with respect to space. Finally, the third term is an average heat loss for the node volume. The third term is a very small number because the average temperature loss is 0.006 °F/min for the highly insulated tank used for the test. This simple yet robust model allows tracking the actual thermocline thickness at the fastest time step allowed with explicit schemes for charging and discharging of a stratified hot-water tank with different vertical inlets.

3. Results

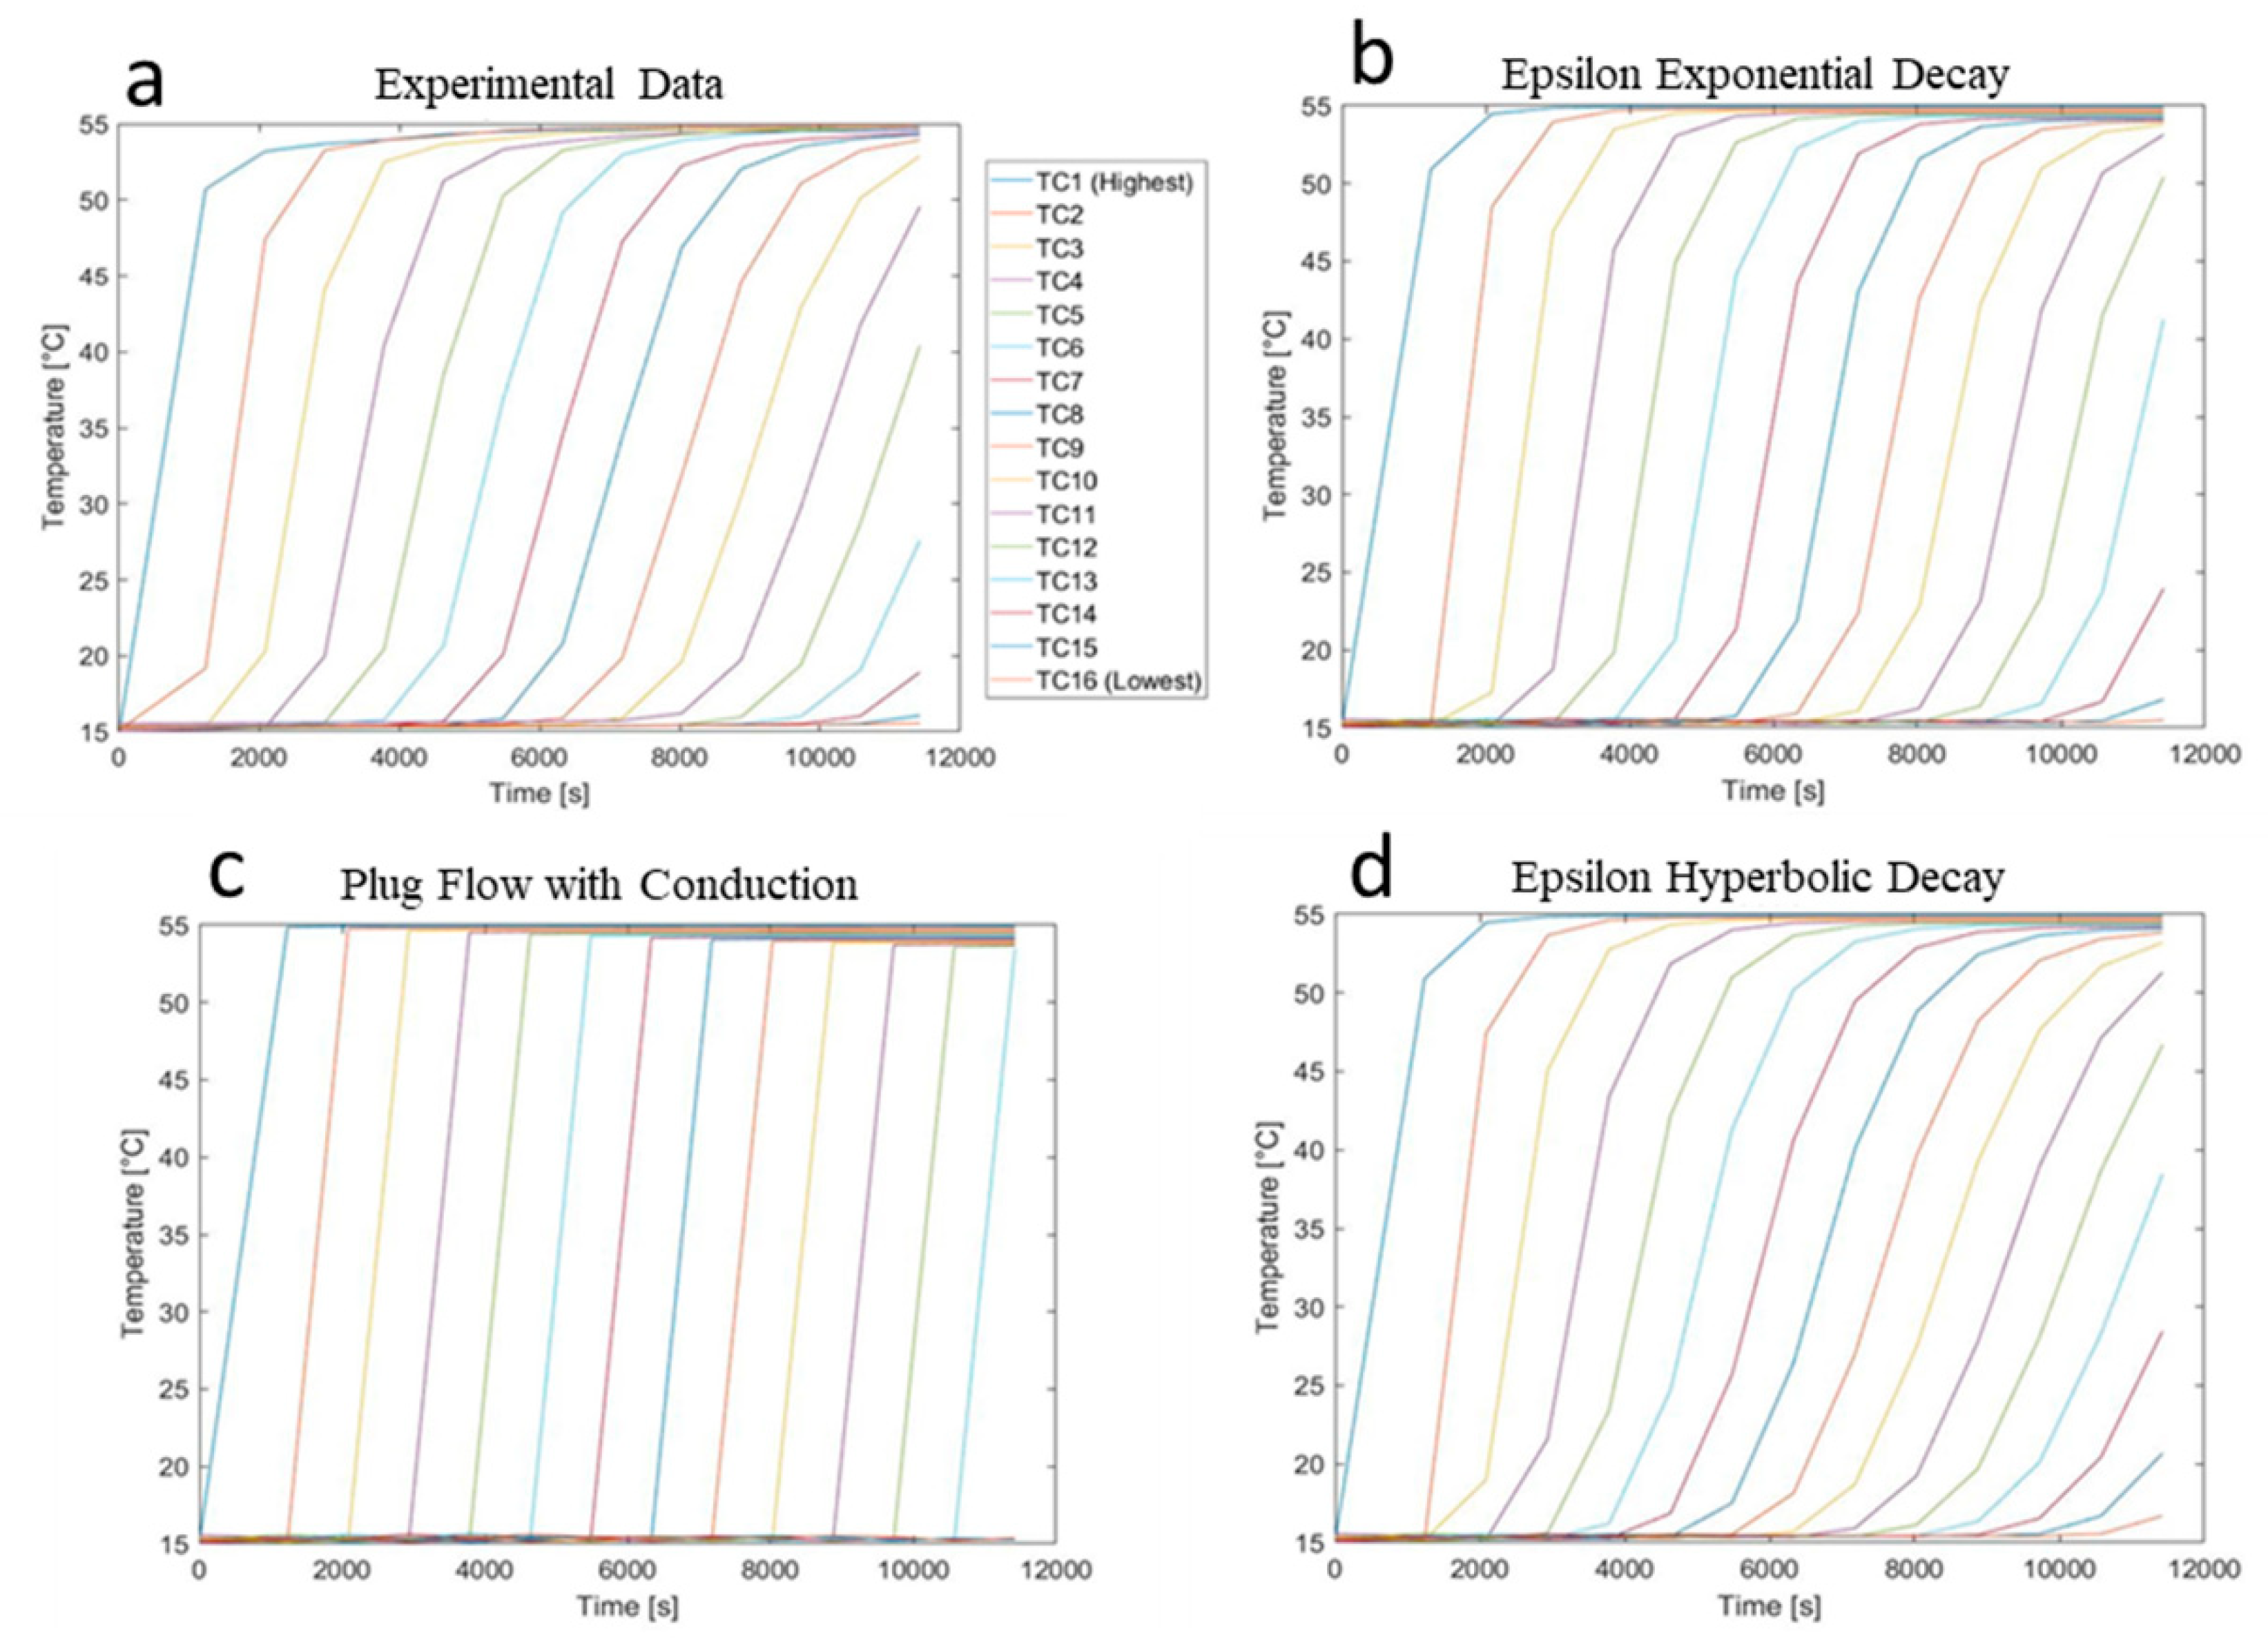
The results compare two classic plug-flow results to two convection eddy-diffusivity models that decrease the eddy diffusivity as a function of height, in either a hyperbolic or exponential method the tank is discharging or being recharged by an external heat source. The experimental apparatus is described by Rendall [1] and shown in Figure 1. Four of the heat-up experiments were used for validating the source heating correlations. To determine the factors A and B (Equation (2)) for the heat-up experiments, one data set was used when the flow rate was varied randomly for five flow rates between 0.1 and 1 GPM. The 1 GPM flow was omitted from the curve fit because a maximum eddy conductivity factor was reached; also, data were removed below 0.15 GPM because a minimum eddy conductivity factor was reached Figure 3 shows the typical trends and the fit data for the source heating experiments). The Reynolds number at the tube inlet was equal to 2300 for a flow rate of 0.12 GPM. Thus, the flat lines below could be because the flow in the tube is laminar. At 0.9 GPM, the flow inlet Reynolds was 16,000 and was expected to be approaching fully developed turbulence.
The Reynolds numbers for the source heating were lower than about 3200 for a round pipe, resulting in a flat line, or no correlation to Re/Ri. Similarly, at a Re of about 16,000 where the maximum Epsilon factor (or EDF) was experienced, no further relationship to Re/Ri was observed. The typical trend of a maximum EDF was also seen with some VTI devices delivering cold water to the bottom of a tank in research from Rendall et al. [25].
Table 1 shows the fitted parameters for the selected fit range where V ˙ is the volumetric flow rate. If fitting all the data, which includes flat lines below 0.15 GPM and above 1 GPM, fitting parameters A and B become 687 and 0.294, respectively, which does not represent a significant change in the model.
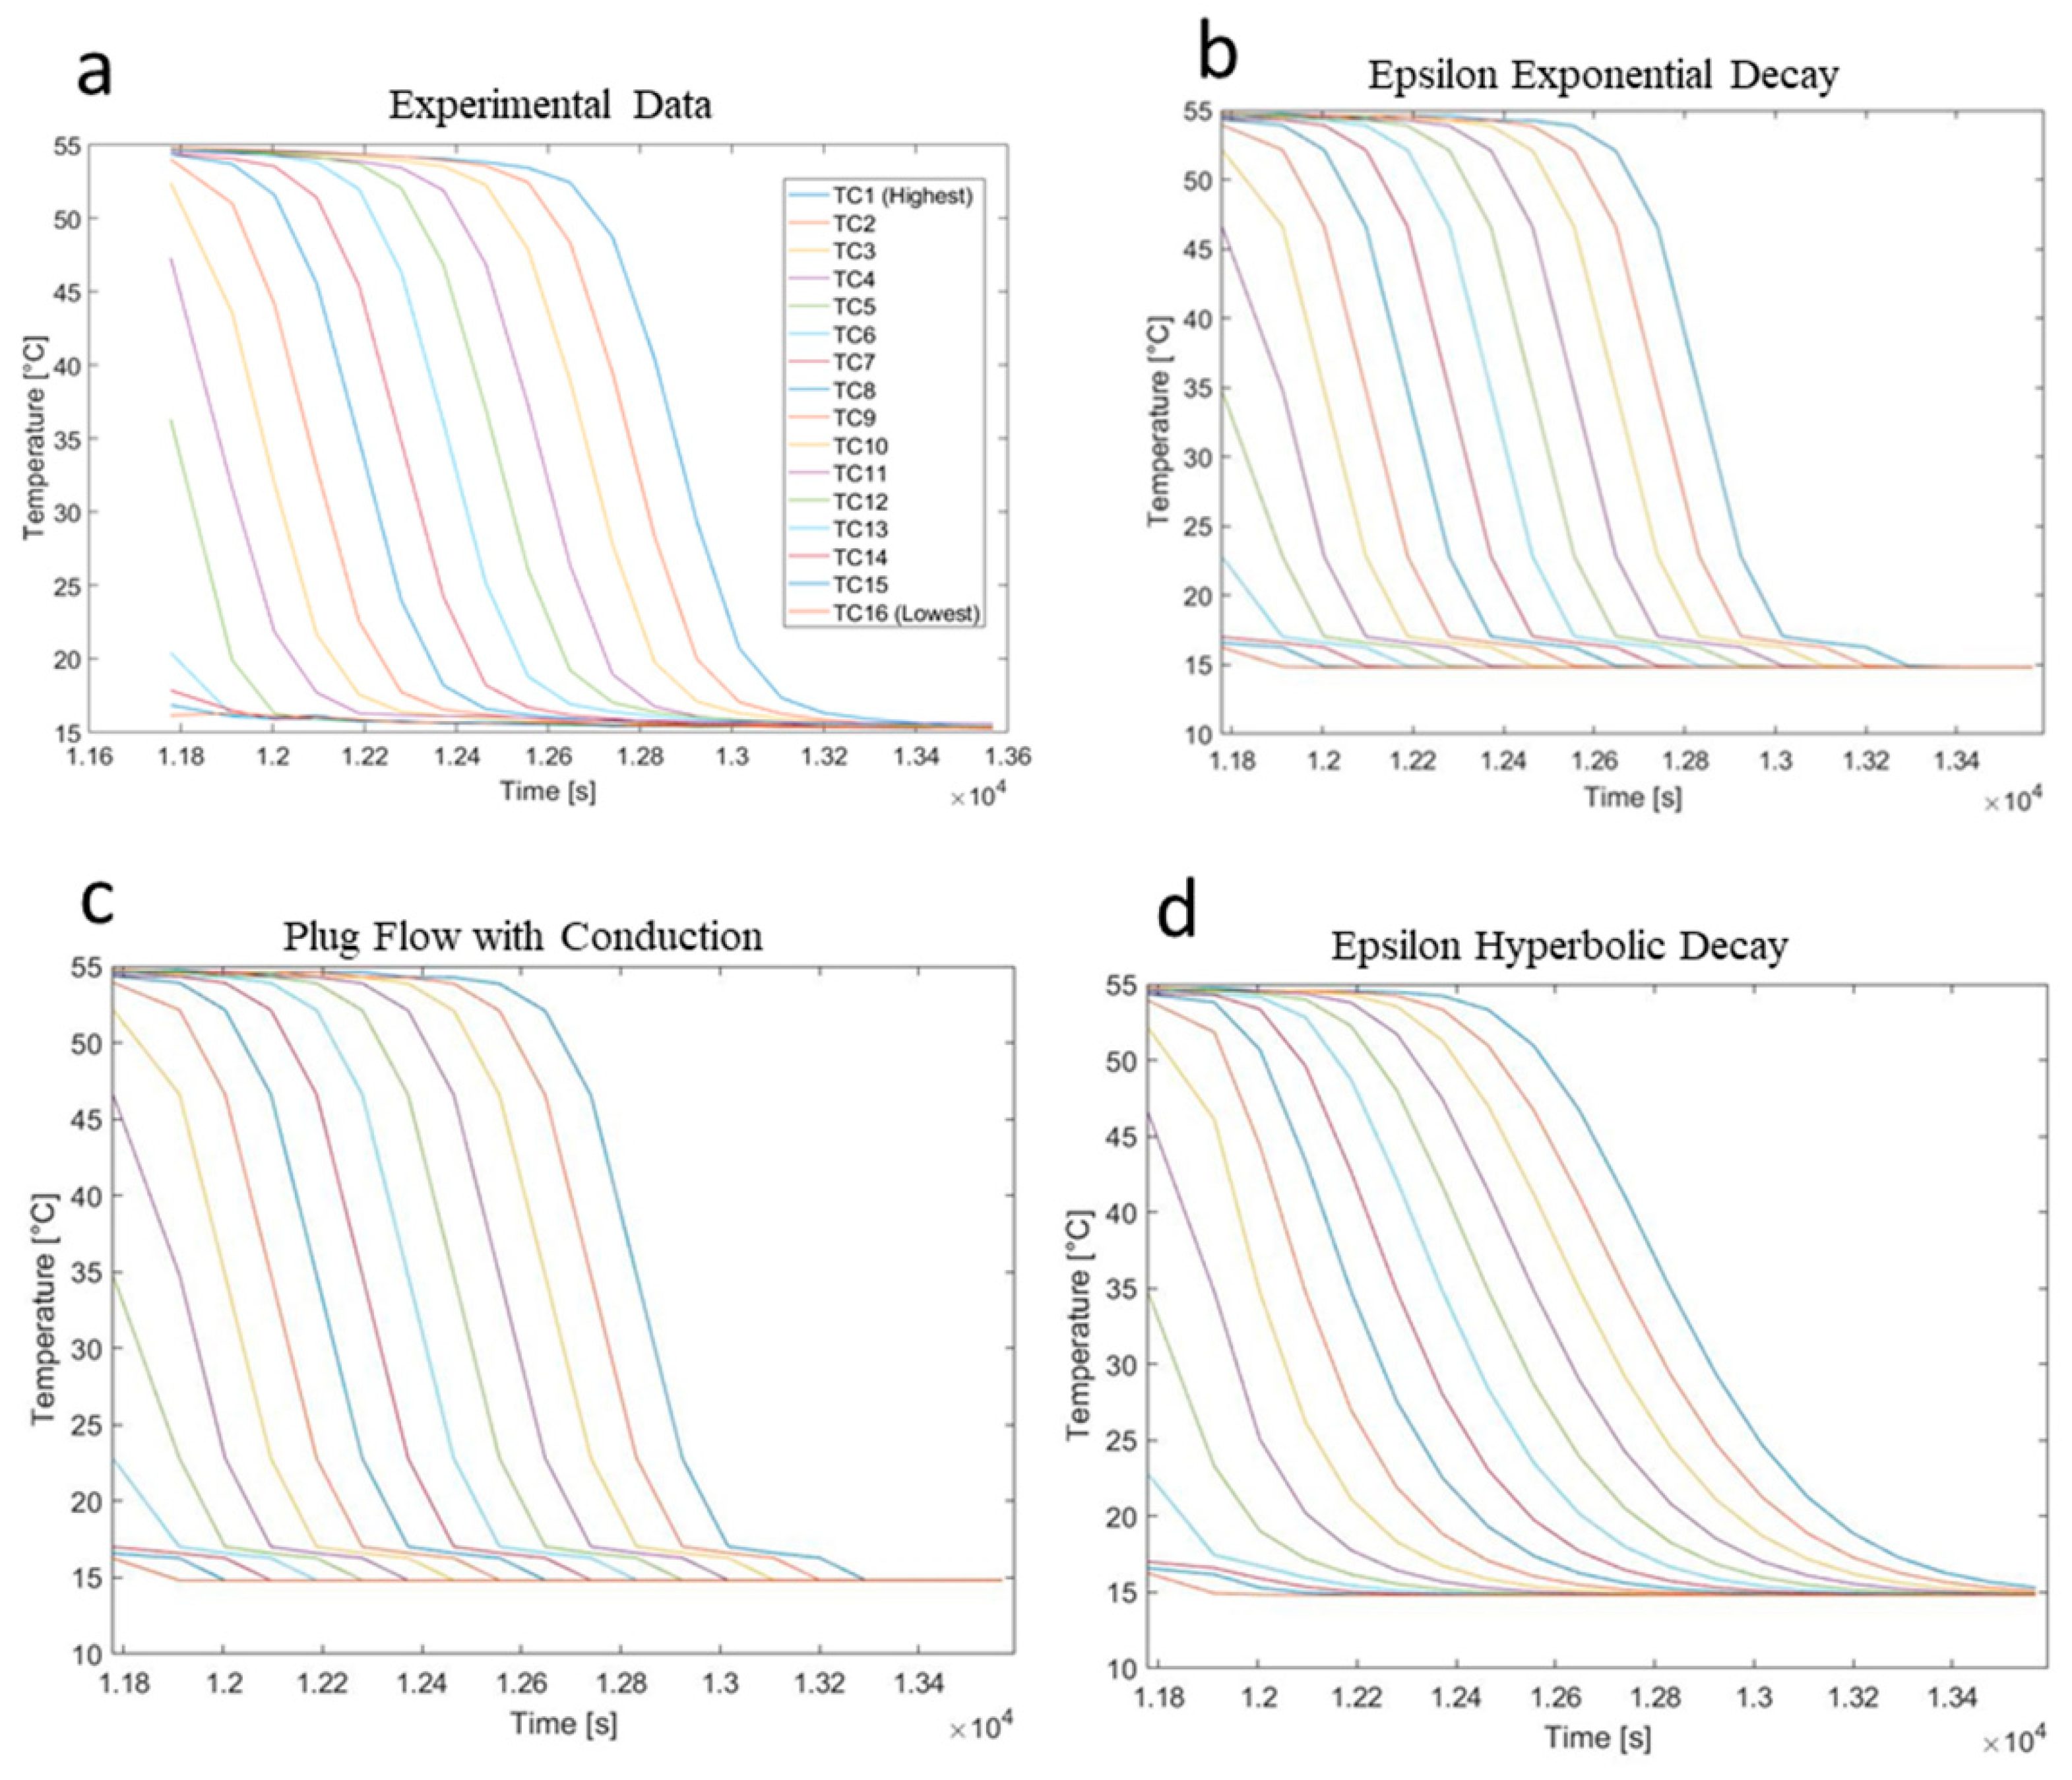
The heating case built a thermocline, and the two CED models (Oppel’s [47] hyperbolic correlation and the exponential correlation developed for this paper) both performed better than plug flow with or without conduction. This is because the turbulence from the inlet in the tank increased local mixing in the first thermocline layer by small waves [50], which can be thought of as addition diffusion in the convection–diffusion equation. Figure 4 shows the experimental data temperature data against time for the hot-water tank for the 16 TC probes—the three model results are shown also.
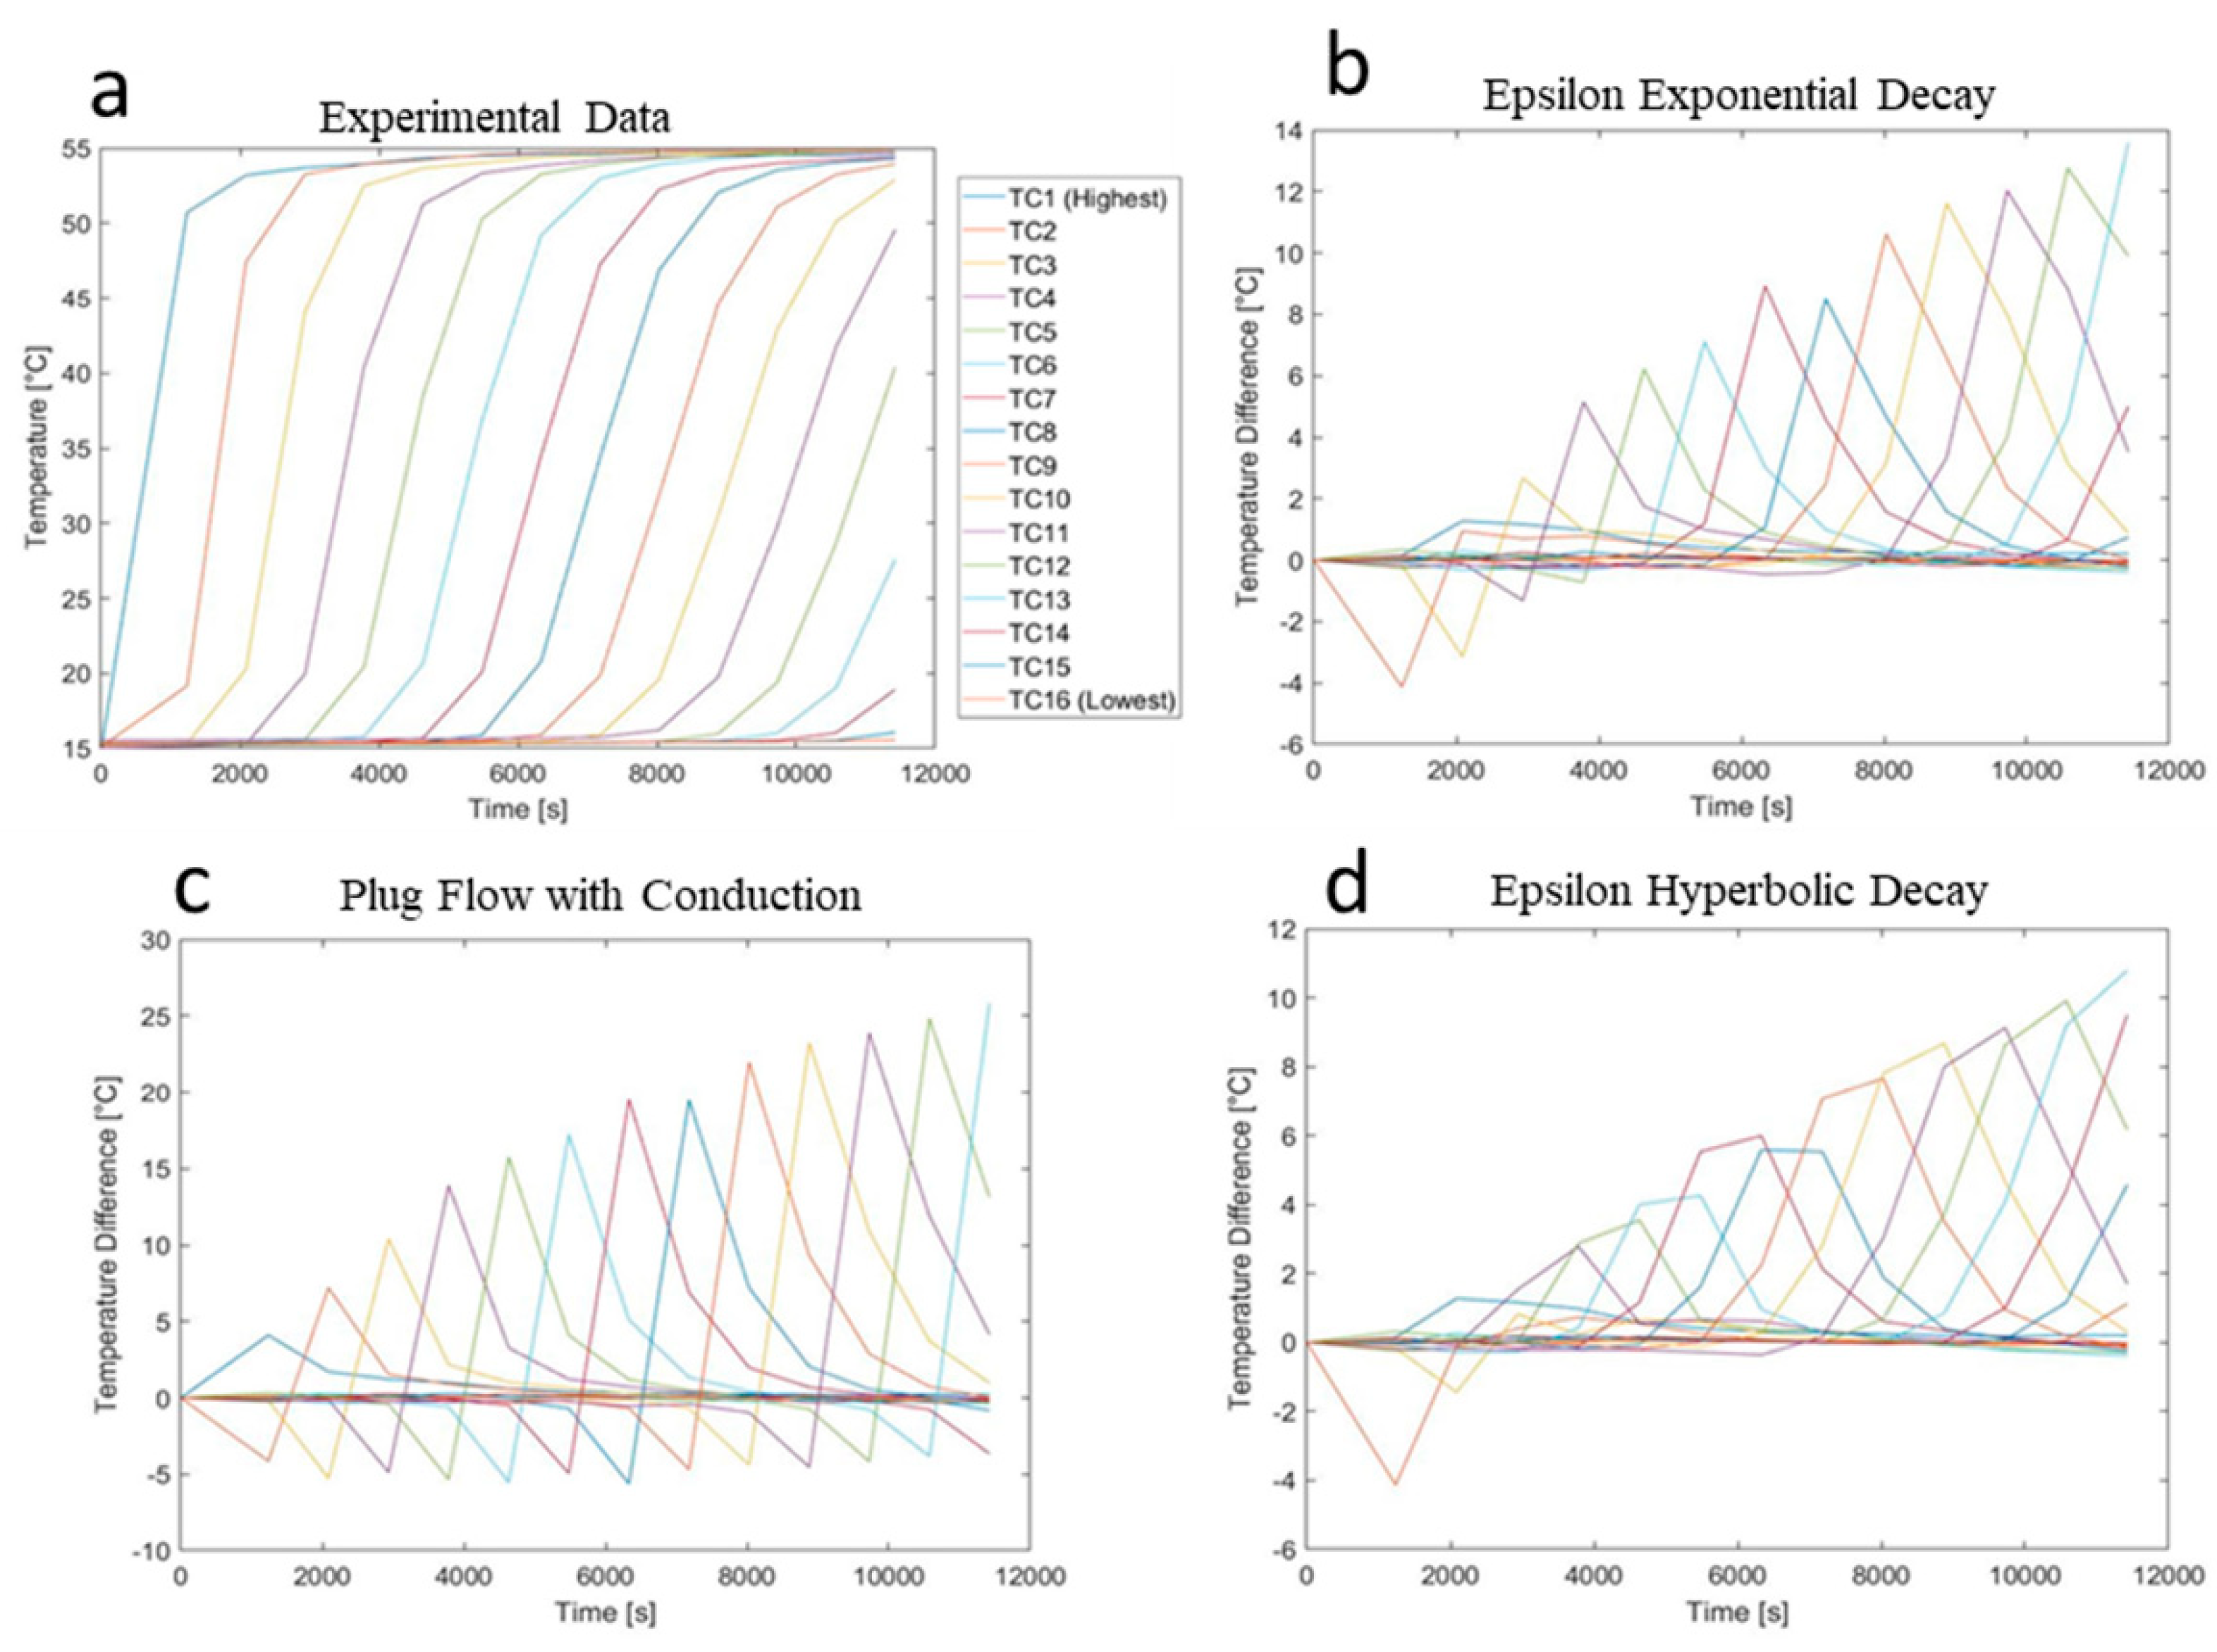
The source heating experiments took around 11,000 s (~3 h), and the thermocline grew during this time. Comparing Figure 4a,c it can be seen the plug-flow model under represents the size of the thermocline. After about 3 h, a thermocline involved 5 TCs, which is about 12.6 gal of water or 17.5 in. tall. As might be expected with an explicit method using only an initial condition of constant temperature, the temperature difference between the simulation and experiment (Figure 5) increased as time continued. Somewhat surprisingly, the ε values worked well at bringing the temperature of the tank from the equilibrium cold temperature at the initial conditions to the end conditions of a thermocline. This suggests that there is added diffusion due to turbulence applied in the thermocline region of the tank because the epsilon value is larger than that of conductivity alone throughout the entire tank.
The difference between the experiment and simulation shows that the models overpredicted the temperature for the source heating experiments. The maximum temperature difference between the simulation and the experiment for the different models was 10 °C to 14 °C for the ε models and 25 °C for plug flow only. The hyperbolic decay had a higher root mean square error because the curvature of the decay allowed for multiple time steps to use larger values of ε (this can be seen by rounder peaks in Figure 5d).
The simulation was hotter than the experiment, suggesting that the experiment lost energy at a higher rate than expected, likely from unaccounted heat loss. These losses included 1.7 L of hot water that was removed during the pressure build-up, the thermal mass of the tank/insulation, and conductive heat loss in the piping material used in connections.
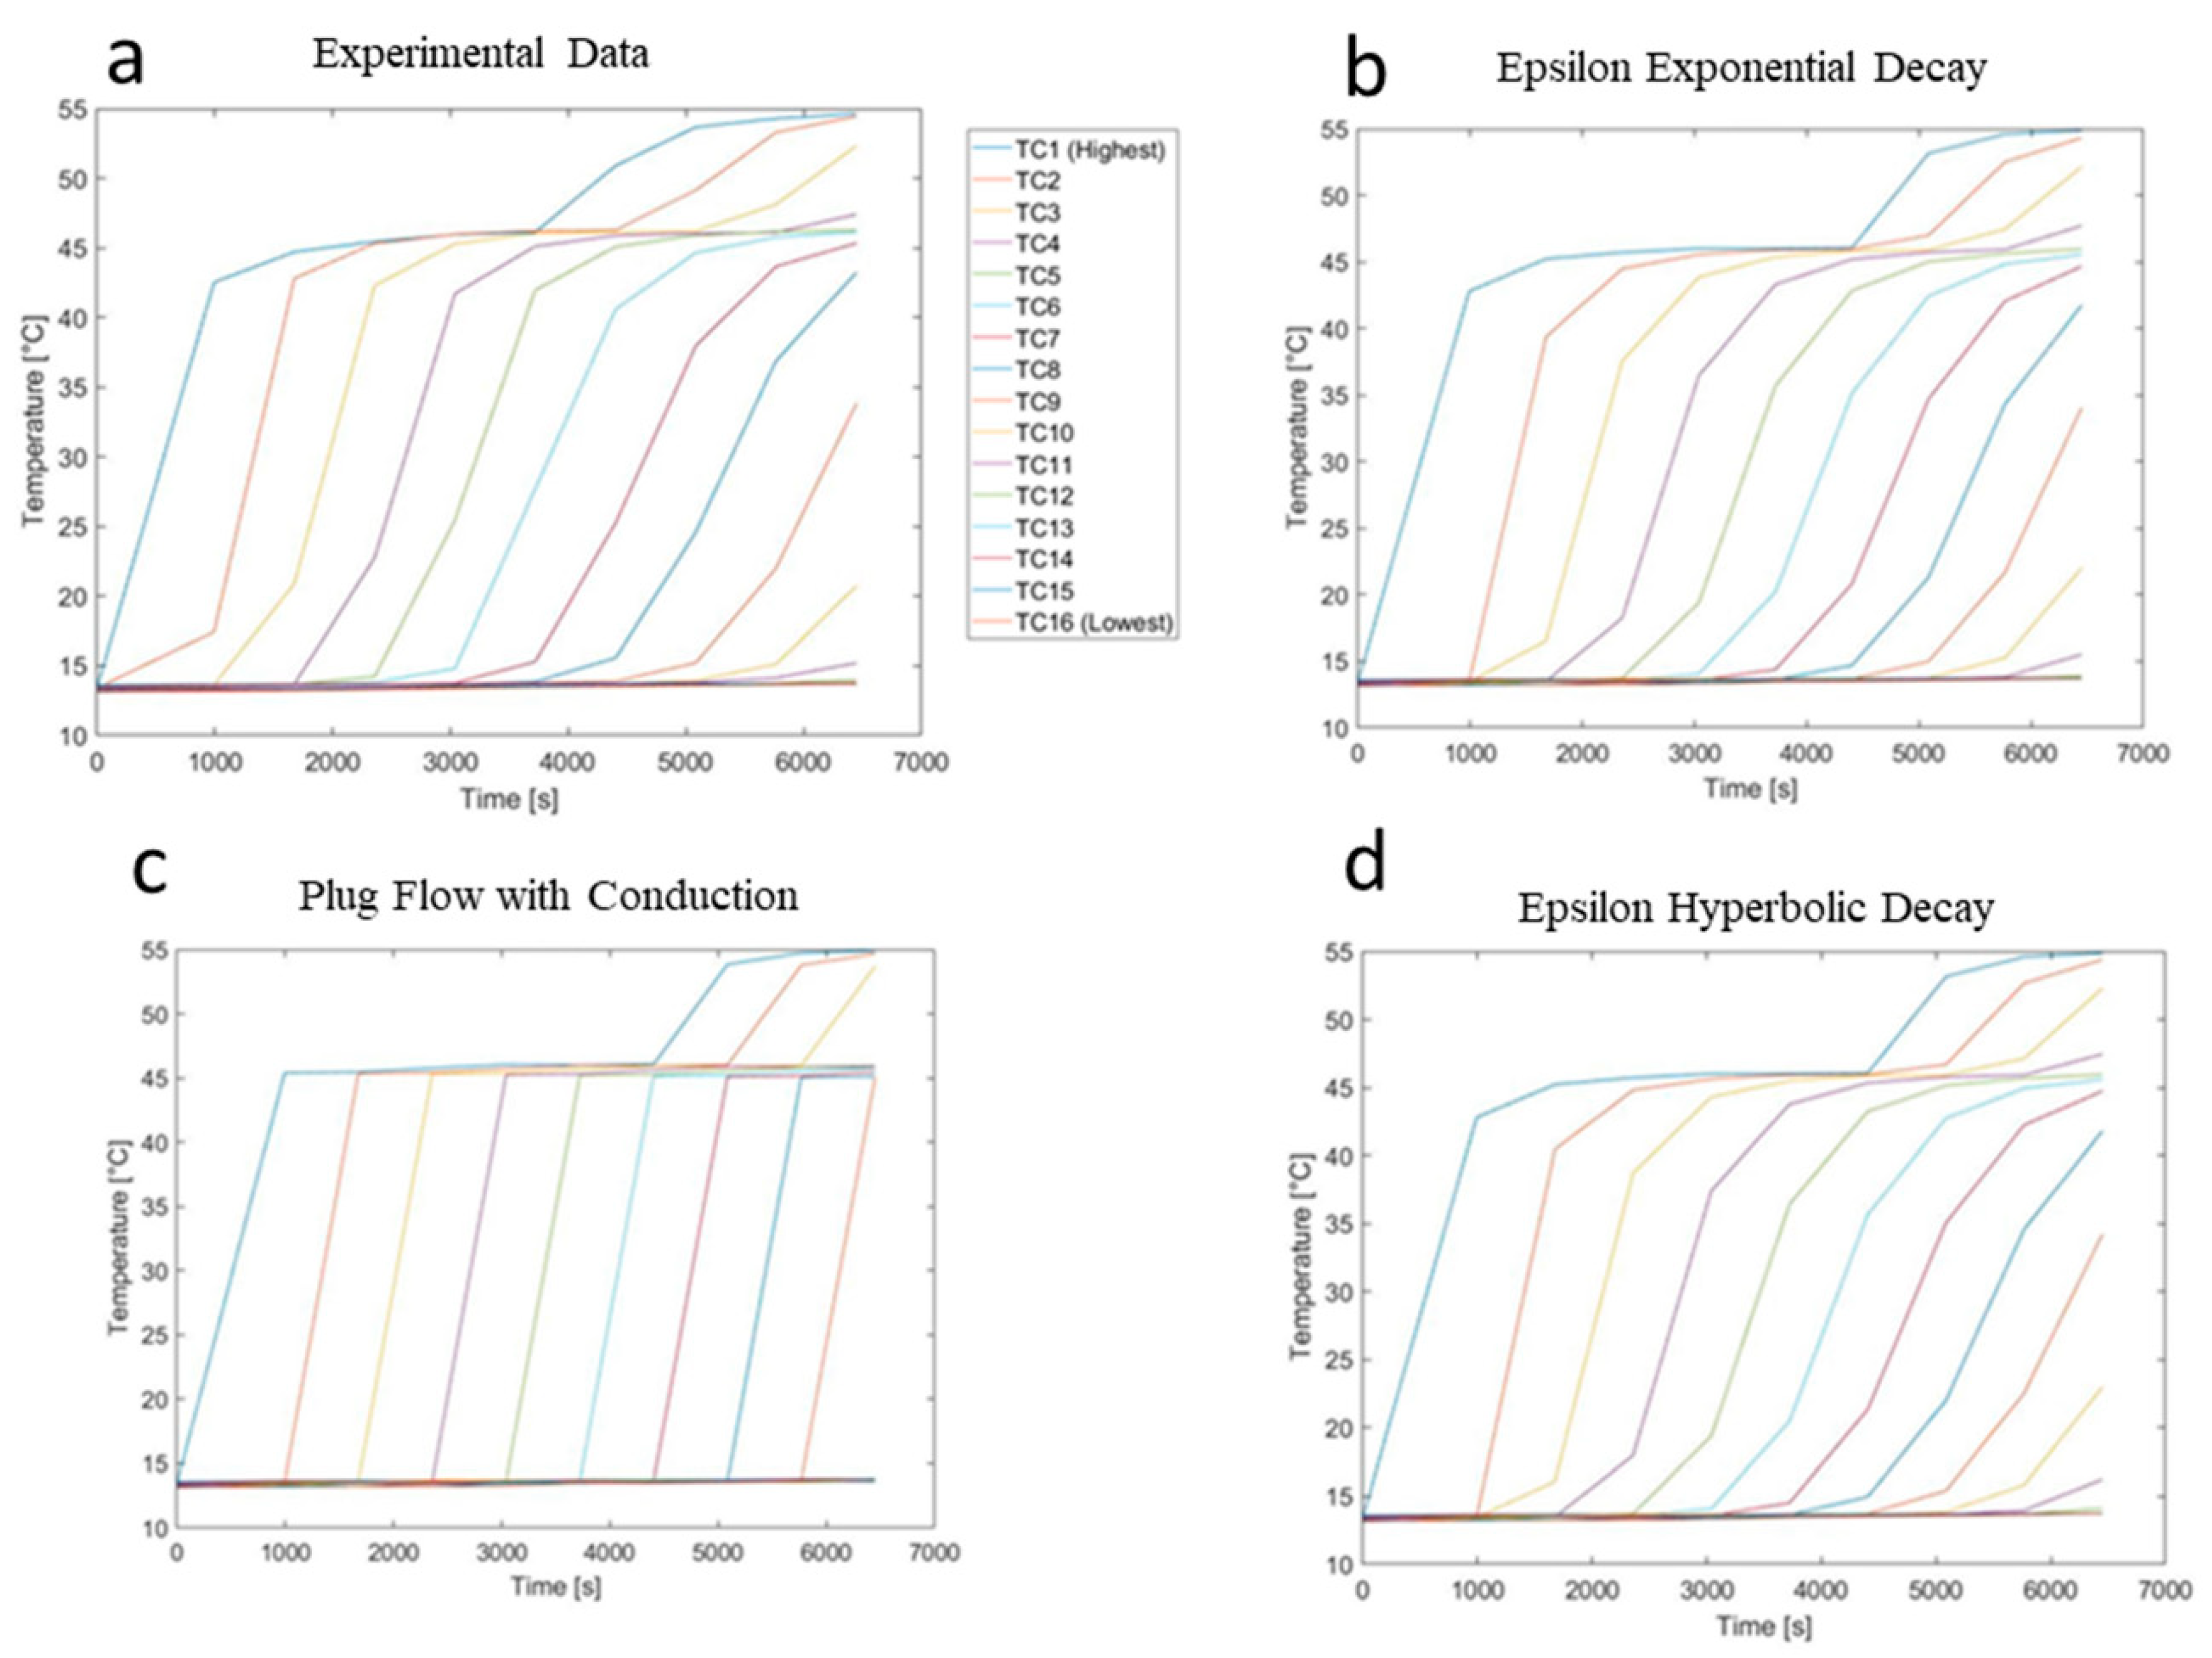
The 2-thermocline setup was more complex, and the experimental data showed 7 TCs engaged in the thermocline. Once again, plug flow did not accurately describe the amount of water mixed in the thermocline region (e.g., at any given time, plug flow had a maximum of two nodes representing the thermocline region, when in fact, the region can be up to seven nodes (Figure 6), whereas the ε models much more accurately described the thermocline region with minimal differences between the two models (root mean square error [RMSE] of the temperature; plug flow with conduction was 2.27 °C, ε model with hyperbolic decay was 1.14 °C, and ε model with exponential decay was 1.19 °C).
The discharge draw happened much faster than the charge, about 27 min. This faster event decreased the stability of the CED models. The initial condition of the experimental data right before the discharge was used to seed the models. The discharge draw showed a smother transition to the coldest temperature (about 15 °C) with the CED hyperbolic decay model.
The difference between the experimental data and the draw was both positive and negative, and the effects of eddy diffusion in the thermocline region were less pronounced. The average error was not zero, and the slight negative offset from zero shows that the models underpredicted the temperature, which is converse to the source heating experiments at the end of the draw at the majority of the locations in the tank. The hyperbolic decay model diverged for Courant number = 1, whereas the exponential decay ε model converged with higher accuracy at the same time step, suggesting the exponential relationship is more appropriate for VTIs for diffusers than the hyperbolic decay relationship.
As shown in Figure 7, the inlet factor decayed by the height between the inlet to the lowest thermocline because the thermocline was above the inlet. The exponential decay had a smaller error than the hyperbolic decay model. The comparisons of average tank RMSE temperatures for the whole heating or draw event are discussed in the following section.
In Figure 8 the difference between the experimental data and the models for the draw experiments has been plotted. The differences are smaller than the source heating, about 6° C in magnitude and all trend from positive to negative differences.
The major difference that can be seen in Figure 8, is that the hyperbolic decay has more error for the cone diffuser and has more points where the error is offset from near zero. All models converged toward zero error but did not reach zero error. To quantify the error further described in the section, the next section uses the RMSE method.

Root Mean Square Error Comparisons between Models

The root mean square error (RMSE) difference was compared between the experimental data and the model outputs. The comparisons show that the CED models were more accurate than the plug-flow model or plug flow with conduction (alpha model). There were also small differences between the hyperbolic CED model and the exponential CED model that give information about how the turbulence decayed at an increasing flow rate for the source heating experiment and the VTI type for the draw experiments. The source heating experiment was duplicated and showed good reproducibility (Figure 9).
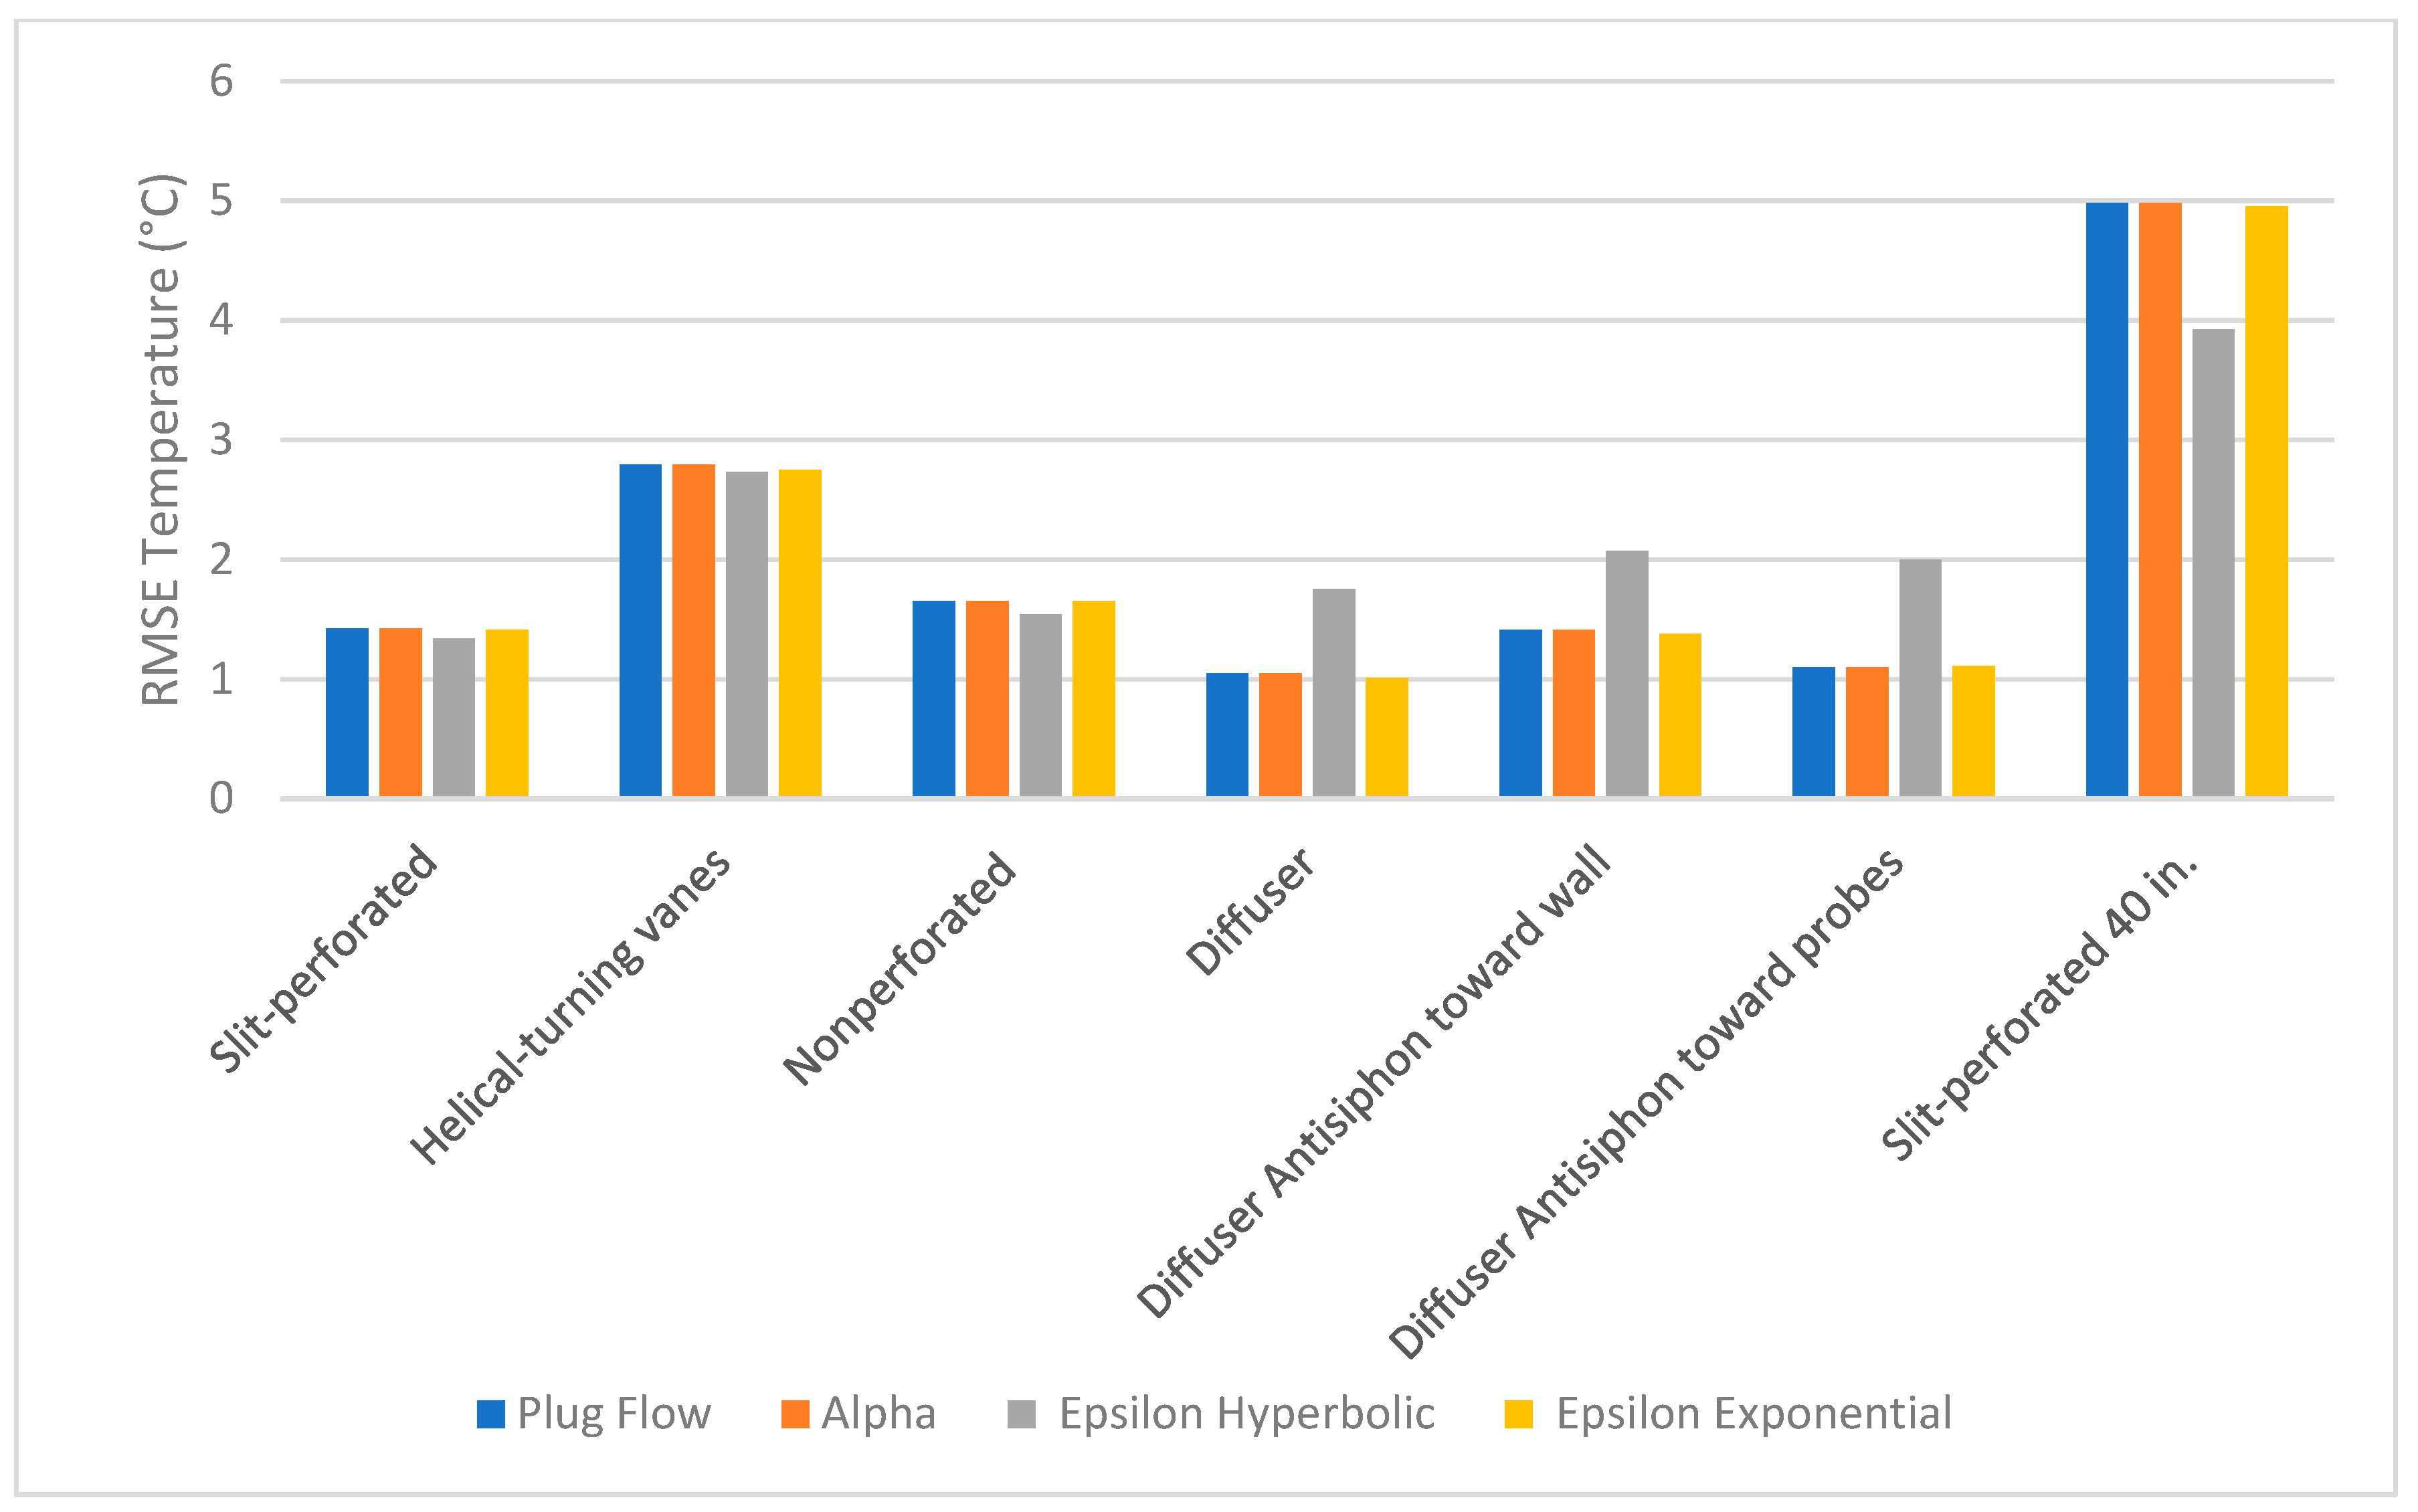
When the flow rate increased, the exponential model became more accurate than the hyperbolic model, suggesting that hot water in a negatively buoyant jet decays more quickly at higher turbulence levels, which is the opposite of the findings for the VTI inlets where the diffuser reduces the Reynolds number (Figure 10). The plug-flow models with and without conduction were very similar, but the ε models used in the turbulent eddy diffusivity empirical correlations from the Richardson number and Reynolds number more accurately predicted the temperatures. There were small differences between the two ε models for overall RMSE, with both the exponential decay at the and the hyperbolic decay being more like the experimental data (Figure 10)For the draw cases comparing long vertical-inlet devices below the thermocline, the plug-flow models performed similarly to the ε models. The draws were nominally 1.7 GPM, and all tubes entered water below the thermocline besides the 40 in. tube. For long tubes that were nonperforated, included an insert, or had perforations, the CED hyperbolic model was more accurate. Whereas for the diffuser, which reduced turbulence in the inlet device, the CED model with exponential decay was more accurate (Figure 10).
For a shorter VTI, all models struggled to predict accurate temperatures because of mixing in and above the thermocline (Figure 10). No simple answer is available for why the CED exponential model was more accurate for the shorter VTI. For the diffuser tube, the exponential decay performed up to 60% better than the hyperbolic decay model but similar to the plug-flow models. If the VTIs were used to build a thermocline, we would expect the same failure of the plug-flow models to create a thermocline with a physical height, and thus, we would expect ε models to perform better when thermoclines are being created. Pointing the antisiphon hole toward the TCs improved the accuracy of the model by an RMSE higher than 0.4 °C. The location of the TCs in relationship to the inlet device had a small impact on the VTIs that directed water below the thermocline. The internal flow paths are more difficult to decipher for cold water entering above the thermocline. Overall, the discharge process had less error because the eddy diffusion in the thermocline region had 14.4% of the time to take effect.

4. Discussion

The major phenomenon not modeled in plug-flow models is the creation of a thermocline. If a thermocline is being built up in the tank, an ε model should be selected if a 2D or 3D computational fluid dynamics model of higher accuracy is not required.
3D models have not successfully described the thermocline creation process for inlets that transition from laminar to turbulent levels over the minute timescale. When computational time is allowed, 2D and 3D models may show higher accuracy but are time consuming for a 15 min shower. Furthermore, 3D models cannot be validated accurately because the instrumentation required to measure the temperature at a high special and temporal resolution throughout the whole tank is not possible under the pressures seen in tanks. An accuracy of 2 °C in any location of the tank is 4.4% of the temperature span seen in the tank. The RMSE of plug-flow models for thermocline creation during heating was greater than 4 °C, whereas the ε models show a clear improvement <2 °C, demonstrating a significant improvement in accuracy without significantly higher computation time.
If there is a well-defined thermocline already established and the water inlet is below the thermocline, plug-flow models were shown to work as well as ε models for most cases. For draws with no thermocline creation, the RMSEs at the models are similar and <3 °C.
Adding conduction effects in the water is trivial to a plug-flow model when stratification is present. Furthermore, the mixing phenomenon in the thermocline was measured to be larger than the conduction effects alone. ε was solved between all TC locations from the experimental data that were small enough to be neglected when the thermocline was already created and present but larger than conduction alone. The literature suggests that internal waves are likely to present in the thermocline [50], and ε values were larger than conduction alone when solved between the 16 measurement points. Because of the spacing and variation in the ε values recorded, the presence of internal waves could not be confirmed.
Another complex internal flow pattern is when a jet passes through a thermocline. The mixing that occurs when water is jetted through a thermocline is another complex phenomenon that all models struggled to predict (Figure 10—slit-perforated 40 in.). However, the eddy diffusion clearly decayed in a more hyperbolic fashion than exponential as a function of height. The description of the eddy diffusion is useful because the exponential decay was less aggressive than the hyperbolic decay. This can give some insight into the internal flow paths developed by the vertical inlet device. Another factor in many VTIs is the presence of an antisiphon hole, 1/8 in. in diameter, toward the top of the inlet tube. This allows a spray of cold water to exit the tube at a higher elevation than the VTI outlet and affects the accuracy of the model depending on whether the hole is pointed toward or away from the temperature measurements. When the hole was pointed toward the measurements, the model agreed better with the data.
It is hypothesized that when the antisiphon orifice is pointed toward the wall, the jet is stuck to the wall and slows in velocity. This allows the thermocline to stop the flow from slipping past it, bringing entrained thermal energy to below its location. When the hole is pointed toward the TCs, the jet speed is not significantly reduced, and the mixing could happen above or below the thermocline depending on whether the jet bounces off the thermocline or penetrates through—flow visualization techniques may best describe this phenomenon.
The reason the ε inlet value was decayed at a stronger rate than by Oppel [47] is that the thermocline was not being built up during the initial experiments by Rendall [1]—the tank was charged only 75% of the way. The decay rate was not fast enough at full Courant steps (e.g., maximum allowed for stability with explicit methods for advection only). An inlet ε value was still considered advantageous to use because of the simplicity.
Few 1D seasonal models include the effect of flow rate on the mixing inside a tank. Furthermore, the additional diffusion in the thermocline region of a hot-water tank appears to be related to the inlet flow rate. We suggest that these 1D seasonal models for hot-water tank modeling incorporate a correction factor for flow rates throughout the tank because the diffusion is greater than conduction alone under flow conditions.

5. Conclusions

A thermocline adds significant complexity to the internal flow within a hot-water tank. The cases of hot-water flow from the top of a tank and different vertical tube inlets (VTIs) that deliver cold water to the bottom of the tank have been modeled and compared with experimental data. The convection eddy diffusion (CED) model was identified as a robust solution for building energy models that need to compute stratification level in a hot-water tank at a fast rate and the model can differentiate between vertical-tube inlet types. The results are most valid for draw-rates with Reynolds numbers between 2100 to 10,000 which corresponds to cold water entering the tank at 0.5 to 3 GPM for common inlet temperatures and VTI tube diameters. This range of Reynolds numbers also describes hot-water entering the top of the tank at flowrates between about 0.1 to 1 GPM.
The experimental data were measured by a vertical 16 thermocouple grid. The data from 10 experiments were compared with two simple one-dimensional (1D) models from the literature and two empirical 1D energy models of stratified thermal storage by root mean square error (RMSE) temperature difference. Experimental data were measured using five different vertical inlet devices at 1.7 GPM, which produced three different flow patterns inside the tank during discharge and two different charge rates (0.18 and 0.23 GPM).
The reheating of the tank by an external heat source (charging) was also modeled after empirically determining the eddy diffusivity factor (EDF) correlations. A repeated experiment for the charge cycle resulted in only a 0.04 °C RMSE temperature difference, showing good repeatability. There was an increase of RSME accuracy of 2 °C when using CED models in lieu of the basic plug-flow models. The CED model with exponential decay (Equation (4)) was also more accurate for the re-entry of hot water to the top of the tank at higher flow rates, whereas at lower flow rates, the hyperbolic model [47] was slightly more accurate.
From the experimental data a minimum and a maximum relationship for EDF were found at inlet Reynolds numbers below 2100 and greater than about 10,000, respectively. These bounding values were also seen in modeling the vertical tubes and suggest the EDF model is very sensitive at near turbulent values for round-tube inlets, through the hard-to-model transition Reynolds numbers, to a maximum turbulent level that is specific for each tube type.
The eddy diffusivity factor is a sensitive metric that can be used over a range of flowrates to model different inlet geometries and for vertical inlet devices that introduce water below the thermocline and create jets; the most accurate model was the CED model, which decayed eddy diffusivity hyperbolically as a function of height. For the same location in the tank, inlet devices that increase the cross-sectional area by an expansion section to reduce turbulence, the most accurate model was the CED model, in which the eddy diffusivity had an exponential decay with height (Equation (5)) and produced an RSME <1 °C for a 1.7 GPM draw for 35 gallons. Although helical turning vanes and a horizontally slit perforated diffuser introducing water above the thermocline had the poorest fit to experimental data for all the models’ tests, the RMSE was 2.5 °C–5 °C.
The addition of conduction to the plug-flow model during charge or discharge did not significantly increase the simulations’ accuracy. Thus, mixing near the inlet during charge or discharge was the dominant effect, and the CED model distinctly incorporated this mixing for the range of flow rates and inlet configurations.
The convection eddy diffusion model can decay the turbulence in a hyperbolic or exponential method based on the type of inlet turbulator or diffuser. The cone diffusers (Figure 10) that reduced turbulence resulted in a strong decay of turbulence through the stratified region, and the CED models with exponential decay as in Equation (5) most accurately described this reduced mixing in the inlet region.

Author Contributions

J.R., writing, formal analysis, method, conceptualization, data analysis; K.G., method, supervision, editing, funding acquisition; A.A.-H., conceptualization, method, data analysis; W.W., supervision, method; K.N., review, editing; F.K.B., writing, review, editing. All authors have read and agreed to the published version of the manuscript.

Funding

This project was supported in part by an appointment to the Oak Ridge National Laboratory Higher Education Research Experiences (HERE) program, administered by Oak Ridge Associated Universities (ORAU) through the US Department of Energy Oak Ridge Institute for Science and Education (ORISE). This work was sponsored by the US Department of Energy’s Building Technologies Office under Contract No. DE-AC05-00OR22725 with UT-Battelle, LLC. The authors would like to acknowledge Mr. Antonio Bouza, technology manager of HVAC&R, Water Heating, and Appliance, US Department of Energy Building Technologies Office.

Acknowledgments

The authors would also like to acknowledge Ce Shi for the discussion of Richardson number and its relation to thermal storage tanks; Viral K. Patel for help in the troubleshooting experimental setup; Neal Durfee, Jeff Chambers, Jerry Atchley, and Randy Linkous for instrumentation installation support; and Emily Kirkman for property graph and data visualization support.

Conflicts of Interest

The authors declare no conflict of interest.

Nomenclature

Amultiplicative fitting parameter (m2/s)
Bexponent fitting parameter (undefined fractional units)
Cvolumetric Courant number V ˙ Δ t Δ V n
CEDconvection-eddy diffusion
Cpspecific heat at constant pressure (W/kg K)
EDFeddy diffusivity factor
nnode number
Ntotal number of nodes
ReReynolds number
RiRichardson number
Δ t time difference between solution steps (s)
T n , C 1 temperature a node n at the previous nondimensional time (°C)
U A n overall coefficient of heat loss times the area fraction of the tank (W/K)
v velocity in the vertical direction (m/s)
V ˙ volumetric flow rate (m3/s)
Δ V n volume difference between the two nodes of the solution (m3)
Δ y height difference between nodes (m)
y height in vertical direction (m)
Greek
α thermal diffusivity (m2/s)
ϵ i n l e t inlet epsilon factor solved by empirical fits
ρ density (kg/m3)
ν kinematic viscosity (m2/s)
Subscripts
ambambient temperature

References

  1. Rendall, J. Thermal Stratification in Hot Water Tanks: A Review, an Empirical Fit, a Novel Model and a Prototype Diffuser; Texas A&M University: Kingsville, TX, USA, 2019. [Google Scholar]
  2. Steinert, P.; Göppert, S.; Platzer, B. Transient calculation of charge and discharge cycles in thermally stratified energy storages. Sol. Energy 2013, 97, 505–516. [Google Scholar] [CrossRef]
  3. Lavan, Z.; Thompson, J. Experimental study of thermally stratified hot water storage tanks. Sol. Energy 1977, 19, 519–524. [Google Scholar] [CrossRef]
  4. Homan, K.O. Integral Solutions for Transient Temperature Profiles in Stably-Stratified Open Enclosures. J. Heat Transf. 2003, 125, 273. [Google Scholar] [CrossRef]
  5. Bai, Y.; Yang, M.; Wang, Z.; Li, X.; Chen, L. Thermal stratification in a cylindrical tank due to heat losses while in standby mode. Sol. Energy 2019, 222–234. [Google Scholar] [CrossRef]
  6. Njoku, H.O.; Ekechukwu, O.V.; Onyegegbu, S.O. Analysis of stratified thermal storage systems: An overview. Heat Mass Transf. 2014, 50, 1017–1030. [Google Scholar] [CrossRef]
  7. Wang, Z.; Zhang, H.; Huang, H.; Dou, B.; Huang, X.; Goula, M.A. The experimental investigation of the thermal stratification in a solar hot water tank. Renew. Energy 2019, 862–874. [Google Scholar] [CrossRef]
  8. Huang, H.; Wang, Z.; Zhang, H.; Dou, B.; Huang, X.; Liang, H.; Goula, M.A. An experimental investigation on thermal stratification characteristics with PCMs in solar water tank. Sol. Energy 2019, 177, 8–21. [Google Scholar] [CrossRef]
  9. Lake, A.; Rezaie, B. Energy and exergy efficiencies assessment for a stratified cold thermal energy storage. Appl. Energy 2018, 220, 605–615. [Google Scholar] [CrossRef]
  10. Kurşun, B. Thermal stratification enhancement in cylindrical and rectangular hot water tanks with truncated cone and pyramid shaped insulation geometry. Sol. Energy 2018, 169, 512–525. [Google Scholar] [CrossRef]
  11. Spall, R.E. A numerical study of transient mixed convection in cylindrical thermal storage tanks. Int. J. Heat Mass Transf. 1998, 41, 2003–2011. [Google Scholar] [CrossRef]
  12. Jordan, U.; Furbo, S. Thermal stratification in small solar domestic storage tanks caused by draw-offs. Sol. Energy 2005, 78, 291–300. [Google Scholar] [CrossRef]
  13. Bahnfleth, W.P.; Song, J.; Cimbala, J.M. Measured and modeled charging of a stratified chilled water thermal storage tank with slotted pipe diffusers. HVAC R Res. 2003, 9, 467–491. [Google Scholar] [CrossRef]
  14. Kaloudis, E.; Grigoriadis, D.G.E.; Papanicolaou, E.; Panidis, T. Large eddy simulations of turbulent mixed convection in the charging of a rectangular thermal storage tank. Int. J. Heat Fluid Flow 2013, 44, 776–791. [Google Scholar] [CrossRef]
  15. Garbrecht, O. Large Eddy Simulation of Three-Dimensional Mixed Convection on a Vertical Plate; Institute of Heat and Mass Transfer, RWTH Aachen University: Aachen, North Rhine-Westohalia, Germany, 2017. [Google Scholar]
  16. Matulka, A.; López, P.; Redondo, J.M.; Tarquis, A. On the entrainment coefficient in a forced plume: Quantitative effects of source parameter. Nonlinear Process. Geophys. 2014, 21, 269–278. [Google Scholar] [CrossRef] [Green Version]
  17. Tinaikar, A.; Advaith, S.; Chetia, U.K.; Manu, K.V.; Basu, S. Spatio-temporal disruption of thermocline by successive laminar vortex pairs in a single tank thermal energy storage. Appl. Therm. Eng. 2016, 109, 924–935. [Google Scholar] [CrossRef] [Green Version]
  18. Brown, N.M.; Lai, F.C. Enhanced thermal stratification in a liquid storage tank with a porous manifold. Sol. Energy 2011, 85, 1409–1417. [Google Scholar] [CrossRef]
  19. Capocelli, M.; Caputo, G.; De Falco, M.; Balog, I.; Piemonte, V. Numerical Modeling of a Novel Thermocline Thermal Storage for Concentrated Solar Power. J. Sol. Energy Eng. 2019, 141, 051001. [Google Scholar] [CrossRef]
  20. Nelson, J.E.B.; Balakrishnan, A.R.; Srinivasa Murthy, S. Parametric studies on thermally stratified chilled water storage systems. Appl. Therm. Eng. 1999, 19, 89–115. [Google Scholar] [CrossRef]
  21. Kaloudis, E.; Grigoriadis, D.G.E.; Papanicolaou, E. Numerical simulations of constant-influx gravity currents in confined spaces: Application to thermal storage tanks. Int. J. Therm. Sci. 2016, 108, 1–16. [Google Scholar] [CrossRef]
  22. Wildin, M.W.; Sohn, C.W. AD-A273 511 Flow and Temperature Distribution in a Naturally Stratified Thermal Storage Tank; Construction Engineering Research Lab.: Champaign, IL, USA, 1993. [Google Scholar]
  23. Yoo, H.; Pak, E.-T.T. Theoretical model of the charging process for stratified thermal storage tanks. Sol. Energy 1993, 51, 513–519. [Google Scholar] [CrossRef]
  24. Hahne, E.; Chen, Y. Numerical study of flow and heat transfer characteristics in hot water stores. Sol. Energy 1998, 64, 9–18. [Google Scholar] [CrossRef]
  25. Rendall, J.D.; Gluesenkamp, K.R.; Worek, W.; Abu-Heiba, A.; Nawaz, K.; Gehl, T. Empirical characterization of vertical-tube inlets in hot-water storage tanks. Int. Commun. Heat Mass Transf. 2020, 119, 104838. [Google Scholar] [CrossRef]
  26. Cole, R.L.; Bellinger, F.O. Thermally stratified tanks. ASHRAE Trans. 1982, 88, 1005–1007. [Google Scholar]
  27. Bulnes, F.K.; Gluesenkamp, K.R.; Rendall, J. Comparision of plug flow and multi-node stratified tank modeling approaches regarding computational effeciency and accuracy. In Proceedings of the ASME 2020 International Mechancial Engineering Congress and Exposition, Online, 16–19 November 2020; pp. 1–9. [Google Scholar]
  28. Kleinbach, E.M. Performance Study of One-Dimensional Models for Stratified Thermal Storage Tank by Master of Science University of Wisconsin-Madison. Sol. Energy 1990, 50, 155–166. [Google Scholar] [CrossRef]
  29. Zurigat, Y.H.; Liche, P.R.; Ghajar, A.J. Influence of inlet geometry on mixing in thermocline thermal energy storage. Int. J. Heat Mass Transf. 1991, 34, 115–125. [Google Scholar] [CrossRef]
  30. Han, Y.M.; Wang, R.Z.; Dai, Y.J. Thermal stratification within the water tank. Renew. Sustain. Energy Rev. 2009, 13, 1014–1026. [Google Scholar] [CrossRef]
  31. Gluesenkamp, K.R.; Bush, J.D. Impact on Water Heater Performance of Heating Methods that Promote Tank Temperature Stratification. In Proceedings of the ASHRAE Annual Meeting, St. Louis, MO, USA, 25–29 June 2016. [Google Scholar]
  32. Elatar, A.; Nawaz, K.; Shen, B.; Baxter, V.; Abdelaziz, O. Characterization of Wrapped Coil Tank Water Heater during Charging/Discharging. In Proceedings of the ASME Proceedings Paper, ASME International, Tampa, FL, USA, 3–9 November 2018; pp. 1–8. [Google Scholar]
  33. Shen, B.; New, J.; Baxter, V. Air source integrated heat pump simulation model for EnergyPlus. Energy Build. 2017, 156, 197–206. [Google Scholar] [CrossRef]
  34. Shen, B.; Nawaz, K.; Baxter, V.; Elatar, A. Development and validation of quasi-steady-state heat pump water heater model having stratified water tank and wrapped-tank condenser. Int. J. Refrig. 2018, 87, 78–90. [Google Scholar] [CrossRef]
  35. Shen, B.; Nawaz, K.; Elatar, A.; Baxter, V. A hardware-based heat pump water heater design model for quasi-steady-state simulation. In Proceedings of the 25th IIR International Congress of Refrigeration, Montreal, QC, Canada, 25–31 August 2019; Volume 2019, pp. 4310–4317. [Google Scholar]
  36. Nawaz, K.; Shen, B.; Elatar, A.; Baxter, V.; Abdelaziz, O. R1234yf and R1234ze(E) as low-GWP refrigerants for residential heat pump water heaters. Int. J. Refrig. 2017, 82, 348–365. [Google Scholar] [CrossRef]
  37. Nawaz, K.; Shen, B.; Elatar, A.; Baxter, V.; Abdelaziz, O. Performance optimization of CO2 heat pump water heater. Int. J. Refrig. 2018, 85, 213–228. [Google Scholar] [CrossRef]
  38. Rahman, A.; Smith, A.D.; Fumo, N. Performance modeling and parametric study of a stratified water thermal storage tank. Appl. Therm. Eng. 2016, 100, 668–679. [Google Scholar] [CrossRef]
  39. Paradis, P.L.; Rousse, D.R.; Lamarche, L.; Nesreddine, H.; Talbot, M.H. One-dimensional model of a stratified thermal storage tank with supercritical coiled heat exchanger. Appl. Therm. Eng. 2018, 134, 379–395. [Google Scholar] [CrossRef]
  40. Padovan, R.; Manzan, M.; De Zorzi, E.Z.; Gullì, G.; Frazzica, A. Model Development and Validation for a Tank in Tank Water Thermal Storage for Domestic Application. Energy Procedia 2015, 81, 74–81. [Google Scholar] [CrossRef] [Green Version]
  41. Ye, Y.; Lu, J.; Ding, J.; Wang, W.; Yan, J. Numerical simulation on the storage performance of a phase change materials based metal hydride hydrogen storage tank. Appl. Energy 2020, 278, 115682. [Google Scholar] [CrossRef]
  42. Neri, M.; Chiavazzo, E.; Mongibello, L. Numerical simulation and validation of commercial hot water tanks integrated with phase change material-based storage units. J. Energy Storage 2020, 32, 101938. [Google Scholar] [CrossRef]
  43. Ahmed, N.; Elfeky, K.E.; Qaisrani, M.A.; Wang, Q.W. Numerical characterization of thermocline behaviour of combined sensible-latent heat storage tank using brick manganese rod structure impregnated with PCM capsules. Sol. Energy 2019, 180, 243–256. [Google Scholar] [CrossRef]
  44. Lago, J.; De Ridder, F.; Mazairac, W.; De Schutter, B. A 1-dimensional continuous and smooth model for thermally stratified storage tanks including mixing and buoyancy. Appl. Energy 2019, 248, 640–655. [Google Scholar] [CrossRef]
  45. Raccanello, J.; Rech, S.; Lazzaretto, A. Simplified dynamic modeling of single-tank thermal energy storage systems. Energy 2019, 182, 1154–1172. [Google Scholar] [CrossRef]
  46. Duffie, J.A.; Beckman, W.A. Solar Engineering of Thermal Processes, 3rd ed.; John Wiley & Sons, Inc.: Hoboken, NJ, USA, 1991; ISBN 13 978-0-471-69867-8. [Google Scholar]
  47. Oppel, F.J.; Ghajar, A.J.; Moretti, P.M. Computer simulation of stratified heat storage. Appl. Energy 1986, 23, 205–224. [Google Scholar] [CrossRef]
  48. Zurigat, Y.H.; Liche, P.R.; Ghajar, A.J. Turbulent mixing correlations for a thermocline thermal storage tank. Appl. Energy 1986, 93, 293–309. [Google Scholar]
  49. Taler, D.; Sobota, T.; Jaremkiewicz, M.; Taler, J. Influence of the Thermometer Inertial on the Quality of Temperature Control in a Hot Liquid Tank Heater with Electric Energy. Energies 2020, 13, 4039. [Google Scholar] [CrossRef]
  50. Briggs, D.A.; Ferziger, J.H.; Koseff, J.R.; Monismith, S.G. Turbulent mixing in a shear-free stably stratified two-layer fluid. J. Fluid Mech. 1998, 354, 175–208. [Google Scholar] [CrossRef]
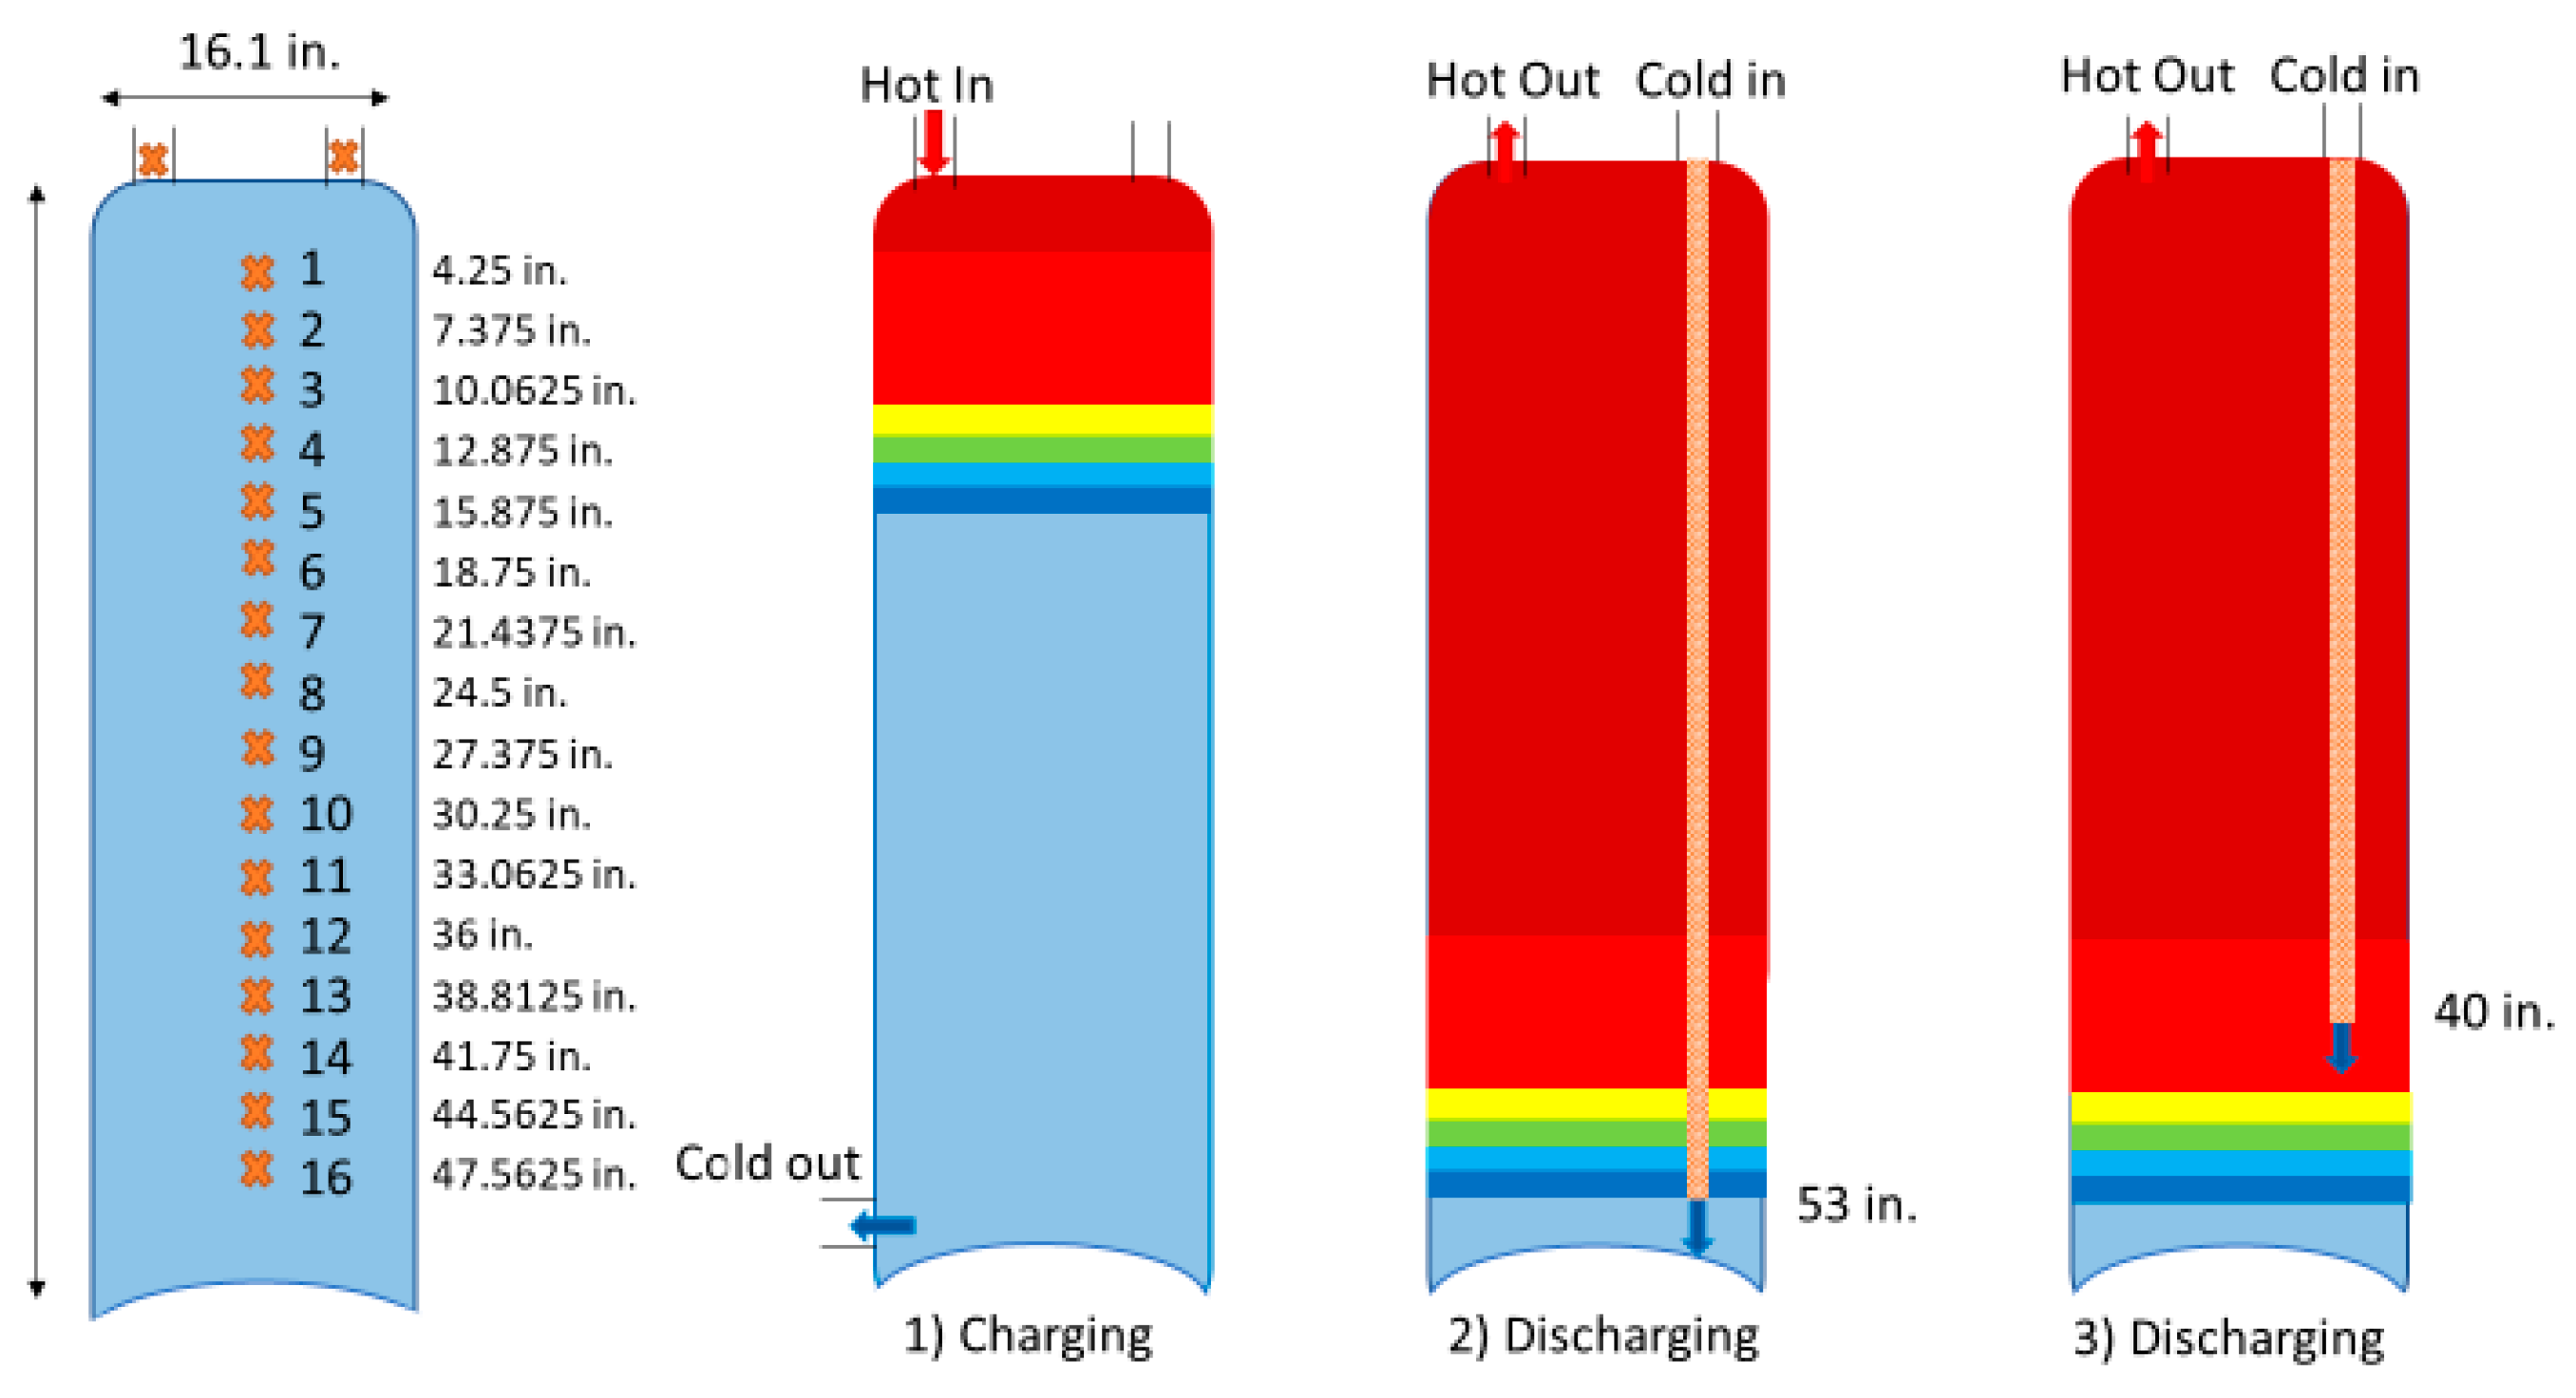
Figure 1. Experimental setup with locations of measured temperature marked by an “X” within the tank (left). Modeled conditions: (1) Charing cycle flow path with hot water coming from the top. (2) Cold water entering below the thermocline via the long vertical tube. (3) A 40 in. VTI delivering water above the thermocline.
Energies 14 02611 g001
Figure 2. Computational flow diagram for discharge and charge of a stratified hot-water tank with empirical data for the relationship of ϵ i n l e t and coefficients A and B.
Energies 14 02611 g002
Figure 3. (left) The typical trend of ε factor for heating and draw experiments and (right) fit for a heating experiment that was carried out between 0.15 and 0.9 GPM.
Energies 14 02611 g003
Figure 4. Source heating at 0.23 GPM flow rate. (a) Experimental data; (b) ε model using exponential decay; (c) plug-flow model with the inclusion of conduction in the water; and (d) ε model using hyperbolic decay.
Energies 14 02611 g004
Figure 5. Experimental data for the source heating experiment (0.23 GPM) temperature difference of the experimental data subtracted from the model. (a) Experimental data; (b) ε model using exponential decay; (c) plug-flow model with the inclusion of conduction in the water; and (d) ε model using hyperbolic decay.
Energies 14 02611 g005
Figure 6. Two thermoclines were created by increasing the temperature of the water delivered to the tank for recharge by 5 °C. (a) Experimental data; (b) ε model using exponential decay; (c) plug-flow model with the inclusion of conduction in the water; and (d) ε model using hyperbolic decay.
Energies 14 02611 g006
Figure 7. Discharge draws of 1.7 GPM for a cone diffuser without an anti-siphon orifice. (a) Experimental data; (b) ε model using exponential decay; (c) plug-flow model with the inclusion of conduction in the water; and (d) ε model using hyperbolic decay.
Energies 14 02611 g007
Figure 8. Discharge draws of 1.7 GPM for a cone diffuser without an antisiphon orifice temperature difference of experimental data subtracted from the model. (a) Experimental data; (b) ε model using exponential decay; (c) plug-flow model with the inclusion of conduction in the water; and (d) ε model using hyperbolic decay.
Energies 14 02611 g008
Figure 9. Source heating (charging) RMSE temperatures for plug flow, alpha model, CΕD model with hyperbolic height relationship, and CΕD (model with exponential decay based on height).
Energies 14 02611 g009
Figure 10. Discharging results for a 75% charged draw experiment. All flows were nominally 1.7 GPM, and tubes were 53 in. long unless listed otherwise.
Energies 14 02611 g010
Table 1. Inlet fitting parameters, residual’s squared, minimum, and maximum flow fit.
Inlet TypeABR2Fit Range (GPM)Reynolds Number
Round pipe flush with top of tank6190.30681.000.15 ≤ V ˙ ≤ 0.9 ~3200 to 16,000
Publisher’s Note: MDPI stays neutral with regard to jurisdictional claims in published maps and institutional affiliations.