Article

An Environmental and Societal Analysis of the US Electrical Energy Industry Based on the Water–Energy Nexus

1
Department of Geography, Environment and Spatial Sciences, Michigan State University, 673 Auditorium Rd, East Lansing, MI 48824, USA
2
Center for Global Change and Earth Observations, Michigan State University, 1405 S Harrison Rd, East Lansing, MI 48823, USA
3
Department of Engineering Physics, University of Wisconsin–Platteville 1 University Plaza, Platteville, WI 53818, USA
4
Institute of Agricultural Resources and Regional Planning, Chinese Academy of Agricultural Sciences, No.12 Zhongguancun South St., Beijing 100081, China
5
Shenzhen Key Laboratory of Urban Planning and Decision Making, Harbin Institute of Technology, Shenzhen 518055, China
6
Department of Civil, Construction & Environmental Engineering, San Diego State University, 5500 Campanile Dr., San Diego, CA 92182, USA
7
Department of Civil & Environmental Engineering, Michigan State University, 673 Auditorium Rd, East Lansing, MI 48824, USA
8
Department of Sociology, Michigan State University, 673 Auditorium Rd, East Lansing, MI 48824, USA
9
School of Engineering and Built Environment, Griffith University, Brisbane, QLD 4222, Australia
10
First Solar, Tempe, AZ 85281, USA
11
School of Photovoltaic and Renewable Energy Engineering, University of New South Wales, Sydney, NSW 2052, Australia
12
Department of Civil and Environmental Engineering, South Dakota School of Mines and Technology, 501 E. St Joseph St, Rapid City, SD 57701, USA
*
Author to whom correspondence should be addressed.
Energies 2021, 14(9), 2633; https://doi.org/10.3390/en14092633
Submission received: 11 March 2021 / Revised: 21 April 2021 / Accepted: 29 April 2021 / Published: 4 May 2021
(This article belongs to the Special Issue Energy and Water Nexus 2021)

Abstract

:
To meet rising energy demands, power plant operations will expand, influencing the interactions between the water–energy nexus and society. However, a major challenge is integration of social dimensions within electricity generation. To address this, we generate a baseline dataset using US public data (2014–2019) from the Energy Information Administration and US Bureau of Labor Statistics. We identify the rate of energy consumed, CO2, SO2 and NOx emissions generated, and water used per MWh net electricity as well as employee wellbeing per unit MW capacity during electricity generation. Rates of energy consumption (MMBtu/MWh) decreased 4.9%, but water consumption and withdrawal (m3/MWh) both increased 0.93% and 0.31%, respectively. Emissions of CO2, SO2 and NOx decreased 22.64%, 75% and 25% MT/MWh, respectively. Thermoelectric cooling withdrawal and consumption is led by natural gas (50.07%, 38.31%), coal (29.61%, 25.07%), and nuclear energies (13.55%, 18.99%). Electric power generation contributes 0.06 injuries–illnesses/TWh and 0.001 fatalities/TWh, of which fossil fuels contributed 70% and 15%, respectively. Fossil fuels led in average annual employment (0.02 employees/MW) with low cost salaries (USD 0.09/MW) likely due to high collective capacity, which is declining. Estimated rates in this study and framework will aid power industry transition and operational decision makers.

1. Introduction

The electrical energy sector must increase electricity supply to meet the rising needs of the growing populations globally [1] while mitigating and reducing greenhouse gas emissions, conserving natural resources and sustaining economic growth [2]. In 2018 alone, energy demand increased 4% to more than 23,000 TWh, with power generation demanding half of the primary energy and electricity generation consuming ~20% of total energy [3]. A transition to renewable energy sources will reduce conventional energy consumption, as well as environmental impacts on emissions, energy consumption, water withdrawal and consumption, and employee injuries, illnesses and fatalities [4,5,6]. While the electrical energy sector could reach >86% renewable energy share in electricity generation by 2050—up from 26% in 2018—renewables still face limitations from socioeconomic factors, scalable technology, and favorable economics regardless of their innovation and falling costs of technologies (e.g., batteries) [3,7]. Therefore, it is crucial to observe interactions of water, energy, and environment as well as with employment and worker welfare to ensure our carbon neutral goals are met by 2050. However, present understanding of the water–energy nexus and occupations and employee welfare in electricity generation is limited due to sample scale. Present estimates of water use are built on a subset of self-reporting power plants sampled by the Energy Information Administration (EIA) and do not account for nonreporting power plants (i.e., <100 MW capacity) or their respective contributions to national scale net electricity produced, energy consumed or water used. By including these power plants, we can build a baseline dataset capable of integrating the human-dimension (i.e., employment, salary, welfare) and evaluate the interactions between the water–energy nexus and society.
To aid decision makers, social–environmental frameworks like the water–energy nexus seek to optimize water supply systems for increasing demands, ensuring stability, and reducing water-related energy and environmental concerns within the contexts of social institutions and across multiple scales [8,9,10]. Optimization of water supply systems within water–energy nexus framework considers energy source type, centralized/decentralized systems, and uncertainty [11]. Current water supply and treatment are responsible for 2–3% of energy consumption globally [12] and 13% in the United States (US), where it also constitutes 5% of national greenhouse gas (GHG) emissions annually [13]. Notably, the US electricity energy sector continues to witness changes in power plant cooling system types as older systems retire and are replaced by new technology such as recirculating water systems or dry-cooling towers to decrease withdrawal and consumption rates [14,15].
Water use, including withdrawals and consumption, for thermoelectric cooling by energy source remains a challenge to estimate at the national scale due to the complex nature of power plant generators and cooling systems, as well as limitations in survey samples; however, they are essential to the water–energy nexus. Water used in electricity generation cools and condenses steam used to drive steam turbines and accounts for approximately half of global industrial water withdrawal [16] and 40% of all withdrawals in the US—the most of any category—according to US Geological Survey (USGS) [15]. Cooling equipment during electricity generation varies by plant generator and greatly influences the water use volume, particularly consumption (i.e., lost as evaporation or blowdown during generation) [17]. Notable methods by USGS include complex climate and geographic interactions (e.g., linked heat and water budgets) as well as cooling system type to calculate water use rates by primary mover [18]. Estimating water use is further complicated by limited primary data, sample size, and various or inconsistent methodologies that have led to numerous published estimates [14,17,19,20]. Federal datasets are continuously improving and factors are available for policies and decision makers [19], but are limited and assume that access to power plant prime mover, cooling system and energy sources are available. This information is not provided for power plants <100 MW capacity in the US, which contributed an average 65.68% of total net electricity generated and represented 95.09% of all power plants reporting to EIA 2014–2019 [21,22]. Water use from all power plants, including those that do not presently report cooling systems, is essential to constructing a baseline for the integration of human dimensions in the water–energy nexus.
Social implications and political perspectives have the potential to accelerate or challenge the adoption of renewable energy and can advance energy-water nexus studies of electricity production [8]. Criteria for evaluating renewable energy social and political perspectives include public perception, environment, employment, health and safety, local infrastructure development, policies, de/regulation of power markets, public/government R&D framework, codes/standards, utility perception, reliability, resilience and security [23,24,25,26]. If the US renewable energy industry continues at the present pace, ~19 million additional renewable energy, energy efficiency and grid enhancement jobs could offset estimated job loss in fossil fuels (7.4 million) by 2050 [7]. Detractors of energy transition present arguments objecting to renewable expansion citing concerns for lower employment and economic performance—even though climate policy has demonstrated that renewable transition provides a positive relationship for both [27]. Renewable energy development boasts increased job creation [2] and fewer occupational injuries and fatalities than conventional [28,29]. Records of employment and worker welfare by energy source, particularly renewables, in the US is still relatively new. In 2011, a call for structured monitoring of renewable energies was made, particularly because they were based on experience from industries with similar hazards and often times fossil fuel industries [30]. Only in the past decade have records of injury, illnesses and fatalities for renewables become available through federal efforts. While power plant occupations for electricity generation is still challenged by sample size and privacy concerns, particularly for growing renewable industries like solar and wind, inclusion of these new surveys will advance our understanding of employment and worker welfare as our electricity energy sector transitions.
In this study, we model the water–energy nexus with the inclusion of social variables to explore the interconnections between water use, energy consumption, pollution emissions, and employee welfare and safety in electricity generation. First, we generate estimates of water use (m3/MWh) in thermoelectric cooling to account for nonreporting power plants (i.e., <100 MW capacity). We apply these water use rates to estimate water use for the electricity sector by energy source and evaluate annual changes in water use, energy consumption and CO2, SO2 and NOx emissions per MWh of net electricity. We then contextualize the water–energy nexus within employment and worker welfare (i.e., injuries, illnesses, fatalities, and salary) conducted by US electric power plant operations. Results of this research provide a dataset built on publicly available data that generate unit comparisons for the first baseline overview of the electrical sector by energy source and the interactions between water, energy and society. Industries, researcher, feasibility studies, and projections of renewable energy technologies in society and environment can apply these units for evaluating the relationships between the energy sector, the environment and society. More so, it demonstrates the necessity of these data and encourages regular surveys and census of the energy sector by energy source (e.g., natural gas, coal, wind, solar, etc.).

2. Materials and Methods

We first develop an integrated water–energy nexus framework that utilizes a top-down approach to estimate energy and water use, emissions produced, and employee health and welfare (i.e., injuries, illnesses, fatalities, salary and employment) for net electricity production in the US (average 2014–2019) by energy source. Our estimates of water use and employee health and wellbeing are not intended to be precise predictions, but rather a summary of published statistics. Detailed methodologies and data sources are described in this section.

2.1. Data

Processes and data involved in electricity production within the system-boundary of power plant operations (i.e., gate to gate) were collected from the Energy Information Administration and the US Bureau of Labor Statistics and are detailed in this section, including definitions, assumptions and data sources. Power plants included both regulated and unregulated electric power plants that generate at utility-scale of >1 MWh capacity and are connected to the local or regional electric power grid with the ability to draw power from or deliver power to the grid. Solar generators with <1 MW generator capacity and/or with no connection to the grid are excluded from our study due to the threshold set by EIA surveys [21]. Energy sources used in this study include biomass, coal, geothermal, hydroelectric conventional, hydroelectric pumped, natural gas, nuclear, petroleum, solar, wind, and other gases and all other. Biomass includes wood and wood-derived fuels (i.e., wood waste solids, paper pellets, railroad ties, utility poles, wood chips, bark, and wood waste solids and liquids), municipal solid waste, landfill gas, sludge waste agricultural byproducts, and other biomass solids and liquids. Coal includes anthracite, bituminous, subbituminous, lignite and waste coal, coal synfuel and refined coal, and coal-derived synthesis gas. Petroleum includes distillate fuel oil, residual fuel oil, jet fuel, kerosene, petroleum coke, waste oil, synthetic gas and propane. Solar includes photovoltaic (i.e., PV) and thermal systems. Other gases include blast furnace gas and “all other” includes batteries, hydrogen, purchased steam sulfur, tire-derived fuels and other miscellaneous energy sources.
Plant level surveys of operations are provided annually, reporting net electricity generated (MWh), energy consumed (MMBtu) and reported prime mover and fuel type in EIA’s 923 Power Plant Operations Report [22]. Similarly, water use for thermoelectric cooling is collected from power plants >100 MW capacity in EIA 860 [31]. Electricity capacity is collected from EIA Electric Power Annual, a summary of EIA 923 and other reports, for each year [32] and transmission loss and distribution is collected from EIA State Electricity Profiles [33]. Combustion residuals of fossil fuel-fired plants for electricity generation, operation, and useful thermal output include estimates of carbon dioxide (CO2), sulfur dioxide (SO2) and nitrogen oxides (NOx) (thousand MT yr−1) is acquired from EIA Emissions by plant and by region [34], which includes utility-scale conventional power plants and combined-heat-and-power plants. Plant production occupant health data is collected from the US Department of Labor Bureau Census of Fatal Occupation Injuries and Survey of Occupational Injuries and Illnesses [35,36]; occupational employment and salary from the US Labor Bureaus Occupation and Employment Survey (OES) for private and local industries categories [37]. In the following subsections, we provide data management and methodologies of the aforementioned sources.

2.1.1. Energy Consumption and Electricity Generation

Net electricity (MWh) is the amount of electricity a power plant supplies to the power transmission line connected to the power plant. It accounts for energy consumed to operate the plant’s generators and other equipment, such as fuel systems, boiler water pumps, cooling equipment and pollution control devices. The energy consumed (MMBtu) to produce net electricity is the estimate of the resource used for fuel calculated with thermal heat rates by EIA. Noncombustible renewable energy sources are estimated by multiplying electricity net generation by the total annual average fossil fuel heat rate factors and accounting for direct use energy—ultimately approximating the quantity of fossil fuel primary energy replaced by renewables. For more information, see note “Renewable Energy Production and Consumption” in Section 10 of EIA’s Monthly Energy Review, which is a monthly report released by EIA on current and historic energy data [21].

2.1.2. Water Use

Water use of a power plant is defined as the water withdrawn or consumed for thermoelectric cooling, which cools and condenses steam during the electricity generation process. Withdrawal includes water from lakes, rivers, or groundwater that is either consumed or discharged during the cooling process. Consumption is the amount of water that is not returned to the cooling system or discharged, including evaporation. Water use is not available for renewable energy sources, with the exception of solar thermal (i.e., concentrated solar power). However, because water use is not reported by power plants <100 MW capacity, we extrapolated rates of water use (m3/MWh) from reporting power plants to all power plants of >1 MW capacity and define our methodology in this section.
A single power plant may consume various energy sources to produce electricity with various cooling systems and generator technologies. To address this, we select power plants with >95% of the same energy source to increase sample size and to reduce mixed water use for multiple energy sources [17]. Power plants with negative net electricity generation and water consumption and/or net electricity are considered offline and removed. To increase sample size, energy sources of “all other” and “other gases” are combined into energy source “other”. EIA forms 923 [22] and 860 [31] were used to characterize cooling system types by prime mover (i.e., energy source) annually. Water withdrawal and consumption volumes are reported by cooling system ID, which were linked to net electricity produced in EIA 923 by connecting EIA 860 schedules 6B and 3a (i.e., boiler and generator ID) with cooling system ID provided in EIA 923 schedule D [18,38]. We summed water withdrawal and consumption volumes at each power plant by prime mover. Some prime movers had multiple cooling systems, which were labeled as complex cooling systems [18] and are often a combination of recirculating and once-through cooling systems.
Filtered data records were processed by dividing annual water withdrawal and consumption by net electricity produced to determine a final water withdrawal and consumption rate (m3:MWh). Water withdrawal and consumption rates (m3/MWh) were sampled from 2805 and 2872 reporting power plants, respectively. Solar represents water use by power plants with thermal and steam prime movers. Other renewables including hydroelectric conventional, hydroelectric pump storage, wind, geothermal and solar photovoltaic (PV) are not required to report water use and we assume have zero water use. Subsample size, both withdrawal and consumption, collectively represents 113 (2.85)% biomass, 1073 (40.10%) coal, 1676 (9.98%) natural gas, 134 (36.30)% nuclear, 19 (0.81%) other (i.e., Other gases and All Other), 49 (0.49%) petroleum and 17 (0.14%) solar power plants surveyed in the energy sector. Of this subsample, contributions to total net electricity production by the energy sector is 15% of biomass, 66.30% of coal, 21.80% of natural gas, 33% of nuclear, 7.40% of other gases, 36.90% of petroleum, and 2.81% of solar. Of these energy sources, this sample represents 39.51% of total net electricity produced by the sector. The water use rates in this sample were filtered for outliers greater than one standard deviation from the mean rate of water withdrawal or consumption per MWh net electricity. The power plant of >100 MW sample is assumed to have a similar cooling system type and prime mover composition as the <100 MW power plants during the study period. Final mean water use rates by energy source were acquired in a nonparametric bootstrap approach in RStudio 1.3.1093 using 1000 repetitions [39,40,41]. We applied descriptive statistics, specifically, the Pearson correlation analysis to understand the relationship between estimated (i.e., “x”) and reported annual water use (i.e., “y”) by power plants >100 MW capacity, as well as to determine the strength and direction of the association, we applied a Pearson sample correlation analysis using the “stats” package in statistical software RStudio [41,42]. The Pearson’s correlation measures linear correlation between two variables and with a coefficient between -1 and 1, where -1 is a completely negative linear correlation, 0 indicates no linear correlation, and +1 suggests a completely positive linear correlation. Final estimated mean water use rates are multiplied by annual net electricity production for each power plant >1 MW capacity by respective energy source during the study period. The product is summed annually and divided by the length of the study period for the annual average water use by each energy source.

2.1.3. Air Pollutants

The EIA emissions reports NOx and SO2 that were estimated by multiplying the fuel’s emissions factor and primary fuel consumed, and also accounts for the plant’s operational pollution control equipment [32]. To estimate power plant emissions of CO2, EIA multiplies the primary fuel consumed by the fuel-specific emission factor in EIA data [32]. Emission control equipment for CO2 is still in the early stages of research and there are no commercial systems installed; therefore, these estimates do not include pollution control. Due to variability in policies, affordability and practices across power plants in the US, we assume no emission controls for CO2 in this study.

2.1.4. Worker Safety and Employee

To compare employee wellbeing with electricity production for production occupations, we selected the OES specific occupational classification (SOC) 51-000, which includes supervisors of production workers, as well as assemblers, fabricators, power distributors and dispatchers, and others from electricity generation categories within selected North American Industry Classification System (NAICS) [37]. The NAICS categories are federally recognized nested classifications for business establishments that provide standard employment and economic data for analysis in this study [43]. Categories selected within NAICS include parent category “Utilities” (NAICS 221), and subcategories “Electricity production, transmission and distribution” (NAICS 22111) and “Water, sewage and other systems” (NAICS 22113). Employment and salary by energy source is only available starting in 2016 and is a subcategory of “Electricity production, transmission and distribution” (NAICS 22111). We collected salary and employment data of electricity generation by fossil fuels (i.e., combination of petroleum, coal, and all other fossil fuels) (NAICS 221112), nuclear (221113), hydroelectric (NAICS 22111), wind (NAICS 221115), geothermal (NAICS 221116), biomass (NAICS 221117), and “other” power generation (NAICS 221118). Solar (NAICS 221114) began recording SOC 51-000 in 2019; also, no OES employment or salary was published in 2016 due to sample size. Therefore, in 2017–2018, we applied “installation, maintenance and repair occupations” (i.e., SOC 49-000) as a proxy. Salary and employment numbers represent private and local industries, as state government data were not available for our selection. Employment was summed and salary was averaged by year and NAICS category.
Employee health and safety data for electricity production was acquired from the Department of Labor Bureau Census of Fatal Occupation Injuries and Survey of Occupational Injuries and Illnesses by NAICS categories “Utilities” (NAICS 221), “Electricity production, transmission and distribution” (NAICS 22111) and “Water, sewage and other systems” (NAICS 22113), as well as electricity generation by fossil fuels (NAICS 221112) [35,36]. At the time of this study, these data are not yet available for other energy sources. The Labor Bureau collects fatality incidents (single-case) in a census whereas nonfatal injuries are collected via probability-driven sampling and are reported per 1000 incidents. Fatal and nonfatal injuries include loss of consciousness, medical treatment beyond first aid, significant injuries or illnesses diagnosed by a physician or other medical professional (e.g., cancer, cracked bone, punctured eardrum, etc.) and others. We summarized annual incidents for “injuries and illnesses” and “fatalities” by NAICS category and by incident type, “transportation, “falls, slips and trips”, “exposure to harmful substances or environments”, “fires and explosions”, and “violence by person or animal”. Similar to OES, injuries, illnesses and fatalities represent private and local industries, as state government data were not available for our selection due to limited sample size.

2.2. Modeling Approach

Annual average water withdrawal (m3), water consumed (m3), and energy consumed (MMBtu) are divided by annual average net primary electricity (MWh) produced to determine the average water use rate and energy consumption rate by energy source within the energy sector’s plant operations (Figure 1). Energy consumption is based on domestic and imported primary energy sources to generate electricity for export, residential, commercial, industrial, and transportation sectors. Electricity is then transmitted and distributed onto the grid, losing electricity in the process. Water used for thermoelectric cooling is withdrawn and dissipated or consumed. During this process of electricity generation, rates of emissions (i.e., CO2, SO2 and NOx) are calculated as average annual pollution per MWh net electricity (kg:MWh). Evaluation of employee health and wellbeing are not captured in rates of net electricity production because the number of jobs per net generated electricity does not capture the conservative representation of a power plant’s employment. A certain number of employees are needed to maintain and operate an electric plant of a given capacity regardless of the plant’s electricity output—which is the interest of this study [44,45]. Therefore, rates of employee health are processed as annual average incidents (i.e., injury, illness, fatality) in NAICS categories “Utilities” (NAICS 221), “Electricity production, transmission and distribution” (NAICS 22111), “Water, sewage and other systems” (NAICS 22113), and electricity generation by fossil fuels (NAICS 221112) divided by MW capacity of the electrical sector. Similarly, employee wellbeing is the annual average salary of electricity generation by fossil fuels (i.e., combination of petroleum, coal, and all other fossil fuels) (NAICS 221112), nuclear (221113), hydroelectric (NAICS 22111), wind (NAICS 221115), geothermal (NAICS 221116), biomass (NAICS 221117), and “other” power generation (NAICS 221118) and solar (NAICS 221114) divided by the MW capacity of each respective energy source.

2.3. Data Quality and Control

Data included in this study is self-reported to various institutions that require different reporting standards and therefore provides an approximation of water, energy, emissions and employee welfare measures when aggregated. There exists well-known underreporting of injuries and illnesses to the US Bureau of Labor Statistics Survey of Occupational Injuries and Illnesses that may reach 69% [46]. Additionally, OES surveys for employment and average annual salary are limited to private and local industry as state governments are too few and not required to report. In this study, we acknowledge these limitations in our worker safety and employment rates, as well as self-reported water data from power plants.

3. Results

3.1. Water Use Estimates

Annual estimates of water withdrawal and consumption decreased during the study period (m3), with rates of water use (m3/MWh) varied by energy source and that once-through cooling generates the highest withdrawals and recirculating cooling systems the highest water consumption rates (Figure S1). Withdrawal rates were the highest for petroleum and other (i.e., includes blast furnace gas, batteries, hydrogen, purchased steam sulfur, tire-derived fuels and other miscellaneous energy sources) with 98.12 and 268.88 m3/MWh, respectively. Rates were lower for natural gas (62.43 m3/MWh), coal (40.35 m3/MWh) and nuclear (28.69 m3/MWh), biomass (18.48 m3/MWh) and solar thermal (3.74 m3/MWh) (Table 1). Consumption rates are significantly higher for Other (35.39 m3/MWh) than other sources, which range from 1.58 to 3.31 m3/MWh (Table 2), as its composition of prime movers and cooling system types drive water use rates. Other has consistently higher withdrawal and consumption rates averages due to the composition of its prime movers and cooling systems. Of its steam powered generators, various cooling systems and respective withdrawal and consumption rates include six once-through (307.20 and 9.19 m3/MWh), six complex (451.40 and 9.19 m3/MWh) and one recirculating tower (2.25 and 2.25 m3/MWh). Additionally, Other has six combined cycle generators with recirculating tower systems with rates 2.42 and 2.16 m3/MWh for withdrawal and consumption, respectively. Energy sources with once-through cooling systems and steam technology withdrew more water per MWh while recirculating cooling systems often consumed more water per MWh. The bootstrapping bias is lower in consumption estimates than in withdrawal estimates, suggesting higher precision within resampling. Of the six years observed, we found that annual and observed withdrawal and consumption hold a high positive correlation, with 0.83 for withdrawal and 0.82 for consumption.

3.2. Energy-Water Network

Electricity generation within US power plants consumes 41.17 Quad Btu primary energy to generate 4097.89 TWh of net electricity on annual average (Figure 2). Net electricity lost via transmission and distribution averages 5% (i.e., 204.89 TWh) of net electricity produced. Of the 4097.89 TWh generated, coal is the leading provider (32.5%), followed by natural gas (28.1%), nuclear (20.4%), hydro-electric conventional (6.2%), wind (5.3%), biomass (3.9%), solar (1%). Geothermal, hydro-electric pump storage, petroleum, other gases and “all other” each contribute <1% of total net electricity generated. Water used for thermoelectric cooling includes 170,183.53 Mm3 of water withdrawn, of which 7872.42 Mm3 (4.62%) was consumed and 162,311.12 Mm3 (95.37%) was discharged back into the cooling system (i.e., surface cooling, closed system, lake or river, etc.). Coal, natural gas and nuclear were the highest energy-consuming conventional sources, with 13.39, 11.57, and 8.40 Quad Btu, respectively. Estimated renewable energy consumption (i.e., fuel equivalents) was highest for hydroelectric conventional (2.54 Quad Btu) and wind (2.18 Quad Btu).
Estimated average annual water use by energy sources were highest for conventional energy sources. Natural gas, coal and nuclear led both conventional and renewable energy sources in most water withdrawn, with annual averages of 85,213.72 (50.07%), 50,394.03 (29.61%), and 23,054.72 (13.55%) Mm3, respectively. Biomass led renewable water withdrawal at 1091.80 (0.64%) Mm3 followed by solar with 166.86 (<0.01%) Mm3. Water consumption is also led by natural gas, coal and nuclear with 3016.54 (38.31%), 1973.30 (25.07%), and 1494.66 (18.99%) Mm3. Biomass again ranks highest among renewables, accounting for 2.48% (195.55 Mm3) of total water consumption, followed by solar with 1.47% (115.55 Mm3). Notably, annual estimated water withdrawal and consumption decreased for coal and petroleum 2014–2019, yet increased for natural gas, reflecting their relative changes in net electricity production.
As expected, water and energy use, when scaled, demonstrates that renewables have low energy consumption (i.e., estimated fossil fuel displaced) compared to conventional and near zero water withdrawal. Petroleum has the highest rates of energy and water consumption, while solar thermal has the highest rate of water consumption amongst other energy sources (Figure 3). Rates of emissions (i.e., CO2, SO2 and NOx) per 1 MWh for conventional energies is highest for petroleum, which emits the most CO2, SO2 and NOx on average with 1081.92, 3.35, and 1.75 kg/MWh, respectively. Coal is the second largest emitter of CO2, SO2 and NOx on average with 1019.79, 1.57, and 0.93 kg/MWh, respectively. The third lowest emitting energy source is natural gas with 449.18, 0, and 0.28 kg/MWh of CO2, SO2 and NOx on average. Nuclear reported zero emissions. Emissions of SO2 include coal (95%) and petroleum (5%) only.
The electric sector on annual average increased net electricity generation, while reducing emission and consumption footprints (Table 3). Energy consumption decreased from 10.28 to 9.78 MMBtu/MWh, averaging 10.05 MMBtu/MWh. Temporal trends of net electricity produced per unit energy consumed decreased for all energy sources, except for coal and petroleum (Figure S2), but over net electricity production increased for hydro-electric conventional, natural gas, nuclear, other gases, solar and wind (Figure S3). Annual estimated water use maintained a steady water withdrawal rate averaging 65.54 m3/MWh and water consumption rate increased from 2.15 to 2.17 m3/MWh. Once-through and complex cooling systems decreased in reporting power plants (i.e., >100 MW capacity) while recirculating systems with cooling ponds and towers increased. Emissions of CO2, SO2 and NOx also decreased over time, from 0.53 to 0.41; 0.0008 to 0.0002; 0.0004 to 0.0003 MT/MWh, respectively.

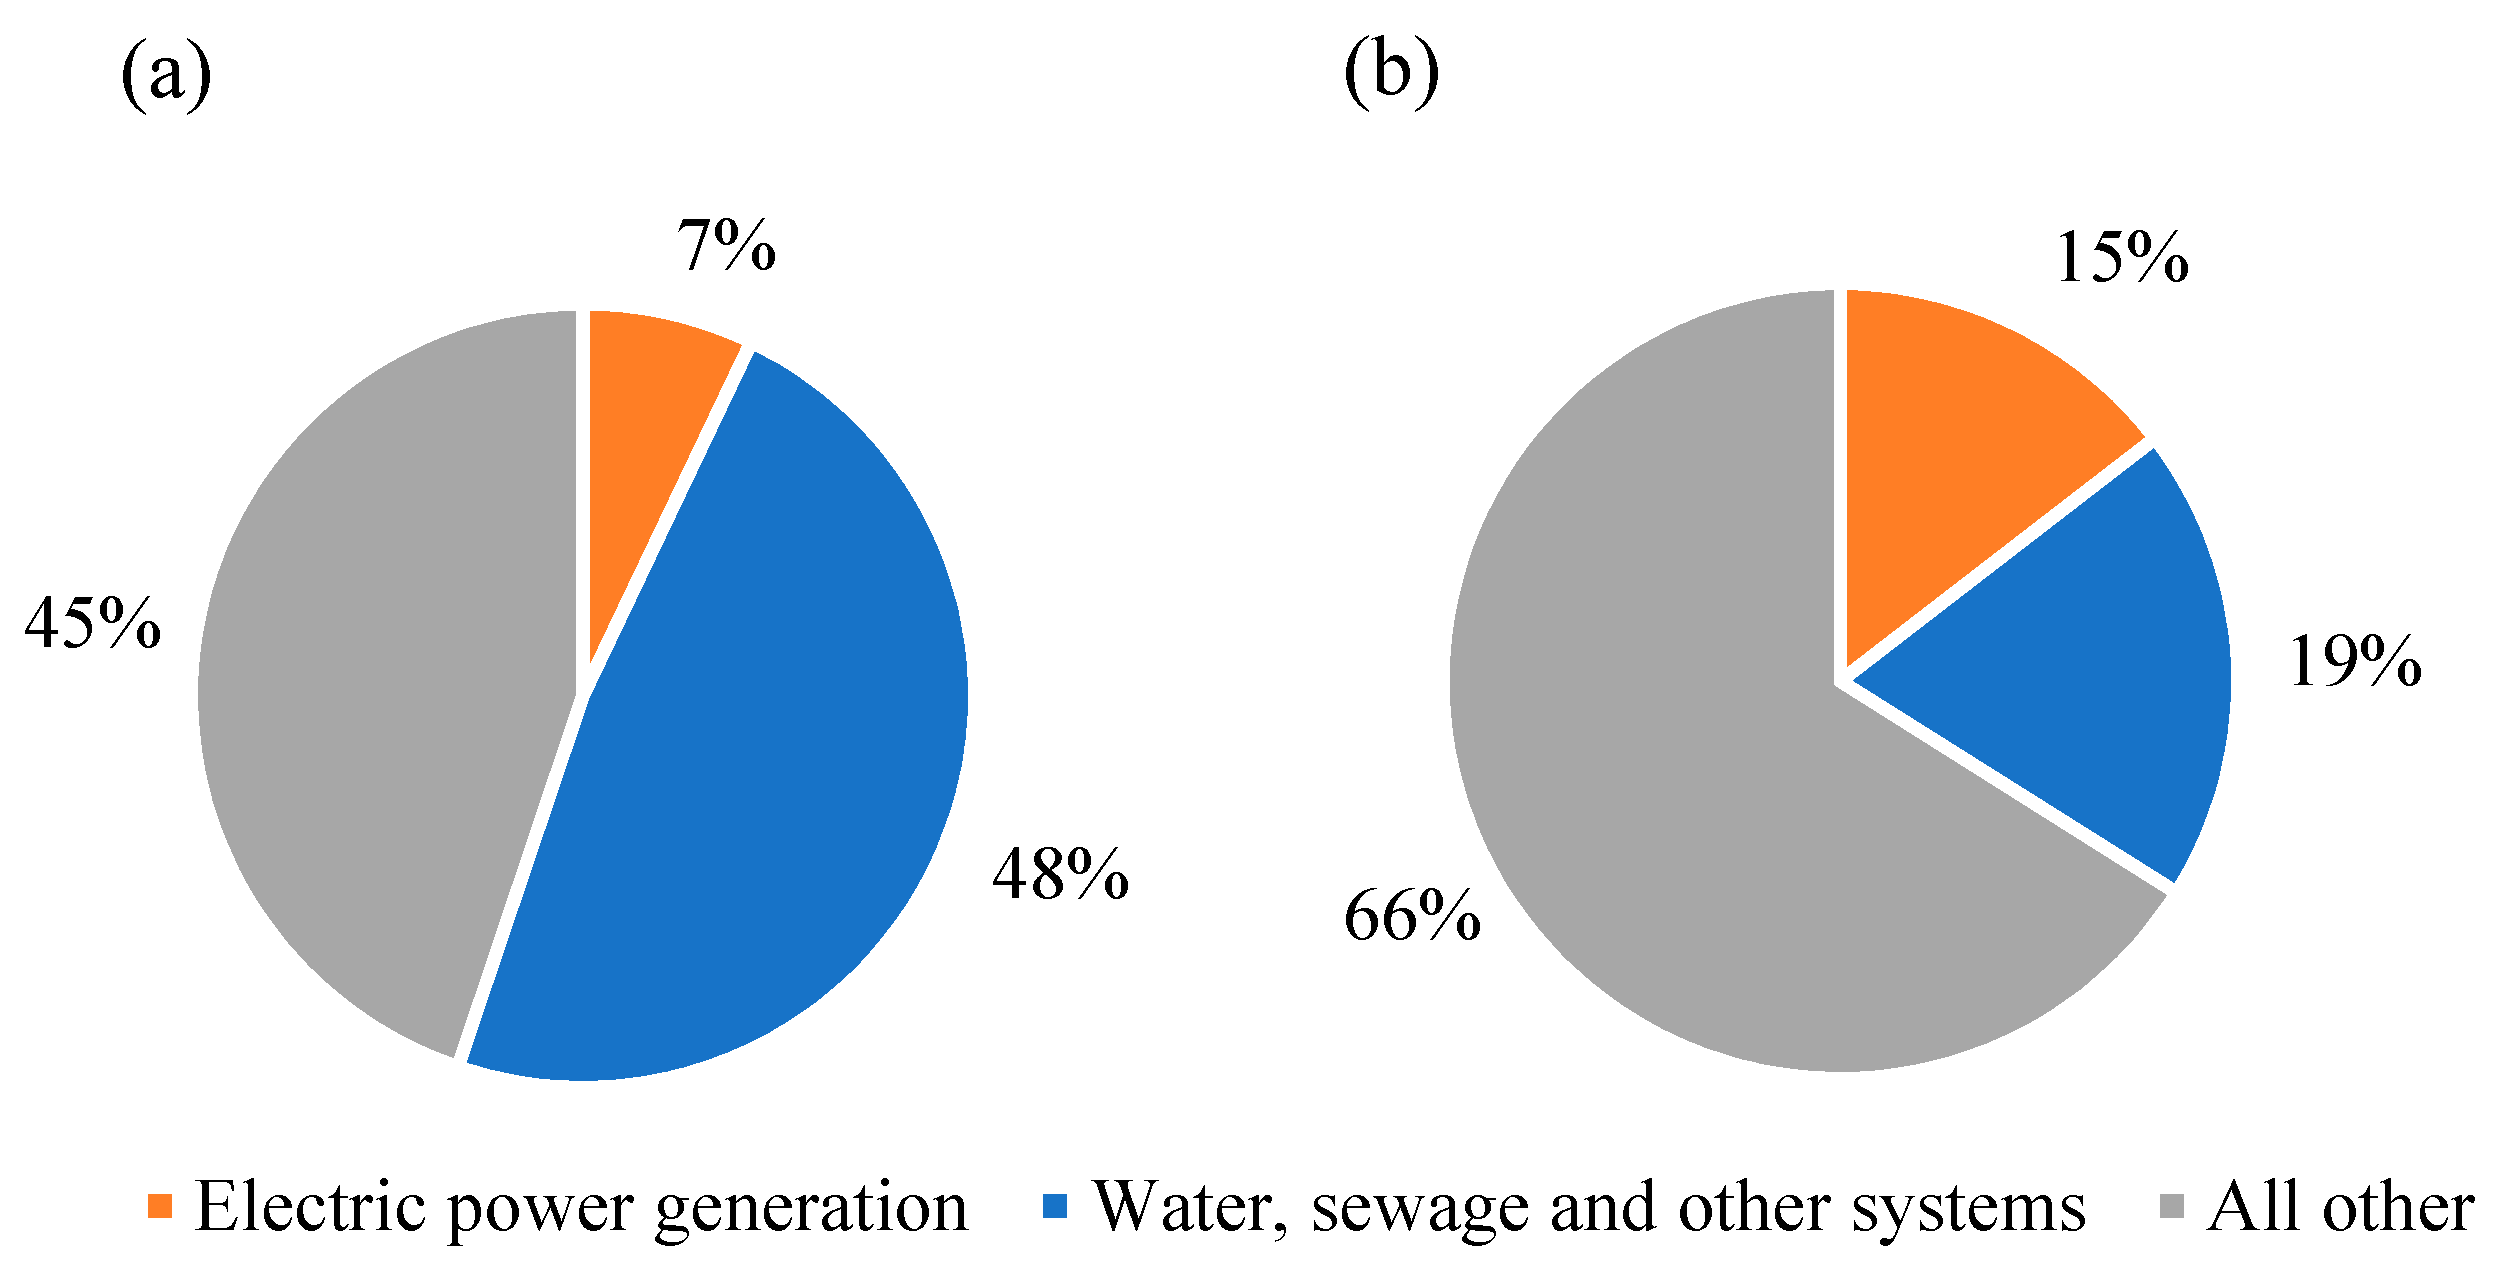
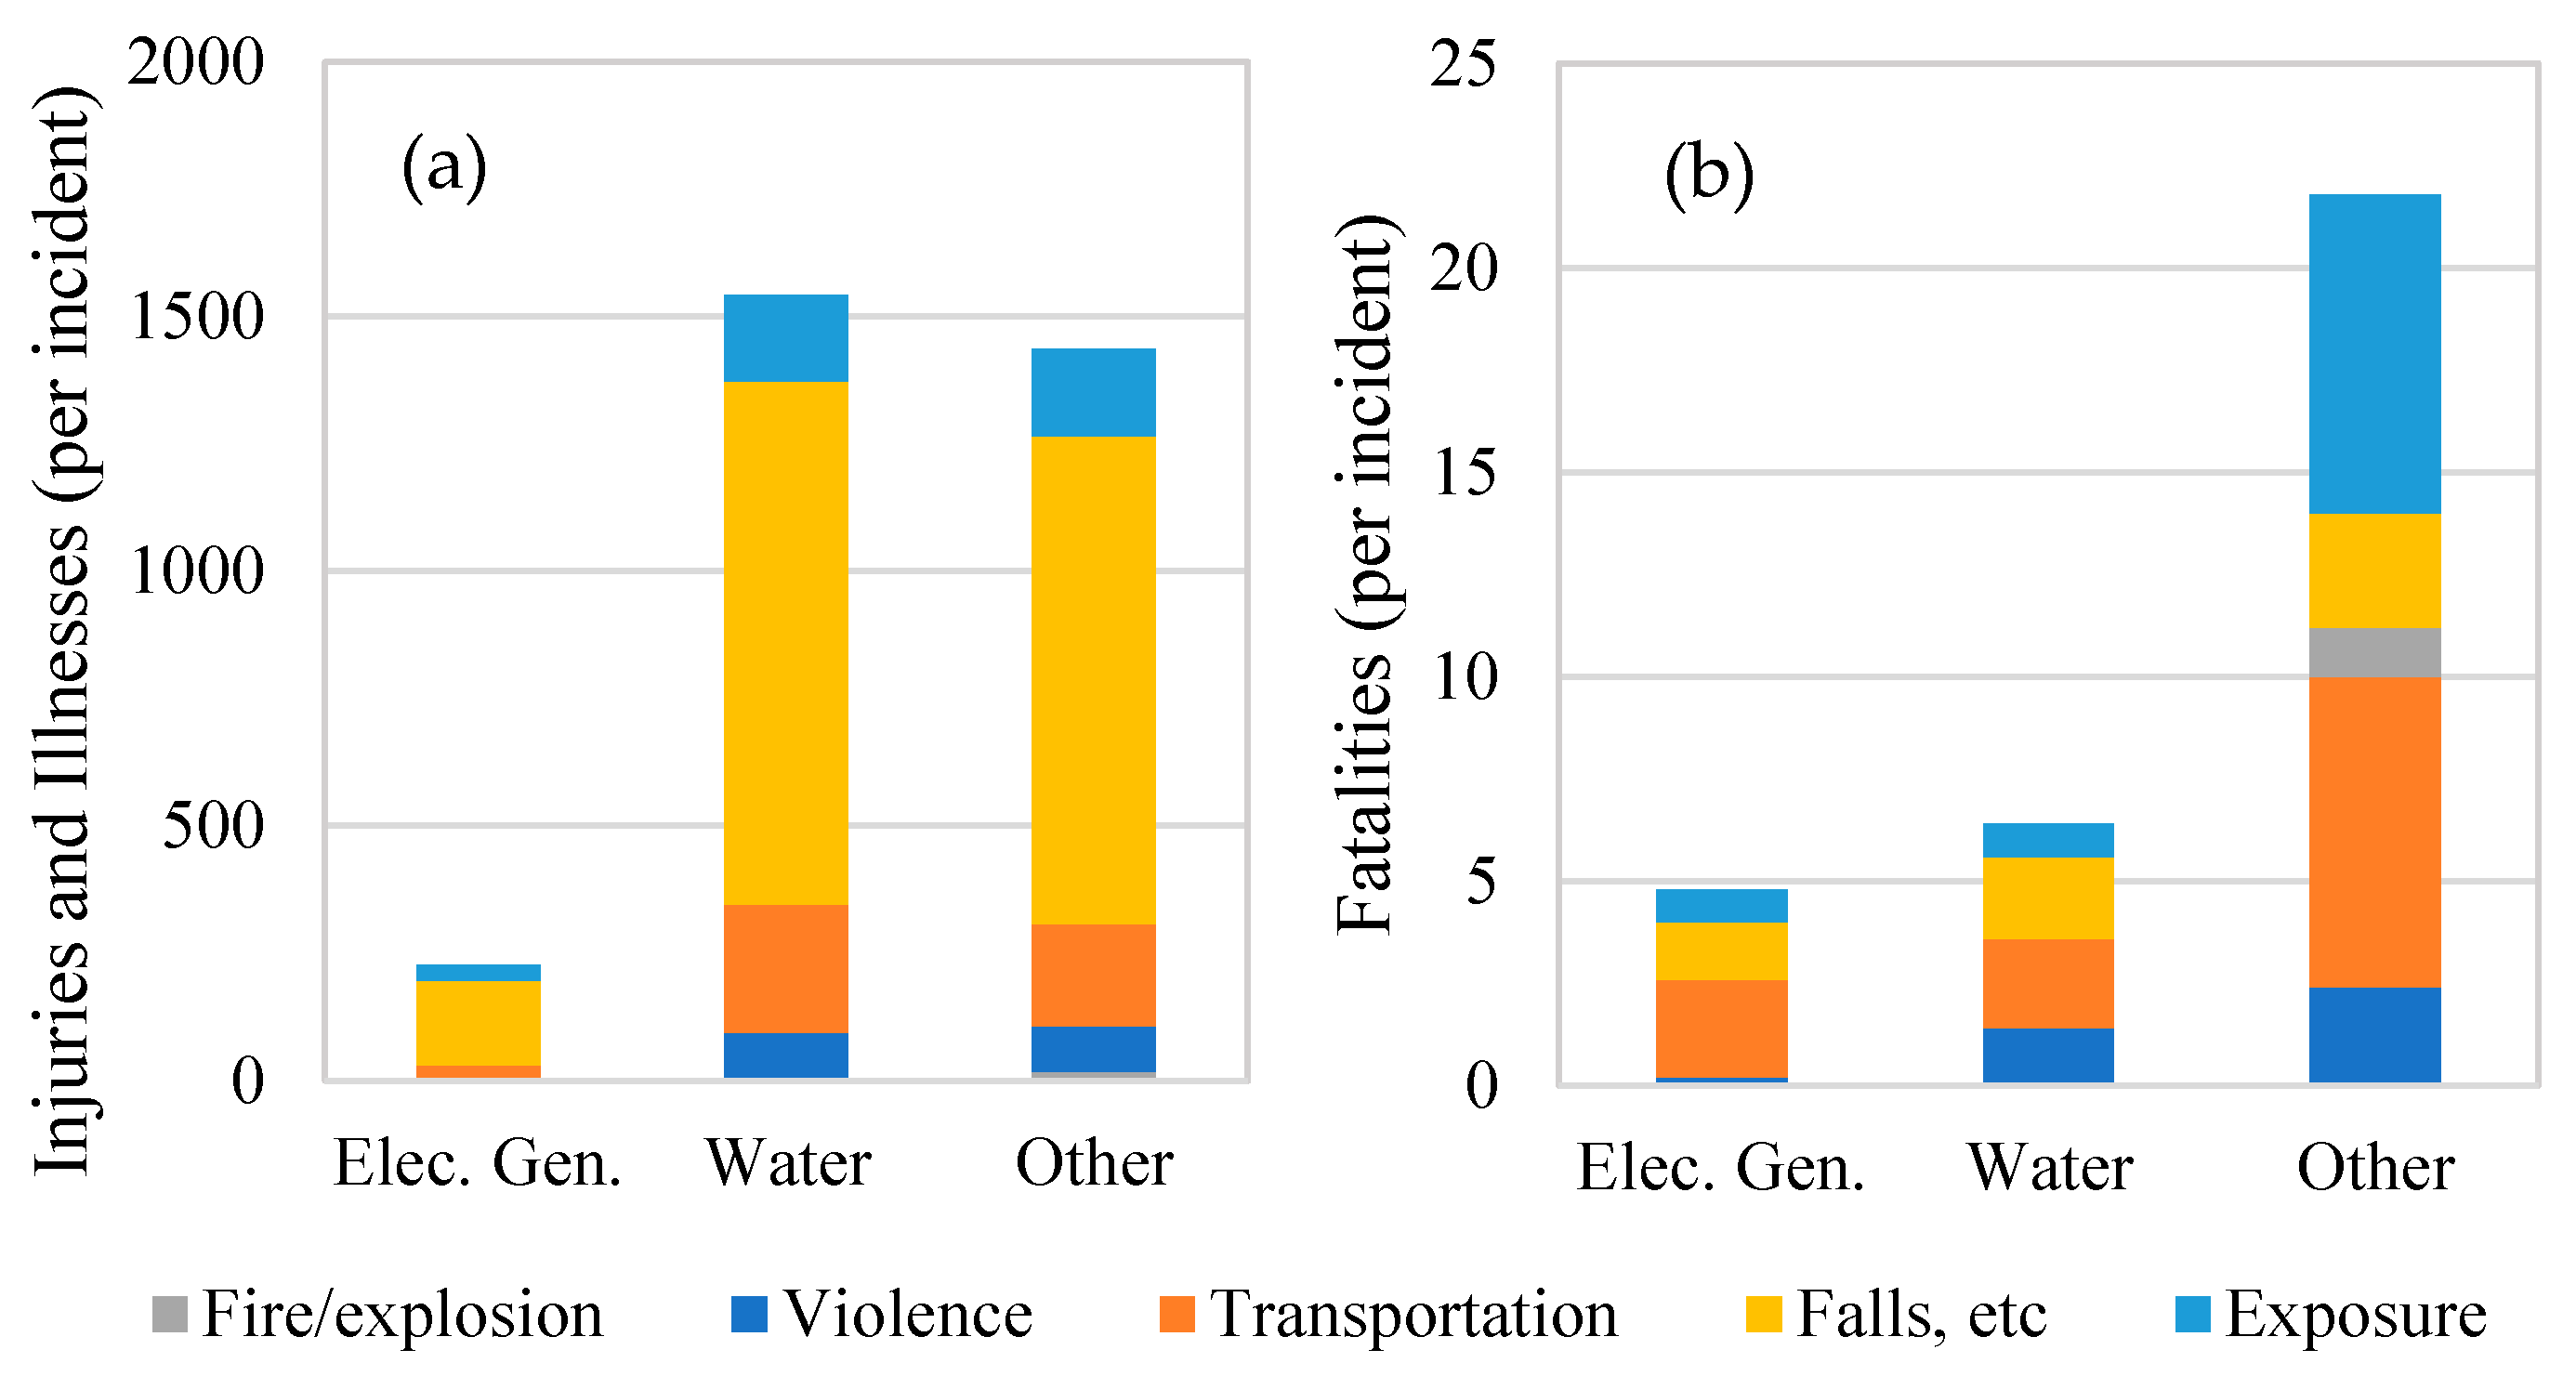
3.3. Social Impact Assessment of Electricity Generation in the Energy-Water Nexus

Annual average rate of injury, illness and fatalities per TWh within NAICS parent category Utilities (221) and subcategories Electric power generation (NAICS 22111) and Water, sewage and other systems (NAICS 22113) provide approximation of employee health by sector, as not all energy sources are surveyed. During the study period, Utilities recorded 3205 injuries and illnesses and 33 fatalities on average, annually, and was led by Water, sewage and other systems. Electric power generation contributes more to total fatal incidents than total injuries and illnesses, while Water, sewage and other systems contribute more illnesses and injuries. Overall, slips, trips, and falls contribute the majority of injuries and illnesses while the majority of fatalities are caused by transportation incidents. We found that relative contributions of electric power generation by fossil fuels (NAICS 221112) to overall electric power generation (NAICS 22111) is 70% of injuries and illnesses and 25% of fatalities on an annual average. Additionally, electric generation using fossil fuels contributes to a rate of 0.039 injuries and illnesses per TWh and 0.0003 fatalities per TWh annually.
Within the subcategory of Electric power generation, a total of 226.7 nonfatal incidents (0.06 per TWh) and 4.8 fatal incidents (0.001 per TWh) were recorded on average; contributing to 7% of injuries and illnesses and 15% of fatalities within Utilities (Figure 4). Another subcategory of Utilities—Water, sewage and other systems—totaled 1541.7 injuries and illnesses (0.376 per TWh) and 6.4 fatalities (0.002 per TWh) on average, annually; contributing to 48% of all injuries and illnesses and 19% of all fatalities in Utilities. The remaining “All other” category relates to electric transmission and distribution as well as natural gas distribution, which contributes to 44% of injuries and illnesses and 66% of fatalities in Utilities on average, annually.
Falls, slips, and trips contributed to the majority of all injuries and illnesses contributing 67.13% (0.53 per TWh) for Utilities, 73.53% (0.04 per TWh) of Electric power generation, and 66.7% (0.25 per TWh) of instances in Water sewage and other systems (Figure 5). Transportation incidents were the next highest contributor to injuries and illnesses, representing 15.08% (0.12 per TWh), 0.94% (0.01 per TWh), and 7.85% (0.06 per TWh) in Utilities, Electric power generation, and Water, sewage, and other systems, respectively. Exposure to harmful substances or environments contributed to 11.54% (370) in Utilities, 13.24% (30) in Electric power generation and 10.92% (168.33) of all injuries and illnesses in Water, sewage and other systems. Electric power generation by fossil fuels contributed 70% (i.e., 158.3 of the 226.7) of the total injuries and illnesses recorded in Electric power generation; accounting for 52.94% (120; 0.03 per TWh) of falls, slips and trips, 6.62% (15; 0.004 per TWh) and 10.29% (23; 0.006 per TWh) of exposures to harmful substances.
The highest contributing category to annual average fatalities in Electric power production and Water, sewage and other systems was transportation, followed by falls, slips and trips. Transportation contributed to 36.97% (0.003 per TWh), 50% (0.0006 per TWh), and 34.38% (0.0005 per TWh) of all deaths in Utilities, Electric power generation, and Water, sewage, and other systems, respectively. Falls, slips, and trips contributed to 18.79% of all deaths in Utilities (0.002 per TWh), 29.17% in Electric power generation (0.0003 per TWh), and 31.25% in Water, sewage, and other systems (0.0005 per TWh). Incidents of exposure to harmful substances or environments contributed to 28.48% of all fatalities in Utilities (0.002 per TWh), 16.67% in Electric power generation (0.0002 per TWh), and 12.5% of fatalities in Water, sewage, and other systems (0.0002 per TWh). Electricity generation by fossil fuel accounted for only 25% (i.e., 1.2 of 4.8) of fatalities in Electric power generation, contributing to 8.33% of transportation incidents, 14.29% of falls, slips and trips, and 75% (0.0001 per TWh) of exposures to harmful substances or environments.
We found that while employment numbers have decreased and salary has increased for employees within utilities, pay has remained the same per MW capacity (Table 4). Similarly, while employment has increased in sectors of electric power generation and water, sewage and other systems, salary per MW generated has remained consistent from 2014 through 2019. According to the US BLS Occupational Employment Statistics (i.e., specific occupational employment; SOC 51-000), production occupations include supervisors of production workers, as well as assemblers, fabricators, power distributors and dispatchers, and others. Mean annual pay per MW capacity is highest for subcategory Electric power generation, transmission and distribution during the study period and ranged USD 0.06–0.07/MW, but 2019 pay returned to lower 2014 values of USD 0.06/MW after remaining at USD 0.07/MW 2015–2018. Parent category Utilities held a steady pay of USD 0.06/MW, but a closer look reveals the annual average rose steadily over time from USD 68,820 to USD 77,270. Water, sewage and other systems receive the least mean annual pay with a USD ~2 k increase over the study period and a constant rate of USD 0.04/MW capacity. From 2014 to 2019, Electric power generation, transmission and distribution had a higher average salary per unit of electricity capacity than that of Utilities or Water, sewage and other systems; Utilities employs more workers per unit of electricity capacity on average.
We found rates of employment (employment:MW) and annual salary (USD:MW) by energy source are sensitive to increases in generator capacity and do not always match or maintain capacity growth (Figure 6). Capacity largely decreased for conventional fuels and increased for renewables including for hydroelectric, solar, wind and “all other” energy sources (i.e., batteries, hydrogen, purchased steam sulfur, tire-derived fuels and other miscellaneous energy sources) (Figure S4). Capacity decreased for fossil fuels (i.e., natural gas, nuclear, petroleum and other gases), nuclear, and biomass. Geothermal capacity remained steady. Of the total number of jobs for electric power generation, transmission and distribution (NAICS 2211), fossil fuel electricity generation (NAICS 221112) has an average of 23,846 plant occupational jobs with an average USD 79,126 annual salary 2016–2019. Job numbers for fossil fuel electricity generation (NAICS 221112) decreased from 48% to 29% (26,730 to 22,080), yet annual average pay increased from USD 74,010 to USD 83,990. As fossil fuels decline in capacity, there are fewer workers per MW capacity paid at higher salaries in 2019 than in 2014. Solar and wind significantly grew their capacity, outpacing salary and employment. Energy sources with highest employment include fossil fuels, nuclear and hydropower, with an average 23,125; 8078 and 2598 employed production occupations, respectively, and mean annual pay of USD 80,405, USD 96,193, and USD 70,965, respectively, 2016–2019. Fossil fuels, nuclear (NAICS 221113) and hydroelectric conventional employed an average 0.02, 0.08, and 0.08 employees/MW, respectively and paid USD 0.09, USD 0.92, and USD 0.89 annually per MW.
Among the top three highest employing energy sources 2016–2019, electric power generation by fossil fuels required fewer production workers and offered the lowest salaries per MW of electricity. Hydroelectric increased employment and salary; fossil fuels decreased employment and increased salary; nuclear decreased employment and increased salary; wind (NAICS 221115) decreased employment and increased salary; geothermal (NAICS 221116) decreased employment and increased salary; biomass (NAICS 221117) decreased employment and increased salary; other power generation (NAICS 221118) increased employment and salary. Solar (NAICS 221114) cannot be determined, as production occupations were only released in 2019 and the previous year 2016 did not release values; therefore, 2017–2018 evaluated installation, maintenance and repair occupations (SOC 49-000) as a proxy.

4. Discussion

We evaluated the water–energy nexus of power plants with >1 MW generator capacity for a national evaluation of electricity production and integrated measures of employment and employee welfare (i.e., injuries, illnesses, fatalities, and salary). We found employment and salary per MW capacity proves as a useful indicator to mark occupational growth and wellbeing as the electricity sector transitions to renewable energy and adjusts to policy changes (e.g., emission standards, resource extraction limitations, water use policy, etc.). Renewables increased capacity during the study period, while fossil fuels decreased, which maintains momentum towards IEA’s 2050 renewable energy generation goals [47]. We agree renewables will soon replace coal, of which the electrical sector consumes about 90% [48], and found coal to decrease net electricity production by ~600 million MWh during the study period. Capacity trends also reflect the US general public’s attitudes and desire to reduce fossil fuel emissions and conserve energy reflected in the Gallop Poll’s survey on energy [49]. When asked which energy source the US should put more emphasis in, coal, oil and natural gas declined from 2013–2019 (31–22%, 46–28%, and 65–45%, respectively) while solar increased and wind remained steady (76–80% and 71–70%, respectively). Likewise, respondents reported higher favor to put less emphasis on coal, oil and natural gas (41–50%, 32–43%, 10–19%, respectively). However, natural gas increased during this study period, while coal and oil declined. Coal and natural gas had the highest average reported capacity of all energy sources (24% and 44%, respectively) and also had the second and third highest reported emissions of CO2 (67% and 32%, respectively) and NOx (70% and 27%, respectively). Conversely, oil (i.e., petroleum) may be perceived as a leading energy provider, but only contributes <1% to net electricity production on annual average and is declining in production.
Our results agree with previous studies that anticipated water consumption to increase due to changes in cooling system types; however, water withdrawal also increased, which was not reported in previous studies [15,16]. In this study, water consumption increased by 0.93% m3/MWh and water withdrawal slightly increased by 0.31% m3/MWh. Our mean rates by energy source were within range of median estimates in a 2012 literature review, which evaluated energy source generation by prime mover and cooling system type [19]. The exception from this is biomass water consumption rates estimated as 3.31 m3/MWh in this study and a max of 2.09 m3/MWh in Macknick et al. 2012 and we attribute this to high rates from wood waste electricity production using steam prime movers and once through cooling systems steam without cooling pond(s) or canal(s). We found water use estimates are driven by prime mover and cooling system type (Figure S1) and are therefore subject to change depending on the time period assessed and technological composition power plants reporting. We found recirculating cooling systems, which are now preferred, to withdraw significantly less water and consume at slightly greater rates per MWh net electricity in multiple energy sources. For example, as coal continues to decline in capacity and is replaced by natural gas, nuclear and renewable energies, once-through and steam powered systems will likely be replaced by closed loop systems that require less water use.
Trade-offs and policies for adopting new energy sources must consider thermal pollution and consequential ecological impacts, geographic location, as well as water scarcity [50,51]. Water use in thermoelectric cooling is subject to future shift policies that drive changes in energy infrastructure, which in turn affects plant operations, energy production, and cost as well as future developments. One example of such a policy the Clean Water Act (CWA), which regulates thermoelectric cooling and influences the production of electricity and environmental health, including the treatment and cooling of water to avoid discharging hot water with low dissolved oxygen back to the ecosystem. Additional policies include: (1) limitations to the amount of toxic metals discharged; (2) the requirement for new wet-recirculating cooling systems or equivalent (i.e., CWA section 316(b)) [52,53]. Specifically, hydropower faces multifaceted policy constraints regarding energy production and non-energy services (i.e., agriculture, flood control, navigation, recreation, etc.). Due to these new policies and reported trends in EIA cooling systems by plants, increases in closed-loop cooling systems are anticipated to grow and decrease water withdrawals over time [52], but will consequently increase water consumption per MWh generated. Additionally, this study accounted for emission controls of SO2 and NOx but did not estimate CO2 pollution control systems, as it may vary by power plant (i.e., infrastructure age, policy controls, and affordability). This may be accounted for by life cycle assessments in future research.
While plant operator employment overall decreased for Utilities (NAICS 221), numbers remained steady for Energy generation, transmission and distribution (NAICS 2211), and Water, sewage and other (NAICS 22113). Employment by energy source decreased for fossil fuels, as well as pay. Surprisingly wind employed fewer plant operators over the study period but increased annual pay as did other renewables. Net electricity generation and capacity both increased during the study period (Figures S3 and S4), indicating that decreased employment seen in overall Utilities employment may not have impacted plant-level operations specified for generating electricity. The gradual decline in Utilities employment numbers corresponds to the decline in energy (MMBTu) and water (m3) consumed and emissions (Thousand MT) to produce 1 MWh of net electricity (Table 3). This indicates that while electricity generation continued steady employment, changes elsewhere in Utilities’ subcategory (i.e., natural gas distribution and transmission and distribution) may have decreased employment. Literature on employment and worker welfare have found renewables to increase employment and benefit the economy [6,7,29,54]; however they vary by power plant size. Distributed energy systems such as microgrids are popular choices for renewables, particularly the solar industry. Large-scale facilities may employ more in-house occupations whereas dispersed energy system occupations may not be captured by current classifications and merit additional study.
We found that Water, sewage and other systems result in more injuries, illnesses and fatalities than Electric power generation alone. More so, trips and falls contributed to the majority of illnesses and injuries, which was the second highest contributor to fatalities, following transportation incidents. Therefore, energy sources with higher water use rates, such as petroleum, natural gas, coal and nuclear energies may have higher rates of injuries, illnesses and fatalities energy sources with low water use, such as renewables. Existing literature agrees that fossil fuel electricity generation is largely more dangerous than renewables [28], but also that contributions of Water, sewage and other systems need closer evaluation. Plant workers suffer more from cuts and lacerations [55]. This may explain why the majority of fatalities by exposure to harmful substances or environments in Energy power generation were attributed to fossil fuel power generation. Electric power generation compared to international fuel supply chains report far fewer injuries, illnesses and fatalities. Internationally, coal contributes three-times more fatalities due to methane and mining than non-OECD countries, and fatalities are the lowest due to hydro and nuclear power in OECD countries [56]. Non-hydro renewable energy in both OECD and non-OECD countries have much lower fatalities rates due to their decentralized nature, which limits the possibility of massive impact [57].
As the renewable energy sector transitions to distributed systems, it is important to continue evaluating the implications on employee welfare [58] as well as sociopolitical acceptance [59]. While we acknowledge the uncertainty associated with measures of injuries, illness and fatalities due to underreporting, an uncertainty analysis is outside the scope of this study. A national level uncertainty analysis is challenged by possible variations in reporting across states, as states with low rates of nonfatal injuries have high rates of fatal injuries and vice versa [60,61]. More research is needed to see if similar concerns vary by industry. Capture–recapture, case matching and semi-structured interviews are essential to overcome problems with accuracy in occupational counts [60,62,63,64]. Continued efforts to characterize injuries, illnesses and fatalities within power plant occupations by energy source will encourage a sustainable transition to a renewable energy economy through effective public health policy, appreciation of its economic toll, and lessening public concern regarding occupational exposure.

5. Conclusions

This work constructed a novel analysis within the water–energy nexus framework that integrates the human-dimension with water and electricity generation data. We estimated water use, energy consumed, and emissions created per MWh net electricity and employee welfare per MW capacity by energy source using publicly available data in the US for a national-scale analysis of the electricity sector by energy source. We found that increases in net electricity generation and generator capacity were met by decreases in employment rates and consistent annual salary rates. As we transition to a renewable energy society and witness increased net electricity production and generation capacity, future research should focus on the uncertainty of injuries, illnesses and fatalities, as they are underreported. Continued efforts to evaluate recent reports of employment, salary and employee health by energy source are also needed to observe impacts of policy and changes in the electricity sector.
In process of electric power generation, renewables (i.e., biomass, geothermal, hydro-electric conventional and pump-storage, solar and wind) consume an estimated 10.64 MMBtu/MWh of fossil-fuel equivalent energy and 2.95 m3/MWh of water on annual average, compared to 13.15 MMBtu/MWh and 8.57 m3/MWh by conventional energy sources. Water withdrawal is also lowest for renewables (11.11 m3/MWh) compared to conventional energy sources (99.69 m3/MWh). Among conventional energies, natural gas consumes the least energy (8.48 MMBtu/MWh) and emits the least CO2 (449.18 kg/MWh); however, it withdraws 50.1% (62.43 m3/MWh) and consumes 38.3% (2.21 m3/MWh) of all estimated water for thermoelectric cooling. This is more than other conventional energies. As natural gas contributes to 28.1% of net electricity produced on annual average and is increasing capacity, likely replacing the 32.5% of net electricity provided by coal, water use by conventional energies and the energy sector overall may increase if electricity production favors natural gas over renewable energies such as solar and wind.
Lastly, fossil fuels contributed the most injuries and illnesses on average per TWh of annual average net electricity generated. Within Electric power generation, fossil fuels contributed to 70% of injuries and illnesses, mostly due to falls, slips and trips, and 15% of fatalities, mostly due to exposure to harmful substances and environments, averaging 0.037 injuries and illnesses per TWh and 0.0003 fatalities per TWh net electricity. Fossil fuel capacity declined, as did employment and salary per MW capacity. The top three energy sectors with the highest employment included fossil fuels, nuclear and hydropower at an average 0.02, 0.08, and 0.08 employees/MW capacity with annual average salaries of USD 0.09, USD 0.92, and USD 0.89 per MW, respectively. While both wind and solar increased capacity, employment rates did not maintain pace with growth; however, wind salary per MW outpaced capacity growth. Continued surveys of worker welfare by energy generation source will further aid power industry transition and operational decision makers.

Supplementary Materials

The following are available online at https://www.mdpi.com/article/10.3390/en14092633/s1, Figure S1: Water use rates by energy source, cooling system and prime mover, Figure S2: Temporal energy consumed per net electricity generated by energy source, Figure S3: Temporal net electricity production by energy source, Figure S4: Temporal changes in total generator nameplate capacity by energy source, Table S1: Average annual CO2, SO2 and NOx emission rates for petroleum, natural gas and coal.

Author Contributions

Conceptualization, G.S., I.C., J.C.; methodology, G.S., I.C., J.C.; formal analysis, data curation, visualization and writing—original draft preparation, G.S.; writing—review and editing, I.C., J.C., M.B., S.W., H.T.-D., A.A., S.M.-P., R.A.S., R.C., P.S., X.M.; visualization, G.S., X.M., H.T.-D.; supervision, I.C., J.C.; project administration, I.C.; funding acquisition, I.C. All authors have read and agreed to the published version of the manuscript.

Funding

This work is supported by National Socio-Environmental Synthesis Center (SESYNC) under funding received from the National Science Foundation (NSF) DBI-1639145.

Institutional Review Board Statement

Not applicable.

Informed Consent Statement

Not applicable.

Data Availability Statement

The data presented in this study are available on request from the corresponding author.

Acknowledgments

This work was supported by the National Socio-Environmental Synthesis Center (SESYNC) under funding received from the National Science Foundation DBI-1639145. Support for this research was provided by the Great Lakes Bioenergy Research Center, U.S. Department of Energy, Office of Science, Office of Biological and Environmental Research (Awards DE-SC0018409 and DE-FC02-07ER64494) at the Kellogg Biological Station. This material is based upon work supported by the National Science Foundation Graduate Research Fellowship under Grant No. (DGE-1848739). MB was partially supported by the Undergraduate Research, Scholarly and Creative Activity (URSCA) funded by the University of Wisconsin-Platteville. The authors are grateful for expert knowledge from Garvin Heath of the National Renewable Energy Laboratory and Chris Cassar of the U.S. Energy Information Administration.

Conflicts of Interest

The authors declare no conflict of interest.

References

  1. Wachs, L.; Singh, S. Projecting the Urban Energy Demand for Indiana, USA, in 2050 and 2080. Clim. Chang. 2020. [Google Scholar] [CrossRef]
  2. Kammen, D.; Kapadia, K. Putting Renewables to Work: How Many Jobs Can the Clean Energy Industry Generate. RAEL Rep. Univ. 2004, 24. [Google Scholar] [CrossRef]
  3. IRENA. Global Renewables Outlook: Energy Transformation 2050, 2020th ed.; International Renewable Energy Agency: Abu Dhabi, United Arab Emirates, 2020. [Google Scholar]
  4. Gopal, C.; Mohanraj, M.; Chandramohan, P.; Chandrasekar, P. Renewable Energy Source Water Pumping Systems—A Literature Review. Renew. Sustain. Energy Rev. 2013, 25, 351–370. [Google Scholar] [CrossRef]
  5. Atilgan, B.; Azapagic, A. An Integrated Life Cycle Sustainability Assessment of Electricity Generation in Turkey. Energy Policy 2016, 93, 168–186. [Google Scholar] [CrossRef]
  6. Klein, S.J.W.; Whalley, S. Comparing the Sustainability of U.S. Electricity Options through Multi-Criteria Decision Analysis. Energy Policy 2015, 79, 127–149. [Google Scholar] [CrossRef]
  7. Gielen, D.; Boshell, F.; Saygin, D.; Bazilian, M.D.; Wagner, N.; Gorini, R. The Role of Renewable Energy in the Global Energy Transformation. Energy Strateg. Rev. 2019, 24, 38–50. [Google Scholar] [CrossRef]
  8. Scott, C.A.; Pierce, S.A.; Pasqualetti, M.J.; Jones, A.L.; Montz, B.E.; Hoover, J.H. Policy and Institutional Dimensions of the Water-Energy Nexus. Energy Policy 2011, 39, 6622–6630. [Google Scholar] [CrossRef]
  9. Jin, Y.; Behrens, P.; Tukker, A.; Scherer, L. Water Use of Electricity Technologies: A Global Meta-Analysis. Renew. Sustain. Energy Rev. 2019, 115, 109391. [Google Scholar] [CrossRef]
  10. Sanderson, M.R.; Bergtold, J.S.; Heier Stamm, J.L.; Caldas, M.M.; Ramsey, S.M. Bringing the “Social” into Sociohydrology: Conservation Policy Support in the Central Great Plains of Kansas, USA. Water Resour. Res. 2017, 53, 6725–6743. [Google Scholar] [CrossRef]
  11. Vakilifard, N.; Anda, M.; Bahri, P.A.; Ho, G. The Role of Water-Energy Nexus in Optimising Water Supply Systems—Review of Techniques and Approaches. Renew. Sustain. Energy Rev. 2018, 82, 1424–1432. [Google Scholar] [CrossRef]
  12. USAID. Watergy: Taking Advantage of Untapped Energy and Water Efficiency Opportunities in Municipal Water Systems. Alliance Save Energy 2002, 11, 140. [Google Scholar]
  13. Griffiths-Sattenspiel, B.; Wilson, W. The Carbon Footprint of Water; River Network: Portland, OR, USA, 2009. [Google Scholar]
  14. Averyt, K.; Macknick, J.; Rogers, J.; Madden, N.; Fisher, J.; Meldrum, J.; Newmark, R. Water Use for Electricity in the United States: An Analysis of Reported and Calculated Water Use Information for 2008. Environ. Res. Lett. 2013, 8, 15001. [Google Scholar] [CrossRef] [Green Version]
  15. Dieter, C.A.; Maupin, M.A.; Caldwell, R.R.; Harris, M.A.; Ivahnenko, T.I.; Lovelace, J.K.; Barber, N.L.; Linsey, K.S. Estimated Use of Water in the United States in 2015 (No. 1441); U.S. Geological Survey: Reston, VA, USA, 2018. [Google Scholar]
  16. Davies, E.G.R.; Kyle, P.; Edmonds, J.A. An Integrated Assessment of Global and Regional Water Demands for Electricity Generation to 2095. Adv. Water Resour. 2013, 52, 296–313. [Google Scholar] [CrossRef]
  17. Peer, R.A.M.; Kelly, T.S. Characterizing Cooling Water Source and Usage Patterns across US Thermoelectric Power Plants: A Comprehensive Assessment of Self-Reported Cooling Water Data. Environ. Res. Lett. 2016, 11, 124030. [Google Scholar] [CrossRef]
  18. Diehl, T.H.; Harris, M.A.; Murphy, J.C.; Hutson, S.S.; Ladd, D.E. Methods for Estimating Water Consumption for Thermoelectric Power Plants in the United States; U.S. Geological Survey: Reston, VA, USA, 2013. [Google Scholar]
  19. Macknick, J.; Newmark, R.; Heath, G.; Hallett, K.C. Operational Water Consumption and Withdrawal Factors for Electricity Generating Technologies: A Review of Existing Literature. Environ. Res. Lett. 2012, 7, 45802. [Google Scholar] [CrossRef]
  20. Harris, M.A.; Diehl, T.H. A Comparison of Three Federal Datasets for Thermoelectric Water Withdrawals in the United States for 2010. J. Am. Water Resour. Assoc. 2017, 53, 1062–1080. [Google Scholar] [CrossRef] [Green Version]
  21. U.S. Energy Information Administration. Monthly Energy Review. 2020. Available online: https://www.eia.gov/totalenergy/data/monthly/ (accessed on 11 November 2020).
  22. U.S. Energy Information Administration. Form EIA-923 Detailed Data with Previous Form Data (EIA 906/920). Available online: https://www.eia.gov/electricity/data/eia923/ (accessed on 11 November 2020).
  23. Wu, S.R.; Celik, I.; Apul, D.; Chen, J. A Social Impact Quantification Framework for the Resource Extraction Industry. Int. J. Life Cycle Assess. 2019, 24, 1898–1910. [Google Scholar] [CrossRef]
  24. Vaseghi, G.; Celik, I.; Burian, S.J.; Apul, D. Economic, Environmental, And Social Criteria Evaluation of Rainwater Harvesting System Options for An Office and Lab Building on the University of Utah Campus. Front. Civ. Eng. 2017, 2, 115–147. [Google Scholar]
  25. Sheikh, N.J.; Kocaoglu, D.F.; Lutzenhiser, L. Social and Political Impacts of Renewable Energy: Literature Review. Technol. Forecast. Soc. Change 2016, 108, 102–110. [Google Scholar] [CrossRef]
  26. Kumar, M.D. Impact of Electricity Prices and Volumetric Water Allocation on Energy and Groundwater Demand Management: Analysis from Western India. Energy Policy 2005, 33, 39–51. [Google Scholar] [CrossRef]
  27. Kis, Z.; Pandya, N.; Koppelaar, R.H. Electricity Generation Technologies: Comparison of Materials Use, Energy Return on Investment, Jobs Creation and CO2 Emissions Reduction. Energy Policy 2018, 120, 144–157. [Google Scholar]
  28. Sumner, S.A.; Layde, P.M. Expansion of Renewable Energy Industries and Implications for Occupational Health. JAMA J. Am. Med. Assoc. 2009, 302, 787–789. [Google Scholar]
  29. Pollack, E. Counting Up to Green: Assessing the Green Economy and Its Implications for Growth and Equity; Economic Policy Institute: Washington, DC, USA, 2012; pp. 1–18. [Google Scholar]
  30. Mulloy, K.B.; Sumner, S.A.; Rose, C.; Conway, G.A.; Reynolds, S.J.; Davidson, M.E.; Heidel, D.S.; Layde, P.M. Renewable Energy and Occupational Health and Safety Research Directions: A White Paper from the Energy Summit, Denver Colorado, 11–13 April 2011. Am. J. Ind. Med. 2013, 56, 1359–1370. [Google Scholar] [CrossRef] [PubMed]
  31. EIA. Form EIA-860 Detailed Data with Previous Form Data (EIA-860A/860B). Available online: https://www.eia.gov/electricity/data/eia860/ (accessed on 12 December 2020).
  32. EIA. Electric Power Annual 2019. Available online: https://www.eia.gov/electricity/annual/ (accessed on 12 December 2020).
  33. EIA. State Electricity Profiles. Available online: https://www.eia.gov/electricity/state/ (accessed on 12 December 2020).
  34. EIA. Emissions by Plant and by Region. Available online: https://www.eia.gov/electricity/data/emissions/ (accessed on 12 December 2020).
  35. U.S. Bureau of Labor Statistics. Census of Fatal Occupational Injuries. Available online: https://www.bls.gov/iif/oshcfoi1.htm (accessed on 11 November 2020).
  36. U.S. Bureau of Labor Statistics. Industry Injury and Illness Data. Available online: https://www.bls.gov/iif/ (accessed on 11 November 2020).
  37. U.S. Bureau of Labor Statistics. Occupational Employment Statistics. Available online: https://www.bls.gov/oes/home.htm (accessed on 11 November 2020).
  38. Harris, M.A.; Diehl, T.H. Withdrawal and Consumption of Water by Thermoelectric Power Plants in the United States, 2015; No. 2019-5103; U.S. Geological Survey: Reston, VA, USA, 2019. [Google Scholar]
  39. Canty, A.; Ripley, B. Boot: Bootstrap R (S-Plus) Functions; R Package Version 1.3-25; 2020. [Google Scholar]
  40. Davison, A.C.; Hinkley, D.V. Bootstrap Methods and Their Applications (No. 1); Cambridge University Press: Cambridge, UK, 2013. [Google Scholar]
  41. RStudio Team. RStudio: Integrated Development for R. RStudio; PBC: Boston, MA, USA, 2020. [Google Scholar]
  42. Swinscow, T.D.V.; Campbell, M.J. XVIII: Correlation. In Statistics at Square One; BMJ Publishing Group: London, UK, 2002; pp. 111–125. [Google Scholar]
  43. U.S. Bureau of Labor Statistics. North American Industry Classification System (NAICS). Available online: https://www.bls.gov/bls/naics.htm (accessed on 11 November 2020).
  44. Allan, G.J.; Ross, A.G. The Characteristics of Energy Employment in a System-Wide Context. Energy Econ. 2019, 81, 238–258. [Google Scholar] [CrossRef] [Green Version]
  45. Cartelle Barros, J.J.; Lara Coira, M.; de la Cruz López, M.P.; del Caño Gochi, A. Comparative Analysis of Direct Employment Generated by Renewable and Non-Renewable Power Plants. Energy 2017, 139, 542–554. [Google Scholar] [CrossRef]
  46. Miller, G. Hidden Tragedy: Underreporting of Workplace Injuries and Illnesses; U.S. House of Representatives Committee on Education and Labor: Washington, DC, USA, 2008. [Google Scholar]
  47. International Energy Administration. Solar. Available online: https://www.iea.org/fuels-and-technologies/solar (accessed on 12 December 2020).
  48. EIA. U.S. Renewable Energy Consumption Surpasses Coal for the First Time in Over 130 Years. Available online: https://www.eia.gov/todayinenergy/detail.php?id=43895 (accessed on 12 December 2020).
  49. GALLUP. Energy. Available online: https://news.gallup.com/poll/2167/energy.aspx (accessed on 12 December 2020).
  50. Logan, L.H.; Stillwell, A.S. Water Temperature Duration Curves for Thermoelectric Power Plant Mixing Zone Analysis. J. Water Resour. Plan. Manag. 2018, 144, 4018058. [Google Scholar] [CrossRef]
  51. Van Vliet, M.T.H.; Wiberg, D.; Leduc, S.; Riahi, K. Power-Generation System Vulnerability and Adaptation to Changes in Climate and Water Resources. Nat. Clim. Chang. 2016, 6, 375–380. [Google Scholar] [CrossRef]
  52. U.S. Department of Energy. Environment Baseline: Energy-Water Nexus; U.S. Department of Energy: Washington, DC, USA, 2017; Volume 4, p. 93.
  53. EPA. Steam Electric Power Generating Effluent Guidelines—2015 Final Rule. Available online: https://www.epa.gov/eg/steam-electric-power-generating-effluent-guidelines-2015-final-rule (accessed on 12 December 2020).
  54. Haerer, D.; Pratson, L. Employment Trends in the U.S. Electricity Sector, 2008–2012. Energy Policy 2015, 82, 85–98. [Google Scholar] [CrossRef]
  55. Kelsh, M.A.; Lu, E.T.; Ramachandran, K.; Jesser, C.; Fordyce, T.; Yager, J.W. Occupational Injury Surveillance among Electric Utility Employees. J. Occup. Environ. Med. 2004, 46, 974–984. [Google Scholar] [CrossRef]
  56. Hirschberg, S.; Burgherr, P.; Spiekerman, G.; Dones, R. Severe Accidents in the Energy Sector: Comparative Perspective. J. Hazard. Mater. 2004, 111, 57–65. [Google Scholar] [CrossRef]
  57. IPCC. Summary for Policy Makers. In Renewable Energy Sources and Climate Change Mitigation: Special Report of the Intergovernmental Panel on Climate Change; Edenhofer, O., Pichs-Madruga, R., Sokona, Y., Seyboth, K., Matschoss, P., Kadner, S., Zwickel, T., Eickemeier, P., Hansen, G., Schloemer, S., et al., Eds.; Cambridge University Press: Cambridge, UK; New York, NY, USA, 2011; pp. 3–27. [Google Scholar]
  58. Alanne, K.; Saari, A. Distributed Energy Generation and Sustainable Development. Renew. Sustain. Energy Rev. 2006, 10, 539–558. [Google Scholar] [CrossRef]
  59. Wolsink, M. Distributed Energy Systems as Common Goods: Socio-Political Acceptance of Renewables in Intelligent Microgrids. Renew. Sustain. Energy Rev. 2020, 127, 109841. [Google Scholar] [CrossRef]
  60. Boden, L.I.; Ozonoff, A. Capture-Recapture Estimates of Nonfatal Workplace Injuries and Illnesses. Ann. Epidemiol. 2008, 18, 500–506. [Google Scholar] [CrossRef]
  61. Mendeloff, J.; Burns, R. States with Low Non-Fatal Injury Rates Have High Fatality Rates and Vice-Versa. Am. J. Ind. Med. 2013, 56, 509–519. [Google Scholar] [CrossRef] [PubMed]
  62. Spieler, E.A.; Wagner, G.R. Counting Matters: Implications of Undercounting in the BLS Survey of Occupational Injuries and Illnesses. Am. J. Ind. Med. 2014, 57, 1077–1084. [Google Scholar] [CrossRef] [PubMed]
  63. Boden, L.I. Capture-Recapture Estimates of the Undercount of Workplace Injuries and Illnesses: Sensitivity Analysis. Am. J. Ind. Med. 2014, 57, 1090–1099. [Google Scholar]
  64. Rosenman, K.D.; Kalush, A.; Reilly, M.J.; Gardiner, J.C.; Reeves, M.; Luo, Z. How Much Work-Related Injury and Illness Is Missed by the Current National Surveillance System? J. Occup. Environ. Med. 2006, 48, 357–365. [Google Scholar] [CrossRef] [Green Version]
Figure 1. Model framework for water–energy nexus of electricity generation at a power plant scale, as illustrated within the system boundary (i.e., grey dotted line). Water use (i.e., blue line) and energy use (i.e., orange line) enter the system boundary to be used for net electricity production and exit after thermoelectric cooling, transmission, and distribution.
Energies 14 02633 g001
Figure 2. Annual average energy (Quad Btu and TWh) and water flow (Mm3) by energy source for electricity production in the US 2014–2019. The grey dashed line represents the boundary of our model, which is limited to electricity generation at the plant scale. Orange lines represent energy consumed and electricity produced, and blue lines represent water use in thermoelectric cooling. The * denotes where water use is not reported by power plants to EIA and is assumed as zero.
Energies 14 02633 g002
Figure 3. Scaled rates of energy consumption footprint (CF, MMBtu/MWh), water CF (Mm3/MWh) and water withdrawal footprint (WF, Mm3/MWh). Solar includes only thermal as PV systems do not report water use. Biomass and Other energies are not included due to their mixed fuel source.
Energies 14 02633 g003
Figure 4. Average annual incidents of (a) injuries and illnesses and (b) fatalities reported by Electric power generation (NAICS 22111) and Water, sewage and other systems (NAICS 22113). Other represents remaining illnesses, injuries and fatalities within Utilities (NAICS 221) for comparison. Injuries and fatalities include 2014–2019 and fatalities 2014–2018 due to data availability at time of publication. Data source: US Bureau of Labor.
Energies 14 02633 g004
Figure 5. Average annual incidents of (a) injuries and illnesses and (b) fatalities per incident in subgroups Elec. Gen. (i.e., Electric power generation) (NAICS 22111) and Water (i.e., Water, sewage and other systems) (NAICS 22113). Other represents remaining illnesses, injuries and fatalities within Utilities (NAICS 221) for comparison. Injuries and fatalities include 2014–2019 and fatalities 2014–2018 due to data availability at time of publication. Data source: US Bureau of Labor.
Energies 14 02633 g005
Figure 6. Rate of plant operators employed and mean annual pay per MW of energy source generator nameplate capacity 2016–2019. Fossil fuel includes petroleum, coal, natural gas and other gases. All other electric power generation includes batteries, hydrogen, purchased steam, sulfur, tire-derived fuels and other miscellaneous energy sources. H.E. Conv. is conventional hydroelectric power generation. Solar includes both PV and thermal, but values do not exist before 2019, therefore 2017 and 2018 are substituted with installation, maintenance and repair occupations (SOC 49-000); in year 2016, no values were released.
Energies 14 02633 g006
Table 1. Water withdrawal estimated rates (WF, m3/MWh) for various energy sources, standard error (SE), bootstrap bias, sample size (n) and 95% confidence intervals (CI). Other includes all other and other gases (i.e., blast furnace gas, batteries, hydrogen, purchased steam sulfur, tire-derived fuels and other miscellaneous energy sources).
Energy SourceWFSEBiasnCI 95%
LowerUpper
Natural gas62.434.62−0.09157653.4671.57
Nuclear28.693.71−0.169921.5736.12
Petroleum98.1244.51−1.993812.86187.35
Coal40.351.930.0697236.5244.07
Biomass18.486.430.01935.8731.06
Solar3.740.16−0.01143.434.07
Other268.8850.321.5313168.73365.97
Table 2. Water consumption estimated rates (CF, m3/MWh) for various energy sources, standard error (SE), bootstrap bias, sample size (n) and 95% confidence intervals (CI). Other includes blast furnace gas, batteries, hydrogen, purchased steam sulfur, tire-derived fuels and other miscellaneous energy sources.
Energy sourceCFSEBiasnCI 95%
LowerUpper
Natural gas2.210.02*16102.172.25
Nuclear1.860.09*961.682.04
Petroleum1.790.48*400.842.74
Coal1.580.01*10041.551.61
Biomass3.310.64*962.064.58
Solar2.590.41−0.01141.803.39
Other35.3911.330.541212.6557.05
* Denotes value less than 0.01 and greater than 0.
Table 3. Annual rates of energy consumption (MMBTu), water consumption and water withdrawn (m3), and air emissions (metric ton, MT) per MWh of net electricity generated in the US 2014–2019 averaged across all energy sources; where Avg is the annual average 2014–2019, CF is consumption footprint, and WF is withdrawal footprint.
YearNet Electricity GeneratedEnergy CFWater CFWater WFCO2SO2NOx
MWhMMBTu/MWhm3/MWhm3/MWhMT/MWhMT/MWhMT/MWh
20144,093,606,01110.282.1565.500.530.00080.0004
20154,077,600,94110.122.1665.300.490.00060.0004
20164,076,674,98410.072.1765.400.470.00040.0003
20174,034,270,56110.062.1765.500.460.00030.0003
20184,178,277,3469.962.1765.900.440.00030.0003
20194,126,882,1559.782.1765.700.410.00020.0003
Avg4,097,885,33310.052.1665.540.470.00040.0003
Table 4. Employment numbers and mean annual salary in production occupations per year’s generator capacity (MWh) for Utilities (NAICS 221), Electric power generation, transmission and distribution (NAICS 2211), and Water, sewage, and other systems (NAICS 22113). Avg is average.
YearNAICS 221NAICS 2211NAICS 22113
Emp.SalaryEmp.SalaryEmp.Salary
201488,360USD 68,82059,020USD 74,08016,650USD 48,190
201585,240USD 70,90055,240USD 76,95016,770USD 48,640
201681,850USD 72,76052,380USD 79,24016,920USD 49,580
201778,500USD 74,37049,920USD 81,43016,820USD 49,570
201879,190USD 75,80050,300USD 83,71017,580USD 49,400
201977,180USD 77,27077,180USD 77,27018,770USD 51,870
Avg81,720USD 73,32057,340USD 78,78017,252USD 49,542
Emp./MWUSD/MWEmp./MWUSD/MWEmp./MWUSD/MW
20140.075USD 0.060.050USD 0.060.014USD 0.04
20150.073USD 0.060.047USD 0.070.014USD 0.04
20160.070USD 0.060.044USD 0.070.014USD 0.04
20170.066USD 0.060.042USD 0.070.014USD 0.04
20180.066USD 0.060.042USD 0.070.015USD 0.04
20190.064USD 0.060.064USD 0.060.016USD 0.04
Avg0.069USD 0.060.048USD 0.070.015USD 0.04
Publisher’s Note: MDPI stays neutral with regard to jurisdictional claims in published maps and institutional affiliations.

