
A New Model for Estimation of Bubble Point Pressure Using a Bayesian Optimized Least Square Gradient Boosting Ensemble


Abstract
:1. Introduction
2. Data Acquisition and Analysis
2.1. Global Database
- Initial Solution Gas–Oil Ratio (Rs), SCF/STB
- Gas Specific Gravity ( ), dimensionless
- Stock Tank Oil Gravity (), API
- Reservoir Temperature (T), Fahrenheit (F).
2.2. Literature Database
- Data Set L-4: North Sea Crude (46 data sets, reference [8])
3. Methodology
3.1. Bubble Point Pressure Correlations
- Standing-Type Models
- Glasø-Type Models
- Al-Marhoun-Type Models
- Non-Parametric Regression Models
3.1.1. Standing-Type Models
3.1.2. Glasø-Type Models
3.1.3. Al-Marhuon-Type Models
3.1.4. Non-Parametric Regression-Type Models
3.2. Machine Learning Methods
| Algorithm 1: LS-Boost Algorithm |
| Define and as explainable variables and M as the number of iterations |
| Define the training set , a loss function as and as the regression function. |
| Initialization: |
| For m=1 to M: |
| for |
| End. |
| Algorithm 2: Bayesian optimization |
| For t =1, 2, … do |
| Find by optimizing the acquisition function over the Gaussian Process (GP) |
| Sample the objective function: |
| Augment the data and update the GP |
| End. |
3.3. Performance Indicators
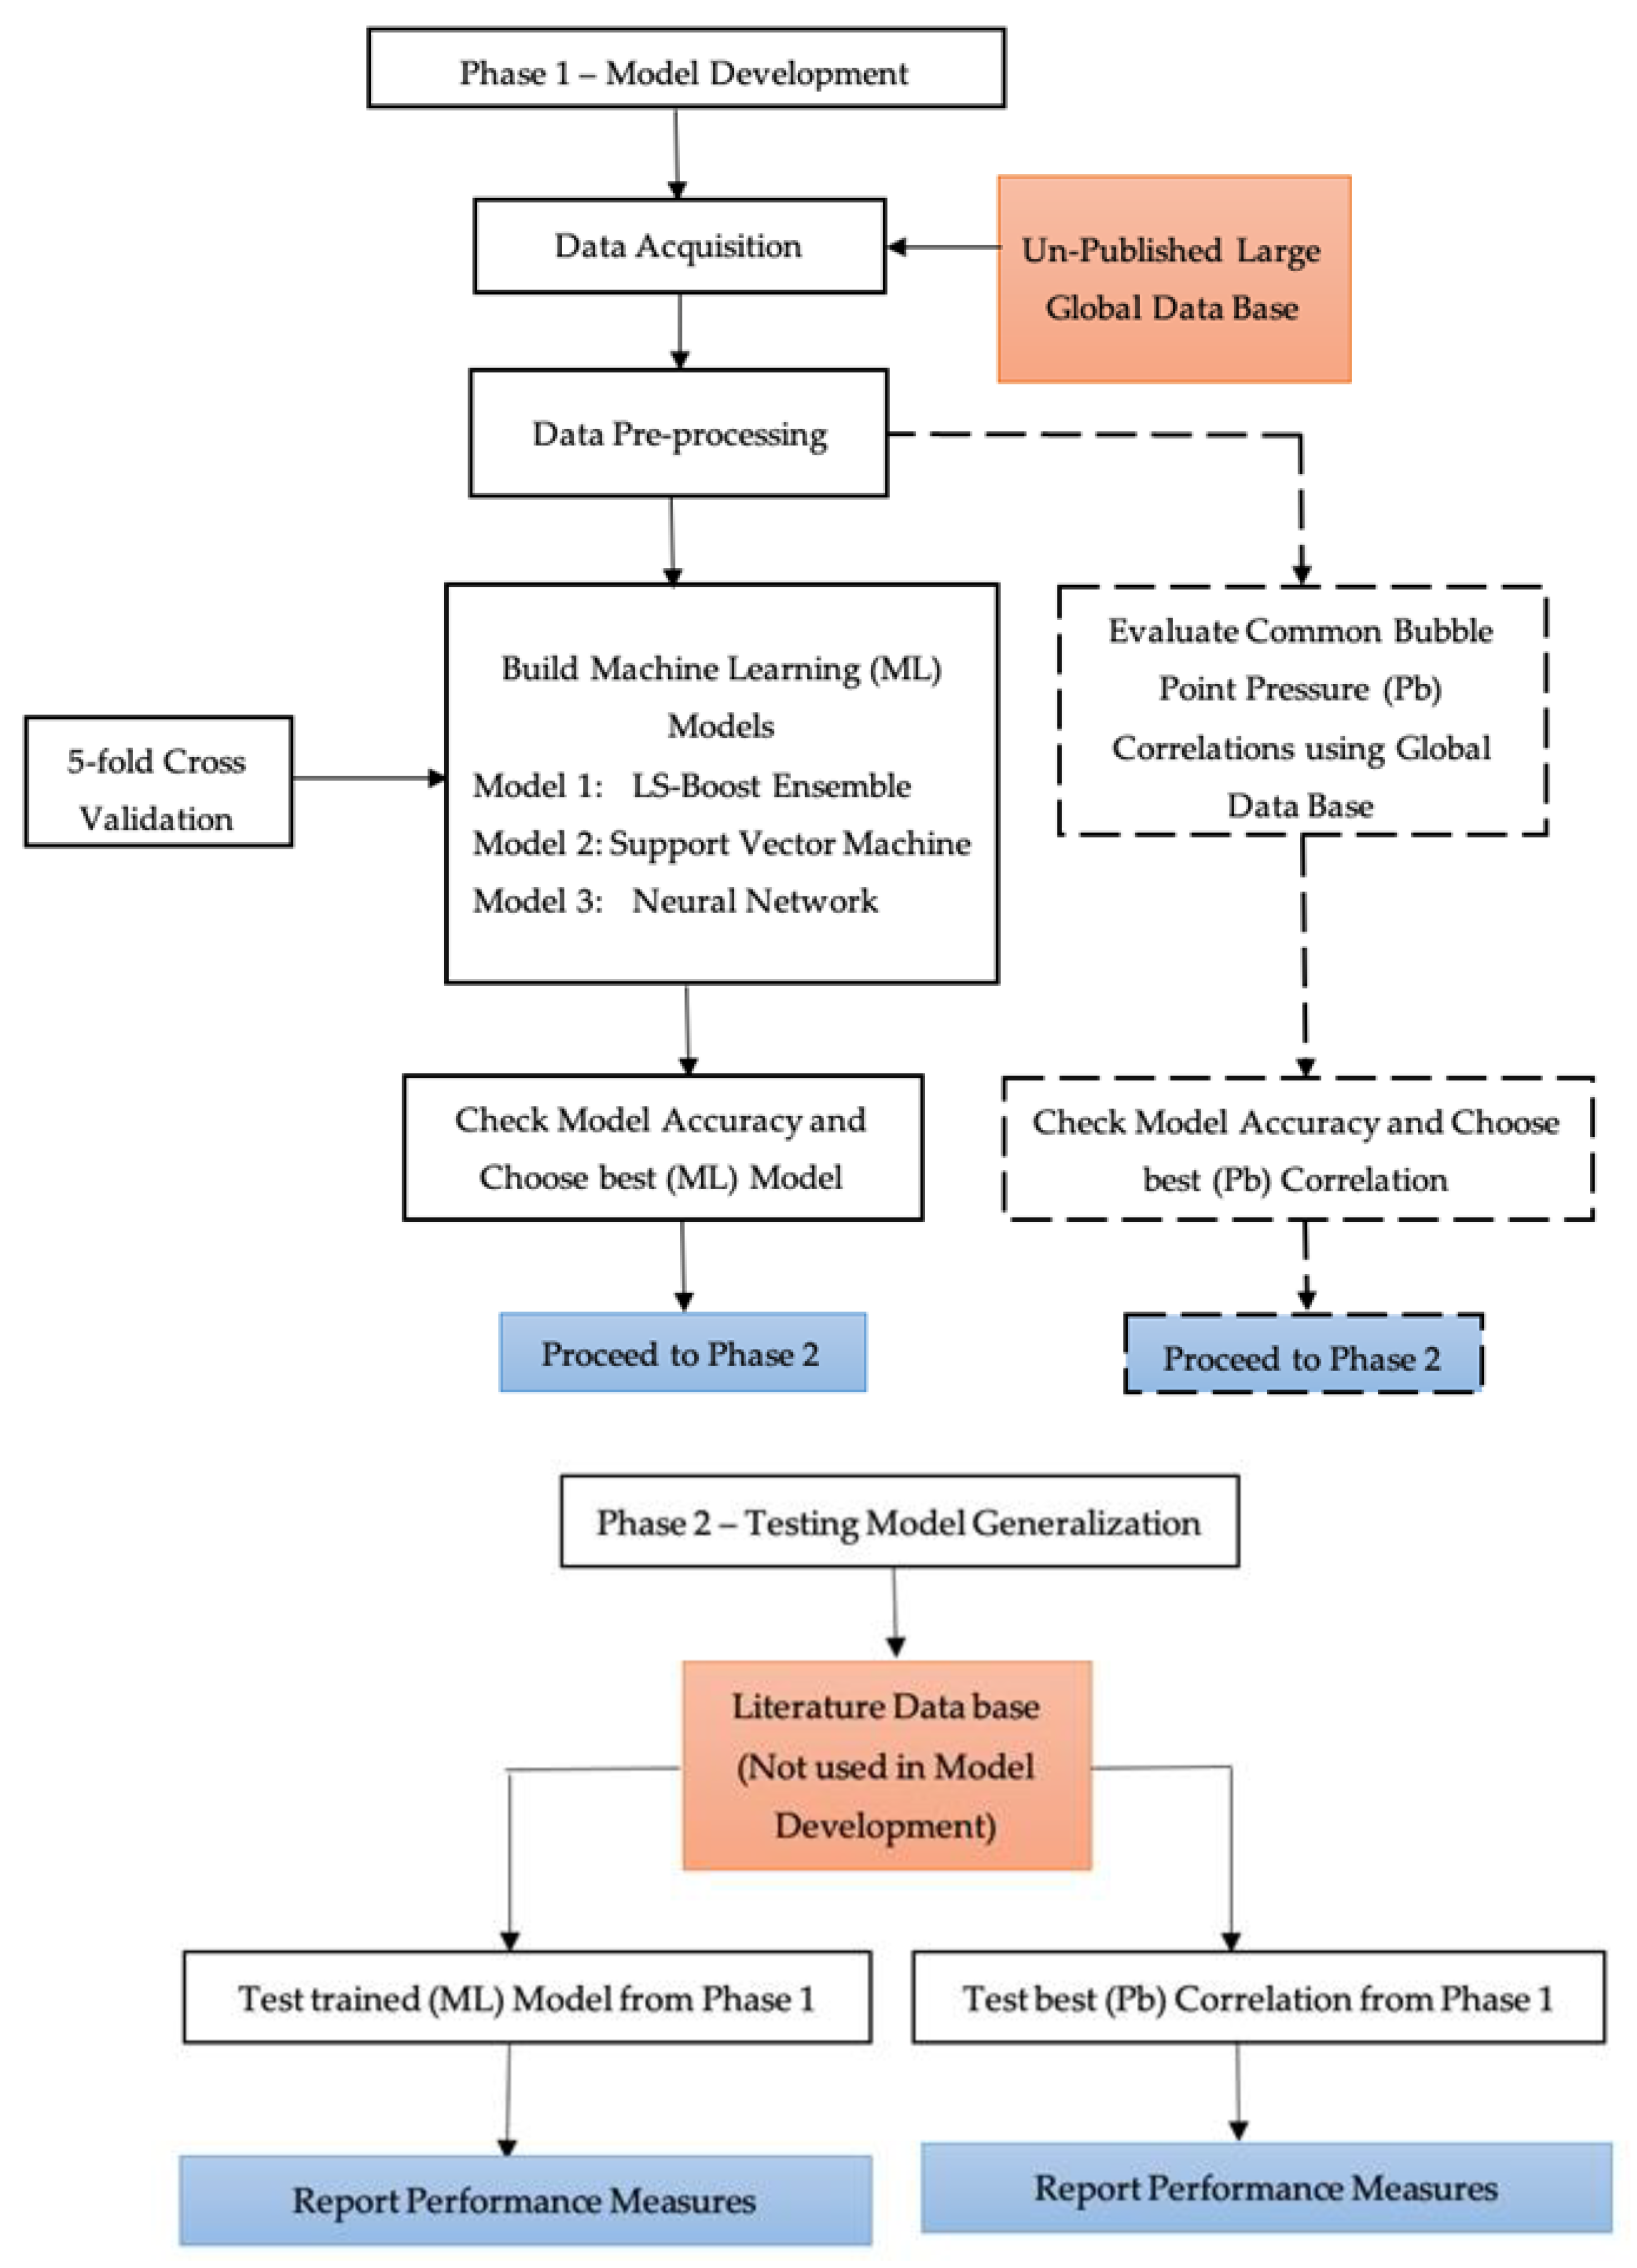
- Phase 1:
- Critically evaluate available bubble point pressure correlations based on the global database, then the best correlation in terms of accuracy performance should proceed to Phase 2.
- Build three machine learning models (LS-Boost, MLP-ANN, SVM) based on the global database, then the best model in terms of accuracy performance should proceed to Phase 2.
- Phase 2: Present a detailed comparison between the two best models extracted from Phase 1 based on an independent literature database which has not been used in the development and validation process of the machine learning models in Phase 1.
4. Results and Discussion
4.1. Evaluation of Empirical Bubble Point Correlations
4.2. Bayesian-Optimized Least Squares-Boosting Ensemble
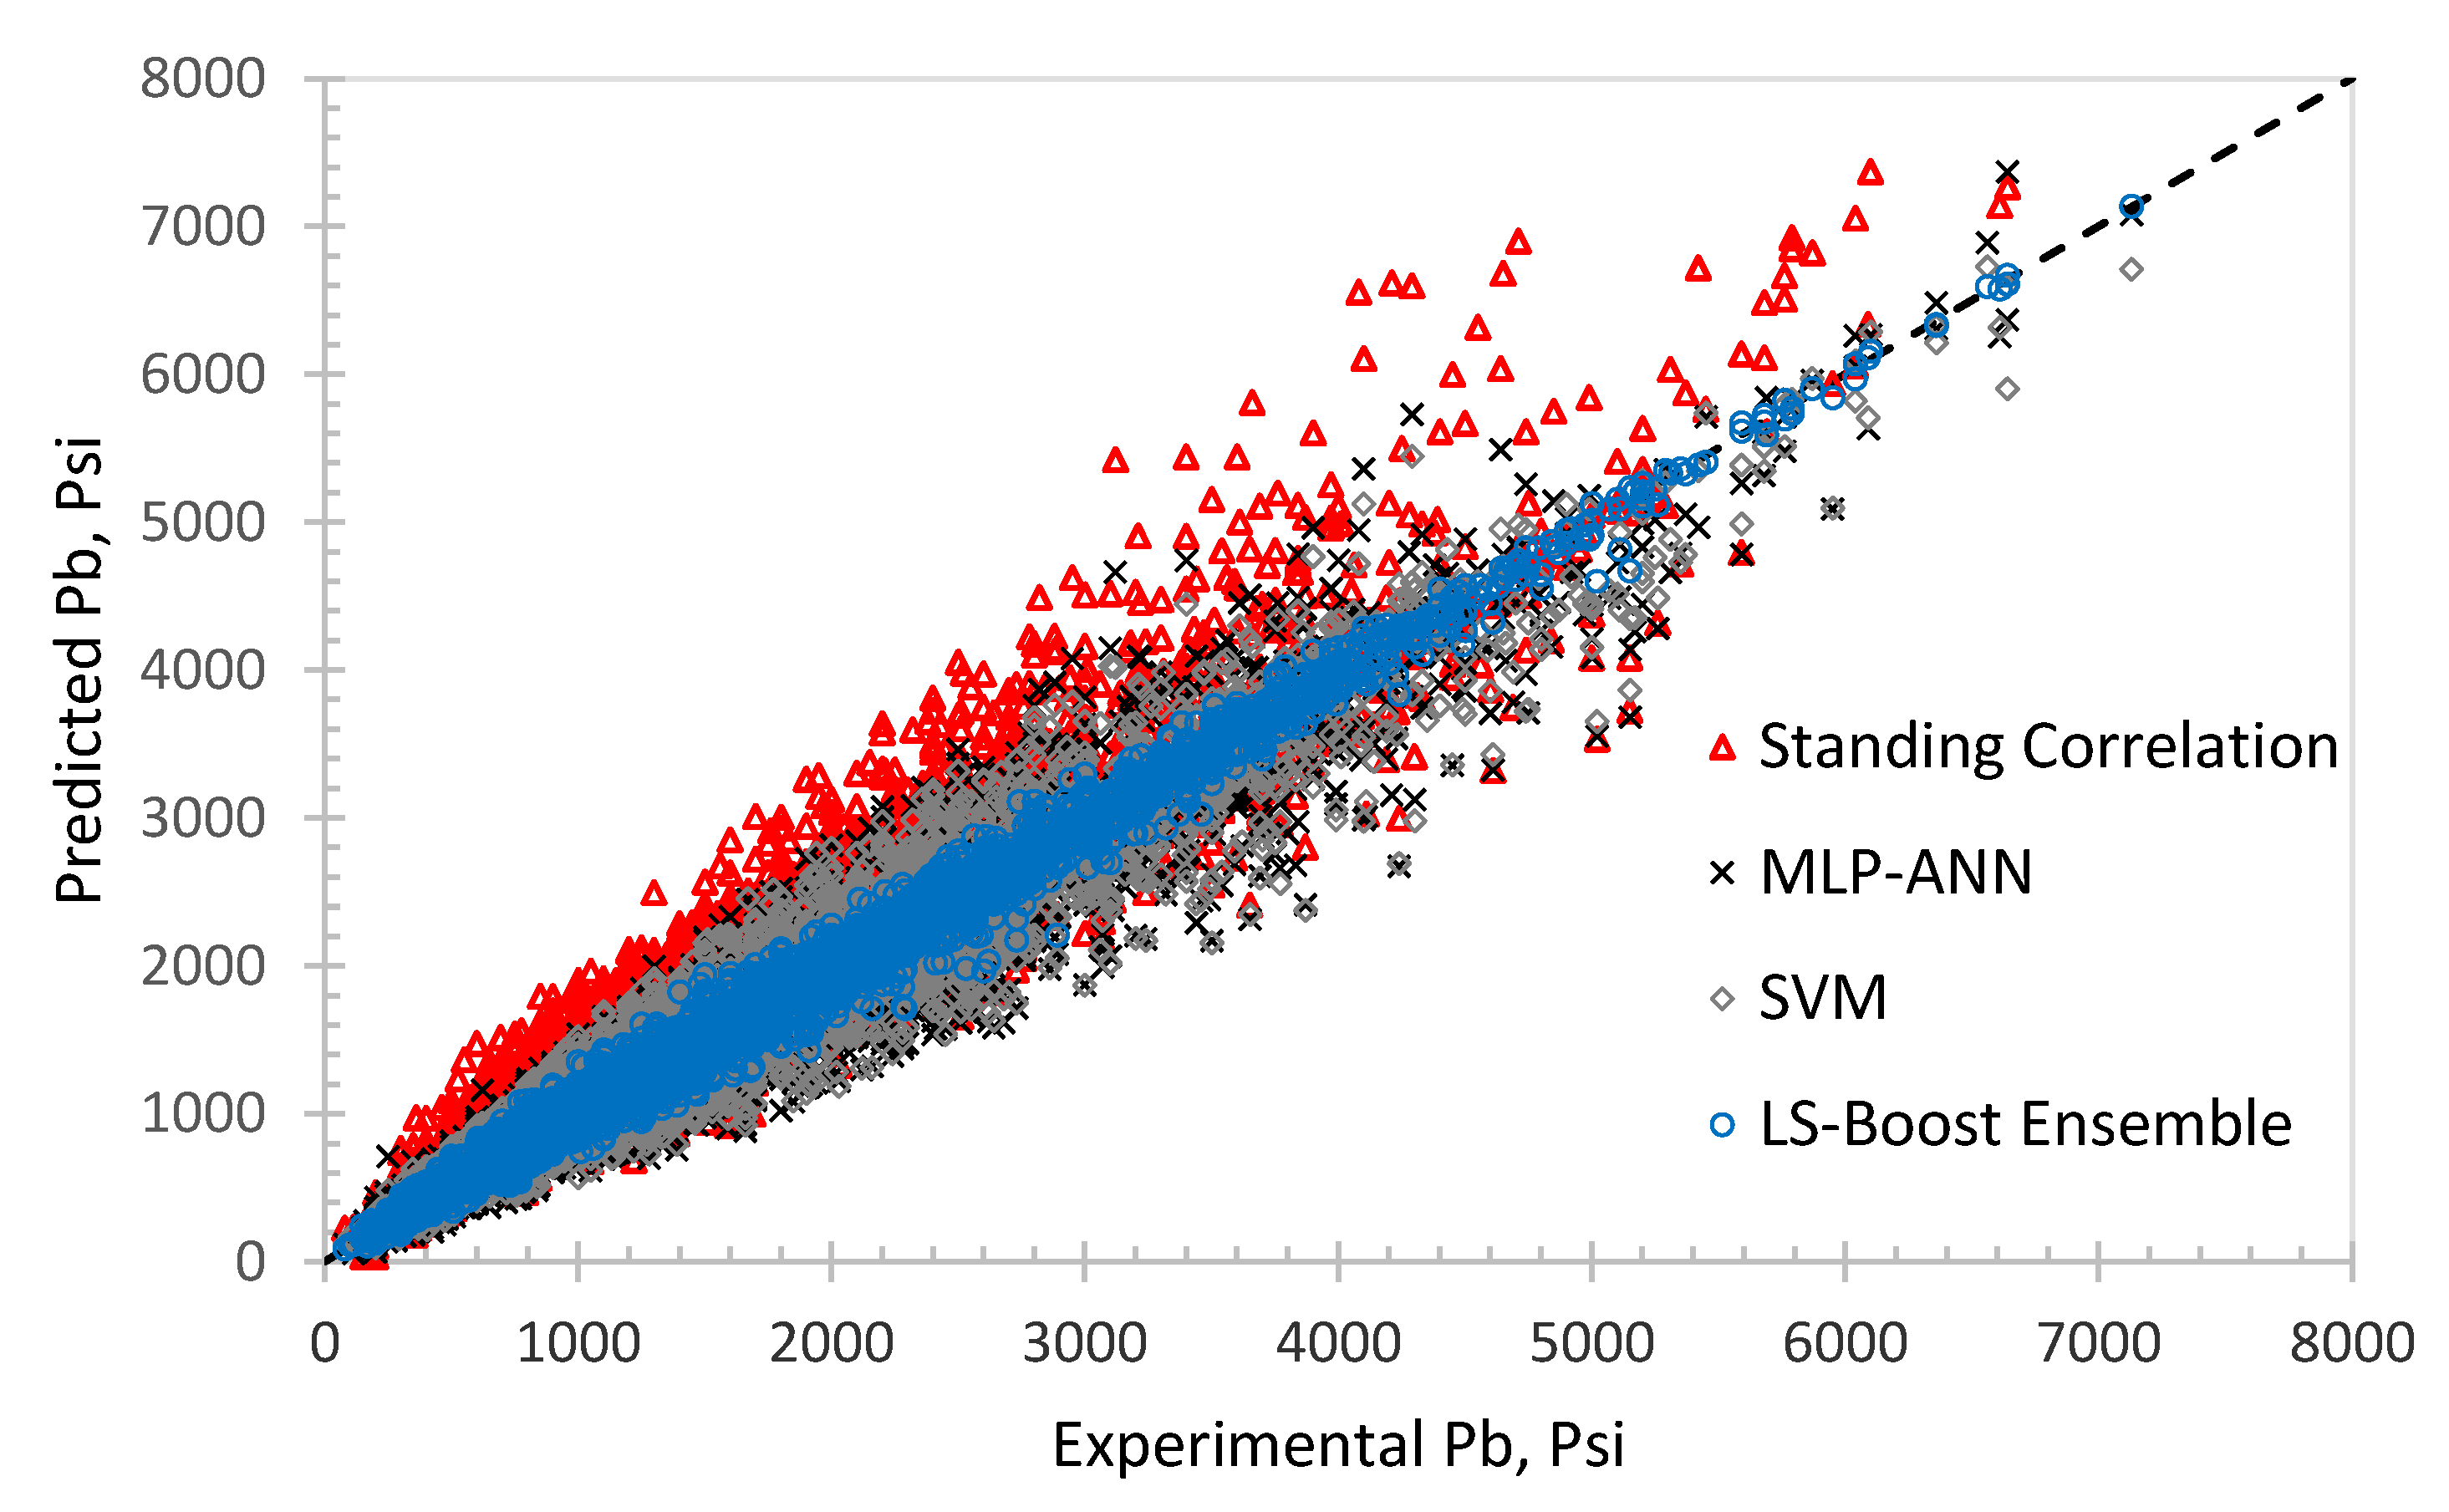
4.3. LS-Boost Generalization Test
5. Conclusions
Author Contributions
Funding
Institutional Review Board Statement
Informed Consent Statement
Conflicts of Interest
Appendix A

| Model Type | Correlation | |
|---|---|---|
| Standing-Type Models | Vazquez and Beggs [3] | |
| For API > 30 a1 = 56.06, a2 = 0.84246, a3 = 10.393 For API ≤ 30 a1 = 27.64, a2 = 0.914328, a3 = 11.172 | ||
| Petrosky and Farshad [4] | ||
| a1 = 112.727, a2 = 0.5774, a3 = 0.8439, a4 = 12.34, a5 = 4.561 × 10⁻⁵, a6 = 1.3911, a7 = 7.916 × 10⁻⁴, a8 = 1.541 | ||
| Farshad et. al. [5] | ||
| a1 = 33.22, a2 = 0.8283, a3 = 0.000037, a4 = 0.0142 | ||
| Velarde et. al. [6] | ||
| a1 = 1091.47, a2 = 0.081465, a3 = 0.161488, a4 = 0.740152, a5 = 0.013098, a6 = 0.282372, a7 = 8.2 × 10⁻⁶, a8 = 2.176124, a9 = 5.354891 | ||
| Didoruk and Christman [7] | ||
| a1 = 1.42828 × 10⁻¹, a2 = 2.8445918, a3 = −6.74896 × 10⁻⁴, a4 = 1.2252264, a5 = 0.03338, a6 = −0.272945, a7 = −0.084226, a8 = 1.869979, a9 = 1.221486, a10 = 1.370508, a11 = 0.011688308 | ||
| Glasø-Type Models | Farshad et. al. [5] | |
| a1 = 0.3058, a2 = 1.9013, a3 = 0.26, a4 = −1.378, a5 = 1.053, a6 = 0.00069, a7 = 0.0208 | ||
| Al-Marhoun-Type Models | Alshammasi [11] | |
| a1 = 5.527215, a2 = 0.783716, a3 = 1.841408 | ||
| Dokla and Osman [10] | ||
| a1 = 0.836386 × 10⁴, a2 = 0.724047, a3 = −1.01049, a4 = 0.107991, a5 = −0.952584 | ||
| ACE-Type Models | McCain et. al. [12] | |
| VAR1 = ln (Rs), C0 = −5.48, C1 = −0.0378, C2 = 0.281, C3 = −0.0206 VAR2 = γo, C0 = 1.27, C1 = −0.0449, C2 = 4.36 × 10⁻⁴, C3 = −4.76 × 10⁻⁶ VAR3 = γg, C0 = 4.51, C1 = −10.84, C2 = 8.39, C3 = −2.34 VAR4 = T, C0 = −0.7835, C1 = 6.23 × 10⁻³, C2 = −1.22 × 10⁻⁵, C3 = 1.03 × 10⁻⁸ | ||
| Malallah et. al. [13] | VAR1 = Rs, C0 = −3.059508, C1 = 1.52218 × 10⁻², C2 = −2.6111 × 10⁻⁵, C3 = 2.5235052 × 10⁻⁸, C4 = −1.30152 × 10⁻¹¹, C5 = 3.32913 × 10⁻¹⁵, C6 = −3.300324 × 10⁻¹⁹ VAR2 = γo, C0 = 1.46972329, C1 = −2.4040982 × 10⁻², C2 = −4.16355118 × 10⁻⁴, C3 = C4 = C5 = C6 = 0.00 VAR3 = ln(γg), C0 = −0.3256552, C1 = −0.818042138, C2 = 1.668385, C3 = −0.2331951, C4 = −2.00272425, C5 = C6 = 0.00 VAR4 = T, C0 = −0.121545, C1 = −1.1752246 × 10⁻³, C2 = 2.9521061 × 10⁻⁵, C3 = −1.513615 × 10⁻⁷, C4 = 2.49103 × 10⁻¹⁰, C5 = C6 = 0.00 |
References
- Katz, D.L. Prediction of the Shrinkage of Crude Oils; American Petroleum Institute: New York, NY, USA, 1942. [Google Scholar]
- Standing, M.B. A Pressure-Volume-Temperature Correlation for Mixtures of California Oils and Gases; American Petroleum Institute: New York, NY, USA, 1947. [Google Scholar]
- Vasquez, M.; Beggs, H.D. Correlations for Fluid Physical Property Prediction. J. Pet. Technol. 1980, 32, 968–970. [Google Scholar] [CrossRef]
- Petrosky, G.E.; Farshad, F.F. Pressure-Volume-Temperature Correlations for Gulf of Mexico Crude Oils. In Proceedings of the SPE Annual Technical Conference and Exhibition, Houston, TX, USA, 3–6 October 1993. [Google Scholar] [CrossRef]
- Frashad, F.; LeBlanc, J.L.; Garber, J.D.; Osorio, J.G. Empirical Pvt Correlations for Colombian Crude Oils. In Proceedings of the SPE Latin America/Caribbean Petroleum Engineering Conference, Port-of-Spain, Trinidad, 23–26 April 1996. [Google Scholar] [CrossRef]
- Velarde, J.; Blasingame, T.A.; McCain, W.D., Jr. Correlation of Black Oil Properties at Pressures below Bubble Point Pressure—A New Approach. In Proceedings of the Annual Technical Meeting, Calgary, Alberta, 8–11 June 1997. [Google Scholar]
- Dindoruk, B.; Christman, P.G. PVT Properties and Viscosity Correlations for Gulf of Mexico Oils. SPE Reserv. Eval. Eng. 2004, 7, 427–437. [Google Scholar] [CrossRef]
- Glaso, O. Generalized Pressure-Volume-Temperature Correlations. J. Pet. Technol. 1980, 32, 785–795. [Google Scholar] [CrossRef]
- Al-Marhoun, M.A. PVT Correlations for Middle East Crude Oils. J. Pet. Technol. 1988, 40, 650–666. [Google Scholar] [CrossRef]
- Dokla, M.; Osman, M. Correlation of PVT Properties for UAE Crudes (Includes Associated Papers 26135 and 26316). SPE Form. Eval. 1992, 7, 41–46. [Google Scholar] [CrossRef]
- Al-Shammasi, A.A. A Review of Bubblepoint Pressure and Oil Formation Volume Factor Correlations. SPE Reserv. Eval. Eng. 2001, 4, 146–160. [Google Scholar] [CrossRef]
- McCain, W.D.; Soto, R.B.; Valko, P.P.; Blasingame, T.A. Correlation of Bubblepoint Pressures for Reservoir Oils—A Comparative Study. In Proceedings of the SPE Eastern Regional Meeting, Pittsburgh, Pennsylvania, 8–11 November 1998. [Google Scholar] [CrossRef]
- Malallah, A.; Gharbi, R.; Algharaib, M. Accurate Estimation of the World Crude Oil PVT Properties Using Graphical Alternating Conditional Expectation. Energy Fuels 2006, 20, 688–698. [Google Scholar] [CrossRef]
- Breiman, L.; Friedman, J.H. Estimating Optimal Transformations for Multiple Regression and Correlation. J. Am. Stat. Assoc. 1985, 80, 580–598. [Google Scholar] [CrossRef]
- Gharbi, R.B.; Elsharkawy, A.M.; Karkoub, M. Universal Neural-Network-Based Model for Estimating the PVT Properties of Crude Oil Systems. Energy Fuels 1999, 13, 454–458. [Google Scholar] [CrossRef]
- Elsharkawy, A. Modeling the Properties of Crude Oil and Gas Systems Using RBF Network. In Proceedings of the SPE Asia Pacific Oil and Gas Conference and Exhibition, Perth, Australia, 12 – 14 October 1998. [Google Scholar] [CrossRef]
- Osman, E.A.; Abdel-Wahhab, O.A.; Al-Marhoun, M.A. Prediction of Oil PVT Properties Using Neural Networks. In Proceedings of the SPE Middle East Oil Show, Manama, Bahrain, 17 – 20 March 2001. [Google Scholar] [CrossRef]
- Al-Marhoun, M.A.; Osman, E.A. Using Artificial Neural Networks to Develop New PVT Correlations for Saudi Crude Oils. In Proceedings of the Abu Dhabi International Petroleum Exhibition and Conference, Abu Dhabi, United Arab Emirates, 13 – 16 October 2002. [Google Scholar] [CrossRef]
- El-Sebakhy, E.; Sheltami, T.; Al-Bokhitan, S.; Shaaban, Y.; Raharja, P.; Khaeruzzaman, Y. Support Vector Machines Framework for Predicting the PVT Properties of Crude-Oil Systems. In Proceedings of the SPE Middle East Oil and Gas Show and Conference, Manama, Bahrain, 11 – 14 March 2007. [Google Scholar] [CrossRef]
- Anifowose, F.; Labadin, J.; Abdulraheem, A. A Hybrid of Functional Networks and Support Vector Machine Models for the Prediction of Petroleum Reservoir Properties. In Proceedings of the 2011 11th International Conference on Hybrid Intelligent Systems (HIS), Malacca, Malaysia, 5–8 December 2011; IEEE: New York, NY, USA, 2011. [Google Scholar]
- Asadisaghandi, J.; Tahmasebi, P. Comparative Evaluation of Back-Propagation Neural Network Learning Algorithms and Empirical Correlations for Prediction of Oil PVT Properties in Iran Oilfields. J. Pet. Sci. Eng. 2011, 78, 464–475. [Google Scholar] [CrossRef]
- Rafiee-Taghanaki, S.; Arabloo, M.; Chamkalani, A.; Amani, M.; Zargari, M.H.; Adelzadeh, M.R. Implementation of SVM Framework to Estimate PVT Properties of Reservoir Oil. Fluid Phase Equilib. 2013, 346, 25–32. [Google Scholar] [CrossRef]
- Elkatatny, S.; Moussa, T.; Abdulraheem, A.; Mahmoud, M. A Self-Adaptive Artificial Intelligence Technique to Predict Oil Pressure Volume Temperature Properties. Energies 2018, 11, 3490. [Google Scholar] [CrossRef] [Green Version]
- Elkatatny, S.; Mahmoud, M. Development of a New Correlation for Bubble Point Pressure in Oil Reservoirs Using Artificial Intelligent Technique. Arab. J. Sci. Eng. 2018, 43, 2491–2500. [Google Scholar] [CrossRef]
- Otchere, D.A.; Arbi Ganat, T.O.; Gholami, R.; Ridha, S. Application of Supervised Machine Learning Paradigms in the Prediction of Petroleum Reservoir Properties: Comparative Analysis of ANN and SVM Models. J. Pet. Sci. Eng. 2021, 200, 108182. [Google Scholar] [CrossRef]
- Ribeiro, M.H.D.M.; dos Santos Coelho, L. Ensemble Approach Based on Bagging, Boosting and Stacking for Short-Term Prediction in Agribusiness Time Series. Appl. Soft Comput. 2020, 86, 105837. [Google Scholar] [CrossRef]
- Anifowose, F.; Labadin, J.; Abdulraheem, A. Improving the Prediction of Petroleum Reservoir Characterization with a Stacked Generalization Ensemble Model of Support Vector Machines. Appl. Soft Comput. 2015, 26, 483–496. [Google Scholar] [CrossRef]
- Qureshi, A.S.; Khan, A.; Zameer, A.; Usman, A. Wind Power Prediction Using Deep Neural Network Based Meta Regression and Transfer Learning. Appl. Soft Comput. 2017, 58, 742–755. [Google Scholar] [CrossRef]
- Omar, M.I.; Todd, A.C. Development of New Modified Black Oil Correlations for Malaysian Crudes. In Proceedings of the SPE Asia Pacific Oil and Gas Conference, Singapore, 8 – 10 February 1993. [Google Scholar] [CrossRef]
- Mahmood, M.A.; Al-Marhoun, M.A. Evaluation of Empirically Derived PVT Properties for Pakistani Crude Oils. J. Pet. Sci. Eng. 1996, 16, 275–290. [Google Scholar] [CrossRef]
- Obomanu, D.A.; Okpobiri, G.A. Correlating the PVT Properties of Nigerian Crudes. J. Energy Resour. Technol. 1987, 109, 214–217. [Google Scholar] [CrossRef]
- Bello, O.O.; Reinicke, K.M.; Patil, P.A. Comparison of the Performance of Empirical Models Used for the Prediction of the PVT Properties of Crude Oils of the Niger Delta. Pet. Sci. Technol. 2008, 26, 593–609. [Google Scholar] [CrossRef]
- Abdul-Majeed, G.H.; Salman, N.H. Statistical Evaluation of PVT Correlations Solution Gas-Oil Ratio. J. Can. Pet. Technol. 1988, 27. [Google Scholar] [CrossRef]
- Giambattista, D.; Paone, F.; Villa, M. Pressure-Volume-Temperature Correlations for Heavy and Extra Heavy Oils. In Proceedings of the SPE International Heavy Oil Symposium, Alberta, AB, Canada, 19 – 21 June 1995. [Google Scholar] [CrossRef]
- Friedman, J.H. Greedy Function Approximation: A Gradient Boosting Machine. Ann. Stat. 2001, 29, 1189–1232. [Google Scholar] [CrossRef]
- Brochu, E.; Cora, V.M.; De Freitas, N. A tutorial on Bayesian optimization of expensive cost functions, with application to active user modeling and hierarchical reinforcement learning. arXiv Preprint 2010, arXiv:1012.2599. [Google Scholar]
- Lange, N.; Bishop, C.M.; Ripley, B.D. Neural Networks for Pattern Recognition. J. Am. Stat. Assoc. 1997, 92, 1642. [Google Scholar] [CrossRef]
- Gupta, N. Artificial neural network. Netw. Complex Syst. 2013, 3, 24–28. [Google Scholar]
- Cortes, C.; Vapnik, V. Support-Vector Networks. Mach. Learn. 1995, 20, 273–297. [Google Scholar]
- Valkó, P.P.; McCain, W.D., Jr. Reservoir Oil Bubblepoint Pressures Revisited; Solution Gas–Oil Ratios and Surface Gas Specific Gravities. J. Pet. Sci. Eng. 2003, 37, 153–169. [Google Scholar] [CrossRef]
- McCain, W.D.; Spivey, J.P.; Lenn, C.P. Petroleum Reservoir Fluid Property Correlations; PennWell Books: Tulsa, OK, USA, 2011. [Google Scholar]
- Ahmed, T. Equations of State and PVT Analysis: Applications for Improved Reservoir Modeling; Gulf Professional Publishing: Houston, TX, USA, 2016. [Google Scholar]


| Statistical Parameter | Solution Gas–Oil Ratio | Gas Specific Gravity | Oil Gravity | Reservoir Temperature | Bubble Point Pressure |
|---|---|---|---|---|---|
| SCF/STB | API | F | psi | ||
| Maximum | 3200 | 1.67 | 58 | 350 | 7200 |
| Minimum | 15 | 0.55 | 9.5 | 75 | 81 |
| Mean | 495 | 0.79 | 36 | 183 | 1655 |
| Standard Deviation | 372 | 0.16 | 7.25 | 47.5 | 1062 |
| Skewness | 1.68 | 0.93 | −0.48 | 0.088 | 1.139 |
| Coefficient of Variation | 0.75 | 0.203 | 0.201 | 0.26 | 0.64 |
| Data Set | Statistical Parameter | Rs | T | Pb | ||
|---|---|---|---|---|---|---|
| SCF/STB | API | F | psi | |||
| Data Set L-1 | Maximum | 2217 | 1.367 | 44.6 | 275 | 4640 |
| Minimum | 26 | 0.752 | 19.4 | 74 | 130 | |
| Mean | 617.56 | 0.967 | 32.93 | 165.10 | 1848 | |
| Standard Deviation | 428.90 | 0.159 | 5.241 | 50.54 | 1113 | |
| Skewness | 0.74 | 0.698 | −0.147 | 0.063 | 0.085 | |
| Coefficient of Variation | 0.695 | 0.164 | 0.159 | 0.306 | 0.602 | |
| Data Set L-2 | Maximum | 2496 | 1.44 | 56.50 | 281 | 4975 |
| Minimum | 92 | 0.61 | 26.6 | 125 | 162 | |
| Mean | 580.0 | 0.97 | 39.83 | 208.54 | 1830 | |
| Standard Deviation | 359.47 | 0.478 | 5.878 | 34.48 | 859.96 | |
| Skewness | 2.07 | 1.802 | 0.187 | −0.015 | 0.475 | |
| Coefficient of Variation | 0.619 | 0.44 | 0.148 | 0.165 | 0.469 | |
| Maximum | 2142 | 0.851 | 44.93 | 245 | 4557 | |
| Minimum | 90 | 0.65 | 23.7 | 80 | 150 | |
| Data Set L-3 | Mean | 698.3 | 0.665 | 33.52 | 177.65 | 2281 |
| Standard Deviation | 597.96 | 0.0718 | 8.66345 | 23.48 | 1549 | |
| Skewness | 0.613 | 0.8758 | −0.6084 | −0.304 | 0.155 | |
| Coefficient of Variation | 0.856 | 0.108 | 0.258 | 0.132 | 0.679 | |
| Maximum | 2637 | 1.276 | 45.2 | 280 | 7127 | |
| Minimum | 90 | 0.65 | 23.7 | 80 | 150 | |
| Mean | 1052.95 | 0.919 | 36.76 | 210.91 | 3516 | |
| Data Set L-4 | Standard Deviation | 625.64 | 0.171 | 4.691 | 48.535 | 1767 |
| Skewness | 0.424 | 0.497 | −0.8141 | −1.262 | −0.229 | |
| Coefficient of Variation | 0.594 | 0.186 | 0.128 | 0.230 | 0.503 | |
| Maximum | 1763 | 1.517 | 55.9 | 294 | 4990 | |
| Minimum | 10.78 | 0.52 | 6 | 58 | 81 | |
| Data Set L-5 | Mean | 417.0 | 0.809 | 30.85 | 167 | 1695 |
| Standard Deviation | 328.3 | 0.147 | 10.19 | 46.18 | 980 | |
| Skewness | 1.11 | 1.97 | −0.3636 | 0.257 | 0.454 | |
| Coefficient of Variation | 0.787 | 0.180 | 0.332 | 0.277 | 0.578 |
| Model Type | Correlation | Pb | Rs | T | ||
|---|---|---|---|---|---|---|
| psi | SCF/STB | API | F | |||
| Standing-Type Models | Vazquez and Beggs [3] | 15–6055 | 0–2199 | 0.51–1.35 | 15.3–63 | 75–294 |
| Petrosky and Farshad [4] | 1574–6523 | 217–2406 | 0.58–0.86 | 16.3–45 | 114–288 | |
| Farshad et. al. [5] | 32–4138 | 6–1645 | 0.66–1.73 | 18.0–45 | 95–260 | |
| Velarde et. al. [6] | 70–6700 | 10–1870 | 0.56–1.37 | 12.0–55 | 74–327 | |
| Didoruk and Christman [7] | 926–12,230 | 133–3050 | 0.60–1.03 | 14.7–40 | 117–276 | |
| Glasø-Type Models | Farshad et. al. [5] | 32–4138 | 6–1645 | 0.66–1.73 | 18.0–45 | 95–260 |
| Al-Marhoun-Type Models | Dokla and Osman [10] | 590–4640 | 181–2266 | 0.80–1.29 | 28.2–40 | 190–275 |
| Alshammasi [11] | 32–7127 | 6–3299 | 0.51–1.79 | 6.00–64 | 74–342 | |
| ACE Models | McCain et. al. [12] | 70–6700 | 10–1870 | 0.56–1.37 | 12.0–55 | 74–327 |
| Malallah et. al. [13] | 79–7130 | 9–3370 | 0.50–1.67 | 14.3–59 | 74–342 |
| Model Type | Correlation | MAPE | MAE | RSME | CVRMSE | R2 |
|---|---|---|---|---|---|---|
| % | % | |||||
| Standing-Type Models | Standing [2] | 21.6 | 288 | 401 | 36 | 0.88 |
| Vazquez and Beggs [3] | 29.62 | 395.60 | 536.7 | 43.6 | 0.82 | |
| Petrosky and Farshad [4] | 42.6 | 490 | 620 | 43.2 | 0.82 | |
| Farshad et. al. [5] | 30.82 | 365.7 | 453 | 41.8 | 0.83 | |
| Velarde et. al. [6] | 33.0 | 405.6 | 500.5 | 44.2 | 0.82 | |
| Didoruk and Christman [7] | 30.3 | 397 | 491 | 44.9 | 0.81 | |
| Glasø-Type Models | Glasø [8] | 31.9 | 435.6 | 560 | 46.6 | 0.80 |
| Farshad et. al. [9] | 30.1 | 361.8 | 442 | 46.2 | 0.80 | |
| Al-Marhoun-Type Models | Al-Marhoun [10] | 45.5 | 609 | 797 | 58.2 | 0.71 |
| Dokla and Osman [11] | 35.0 | 439 | 578 | 57.2 | 0.69 | |
| Alshammasi [12] | 25.0 | 322 | 421 | 43.7 | 0.81 | |
| ACE Models | McCain et. al. [13] | 27.0 | 342.57 | 427.65 | 39.40 | 0.84 |
| Malallah et. al. [14] | 28.76 | 355.48 | 436.12 | 41.1 | 0.82 |
| Sample | Rs | T | Actual Bubble Point Pressure | Standing Correlation | Alshammasi Correlation | McCain Correlation | ||
|---|---|---|---|---|---|---|---|---|
| ID | API | SCF/STB | F | Psi | Psi | Psi | Psi | |
| 1 | 36.5 | 1260 | 0.85 | 180 | 3550 | 3934.7 | 3882.8 | 3572.5 |
| 2 | 37 | 100 | 0.71 | 165 | 440 | 511.0 | 557.2 | 583.2 |
| 3 | 39 | 260 | 0.77 | 176 | 1190 | 1045.1 | 1102.1 | 1166.5 |
| 4 | 42 | 245 | 0.86 | 90 | 740 | 688.1 | 828.8 | 745.9 |
| 5 | 34 | 140 | 0.6 | 165 | 800 | 864.0 | 818.3 | 1036.8 |
| 6 | 32.5 | 600 | 0.8 | 187 | 2200 | 2535.6 | 2500.7 | 2567.7 |
| 7 | 15.4 | 50 | 0.78 | 121 | 390 | 449.0 | 527.9 | 425.6 |
| 8 | 18.5 | 65 | 0.82 | 100 | 395 | 470.1 | 560.3 | 442.3 |
| 9 | 22 | 88 | 0.66 | 131 | 600 | 710.2 | 745.9 | 737.6 |
| 10 | 25 | 190 | 0.58 | 181 | 1415 | 1552.8 | 1377.3 | 1791.2 |
| Parameter | Optimized Value | Search Space Range |
|---|---|---|
| Number of learners | 300 | 10–500 |
| Learning rate | 0.38 | 0.001–1 |
| Minimum leaf size | 1 | 1–2338 |
| Number of predictors to sample | 4 | 1–4 |
| Performance Indicator | LS-BOOST | MLP-ANN | SVM | Standing Correlation |
|---|---|---|---|---|
| MAPE | 7.57 | 15.18 | 14.33 | 21.6 |
| MAE | 83.44 | 214.51 | 199.13 | 288 |
| RMSE | 111.54 | 293.79 | 283.98 | 401 |
| CVRMSE | 10.63 | 28.55 | 27.97 | 36 |
| R2 | 0.98 | 0.92 | 0.93 | 0.88 |
| Actual Bubble Point Pressure | LS-BOOST | MLP-ANN | SVM | Standing Correlation |
|---|---|---|---|---|
| Psi | Psi | Psi | Psi | psi |
| 3550 | 3612 | 3743.2 | 3634.7 | 3934.7 |
| 440 | 407 | 434.4 | 380.9 | 511.0 |
| 1190 | 1126 | 846.1 | 885.8 | 1045.1 |
| 740 | 757 | 586.2 | 710.1 | 688.1 |
| 800 | 839 | 876.0 | 830.0 | 864.0 |
| 2200 | 2109 | 2489.1 | 2412.5 | 2535.6 |
| 390 | 423 | 467.2 | 437.7 | 449.0 |
| 395 | 406 | 480.8 | 429.0 | 470.1 |
| 600 | 674 | 704.5 | 676.5 | 710.2 |
| 1415 | 1405 | 1513.0 | 1402.2 | 1552.8 |
| Source | Oil Gravity | Rs | SG | T | Measured | LS-Boost | Standing Correlation | ||
|---|---|---|---|---|---|---|---|---|---|
| Reference | API | SCF/STB | Unitless | F | Pb, psi | Pb, psi | MAPE% | Pb, psi | MAPE% |
| [9,10] | 42.8 | 1579.0 | 0.9 | 190.0 | 3201.0 | 3293.5 | 2.9 | 3749.3 | 17.1 |
| [9,10] | 34.2 | 818.0 | 0.8 | 100.0 | 2900.0 | 2854.1 | 1.5 | 2638.8 | 9.0 |
| [9,10] | 39.4 | 1143.0 | 1.0 | 240.0 | 2845.0 | 2891.1 | 1.6 | 3440.8 | 20.9 |
| [9,10] | 36.5 | 811.0 | 0.8 | 100.0 | 2617.0 | 2666.3 | 2.0 | 2392.1 | 8.6 |
| [9,10] | 30.1 | 242.0 | 1.1 | 235.0 | 901.0 | 810.4 | 10.1 | 1053.5 | 16.9 |
| [9,10] | 31.8 | 765.0 | 0.9 | 243.0 | 2254.0 | 2412.2 | 7.0 | 3163.0 | 40.3 |
| [9,10] | 36.8 | 1016.0 | 0.9 | 218.0 | 2768.0 | 2640.4 | 4.6 | 3235.7 | 16.9 |
| [9,10] | 31.2 | 1018.0 | 0.9 | 226.0 | 3184.0 | 3424.1 | 7.5 | 4164.2 | 30.8 |
| [8] | 38.0 | 1924.0 | 0.9 | 245.0 | 4497.0 | 4580.5 | 1.9 | 5672.1 | 26.1 |
| [8] | 38.6 | 1280.0 | 0.8 | 180.0 | 4735.0 | 4585.3 | 3.2 | 4137.3 | 12.6 |
| [8] | 37.4 | 1052.0 | 0.8 | 193.0 | 4011.0 | 3874.6 | 3.4 | 3691.3 | 8.0 |
| [8] | 42.5 | 169.0 | 1.3 | 80.0 | 250.0 | 256.0 | 2.4 | 342.0 | 36.8 |
| [8] | 37.6 | 860.0 | 0.8 | 192.0 | 3683.0 | 3509.0 | 4.7 | 3125.0 | 15.2 |
| [8] | 38.2 | 1328.0 | 0.8 | 180.0 | 4810.0 | 4432.9 | 7.8 | 4345.0 | 9.7 |
| [8] | 34.8 | 2637.0 | 0.9 | 254.0 | 6641.0 | 6574.3 | 1.0 | 8596.4 | 29.4 |
| [8] | 41.0 | 1718.0 | 1.0 | 235.0 | 4005.0 | 4291.4 | 7.2 | 4381.5 | 9.4 |
| [29,30] | 38.9 | 463.0 | 1.3 | 196.0 | 1562.0 | 1596.6 | 2.2 | 1158.6 | 25.8 |
| [29,30] | 48.9 | 1170.0 | 0.9 | 231.0 | 2550.0 | 2669.4 | 4.7 | 2868.4 | 12.5 |
| [29,30] | 48.8 | 1355.0 | 0.9 | 228.0 | 2500.0 | 2713.3 | 8.5 | 3152.1 | 26.1 |
| [29,30] | 38.6 | 393.0 | 0.6 | 179.0 | 2692.0 | 2533.3 | 5.9 | 1785.8 | 33.7 |
| [29,30] | 42.6 | 225.0 | 1.9 | 188.0 | 315.0 | 296.4 | 5.9 | 383.9 | 21.9 |
| [29,30] | 38.5 | 376.0 | 1.7 | 248.0 | 715.0 | 704.6 | 1.5 | 870.7 | 21.8 |
| [29,30] | 31.9 | 407.0 | 2.5 | 281.0 | 1215.0 | 1084.7 | 10.7 | 862.7 | 29.0 |
| [29,30] | 39.4 | 241.0 | 2.1 | 237.0 | 315.0 | 349.5 | 11.0 | 466.7 | 48.1 |
| [31,32] | 37.2 | 415.6 | 0.7 | 190.0 | 1414.9 | 1558.8 | 10.2 | 1916.9 | 35.5 |
| [31,32] | 37.2 | 335.8 | 0.7 | 190.0 | 1115.0 | 1176.3 | 5.5 | 1575.6 | 41.3 |
| [31,32] | 21.6 | 86.0 | 0.6 | 189.0 | 614.9 | 730.6 | 18.8 | 908.4 | 47.7 |
| [31,32] | 28.4 | 173.9 | 0.6 | 170.0 | 1014.9 | 1105.4 | 8.9 | 1210.0 | 19.2 |
| [31,32] | 24.2 | 141.6 | 0.6 | 141.0 | 865.0 | 985.1 | 13.9 | 1114.2 | 28.8 |
| [31,32] | 42.3 | 1428.0 | 0.7 | 177.0 | 4041.0 | 3945.8 | 2.4 | 4587.2 | 13.5 |
| [31,32] | 39.0 | 1432.0 | 0.7 | 194.0 | 4513.0 | 4335.3 | 3.9 | 5248.5 | 16.3 |
| [31,32] | 39.0 | 1694.0 | 0.7 | 194.0 | 4533.0 | 5029.9 | 11.0 | 5676.0 | 25.2 |
| [1,33,34] | 13.7 | 39.0 | 0.7 | 100.0 | 350.0 | 362.2 | 3.5 | 409.7 | 17.1 |
| [1,33,34] | 25.0 | 297.0 | 0.6 | 160.0 | 1883.9 | 1954.9 | 3.8 | 2163.8 | 14.9 |
| [1,33,34] | 14.9 | 160.0 | 0.7 | 100.0 | 1377.8 | 1323.7 | 3.9 | 1238.8 | 10.1 |
| [1,33,34] | 12.0 | 60.1 | 0.7 | 112.0 | 515.0 | 559.7 | 8.7 | 613.7 | 19.2 |
| [1,33,34] | 37.6 | 201.0 | 0.8 | 106.0 | 894.0 | 788.4 | 11.8 | 703.9 | 21.3 |
| [1,33,34] | 43.0 | 613.1 | 0.8 | 265.0 | 2520.8 | 2383.7 | 5.4 | 2240.1 | 11.1 |
| [1,33,34] | 26.0 | 228.0 | 0.8 | 80.1 | 919.9 | 944.7 | 2.7 | 1143.8 | 24.3 |
| [1,33,34] | 46.6 | 1377.3 | 0.8 | 168.1 | 2835.0 | 3013.4 | 6.3 | 3238.6 | 14.2 |
| Statistical Parameter | LS-BOOST | Standing Correlation |
|---|---|---|
| MAPE | 9.30 | 13.96 |
| MAE | 161.63 | 220.30 |
| RMSE | 237.55 | 372.94 |
| CVRMSE | 20.2 | 30.18 |
| R2 | 0.96 | 0.90 |
Publisher’s Note: MDPI stays neutral with regard to jurisdictional claims in published maps and institutional affiliations. |
© 2021 by the authors. Licensee MDPI, Basel, Switzerland. This article is an open access article distributed under the terms and conditions of the Creative Commons Attribution (CC BY) license (https://creativecommons.org/licenses/by/4.0/).
Share and Cite
Alatefi, S.; Almeshal, A.M. A New Model for Estimation of Bubble Point Pressure Using a Bayesian Optimized Least Square Gradient Boosting Ensemble. Energies 2021, 14, 2653. https://doi.org/10.3390/en14092653
Alatefi S, Almeshal AM. A New Model for Estimation of Bubble Point Pressure Using a Bayesian Optimized Least Square Gradient Boosting Ensemble. Energies. 2021; 14(9):2653. https://doi.org/10.3390/en14092653
Chicago/Turabian StyleAlatefi, Saad, and Abdullah M. Almeshal. 2021. "A New Model for Estimation of Bubble Point Pressure Using a Bayesian Optimized Least Square Gradient Boosting Ensemble" Energies 14, no. 9: 2653. https://doi.org/10.3390/en14092653
APA StyleAlatefi, S., & Almeshal, A. M. (2021). A New Model for Estimation of Bubble Point Pressure Using a Bayesian Optimized Least Square Gradient Boosting Ensemble. Energies, 14(9), 2653. https://doi.org/10.3390/en14092653