Abstract
The influence of the briquetting process on SO2 and NO release characteristics, combustion properties and kinetic characteristics during biomass combustion was investigated. Two biomass (Wheat straw and Tree bulk) and two obtained briquettes were analysed. The briquetting process helps to prevent the release of SO2 and NO. The experimental results show that once the biomass is made into a briquette, when the reaction temperature is 900 , the sulphur release ratio for TB was reduced from 34.7% to 4.3% and for WS was reduced from 12.4% to 1.6%. When the reaction temperature increases to 1000 , the sulphur release ratio for TB was reduced from 73.4% to 30.4%, for WS it was reduced from 58.4% to 10.2%. SEM micrographs show that the compact structure of the TB-Briquette and WS-Briquette reduce the rate of SO2 and NO release during combustion. The thermogravimetry confirmed that the combustion performance of WS-Briquette is the best, while the TB-Briquette is the worst. According to the Coats-Redfern method, the fitting was performed at segments of 250 to 550 , and the correlation coefficient of the fitting degree was above 0.99. The effective collision rate of WS-Briquette is much higher than that of other briquettes. Compared to BR-1 and BR-2, trying to mix TB with WS to make a compound biomass briquette can enhance the combustion performance of TB-Briquette. The results may guide the upgrading of biomass briquettes technology and benefit the efficient application of biomass briquettes.
1. Introduction
Biomass is a source of renewable energy [1,2], which can divide into various types such as herbaceous plants [3], woody plants [4], aquatic plants [5], manures [6], municipal solid waste [7], organic waste/residue [8]. Generally, biomass can convert into three main types of product—electricity, heat energy and transportable fuel [9,10,11]. In China, as reported by the Medium and Long Term Development Plan for Renewable Energy Resources [12], the biomass resource consists of 37% crop straw, 43% wood waste and 20% other organic waste or residue, equal to about 500 million tonnes of standard coal per year. There is enormous potential for biomass utilisation.
However, in China, many biomass resources are low-grade biomass, that is, the energy density is much lower than the coal. To increase the usability of these biomass resources, there are multiple ways to upgrade biomass fuels such as torrefaction, carbonisation, pyrolysis, gasification, densifying and moulding [13]. For crop straws especially, which have lower energy density than the standard coal, upgrading is much needed. Torrefaction is a thermal pre-treatment process for upgrading biomass that heats the biomass at a temperature range of 200 to 300 in an inert atmosphere [11]. Carbonisation is a thermal process for obtaining highly fragrant refractory solid matter in an inert atmosphere [11]. The carbonisation temperatures range is between 300 to 500 . Pyrolysis is a thermal process that heats and decomposes biomass at high temperatures (300 to 1000 ) in an inert environment to obtain a pyrolysis product. Through gasification, two types of gas are created—product gas and syngas. Product gas is produced at lower temperatures (below 1000 ) and syngas at high temperatures (above 1200 ). Another simple but effective way to upgrade biomass is to make the biomass into solid densified biofuel. Based on the shape, densified solid biofuel can be classified into pellets (small cylinder with a diameter of 5 to 12 and a length of 10 to 30 ), briquettes (square section of and length of 30 to 80 ) and hollow rods (generally a hexagonal cross-section type, with a diameter of 50 to 60 , a length of about 500 and a 20 central-through hole) [14,15]. In this study, a biomass briquette is created, and the related characteristics are studied.
Recently, China has started to push the development of biomass energy utilisation and related emission standards. However, as mentioned by our previous studies [16], the emissions of potassium, SO2 and NO from biomass combustion are much higher than the current flue gas emission standard in China. The emission of potassium and chlorine may lead to a higher threat of corrosion for the heat-absorbing surface, gas pipe and flue gas ventilation equipment when directly burning biomass. Nitrogen Oxides (NOx, the principle form is NO), being a significant contributor to air pollution both at source and downwind regions, generally refer to various compounds of nitrogen and oxygen. Similarly, Sulphur Oxides (SOx), also being a significant contributor to air pollution, refer to various compounds of sulphur and oxygen, such as SO2 (the principle form) and SO3. The thermal power plant flue gas emission standards were issued in December 2019 by the National Energy Administration and the Ministry of Environmental Protection of China. The limitation of dust emission concentration was reduced to 20 , SO2 emission concentration to 50 , and NO emission concentration to 150 (standard condition is temperature of 273 , pressure of 101,325 Pa, dry flue gas) [16,17]. That is a stricter standard than most countries in the world. However, in China, there remains a question about whether our biomass-fired boiler can satisfy this requirement or not, especially due to the experiences of some straw-fired thermal power plants in Denmark, which badly broke the flue gas emission limitations [18].
There are many factors affecting the emission of SO2 and NO, such as the content of sulphur and nitrogen in biomass, the combustion temperature, and the reactive elements that can react with sulphur and nitrogen. Many studies [1,16,19,20,21] have reported that SO2 and NO emissions would reduce during biomass combustion or co-combustion with coal. However, the influence of the briquetting process on the combustion characteristics and SO2 NO release control of biomass are still not evident. Hence, with the stricter emission policy, it is necessary to take the step to study the combustion characteristics and SO2 NO release characteristics of the biomass briquette. Thus, this study aims to explore the influence of the briquetting process on the biomass combustion characteristics, SO2 NO release characteristics and fuel characterisation. The objectives of this study is to illustrate the influence of the briquetting process on the SO2 and NO release characteristics, and to study the influence of the briquetting process on biomass combustion behaviours. The results may guide the upgrading of biomass briquettes technology and benefit the efficient application of biomass briquettes.
2. Experimental Methodology
2.1. Materials and Preparation
One agricultural crop, Wheat Straw (WS), and a fast-growing tree residue, Tree Bulk (TB), which are widely used in cooking, heating and power generation, were collected from rural areas in Weifang, Shandong Province, China. Before analysis, the raw materials were pulverised into powder and dried for 24 at 60 . After that, WS and TB were sieved under an 80 mesh (sieve diameter is 180 ). In the meantime, two biomass briquettes (marked as BR-1 and BR-2) were obtained from a thermal power plant in Weifang, Shandong Province, China. BR-1 and BR-2 were made from mixing poplar wood, wheat straw and vegetable leaves, usually used in combustion with coal. They can represent the combustion requirements for the thermal power plant. Hence, comparing the combustion characteristics of TB and WS to BR-1 and BR-2 can illustrate the combustion performance of the TB-Briquette and WS-Briquette. The following Figure 1 shows the diagram of the TB, WS and their briquettes.
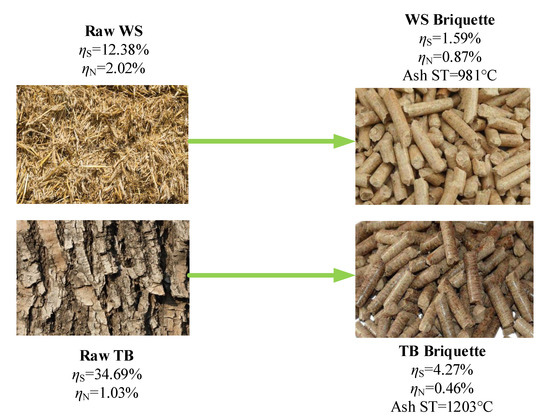
Figure 1.
Diagram of Tree Bulk (TB), Wheat Straw (WS) and their briquettes.
The proximate and ultimate analyses were conducted for these samples under the CEN/TS 1477-3 standard. A bomb calorimeter (CKIC 5E-AC8018) was used to measure the higher heating value (HHV) of the samples. Table 1 shows the results of proximate, ultimate analyses and HHV of these raw biomass samples. It can be seen from Table 1 that TB possesses the highest nitrogen content, BR-2 possesses the highest sulphur content.

Table 1.
Ultimate, proximate analysis and Higher Heating Value (HHV) of the biomass samples.
2.2. Briquetting Process
Firstly, 100.0(5) raw biomass powder were put into a cylindrical mould, waiting to be compressed into a biomass briquette with a tablet machine. The tablet machine (769YP-15A) was made by Tianjin Keqi High-tech Co., LTD. Then, all the samples were pressed with the tablet machine at a working pressure of 15 in 60 . As the biomass was mainly composed of cellulose, hemicellulose and lignin, and the cellulose and lignin acted as a natural binder in the raw bio-material [22] under the pressure of 15 . The obtained briquettes presented a cylindrical shape with 24 in diameter and 8 to 9 in length, which would be used in combustion experiments, as shown in Figure 2.
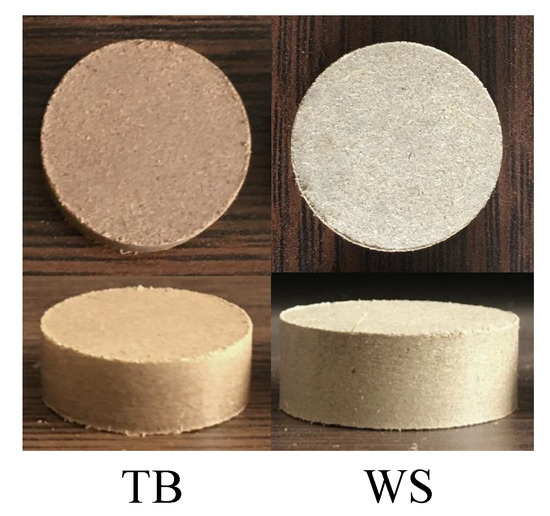
Figure 2.
Photos of the Tree Bulk (TB) and Wheat Straw (WS) briquettes obtained from the tabletting process.
2.3. Experimental Methods
The experiments on SO2 and NO release were conducted in a lab-scale tube furnace shown in Figure 3. The experimental set up was composed of an air feeding system, a reaction system, and an on-line monitoring system. The testing range of the SO2 is from 1 ppm to 100 ppm with an output frequency of 30 data points per minute. Detailed introduction of the test rig was available in previous studies [11,23,24].
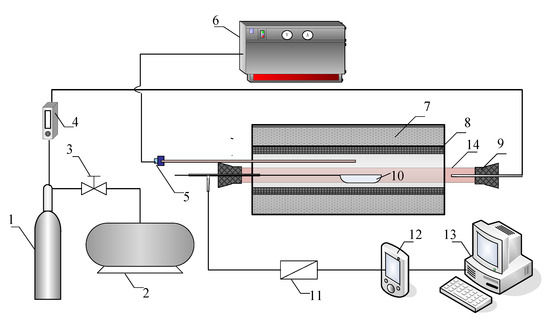
Figure 3.
Schematic diagram of the experiment system: 1 air cylinder, 2 compressor, 3 pressure reducing valve, 4 rotameter, 5 thermocouple, 6 temperature controller, 7 insulating layer, 8 electric heating element, 9 rubber plug, 10 alundum crucible, 11 filter, 12 gas analyser, 13 computer, 14 corundum tube.
In each batch, the alundum crucible containing a powder sample of 100.0(5) or one briquette (weighing 100.0(5) ) for the combustion experiment. The reactor was preheated to a given reaction temperature. In the meantime, the gas analyser was turned on for preheating and zero alignment. Once the temperature turned stable and the calibration of the gas analyser was completed, the alundum crucible was quickly pushed into the constant temperature zone. Then the plug was immediately tightened while the air supplied by the cylinder was introduced into the tube at a constant flow rate of . The flue gas was monitored by the flue gas analyser with a recording frequency of 1 to guarantee the accuracy of the measurements. The experiment would stop after the target content was less than 1 ppm. Each experiment was carried out 3 times to ensure the accuracy of the experimental data. The results were relatively uniform between each batch, and the relative error was less than 5%. The mass contents for NO and SO2 can be calculated through the following equations.
The volume flow rate for the gas flue was set to a constant value, , which was equal to .
Hence, the mass contents equations were changed to
Then the nitrogen conversion ratio and sulphur conversion ratio for the samples can be calculated through
2.4. Thermogravimetric Analysis of Biomass Briquettes
To understand the combustion characteristics and transformation behaviours of these biomass briquettes, the thermochemical behaviours information was tested by thermogravimetric analysis. The thermogravimetric/differential thermal analysis (TG/DTA) tests were performed by a microcomputer differential thermal balance analyser (TGA/SDTA851e, Mettler-Toledo). The differential thermogravimetric (DTG) analysis was obtained by calculating the first order derivative of the TG curve. During each batch, a 10.0(1) sample selected from the biomass briquette was testing from 30 to 1000 at a heating rate of 20 . The flow rate of the reactive gas (air) was supplied as 60 . The flow rate of the protective gas (N2) was 20 .
After the TG/DTG test, the combustion performances of these biomass briquettes were analysed by a series of TG parameters, such as the ignition temperature (), the burnout temperature () and the maximum weight loss rate (). To evaluate the general performances of these biomass briquettes, the ignition index () and the combustion characteristic index (S) were calculated through the following equations [10].
Here, indicates how fast the fuel becomes ignited and S expressed comprehensive characteristics. The higher the and the S are, the better the combustion activity of the fuel is.
3. Results and Discussion
3.1. Effects of Combustion Temperature
To study the influence of combustion temperatures on the SO2 and NO release, the experiments were carried out under combustion temperatures of 800 , 900 and 1000 , which was the temperature range of the biomass boiler. TB-Briquette, WS-Briquette, TB-Powder and WS-Powder were used in this section.
Figure 4 shows the release characteristics of SO2 and NO from different biomass samples under different reaction temperatures. It can be seen from Figure 4a,b that both the sulphur release amount and ratio increase with increased reaction temperatures. Especially for the WS-Powder, there is a large increase of SO2 release amount from 900 to 1000 .
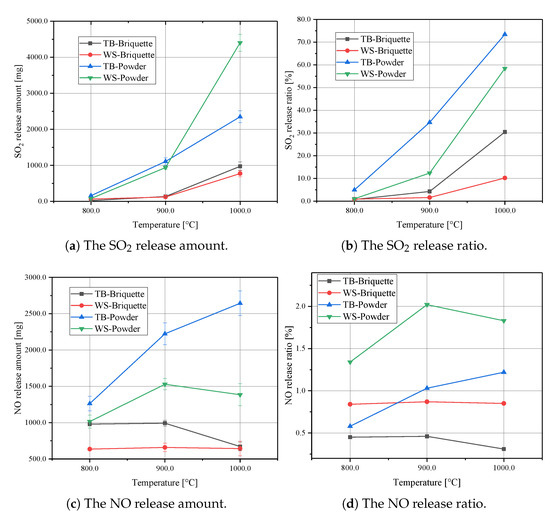
Figure 4.
SO2 and NO release curves for the biomass briquettes.
Figure 4c,d illustrates the influence of reaction temperatures on NO formation. It can be seen that the TB-Powder shows the most significant NO release amount. However, WS-Powder has the most significant NO release ratio. That means that even though the TB-Powder shows the most significant NO release amount, there is still a substantial amount of nitrogen remaining in the ash. From 800 to 1000 , the NO conversion ratios first increase and then decrease. It is implied that the selective non-catalytic reduction of NOx plays a role in NO formation. Thus, the conversion ratio in NO can slightly reduce under the temperature of 1000 . According to this discussion, the temperature can affect the conversion ratio of SO2 and NO.
3.2. Effect of Briquetting Process on the SO2 and NO Reduction
To illustrate the effect of the briquetting process on the SO2 and NO reduction, combustion experiments were carried out. TB-Briquette, WS-Briquette, TB-Powder and WS-Powder were used in this section. As shown in Figure 4a,b, when the reaction temperature is 800 , the difference of SO2 release amount between the powder samples and the briquettes samples is negligible. That is due to the sulphur starting to release after 800 . When the reaction temperature increases to 900 and 1000 , differences of SO2 release amount and release ratio between powder samples and briquette samples start to be distinguished. The sulphur release ratio was reduced from 34.7% to 4.3% while making TB into briquette under 900 . For WS, the sulphur release ratio was reduced from 12.4% to 1.6%. When the reaction temperature increases to 1000 , the sulphur release ratio for TB was reduced from 73.4% to 30.4%, for WS it was reduced from 58.4% to 10.2%.
Figure 4c,d illustrates the NO release characteristics for these biomass samples. Even though the release amount for the WS based samples is lower than for the TB based samples, the release ratio of NO is generally higher than for the TB based samples. That means a larger percentage of nitrogen within WS was transformed to NO during combustion than within the TB based samples. What is more important, the NO release amount and ratio curves show similar trends as the SO2 release amount. The WS-Briquette shows the minimum release amount of NO, followed by the TB-Briquette. The powder samples show a larger release amount of NO than the briquettes. This confirms the effectiveness of the briquetting process in preventing SO2 and NO release.
To understand the reason the briquetting process can enhance the effectiveness of preventing SO2 and NO release, Scanning Electron Microscope (SEM) micrographs of TB-Briquette and WS-Briquette are presented, as shown in Figure 5.
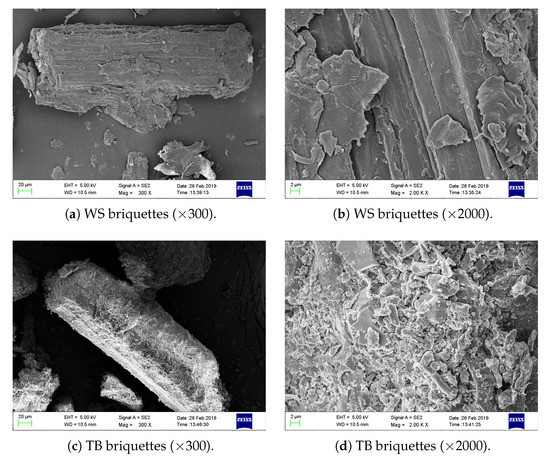
Figure 5.
Scanning Electron Microscope (SEM) micrographs of formed briquettes.
It can be seen from Figure 5a,c that there are pieces of rod-shape like substances captured in the micrographs. Figure 5a shows the micrograph for the WS briquette, while (C) shows the micrograph for the TB briquette. These pictures significantly indicate the contents for WS and TB sticking together under high temperatures, which form more compact wooden rods. This phenomenon is perhaps due to the partial surface melting of the compound salt within these biomass briquettes. These rods are quite important for the briquettes in that they formed the skeleton of the whole briquettes, which significantly increased the strength of the biomass briquettes. If we consider Figure 5b,d, which shows the surface morphologies for WS and TB briquettes under 2000 times magnification. The WS-Briquette shows a smooth surface, while the surface of the TB-Briquette is rough and covered by some particles. The difference in the morphologies between WS-Briquette and TB-Briquette is due to the different cellulose content. As we know that the cellulose, hemicellulose and lignin act as natural binders to bind the biomass pellet together. The WS contains more cellulose than the TB sample, which leads to a smoother surface melting than the TB sample. The compact structure of the TB-Briquette and WS-Briquette reduce the speed of SO2 and NO release during the combustion progress. That has two patterns; first, the compact structure of the briquettes increases the possibilities of the reaction between SO2, NO and the active content (such as P-based salts and Ca-based salts) from the ashes. Second, the compact structure increases the resistances for SO2 and NO release, which results in a longer stay time for reactions. Hence, some formed SO2 and NO is well captured before they are released into the gaseous phase. As shown in our previous study [10,11,16], additives such as NH4H2PO4, CaO or CaCO3 are used to reduce the sulphur release during the biomass combustion. Hence, the briquetting procedure can be further applied to reducing the usage amount of additive used in sulphur or nitrogen emission control.
3.3. Thermogravimetric Analysis Results
3.3.1. The Thermochemical Behaviours of Biomass Briquettes
The TG and DTG curves of these biomass briquettes are plotted in Figure 6. The combustion characteristics parameters obtained are summarised in Table 2. The y value in the TG curves is calculated by , where represents the conversion on the extent of the reaction. Generally, the combustion process for the biomass briquettes can be divided into three stages—the dehydration of moisture (Stage I), release of volatiles (Stage II), and the combustions of chars (Stage III) [10,25]. BR-1 has a larger ash content, as shown in Figure 6a, the uncreative mass of BR-1 is the largest. Due to the most volatile contents, cellulose and hemicellulose decompose at approximately 250 to 400 . Hence, it can be seen from Figure 6b that obvious peaks appear. The first one usually relates to the combustion of volatile, and the second one relates to the combustion of chars. The maximum weight loss for these curves is marked as and , respectively. As shown in Table 2, WS-Briquette does not have a value, indicating an absence of the second peak. BR-1 and BR-2 show the sharpest peaks, which indicate the fast reaction process in volatile releasing. Both BR-1 and BR-2 keep an apparent feature of Stage II. For TB-Briquette and WS-Briquette, the first peaks are not as sharp as BR-1 and BR-2, which indicates a lower reaction process in volatile releasing. The peak of WS-Briquette comes earlier than TB-Briquette, which shows that the WS-Briquette combusts easier than the TB-Briquette. TB-Briquette and WS-Briquette eliminate the occurrence of Stage II.
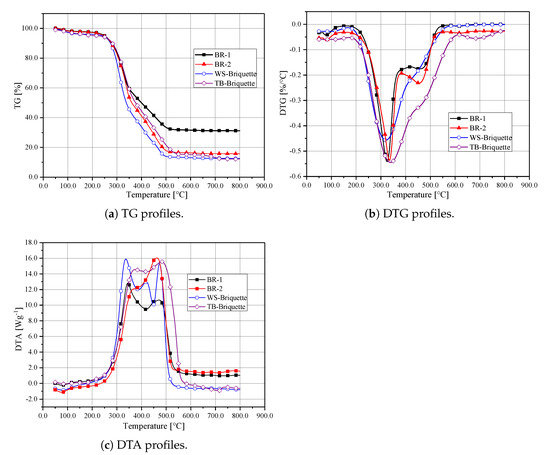
Figure 6.
Thermogravimetric (TG), Differential Thermogravimetric (DTG) and Differential Thermal Analysis (DTA) profiles for biomass briquettes.
Table 2.
Combustion characteristics parameters of biomass briquettes.
The differential thermal analysis (DTA) curves are shown in Figure 6c. It can be seen that, before ignition, the DTA values of the biomass briquettes are less than zero, indicating the occurence of endothermic reactions. The absorbed heat was used to satisfy the requirements of moisture evaporation, low-temperature volatile formation and ignition. Once the temperature reaches the ignition temperature, the heat was released during combustion. The WS-Briquette shows the fastest release of heat, as illustrated by the first peak in Figure 6c. The TB-Briquette shows a constant heat release profile during the period of burning, and the heat release peak appears later than the WS-Briquette. The BR-2 shows the largest heat release during the combustion of char, while the BR-1 shows the lowest heat release.
Comparing BR-1 and BR-2, the index of TB-Briquette and WS-Briquette are smaller, indicating that TB-briquette and WS-Briquette have worse ignition characteristics. When focusing on the value of and , it can be seen that the combustion process of BR-1 and BR-2 are within TB-Briquette and WS-Briquette. The lowest value of S appears on the TB-Briquette, indicating that the combustion performance of the TB-Briquette should be improved during combustion. The highest value of S appears on WS-Briquettes, indicating that the combustion performance of WS-Briquette is best, which is also confirmed by the value of . Thus, to better apply the TB-briquette, mixing with WS is the right choice.
3.3.2. The Kinetic Characteristic of Biomass Briquettes
To analyse the combustion properties of these biomass briquettes, the mathematical description is listed in the following equation.
This equation reflects the function of reaction rate constant () and the differential conversion function (). The is derived from the Arrhenius equation, while represents the reaction mechanism. Among modal-fitting stages, the Coats-Redfern method is generally used to explain the solid reaction mechanism. The comprehensive equations for the Coats-Redfern method are fully listed in previous research [26]. Following these methods and a series of variables separation, integration and simplification, Equation (9) converts to
where is the heating rate, . Straight lines are fitted by the plot of the left side of Equation (10) or Equation (11) against . The intercept is and the slope is . With these straight lines, the value of the activation energy (E) and pre-exponential factor (A) can be estimated. The correlation coefficient (R) is used to determine whether the linear fit is acceptable or not. The major mass loss areas determine the temperature zones which are used to calculate the kinetic parameters on DTG plots. Figure 7 illustrates the fitted curves of the simulated equations. In Table 3, the biomass briquettes combustion kinetic parameters are listed.
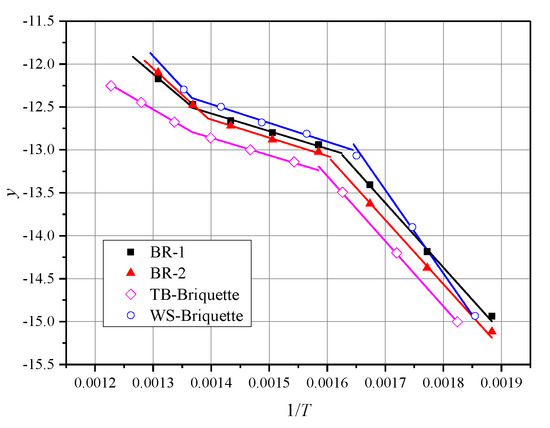
Figure 7.
Simulations equations on kinetic analysis by Coats-Redfern method.
Table 3.
Combustion kinetic parameters of biomass briquettes.
According to Figure 7 and Table 3, the fitting curves are highly coincidental with the presented data points, and the values of R are larger than 0.99. The largest value of R is 0.999 and the smallest value of R is 0.992. The E are in the range of 32.67 / to 60.62 / for the reaction stage I and 16.97 / to 18.15 / for reaction stage II. Hence, it is obvious that all biomass briquettes are one single reaction mechanism [10]. E varies in the range of 62.13 / to 80.71 /. The reactivity of these biomass briquettes is WS-Briquette > TB-Briquette > BR-1 > BR-2.
4. Conclusions
In this study, the influence of the briquetting process on SO2 and NO release characteristics, combustion properties and kinetic characteristics during biomass combustion was investigated. Two biomass (Wheat straw and Tree bulk) and two obtained briquettes were analysed, and the following conclusion can be drawn. The briquetting process helps to prevent the release of SO2 and NO. The experimental results show that once the biomass is made into a briquette, when the reaction temperature is 900 , the sulphur release ratio for TB was reduced from 34.7% to 4.3% and for WS was reduced from 12.4% to 1.6%. When the reaction temperature increases to 1000 , the sulphur release ratio for TB was reduced from 73.4% to 30.4%, and for WS it was reduced from 58.4% to 10.2%. SEM micrographs show that the compact structure of the TB-Briquette and WS-Briquette reduce the speed of SO2 and NO release during the combustion progress from increasing the possibilities of the reaction between SO2, NO and the active content from the ashes. The thermogravimetric analysis confirms that the combustion performance of WS-Briquette is the best, while that of the TB-Briquette is the worst. According to the Coats-Redfern method, the fitting was performed at segments of 250 to 550 , and the correlation coefficient of a fitting degree was above 0.99. The effective collision rate of the WS-Briquette is much higher than that of other briquettes. Compared to BR-1 and BR-2, trying to mix TB with WS to make a compound biomass briquette can enhance the combustion performance of TB-Briquette. The results may provide guidance for biomass briquettes technology and benefit the efficient densification application of biomass.
Author Contributions
Conceptualization, K.H.; methodology, J.Q.; software, H.L. and Q.W.; investigation, J.Q. and Q.W.; writing—original draft preparation, J.Q.; writing—review and editing, J.Q.; supervision, K.H.; project administration, K.H.; funding acquisition, K.H. All authors have read and agreed to the published version of the manuscript.
Funding
This study was supported by the [National Natural Science Foundation of China] under Grant [51206096]; [College Independent Innovation Fund of Jinan] under Grant [201401275]; [Science and Technology Development Plan Project of Shandong Province] under Grant [2016GGX104005]; [Shandong Provincial Natural Science Foundation] under Grant [ZR2019BEE059]; and [Young Scholars Program of Shandong University].
Institutional Review Board Statement
Not applicable.
Informed Consent Statement
Not applicable.
Data Availability Statement
Not applicable.
Conflicts of Interest
The authors declare no conflict of interest.
Abbreviations
The following abbreviations are used in this manuscript:
| BR | Obtained briquettes. |
| DTG | Differential thermogravimetric. |
| HHV | Higher heating value, []. |
| TB | Tree bulk. |
| TG | Thermogravimetric. |
| WS | Wheat straw. |
| The conversion rate of the sample, [%]. | |
| The heating rate, [ ]. | |
| Nitrogen conversion ratio, [%]. | |
| Sulphur conversion ratio, [%]. | |
| A | The pre-exponential factor, []. |
| The NO content at the time t, [ppm]. | |
| The SO2 content at the time t, [ppm]. | |
| The gas flue volume flow rate at time t, []. | |
| The ignition index, []. | |
| The maximum weight loss rate, []. | |
| E | The value of active Energy, []. |
| The differential conversion function. | |
| The reaction rate constant. | |
| S | The combustion characteristics index, []. |
| t | One specific experiment time, []. |
| The burnout temperature, []. | |
| The ignition temperature, []. | |
| The gas flue volume flow rate at time t, []. |
References
- Cheng, J. Biomass to Renewable Energy Processes; CRC press: Boca Raton, FL, USA, 2017. [Google Scholar]
- Qi, J.; Reddell, T.; Qin, K.; Hooman, K.; Jahn, I.H. Supercritical CO2 radial turbine design performance as a function of turbine size parameters. J. Turbomach. 2017, 139, 081008. [Google Scholar] [CrossRef]
- Wiselogel, A.; Tyson, S.; Johnson, D. Biomass feedstock resources and composition. In Handbook on Bioethanol; Routledge: Milton Park, UK, 2018; pp. 105–118. [Google Scholar]
- Pellegrini, A.F.; Pringle, R.M.; Govender, N.; Hedin, L.O. Woody plant biomass and carbon exchange depend on elephant-fire interactions across a productivity gradient in African savanna. J. Ecol. 2017, 105, 111–121. [Google Scholar] [CrossRef]
- Tenorio, A.T.; Kyriakopoulou, K.E.; Suarez-Garcia, E.; van den Berg, C.; van der Goot, A.J. Understanding differences in protein fractionation from conventional crops, and herbaceous and aquatic biomass-Consequences for industrial use. Trends Food Sci. Technol. 2018, 71, 235–245. [Google Scholar] [CrossRef]
- Shi, Y.; Ziadi, N.; Hamel, C.; Bittman, S.; Hunt, D.; Lalande, R.; Shang, J. Soil microbial biomass, activity, and community composition as affected by dairy manure slurry applications in grassland production. Appl. Soil Ecol. 2018, 125, 97–107. [Google Scholar] [CrossRef]
- Wang, T.; Li, Y.; Zhang, J.; Zhao, J.; Liu, Y.; Sun, L.; Liu, B.; Mao, H.; Lin, Y.; Li, W.; et al. Evaluation of the potential of pelletized biomass from different municipal solid wastes for use as solid fuel. Waste Manag. 2018, 74, 260–266. [Google Scholar] [CrossRef] [PubMed]
- Ghimire, A.; Trably, E.; Frunzo, L.; Pirozzi, F.; Lens, P.N.; Esposito, G.; Cazier, E.A.; Escudié, R. Effect of total solids content on biohydrogen production and lactic acid accumulation during dark fermentation of organic waste biomass. Bioresour. Technol. 2018, 248, 180–186. [Google Scholar] [CrossRef] [PubMed]
- Brown, R.C. Thermochemical Processing of Biomass: Conversion into Fuels, Chemicals and Power; John Wiley & Sons: Hoboken, NJ, USA, 2019. [Google Scholar]
- Wang, Q.; Han, K.; Gao, J.; Wang, J.; Lu, C. Investigation of maize straw char briquette ash fusion characteristics and the influence of phosphorus additives. Energy Fuels 2017, 31, 2822–2830. [Google Scholar] [CrossRef]
- Qi, J.; Han, K.; Wang, Q.; Gao, J. Carbonization of biomass: Effect of additives on alkali metals residue, SO2 and NO emission of chars during combustion. Energy 2017, 130, 560–569. [Google Scholar] [CrossRef]
- Medium and Long Term Development Plan for Renewable Energy Resources; National Development and Reform Commission: Beijing, China, 2007.
- Tumuluru, J.S. Biomass Volume Estimation and Valorization for Energy; BoD–Books on Demand: Norderstedt, Germany, 2017. [Google Scholar]
- Zhou, Y.; Zhang, Z.; Zhang, Y.; Wang, Y.; Yu, Y.; Ji, F.; Ahmad, R.; Dong, R. A comprehensive review on densified solid biofuel industry in China. Renew. Sustain. Energy Rev. 2016, 54, 1412–1428. [Google Scholar] [CrossRef]
- Niño, A.; Arzola, N.; Araque, O. Experimental study on the mechanical properties of biomass briquettes from a mixture of rice husk and pine sawdust. Energies 2020, 13, 1060. [Google Scholar] [CrossRef]
- Han, K.; Gao, J.; Qi, J. The study of sulphur retention characteristics of biomass briquettes during combustion. Energy 2019, 186, 115788. [Google Scholar] [CrossRef]
- Han, K.; Li, X.; Qi, J.; Zhu, Y.; Long, S.; Li, H.; Niu, S.; Li, S.; Xu, Y. Synergistic effect of additives and blend on sulfur retention, NO release and ash fusibility during combustion of biomass briquettes. Int. J. Green Energy 2021, 18, 187–202. [Google Scholar] [CrossRef]
- Sander, B.; Henriksen, N.; Larsen, O.; Skriver, A.; Ramsgaard-Nielsen, C.; Jensen, J.N.; Stærkind, K.; Livbjerg, H.; Thellefsen, M.; Dam-Johansen, K.; et al. Emissions, corrosion and alkali chemistry in straw-fired combined heat and power plants. In Proceedings of the 1st World Conference and Exhibition on Biomass for Energy and Industry, Sevilla, Spain, 5–9 June 2000. [Google Scholar]
- Li, Z.; Zhao, W.; Li, R.; Wang, Z.; Li, Y.; Zhao, G. Combustion characteristics and NO formation for biomass blends in a 35-ton-per-hour travelling grate utility boiler. Bioresour. Technol. 2009, 100, 2278–2283. [Google Scholar] [CrossRef] [PubMed]
- Krzywański, J.; Rajczyk, R.; Nowak, W. Model research of gas emissions from lignite and biomass co-combustion in a large scale CFB boiler. Chem. Process. Eng. 2014, 35, 217–231. [Google Scholar] [CrossRef]
- Krzywanski, J.; Czakiert, T.; Blaszczuk, A.; Rajczyk, R.; Muskala, W.; Nowak, W. A generalized model of SO2 emissions from large-and small-scale CFB boilers by artificial neural network approach Part 2. SO2 emissions from large-and pilot-scale CFB boilers in O2/N2, O2/CO2 and O2/RFG combustion atmospheres. Fuel Process. Technol. 2015, 139, 73–85. [Google Scholar] [CrossRef]
- Gangil, S. Beneficial transitions in thermogravimetric signals and activation energy levels due to briquetting of raw pigeon pea stalk. Fuel 2014, 128, 7–13. [Google Scholar] [CrossRef]
- Qi, J.; Li, H.; Han, K.; Zuo, Q.; Gao, J.; Wang, Q.; Lu, C. Influence of ammonium dihydrogen phosphate on potassium retention and ash melting characteristics during combustion of biomass. Energy 2016, 102, 244–251. [Google Scholar] [CrossRef]
- Wang, Q.; Han, K.; Qi, J.; Zhang, J.; Li, H.; Lu, C. Investigation of potassium transformation characteristics and the influence of additives during biochar briquette combustion. Fuel 2018, 222, 407–415. [Google Scholar] [CrossRef]
- Fang, M.; Shen, D.; Li, Y.; Yu, C.; Luo, Z.; Cen, K. Kinetic study on pyrolysis and combustion of wood under different oxygen concentrations by using TG-FTIR analysis. J. Anal. Appl. Pyrolysis 2006, 77, 22–27. [Google Scholar] [CrossRef]
- Han, K.; Wang, Q.; Zhao, J.; Luo, K.; Li, H.; Chen, Y.; Lu, C. Combustion pattern, characteristics, and kinetics of biomass and chars from segmented heating carbonization. Asia-Pac. J. Chem. Eng. 2016, 11, 812–822. [Google Scholar] [CrossRef]


Publisher’s Note: MDPI stays neutral with regard to jurisdictional claims in published maps and institutional affiliations. |
© 2021 by the authors. Licensee MDPI, Basel, Switzerland. This article is an open access article distributed under the terms and conditions of the Creative Commons Attribution (CC BY) license (https://creativecommons.org/licenses/by/4.0/).