1. Introduction
Hydropower, as a part of the family of renewable energy sources, is an active engineering and scientific field which focuses on optimization of the entire energy transformation process so as to attain more efficient, flexible, and reliable electricity generation. Increased electricity demands for balancing and, sometimes, temptingly high profit margins for off-design operation have pushed hydroturbines to their structural limits. The turbines are being operated at unfavorable loads, which has raised concerns and challenged the existing design philosophy. The critical requirements for modern turbines are high efficiency and stability over the wide operating range. Increasing flexibility in energy production from hydropower plants is a task demanded by the hydropower sector in Europe and worldwide, especially in off-design operation conditions of the turbines. The turbines need to operate with more start–stop cycles and high ramping rates. Variable-speed operation of Francis turbines is seen as an alternative solution to achieve high ramping rates and more efficient energy production in off-design operating conditions [
1,
2,
3].
As a part of the HydroFlex project, the goal of this research is to develop a robust parametric tool for the generation of radial guide vane cascades for low specific speed Francis turbines. In this case, the open Francis-99 turbine geometry was used as a reference, and the tool was developed and further tested for this particular geometry [
1]. However, the research shows that the applied methods can be generalized and used for various types of high-head Francis turbines as well.
Due to confidentiality, it is very hard to get to the turbine design approaches used by the manufacturers, which makes it difficult for researchers to engage their skills and knowledge in evaluating the turbine designs. Computational fluid dynamics (CFD) is generally used for the design of turbine passages and for evaluation of the hydrodynamic behavior of the entire machine. Combining CFD with parametrically defined guide vanes, numerical calculations for different cascade configurations are performed with the goal to identify the limits of the guide vane design procedure for high-head Francis turbines, in this case, the zone of best efficiency operation of the turbine, taken as a starting point for the design. The limits of the geometrical parameters are further used to propose an optimization objective in the narrow range, and to improve the tool in MATLAB for guide vane cascade configuration development.
2. Geometry Description
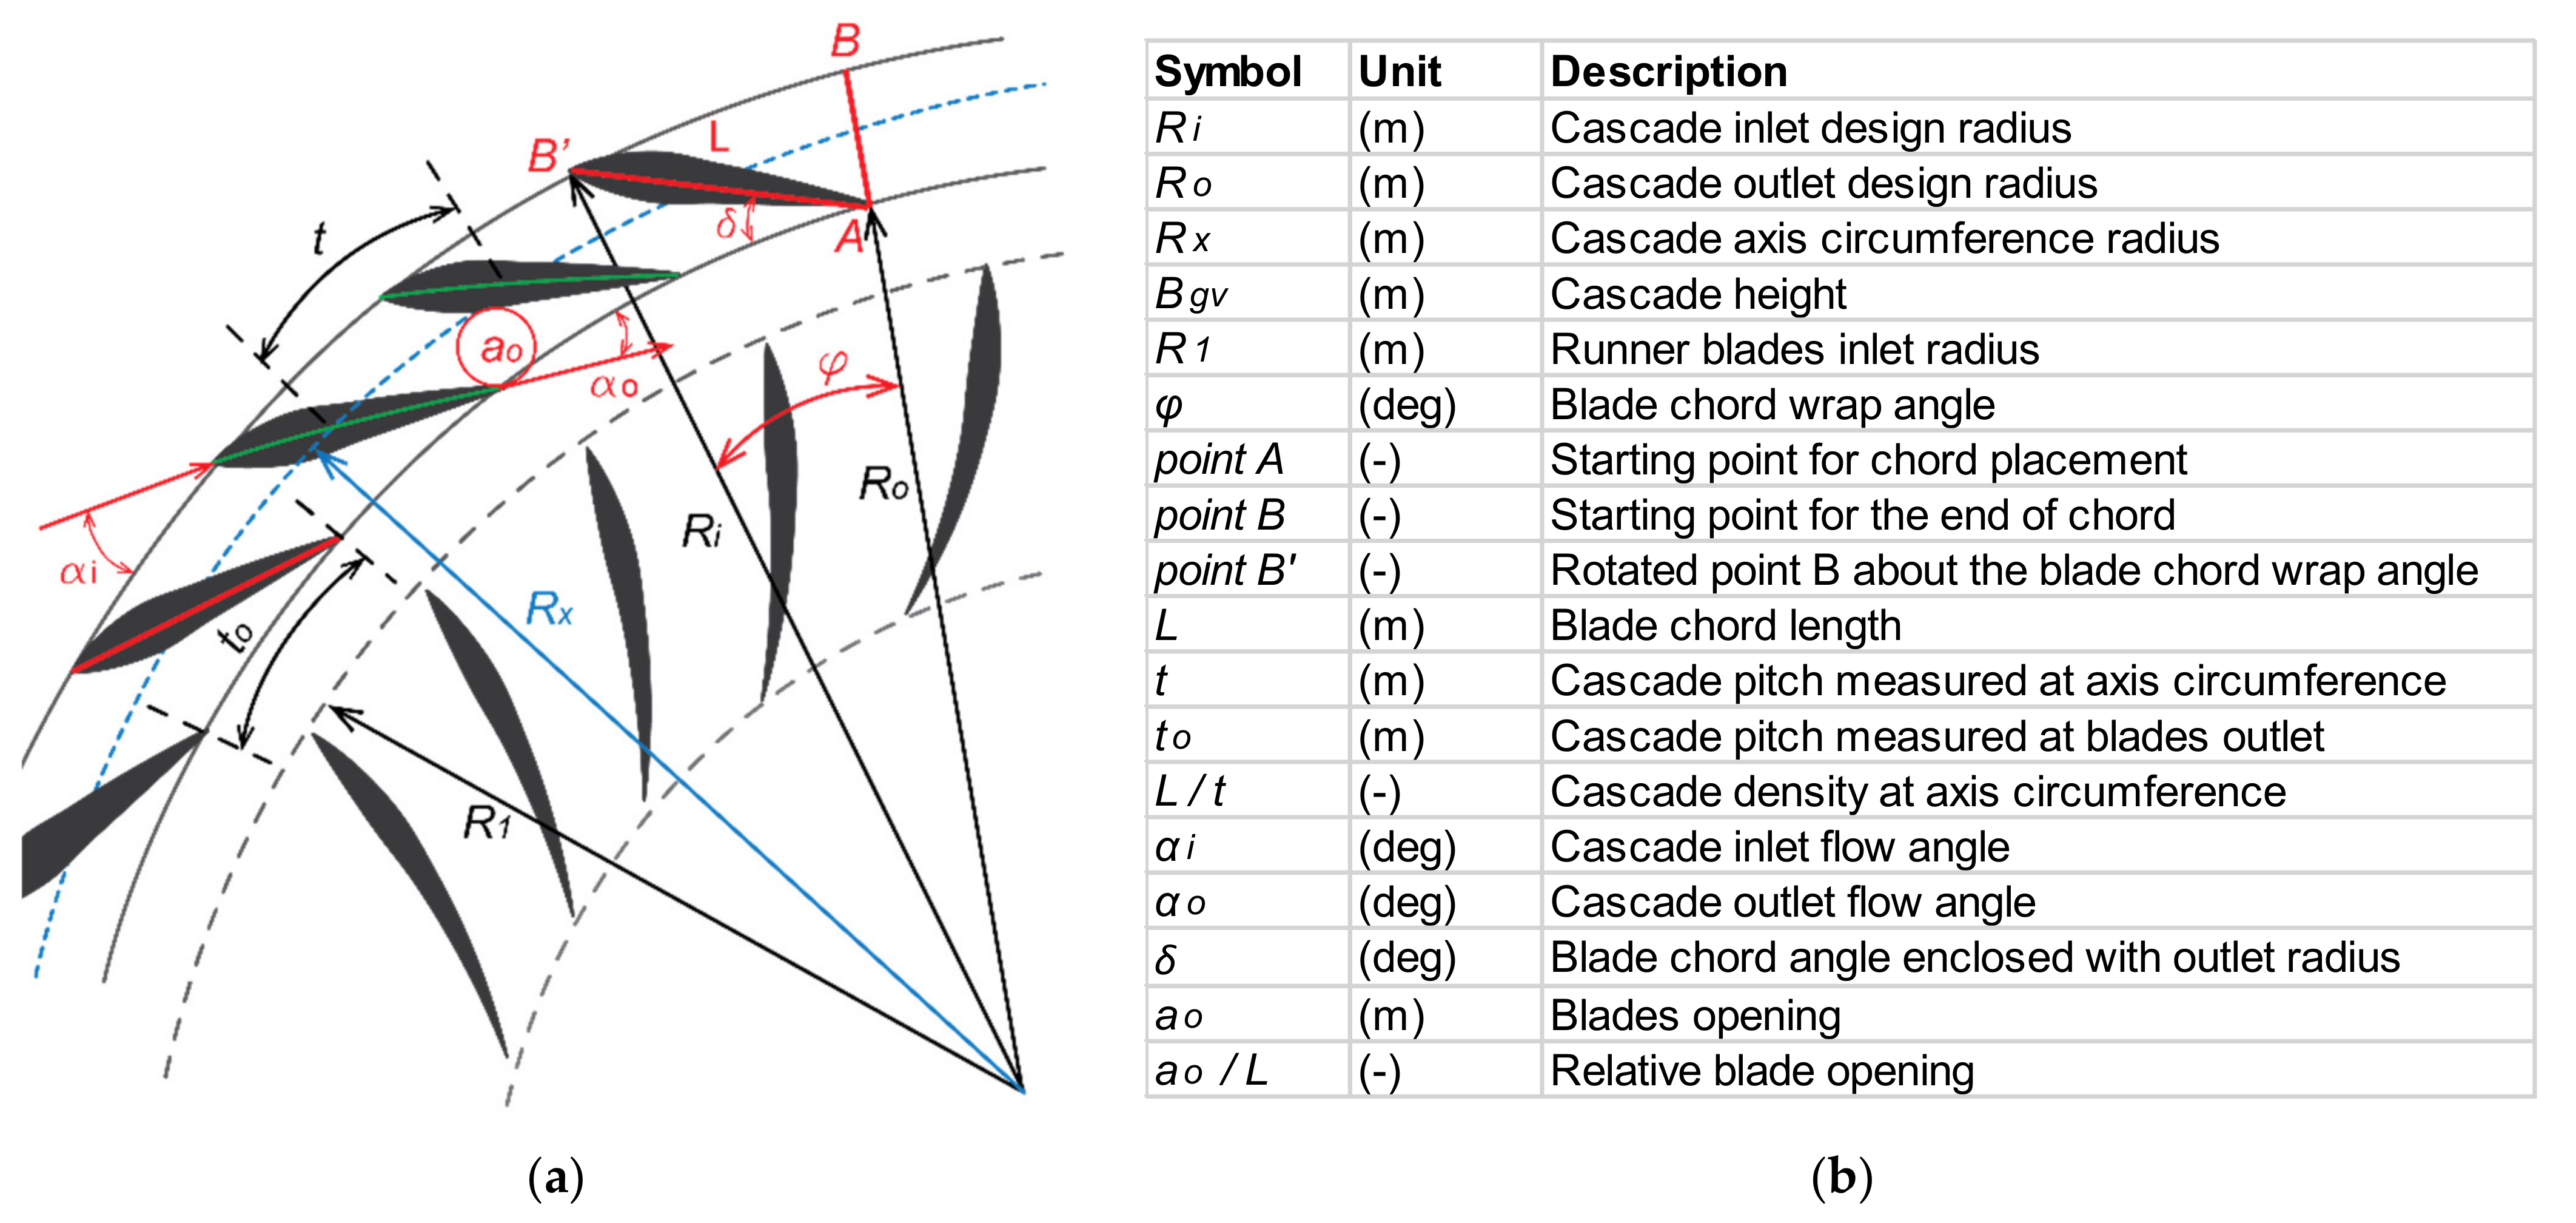
Figure 1 shows the main geometrical parameters that are considered for the development of the guide vane cascade [
4,
5,
6,
7,
8]. Primarily, the goal is to estimate the ranges for these parameters under the design conditions of the turbine.
As
Figure 1 shows, all geometrical parameters are obtained in relation to the turbine’s center of rotation. Their values are defined according to the turbine runner inlet diameter, inlet height, rotational speed, and design flow rate and head. All of these geometrical constraints are further generalized to obtain a “non-dimensional” guide vane cascade [
9].
The main geometrical parameters of the guide vanes include the guide vane outlet circumference radius
Ro. It represents the distance from the blades’ trailing edges to the runner inlet edges in the turbine design conditions, which, in this case, is the best efficiency point. It is represented as a ratio from the runner inlet radius as:
The guide vane inlet circumference radius
Ri represents the cascade inlet circle. The vanes’ hydraulic profiles are positioned between these radii. The inlet radius is represented as a ratio of the guide vane outlet radius as:
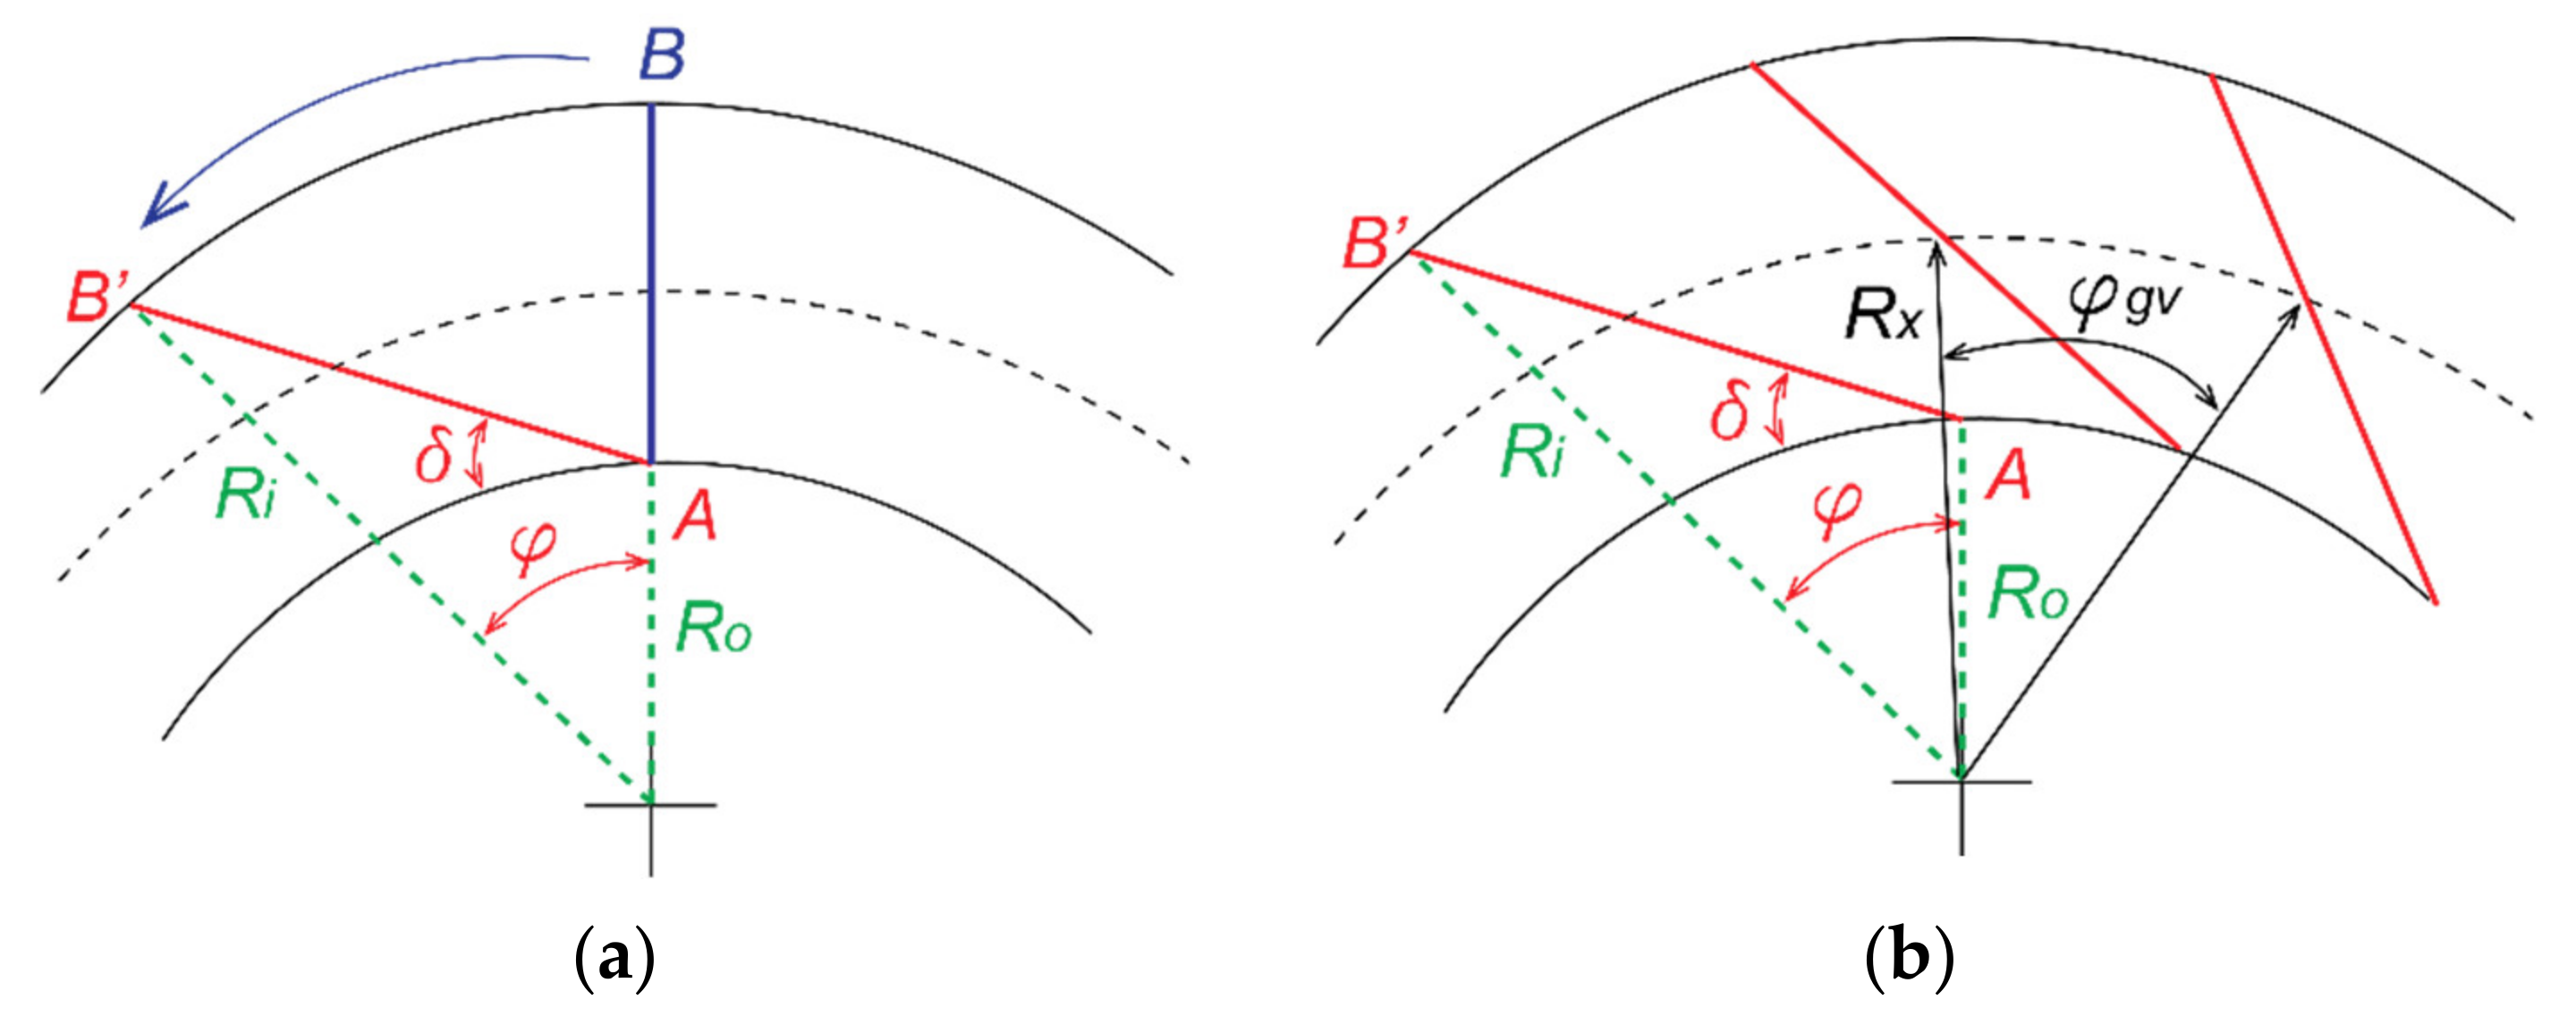
A fixed point (starting point) of the chord line is selected on the guide vane outlet radius, indicated as Point A. The point where the chord line begins is on the top of the guide vane inlet radius, noted as Point B, as shown in
Figure 2. A rotation of the chord line is introduced around the turbine rotation axis to place the chord line between the guide vane radii by rotating the top Point B positioned on the inlet radius. For an arbitrary number of blades in the cascade, noted as
Zgv, the blades angular distribution will be:
and the normalized (relative) wrap angle of the chord line will be the ratio of the actual wrap angle
φ and the blades’ angular distribution
φgv:
The chord line forms an angle δ with the cascade outlet diameter; the angle shows the leaning of the chord line towards the outlet.
The chord length, indicated as
L, represents the actual blade length, and according to the selected number of blades
Zgv, a cascade pitch is formed, marked as
t, to obtain the cascade density, as the ratio between the length and the pitch:
where the pitch
t is calculated according to the axis radius
Rx where the blades are assumed to be pivoted. In this initial case, as the pivot point location is not observed, the axis radius is calculated as the average radius between the inlet and outlet circumference:
For the obtained position of the chord line, a simplified calculation is made for the velocity triangles at the guide vane inlet and outlet. According to the free-vortex theory [
9,
10,
11,
12], where the circulation remains constant in the vaneless space, the flow velocity and its radial and tangential components are obtained, yielding the flow direction that the guide vanes need to achieve. Deriving from the Euler turbine equation, the needed inflow angle at the turbine design point is obtained as:
where
nd is the design rotational speed,
Qd is the design flow rate,
Hn is the design net head,
Br1 is the runner inlet height, and
g is the gravitational acceleration. According to this, the runner inlet velocity triangle is obtained. The angle
in
Figure 1 is the cascade outlet flow angle which needs to be developed, and it slightly differs from the absolute velocity angle
at the runner inlet, due to the free-vortex effect in the vaneless space. The radial cascade outflow conditions are guided from the outlet velocity and its components in a radial (which represents the flow rate) and the tangential (which represents the circulation) manner. The free-vortex law which preserves in the vaneless space is transferred from the runner inlet to the guide vane outlet, with respect to the change of the radial distance as:
where
represents the tangential velocity component of the guide vanes and
is the tangential velocity at the runner inlet. The radial velocity component is directly influenced by the turbine flow rate at certain radial distance, with respect to the cascade height
as:
The vector sum of these two components gives the outlet velocity of the cascade:
and it has an angle
at the cascade outlet:
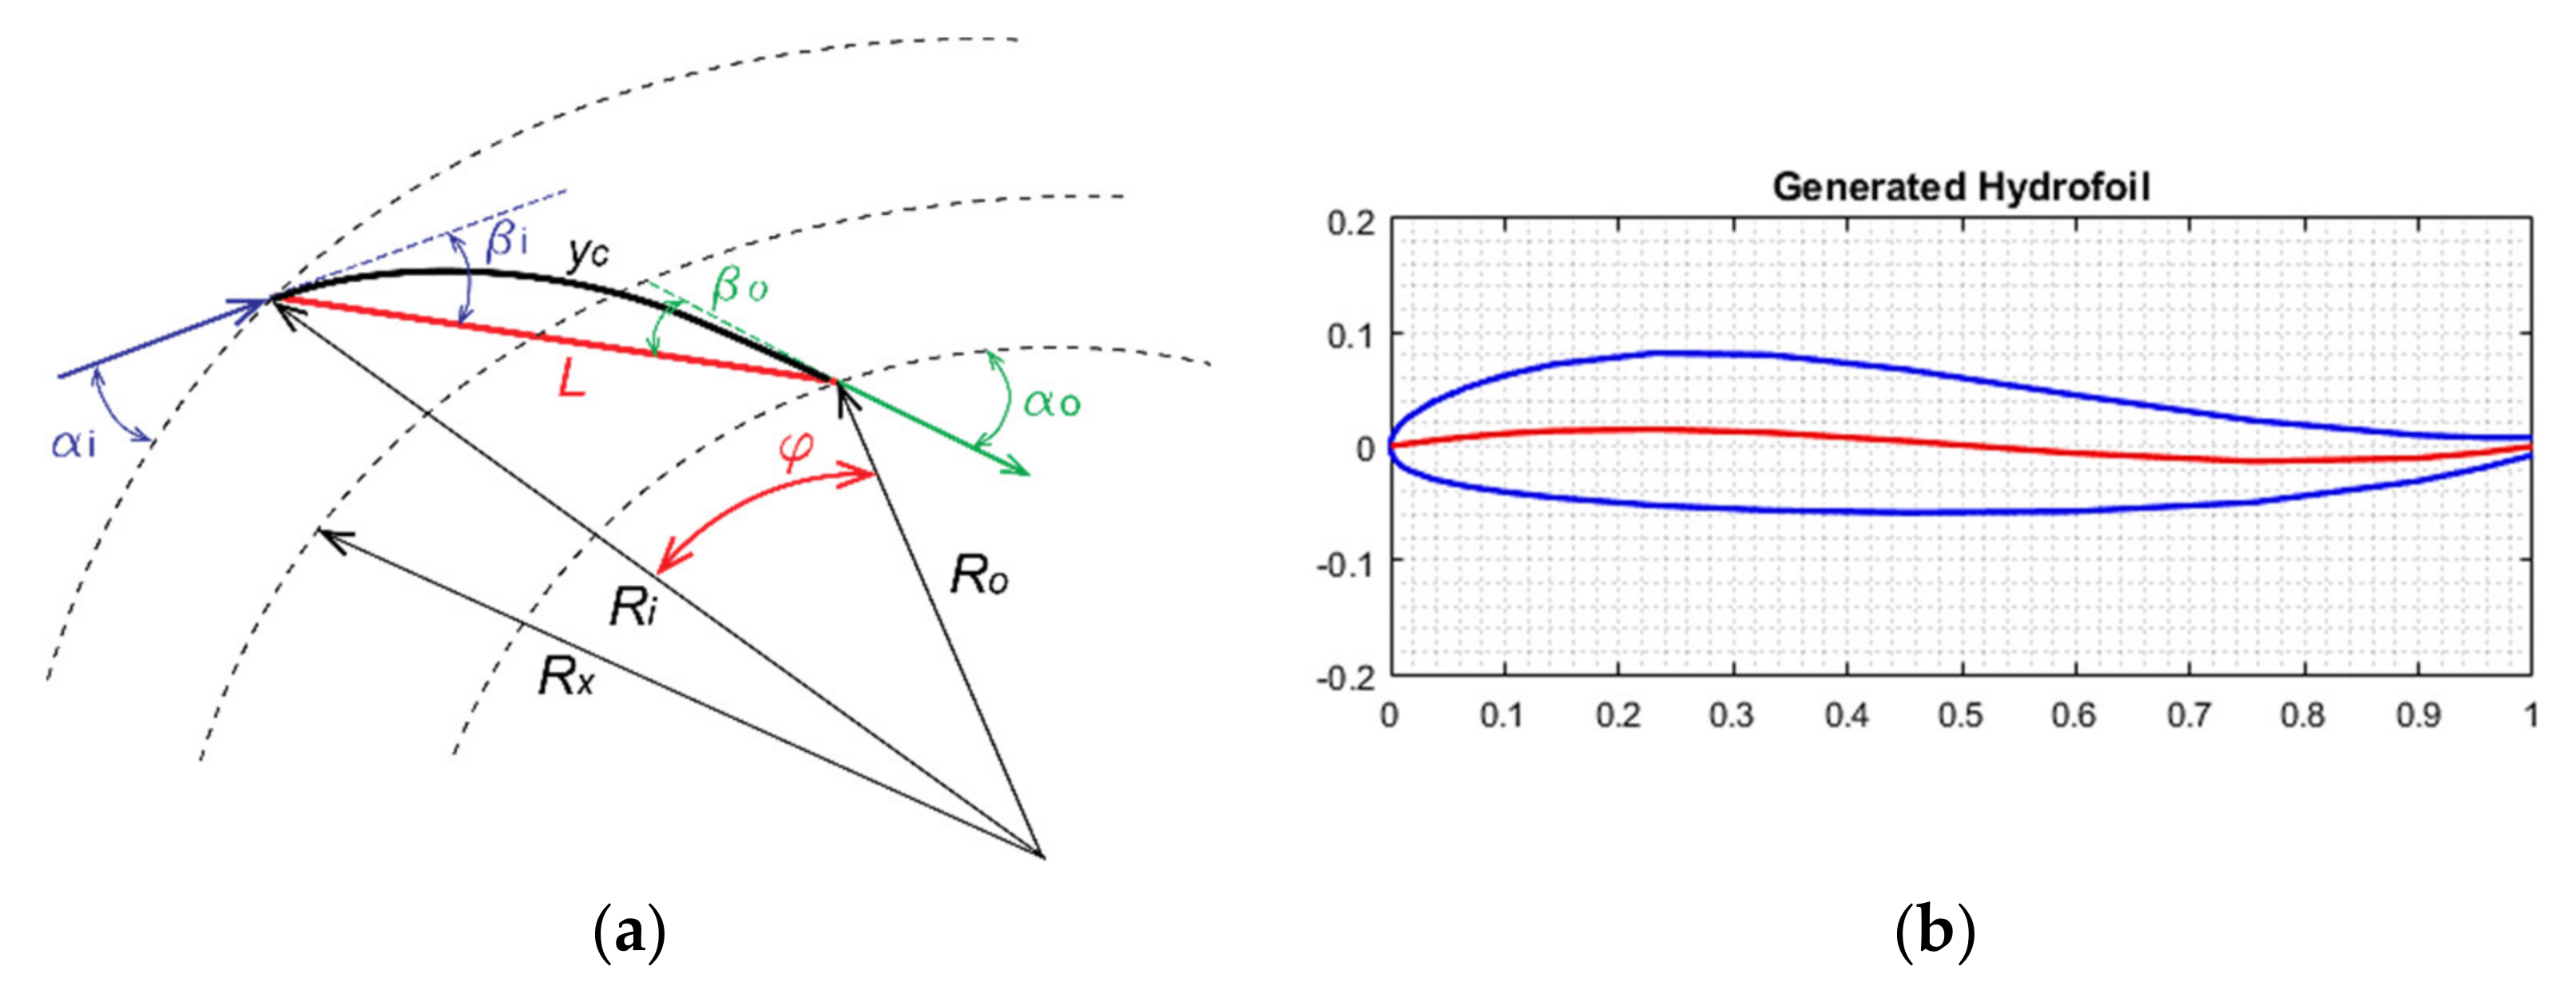
The inflow angle to the guide vanes is pre-defined from the spiral casing and the stay vanes of the observed turbine. These calculated flow angular directions are enclosing angles with the chord line, shown in
Figure 3, from which a polynomial equation is derived and the camber line
yc of the blades can be calculated as follows [
13]:
where
x represents the non-dimensional chord length. The following relations for the coefficients of the equation are obtained:
where
βo is the enclosed outflow angle and
βi is the enclosed inflow angle with the chord line. This shows that the camber-line polynomial equation coefficients are strictly dependent from the flow angles which are enclosed with the chord line. This equation is developed to obtain hydrofoils with a reflexed camber-line, if needed [
13]. After obtaining the camber-line, a Bezier curve is developed for the thickness distribution, where the curve weights are selected in the range of several recommended hydrofoil configurations. The idea was to enable changes in the location of maximal thickness of the blade and to include it into the optimization procedure. The Bezier parametrized points are calculated as [
14]:
where
n represents the number of parameters (weights) and
Pi are the adopted parameters for thickness distribution development of the blade.
The opening between two blades
, presented in
Figure 1, shows particular difficulty for geometrical parametrization. In this case, the opening is observed afterwards as a relative parameter
in a ratio to the chord length, and it is further investigated as an obtained result of:
3. Turbine Inputs and Developed Guide Vane Configurations
The developed guide vane configurations correspond to the previous geometrical explanations and flow considerations. The turbine inputs, which are crucial for the initial design, are given in
Table 1. The following parameters represents the Francis-99 turbine model installed at the Waterpower Laboratory at NTNU [
15], for which, from the model hill chart, the following values have been adopted:
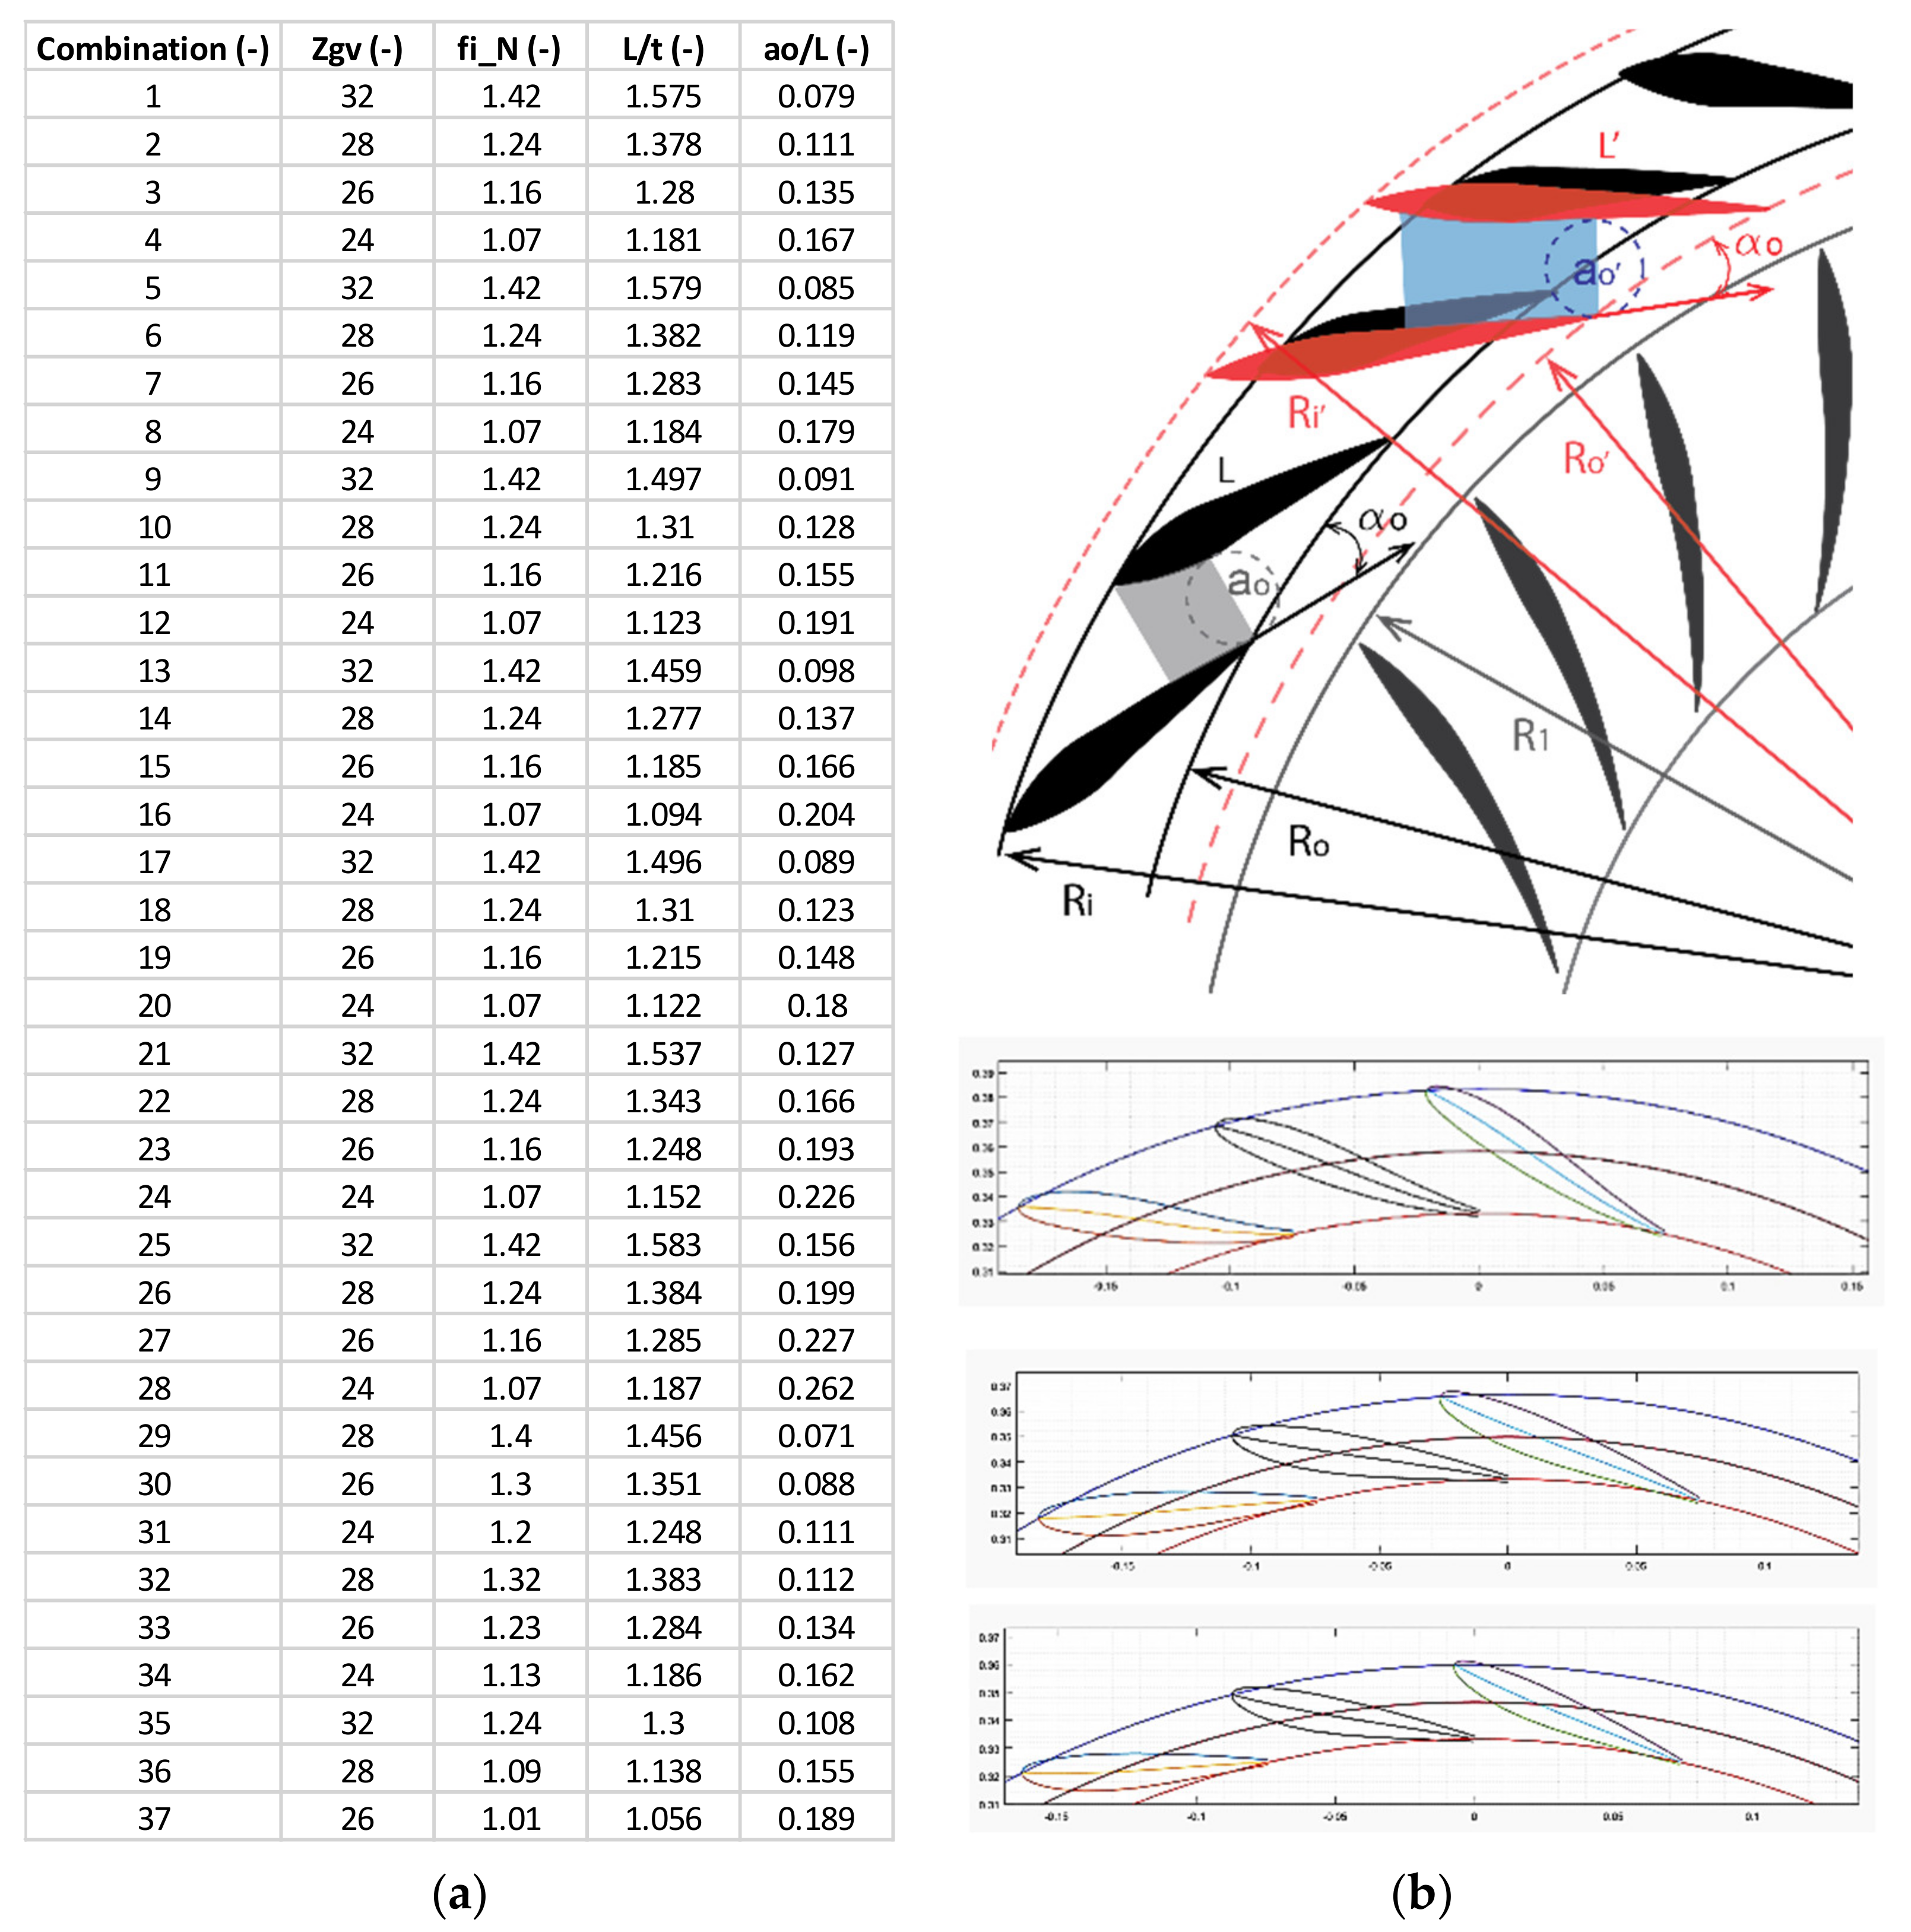
According to the turbine inputs, several guide vane configurations were developed within the available space of the examined turbine. Changes were made in the guide vane geometries by analyzing the relative position of the guide vane outlet diameter from the runner
Cro, their inlet diameter relative to the outlet diameter
Cri, blade chord wrap angle
φ, and number of blades
Zgv. The hydrofoil profile thickness distribution function was fixed, but the overall shape changes as the camber-line changes, with the chord wrap angle
φ and
Cri. The thickness to length ratio is also kept constant. The following configurations are presented in
Figure 4.
It is evident from
Figure 4b that a change of the inlet/outlet radii leads to a change of the chord wrap angle of the blades, which causes the change of the blade length. That results in an increased or decreased opening between the blades, and it also influences their overlap, affecting the cascade density. All the configurations are developed for shock-free inflow conditions of the cascade, and the trailing edge bending angles are developed for shock-free flow entrance into the runner (
), for the given turbine inputs.
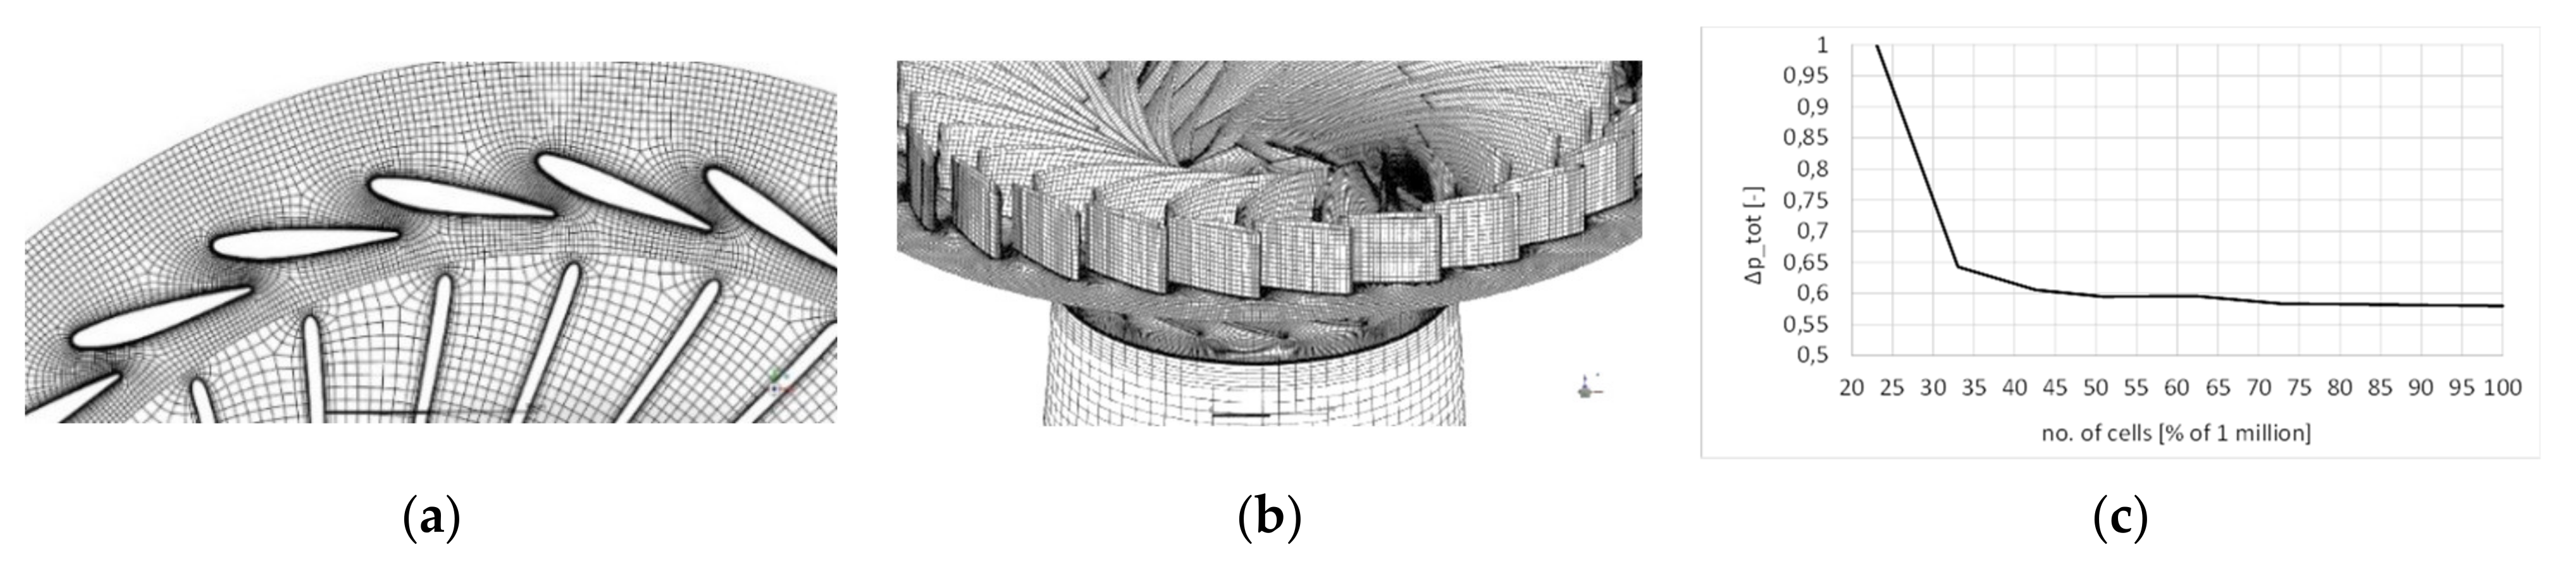
The configuration geometries were developed in MATLAB and transferred to ANSYS Workbench, where the flow domains were created. The mesh was built in ANSYS TurboGrid and assembled with a previously meshed runner of the Francis-99 turbine. The simulations were guided in ANSYS Fluent. The numerical model is simplified to the guide vanes, the runner, and the draft tube cone. The numerical mesh consists of ca. 1.5 million cells, where the runner and the draft tube cone consist of 810 k and 150 k cells, respectively. A zone mesh independence test for the guide vane domain was carried out, observing the total pressure drop through the cascade, for obtaining low deviations of the total pressure in front of the runner, i.e., the guide vane outlet, where a number of cells from 0.4 to 1 million gave a total pressure deviation of ±2%, so the meshes for the guide vanes were created within the range of 550 k to 650 k cells [–]. Sections of the numerical mesh and the zone mesh independence test are shown in
Figure 5.
In order to obtain the value of the turbine design head, the boundary conditions of the model are inlet and outlet total pressures, where a fixed flow direction is imposed at the inlet. Realizable k-ε is used as turbulence model, using standard wall functions. The y+ distance for the guide vane blades changes throughout the blades’ height, having a growth rate of 1.2. For around 83.3% of the blades’ height, the mesh has a y+ range from 3.5 to 30, giving an average value of ~16, so a larger portion of the blade is covered where the flow phenomena are predominant. The other 16.7%, which is near the ends of the blade (the top and low point near the hub and shroud), has a value of y+>30.
The runner of the Francis-99 turbine consists of 15 full blades and 15 splitter blades, which are assumed as “moving walls”, along with the runner hub and shroud surfaces, with no slip conditions. The runner domain frame is given motion around the z-axis as a “frozen rotor”. The guide vane models consist of 24 to 32 blades. The frames are connected to each other via moving reference frame interfaces. The simulations were guided as steady state.
4. CFD Results
As mentioned, the guide vane configurations are developed according to the turbine design point, i.e., the best efficiency point. Other operating points of the turbine are not observed in this analysis because the main goal is to determine the influence of some geometrical parameters towards the design point. The turbine efficiency are calculated according to the IEC 60193 [
16] standard, by defining the total pressure differences at the guide vane inlet and the draft tube cone outlet. The variations of the head between the analyzed cases are in the range of ±3% of the design net head given in
Table 1, so they are taken without any correction. The turbine efficiency is calculated as:
where
Pm is the mechanical power of the turbine runner developed, calculated as the product of the numerically obtained runner torque
Tnum and the angular velocity
ω, divided by the hydraulic available power
Ph in the system, which is product of the numerically obtained head
Hnum and flow rate
Qnum. The combination which results in the highest absolute value for the efficiency from the CFD analysis is normalized as
η = 1 [–], and all other efficiencies are compared to this value in relative terms. The influences of particular geometrical constraints are represented by 2D contour plots, where the variable geometry parameters are set on the
x and
y axis, and the turbine efficiency is presented on the vertical
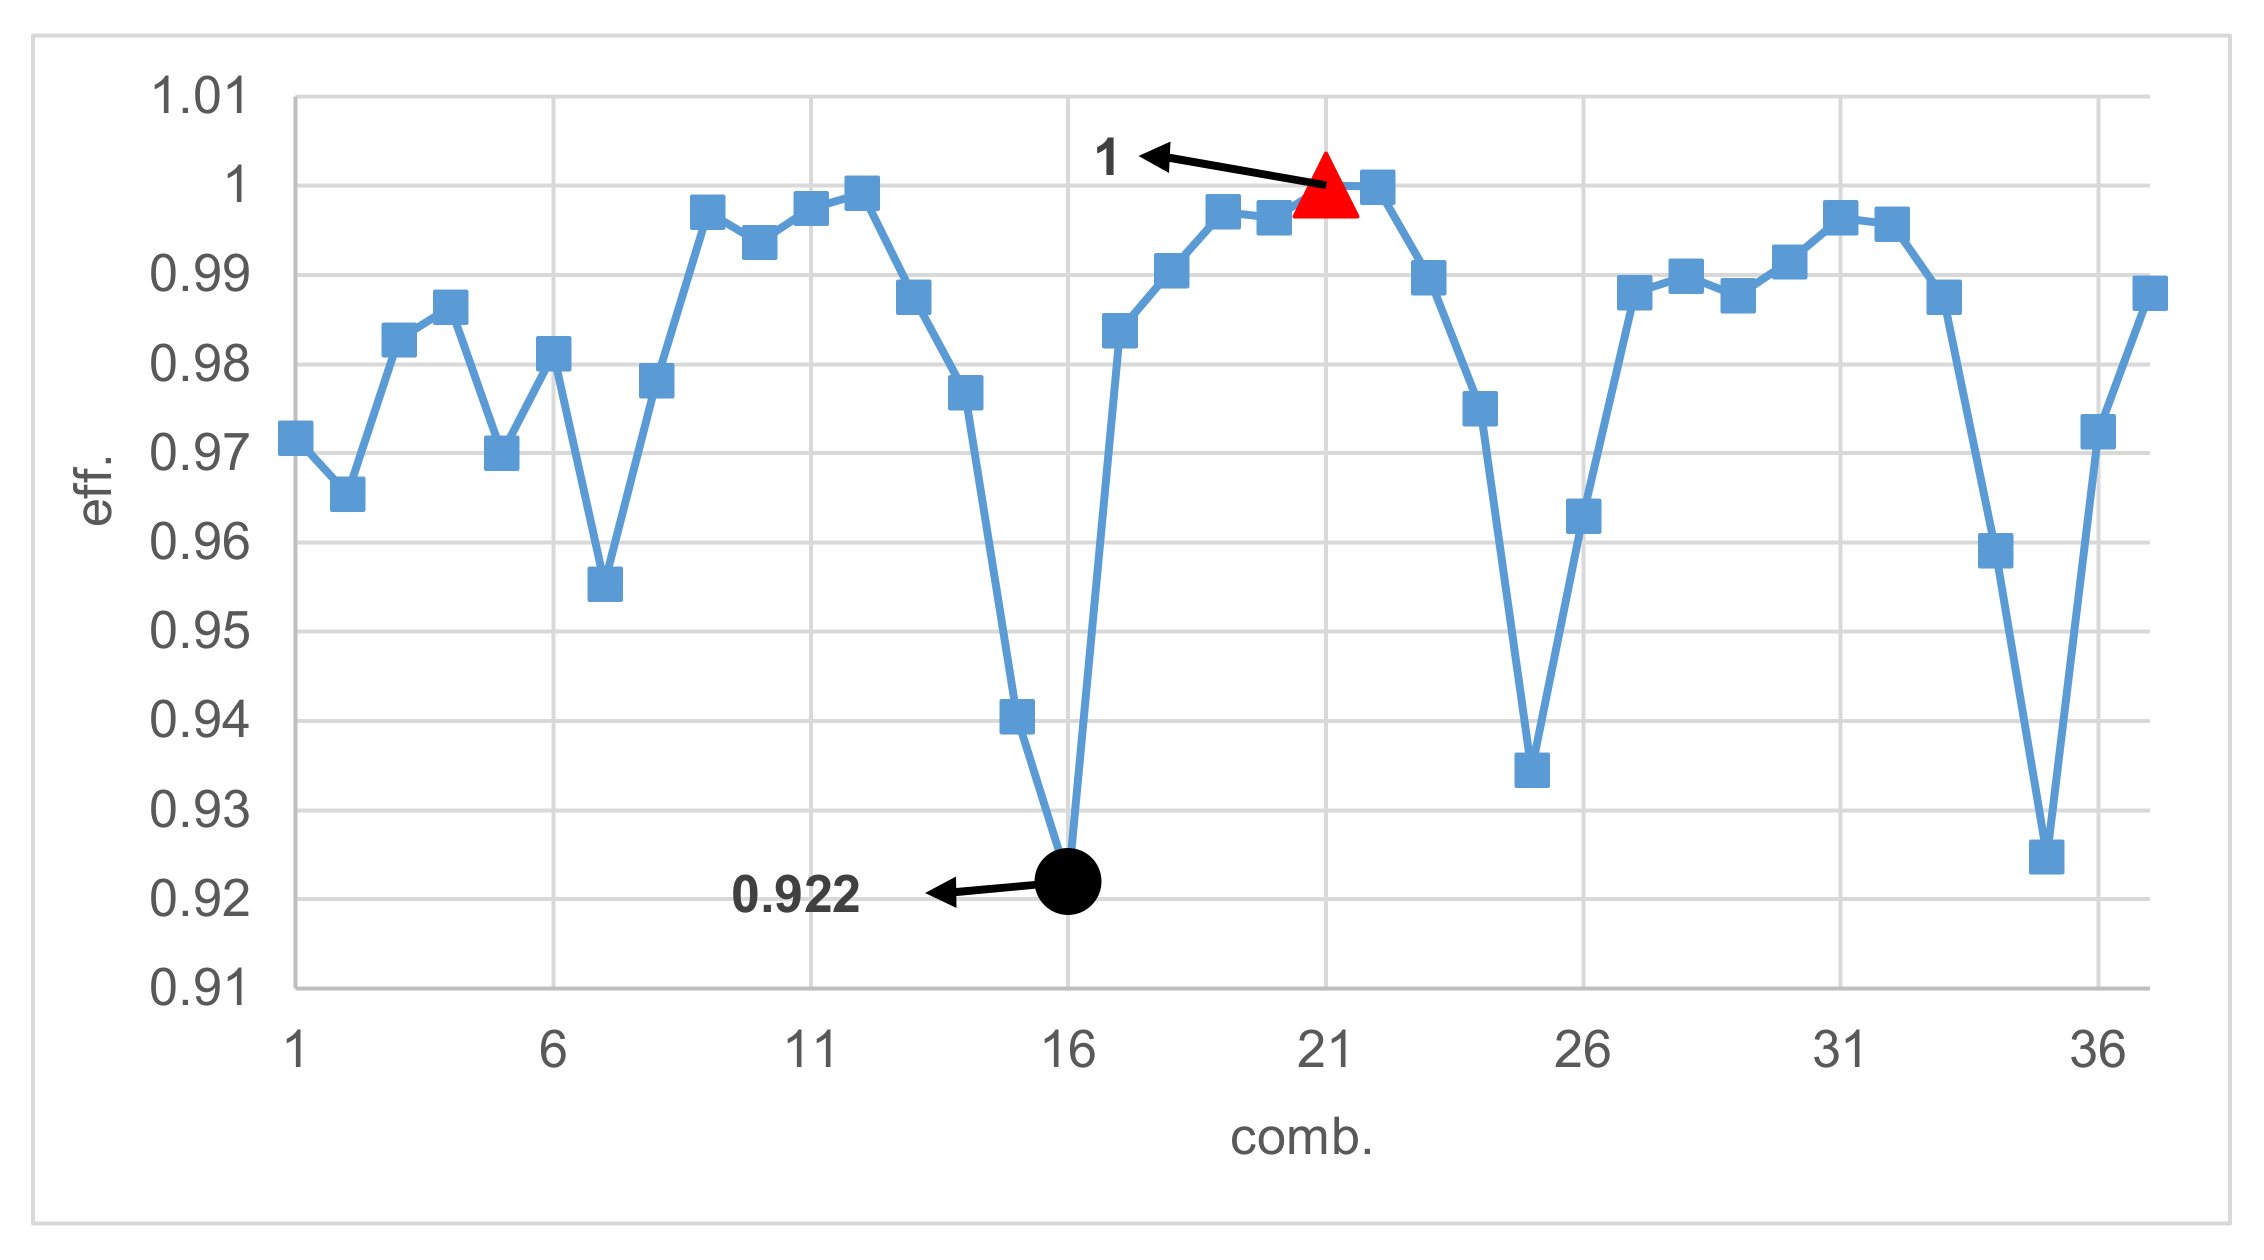
z axis, to observe how certain changes of geometrical constraints influence the turbine efficiency. Primarily, a chart of all the combinations is plotted in
Figure 6 against relative turbine efficiency to further determine which zones of interest shall be implemented in an optimization algorithm.
Despite the applied theory for designing the guide vanes for all the configurations, some configurations show higher efficiencies and some of them show lower efficiencies. In this analyzed case, the lowest efficiency is obtained for combination 16 and the best for combination 21, both shown in the results of this analysis.
For a given constant number of guide vanes
Zgv, the 2D charts presented in
Figure 7,
Figure 8,
Figure 9 and
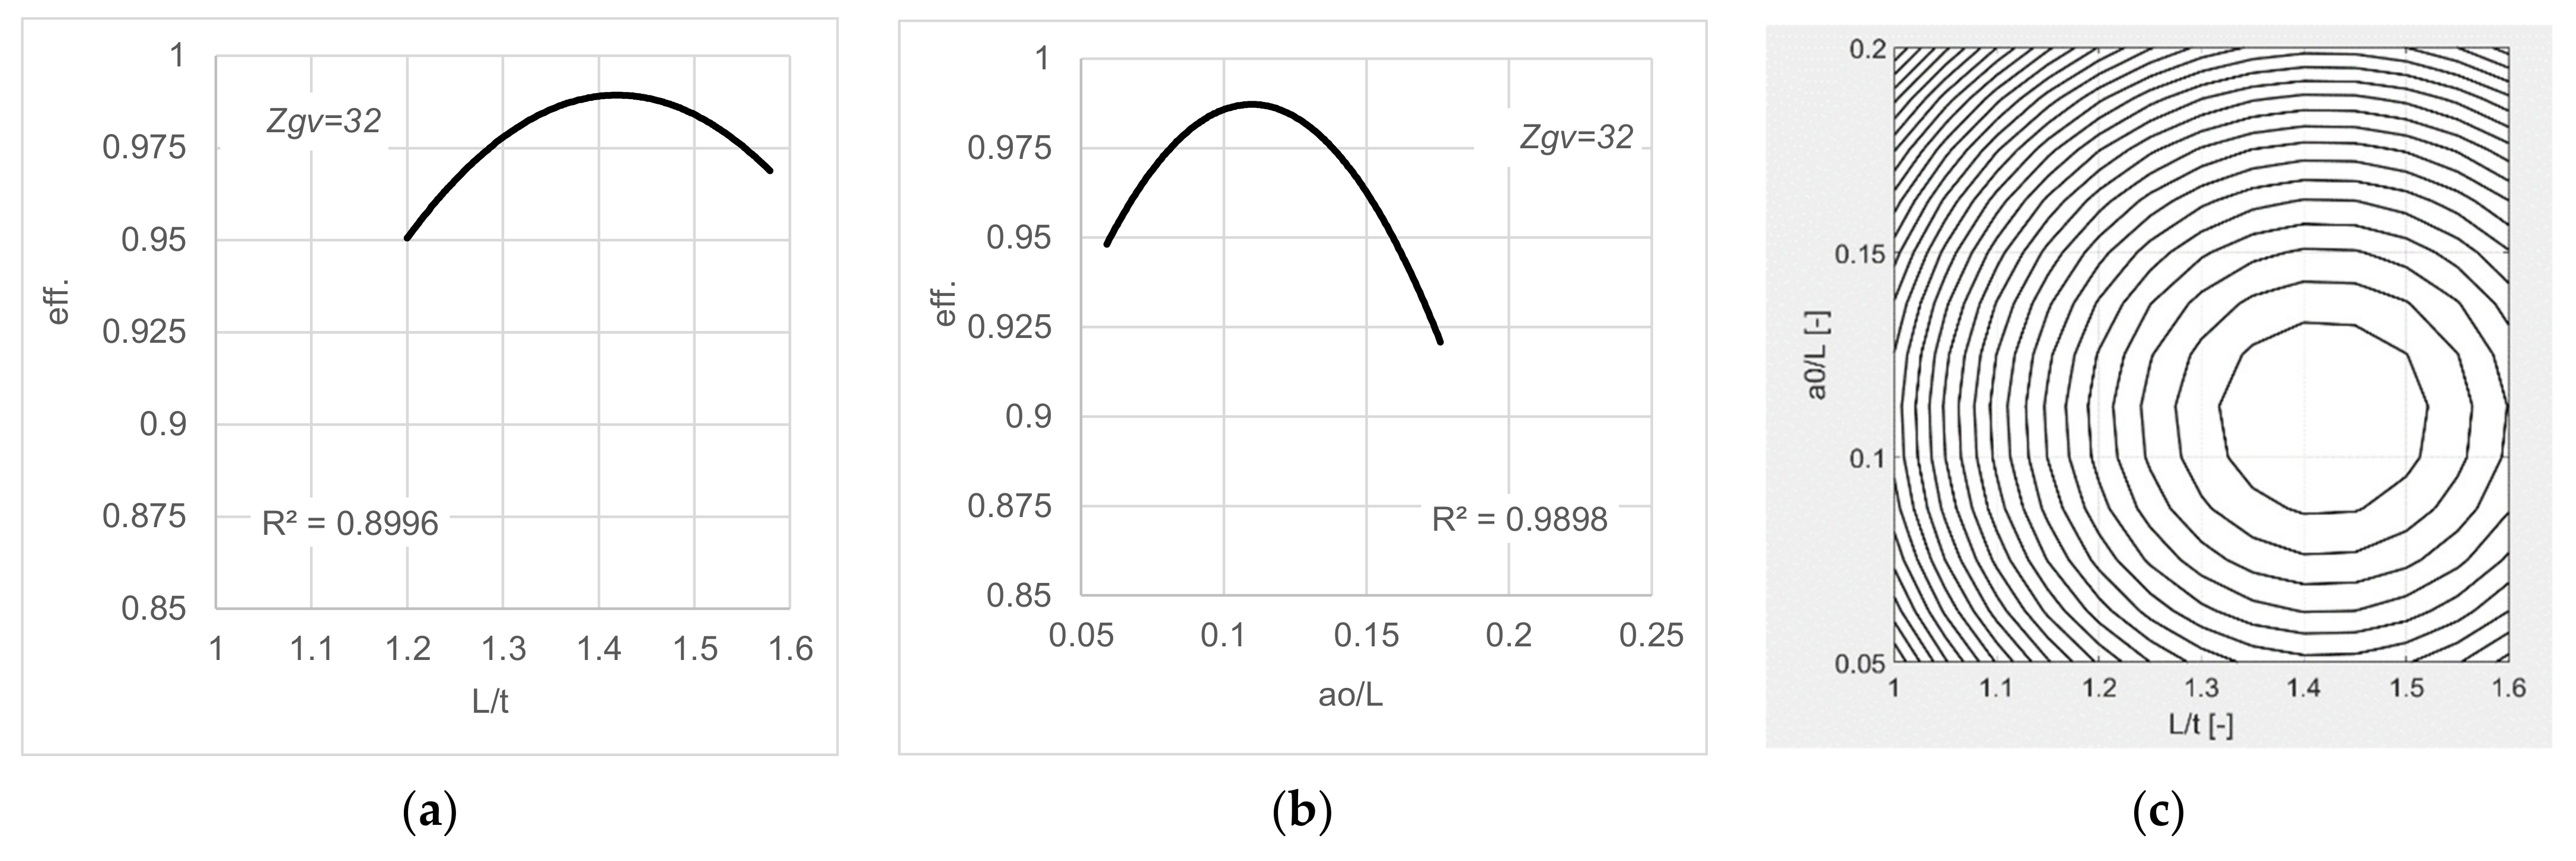
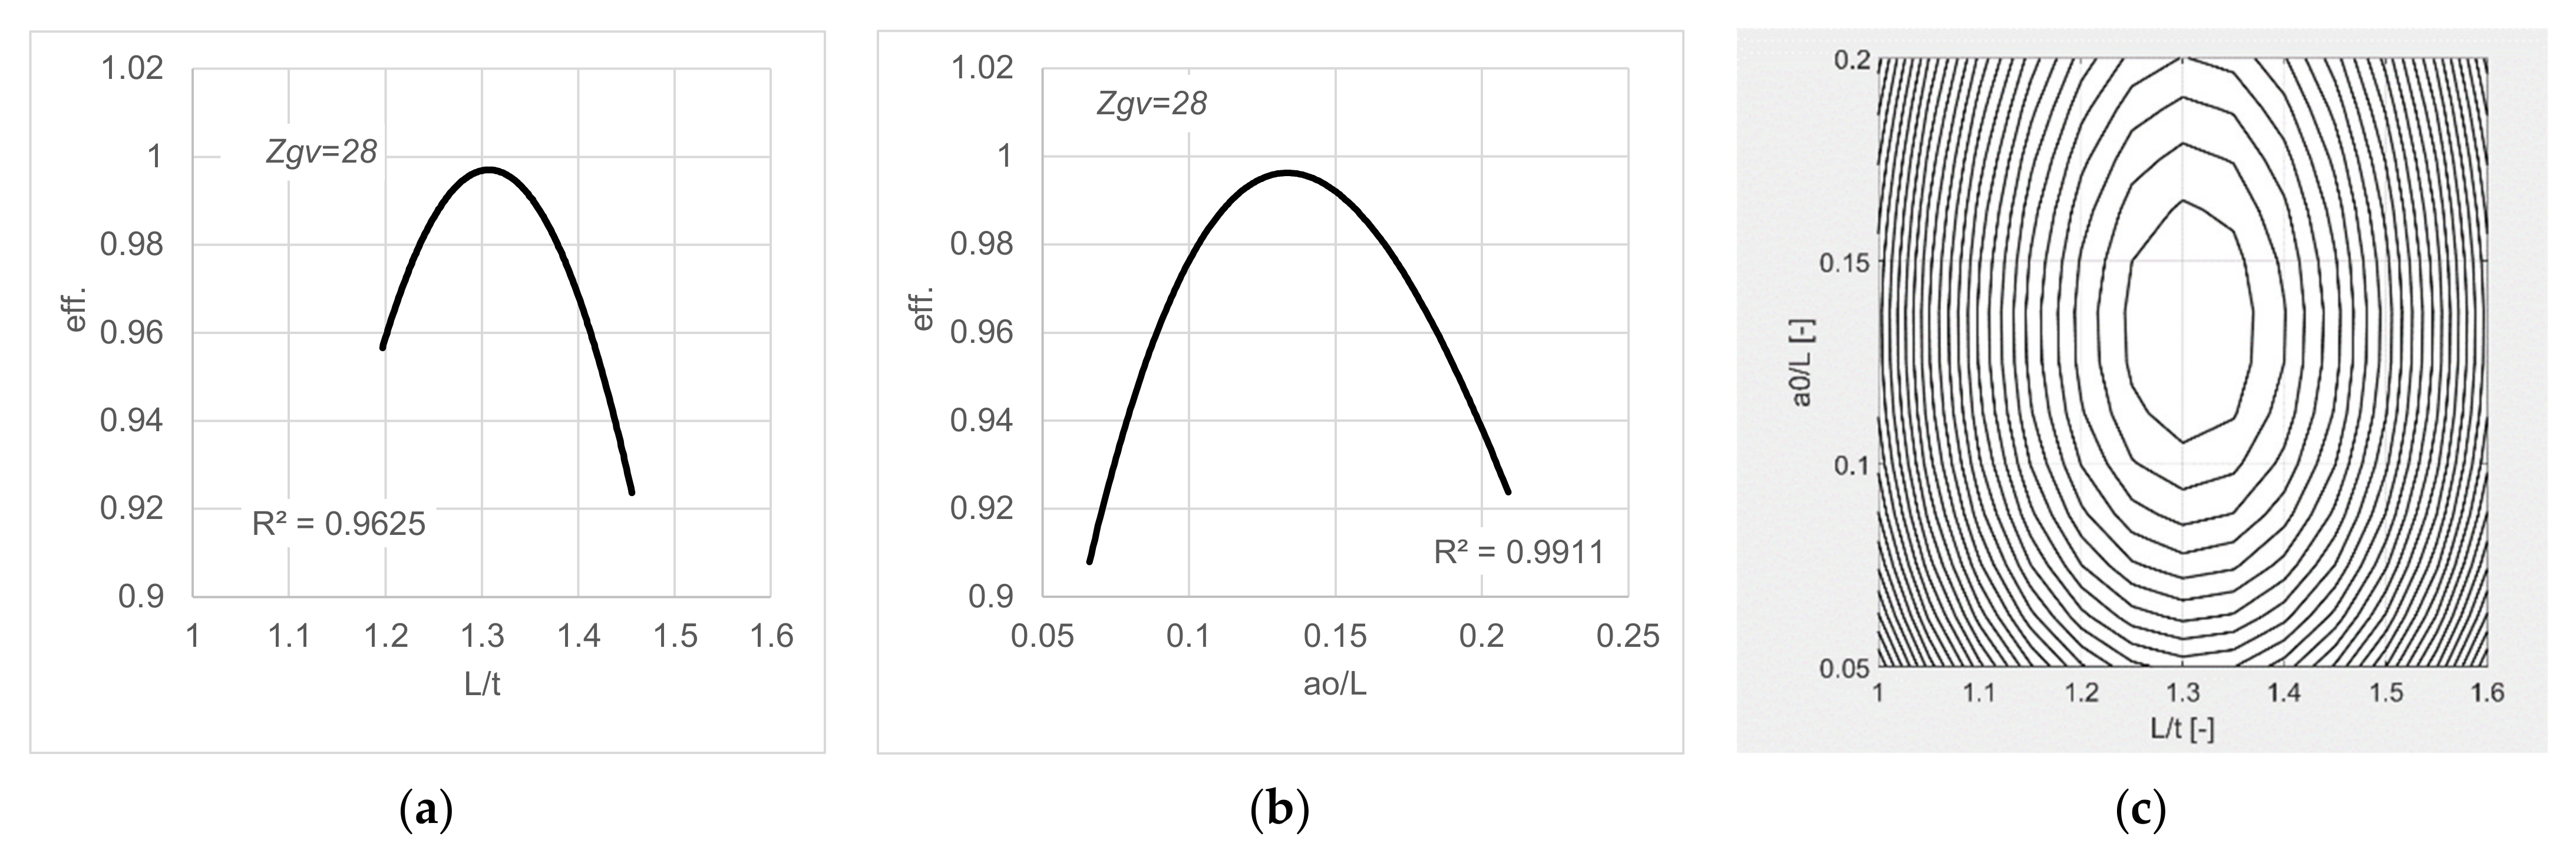
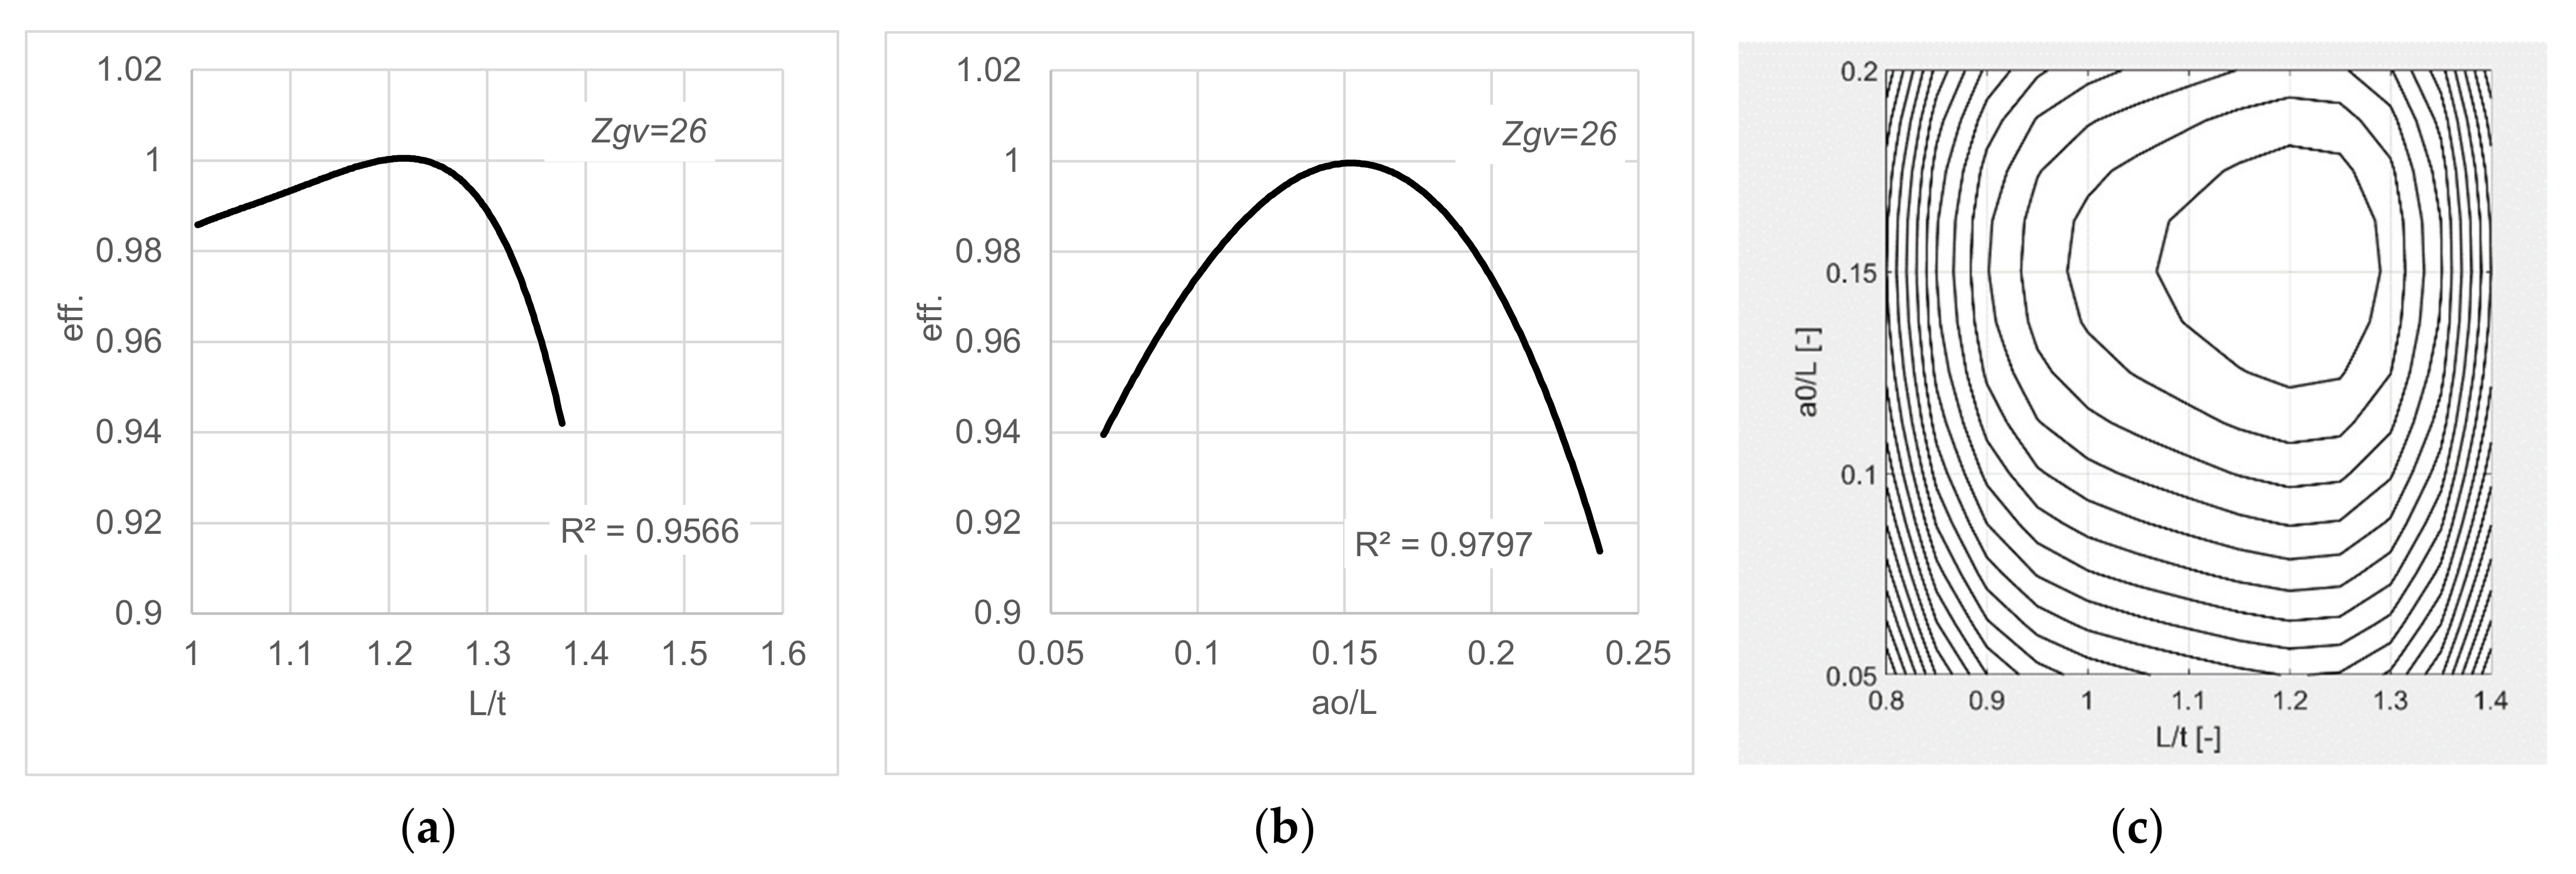
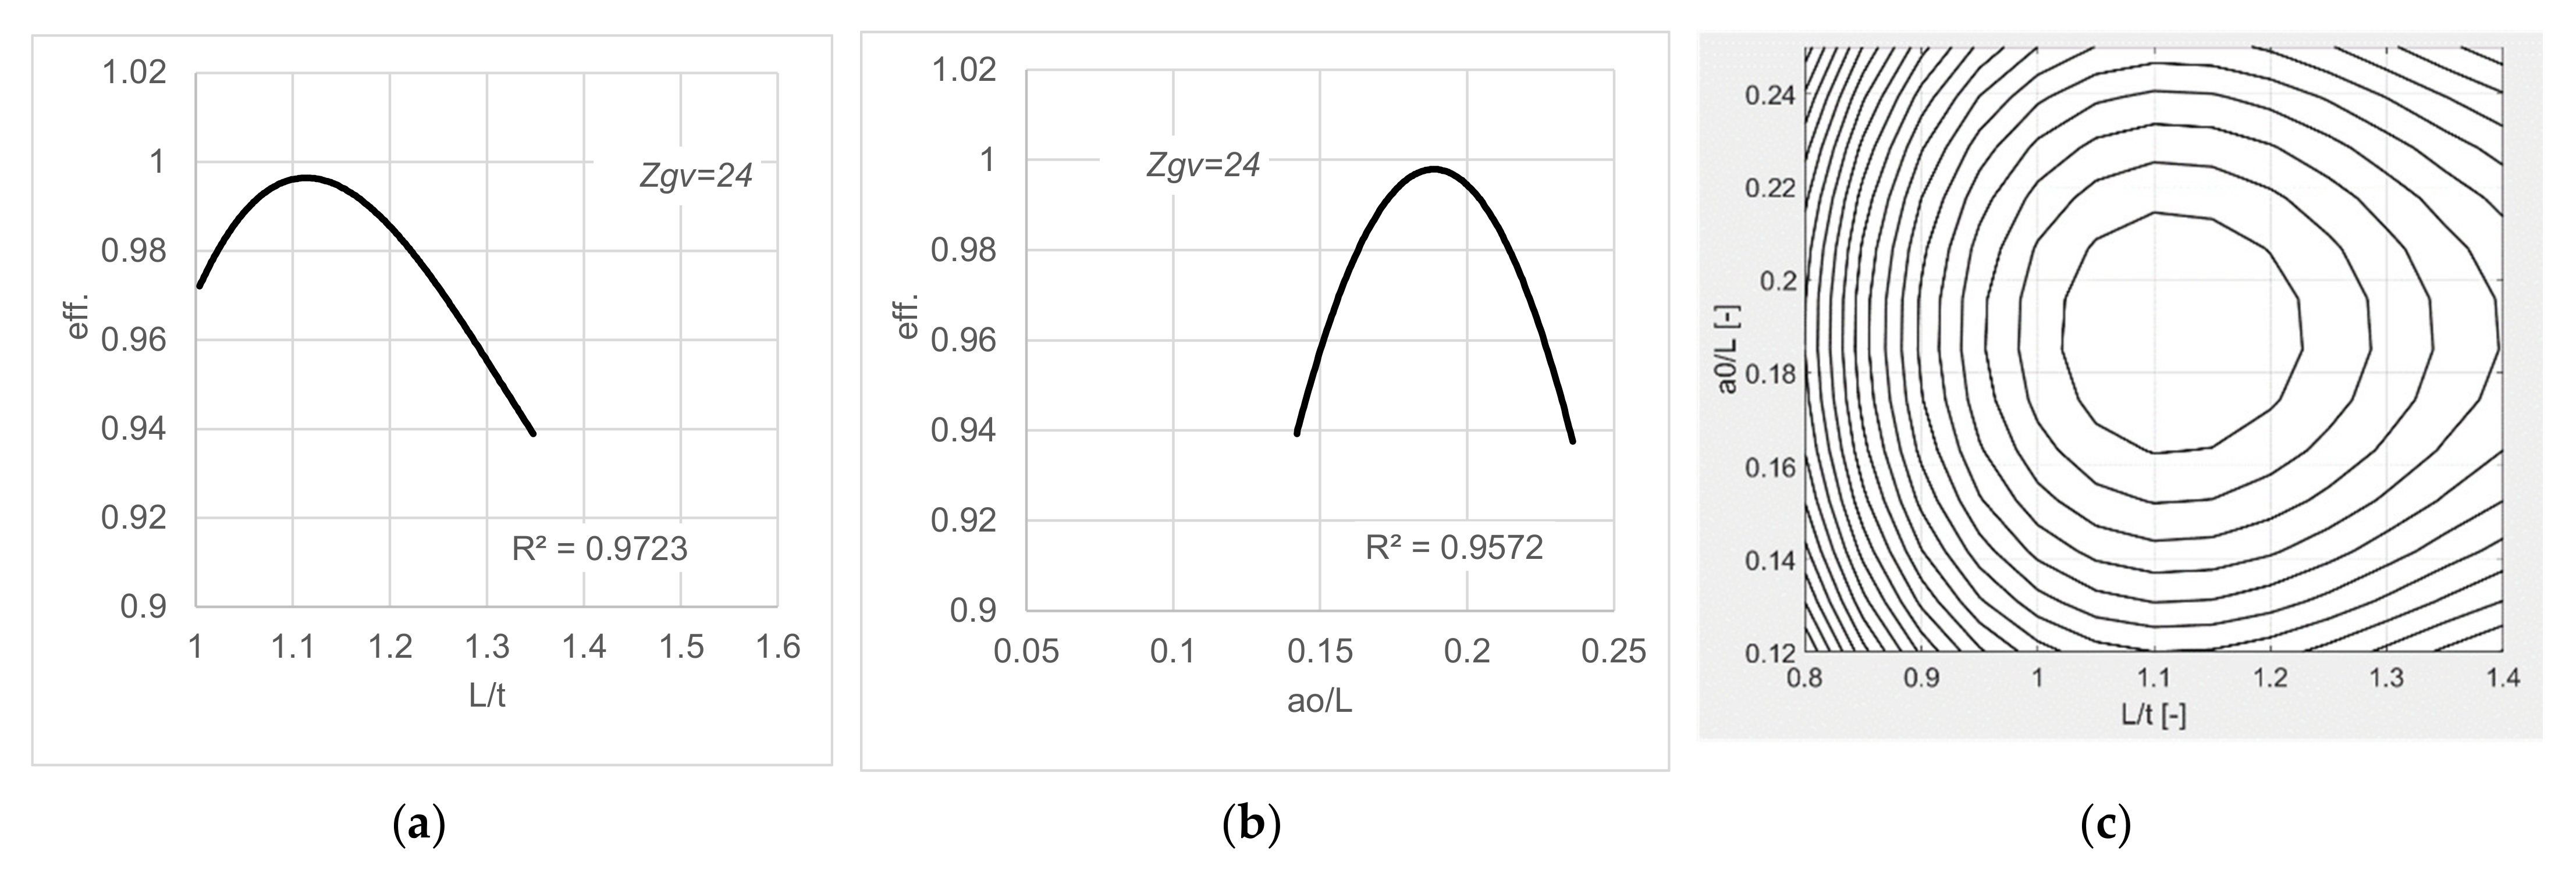
Figure 10 are obtained, from which it can be seen that a peak of the curve is formed, showing the potential optimization zone when the cascade consists of that number of blades.
It can be noted from
Figure 7,
Figure 8,
Figure 9 and
Figure 10 that for a certain number of blades in the cascade, the analyzed density and the opening between the blades change. These geometrical parameters are results of the given cascade configuration. For cascades consisting of 32 blades, the zone of optimal operation lies between densities of 1.35–1.55 and a relative opening to length ratio from 0.075–0.125. For cascades consisting of 28 blades, the zone of optimal operation shifts and, regarding the density, skews in the range of 1.2–1.4 and the relative opening to length ratio ranges from 0.1–0.17. For cascades consisting of 26 blades, the zone shifts towards larger opening to length ratios from 0.125–0.175 and towards smaller cascade densities, in the range of 1.05–1.35. For cascades consisting of 24 blades, the zone shifts as in the previous case in the range of densities from 1.05–1.25 and opening to length ratios from 0.17–0.21.
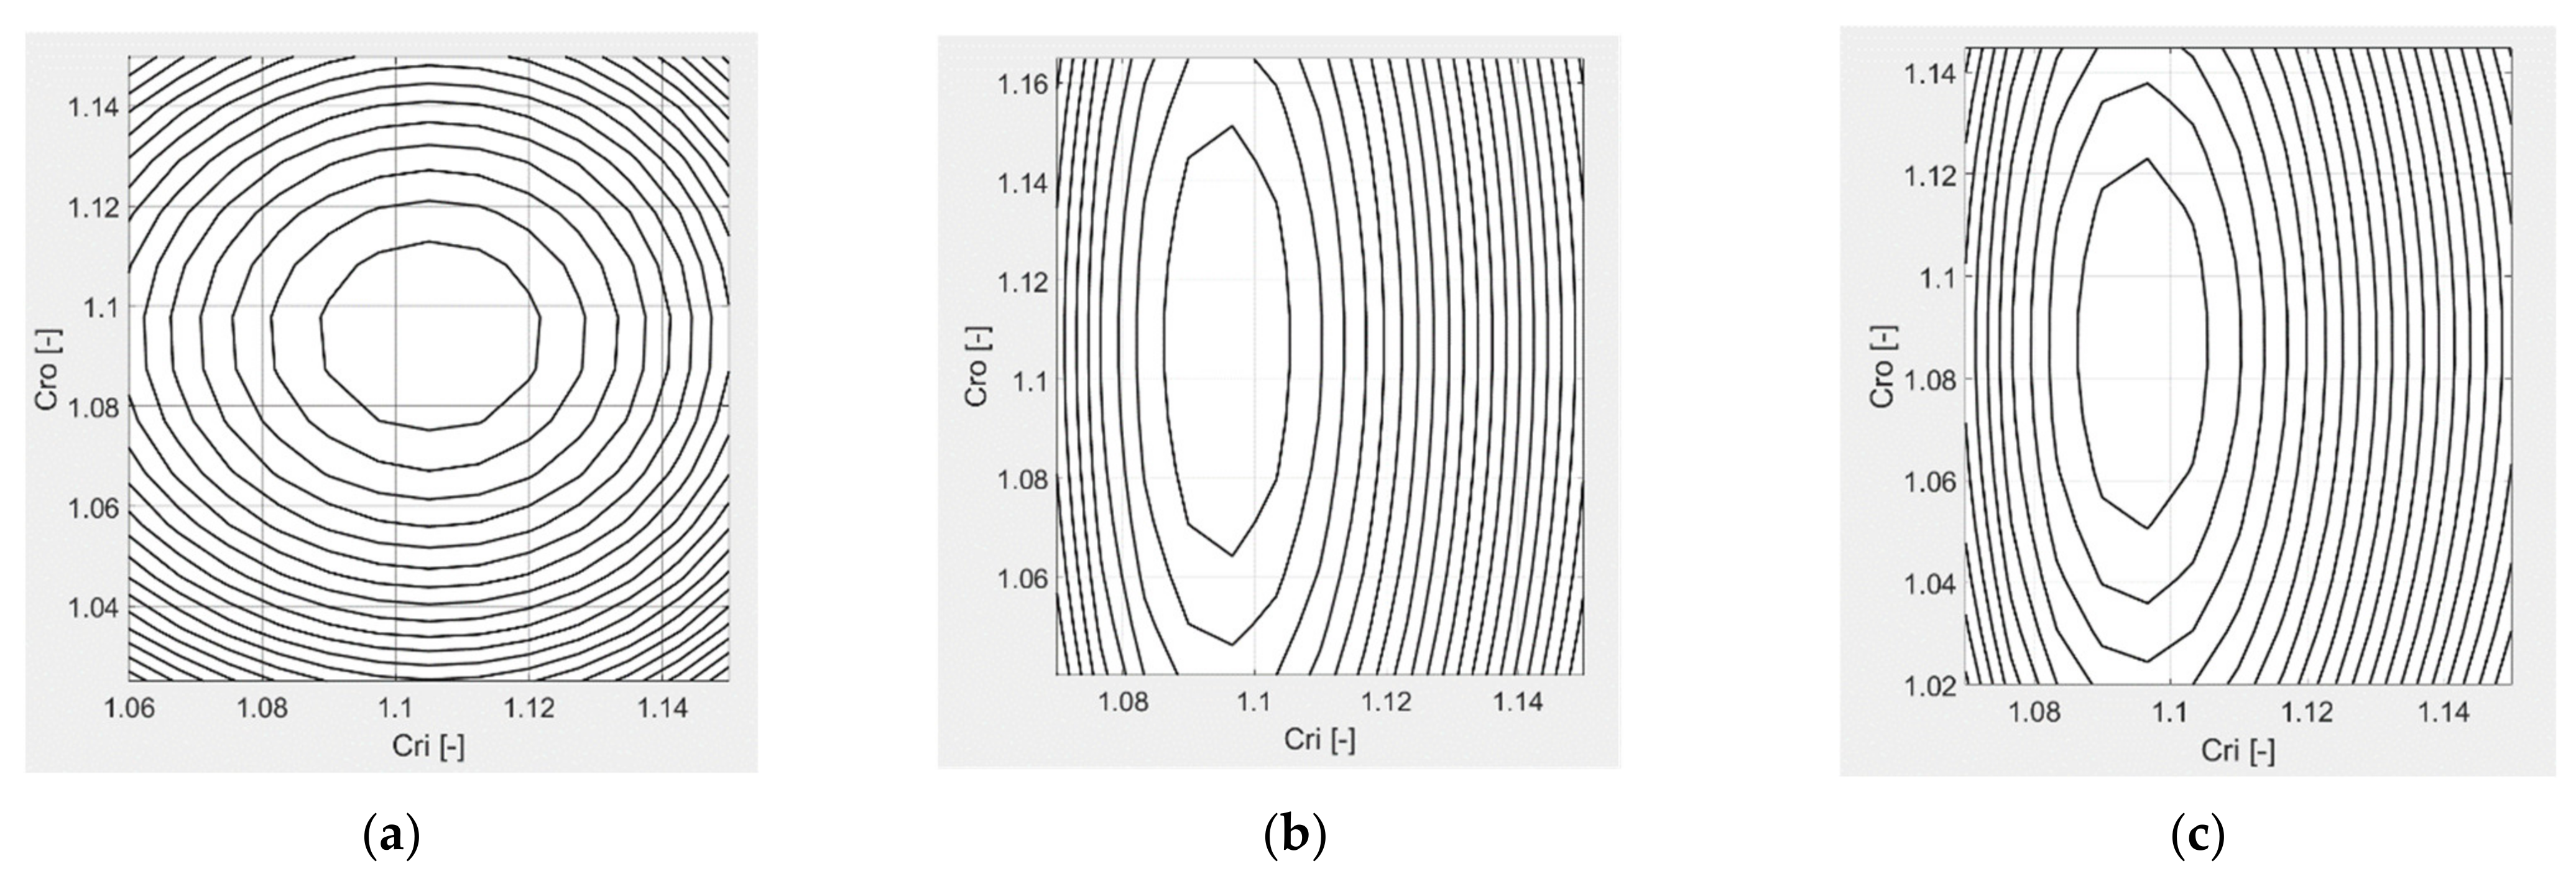
These charts represent the geometrical constraints which are related to the future development of the guide vanes for high-head Francis turbines, which need to be taken into account. Additionally, a comparison between the ratios of the guide vanes’ outlet diameter and inlet diameter is shown in the charts in
Figure 11.
From the charts in
Figure 11, it can be concluded that as the number of the blades decreases, the optimal zone of guide vane diameter ratios expands. The outlet diameter of the guide vanes, which is related to the runner inlet diameter, has the greatest influence. The guide vane inlet diameter, related to the outlet diameter, changes slightly in the range of 1.09–1.12 for all cases.
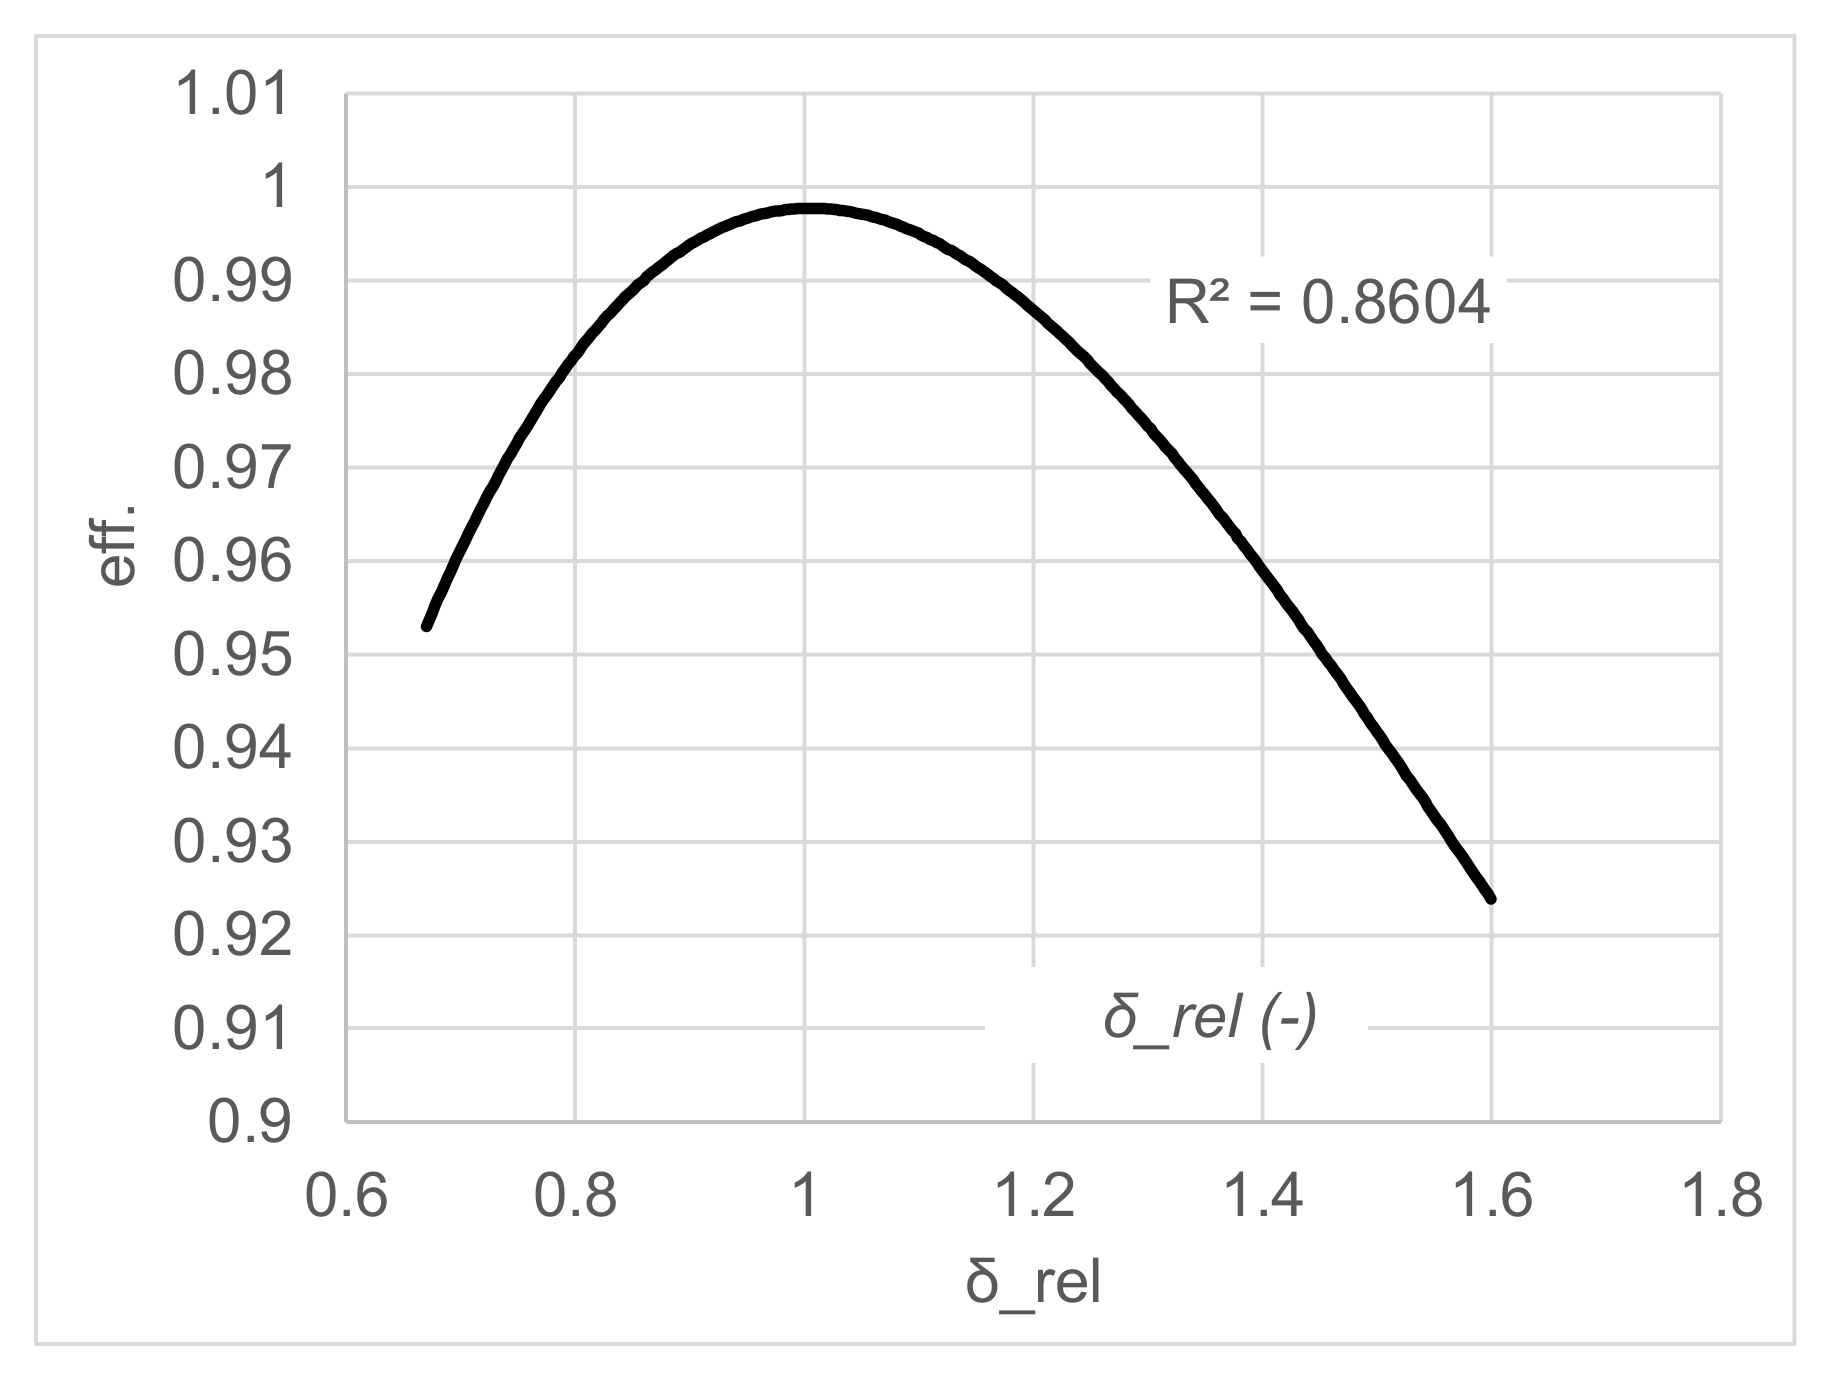
An interesting behavior of the chord angle enclosed with the outlet diameter is noticed. Taking into account the outflow angle of the cascade, shown in
Figure 1 and
Figure 3 as
αo and calculated in accordance with the Euler turbine equation, the relation can be presented as:
The chart in
Figure 12 shows that if this angle varies around the calculated outflow angle, we exit from the optimal operation zone of the turbine. The fitting curve tends towards the calculated cascade outflow angle. This is crucial for further development of the guide vanes and the wrap angle of the blades related to the outflow angle of the cascade, to obtain a cascade which performs well in the design zone.
The current obtained ranges will be further implemented in an optimization algorithm, using the ANSYS Design Explorer, to test the design configurations in these limited ranges and to maximize turbine efficiency.
In
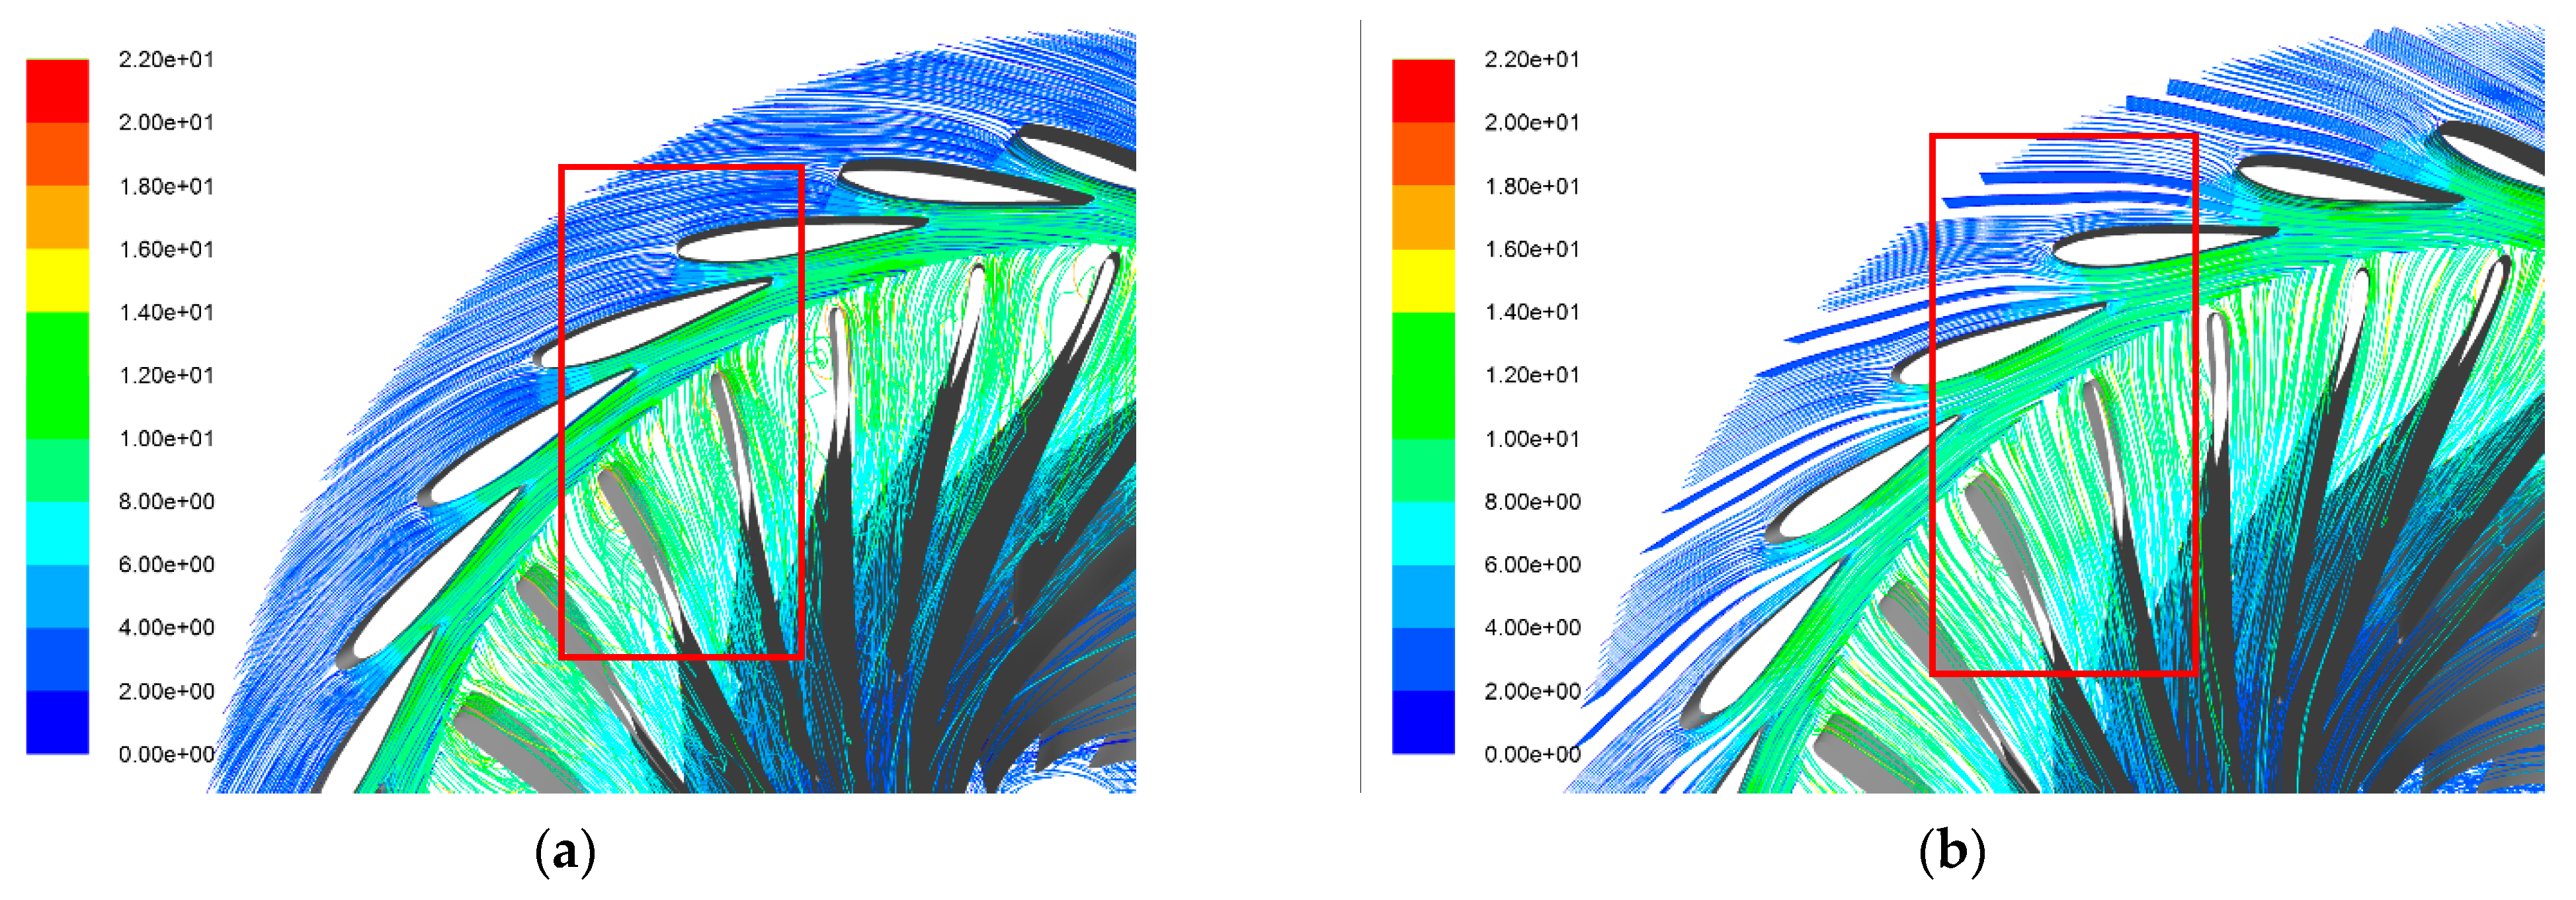
Figure 13, a comparison between combinations 16 and 21 is made, as these two combinations showed the lowest and the highest efficiencies, shown in
Figure 6. The geometrical and flow differences between them are shown throughout CFD post-processed images. The configurations were generated according to equal theory and initial turbine data. Their main differences are the inlet/outlet radius ratio, the number of guide vanes, and the chord wrap angle, which lead to different cascade densities and different opening spaces between the blades. The blades trailing edge angles in all the cases are constant and derived from the calculations in the MATLAB code, with an expected result of different magnitudes of the slip effects between the configurations. The blades’ thickness to length ratio for all cases is constant, maintained at 16% of the blades’ length, no matter how long the blades are.
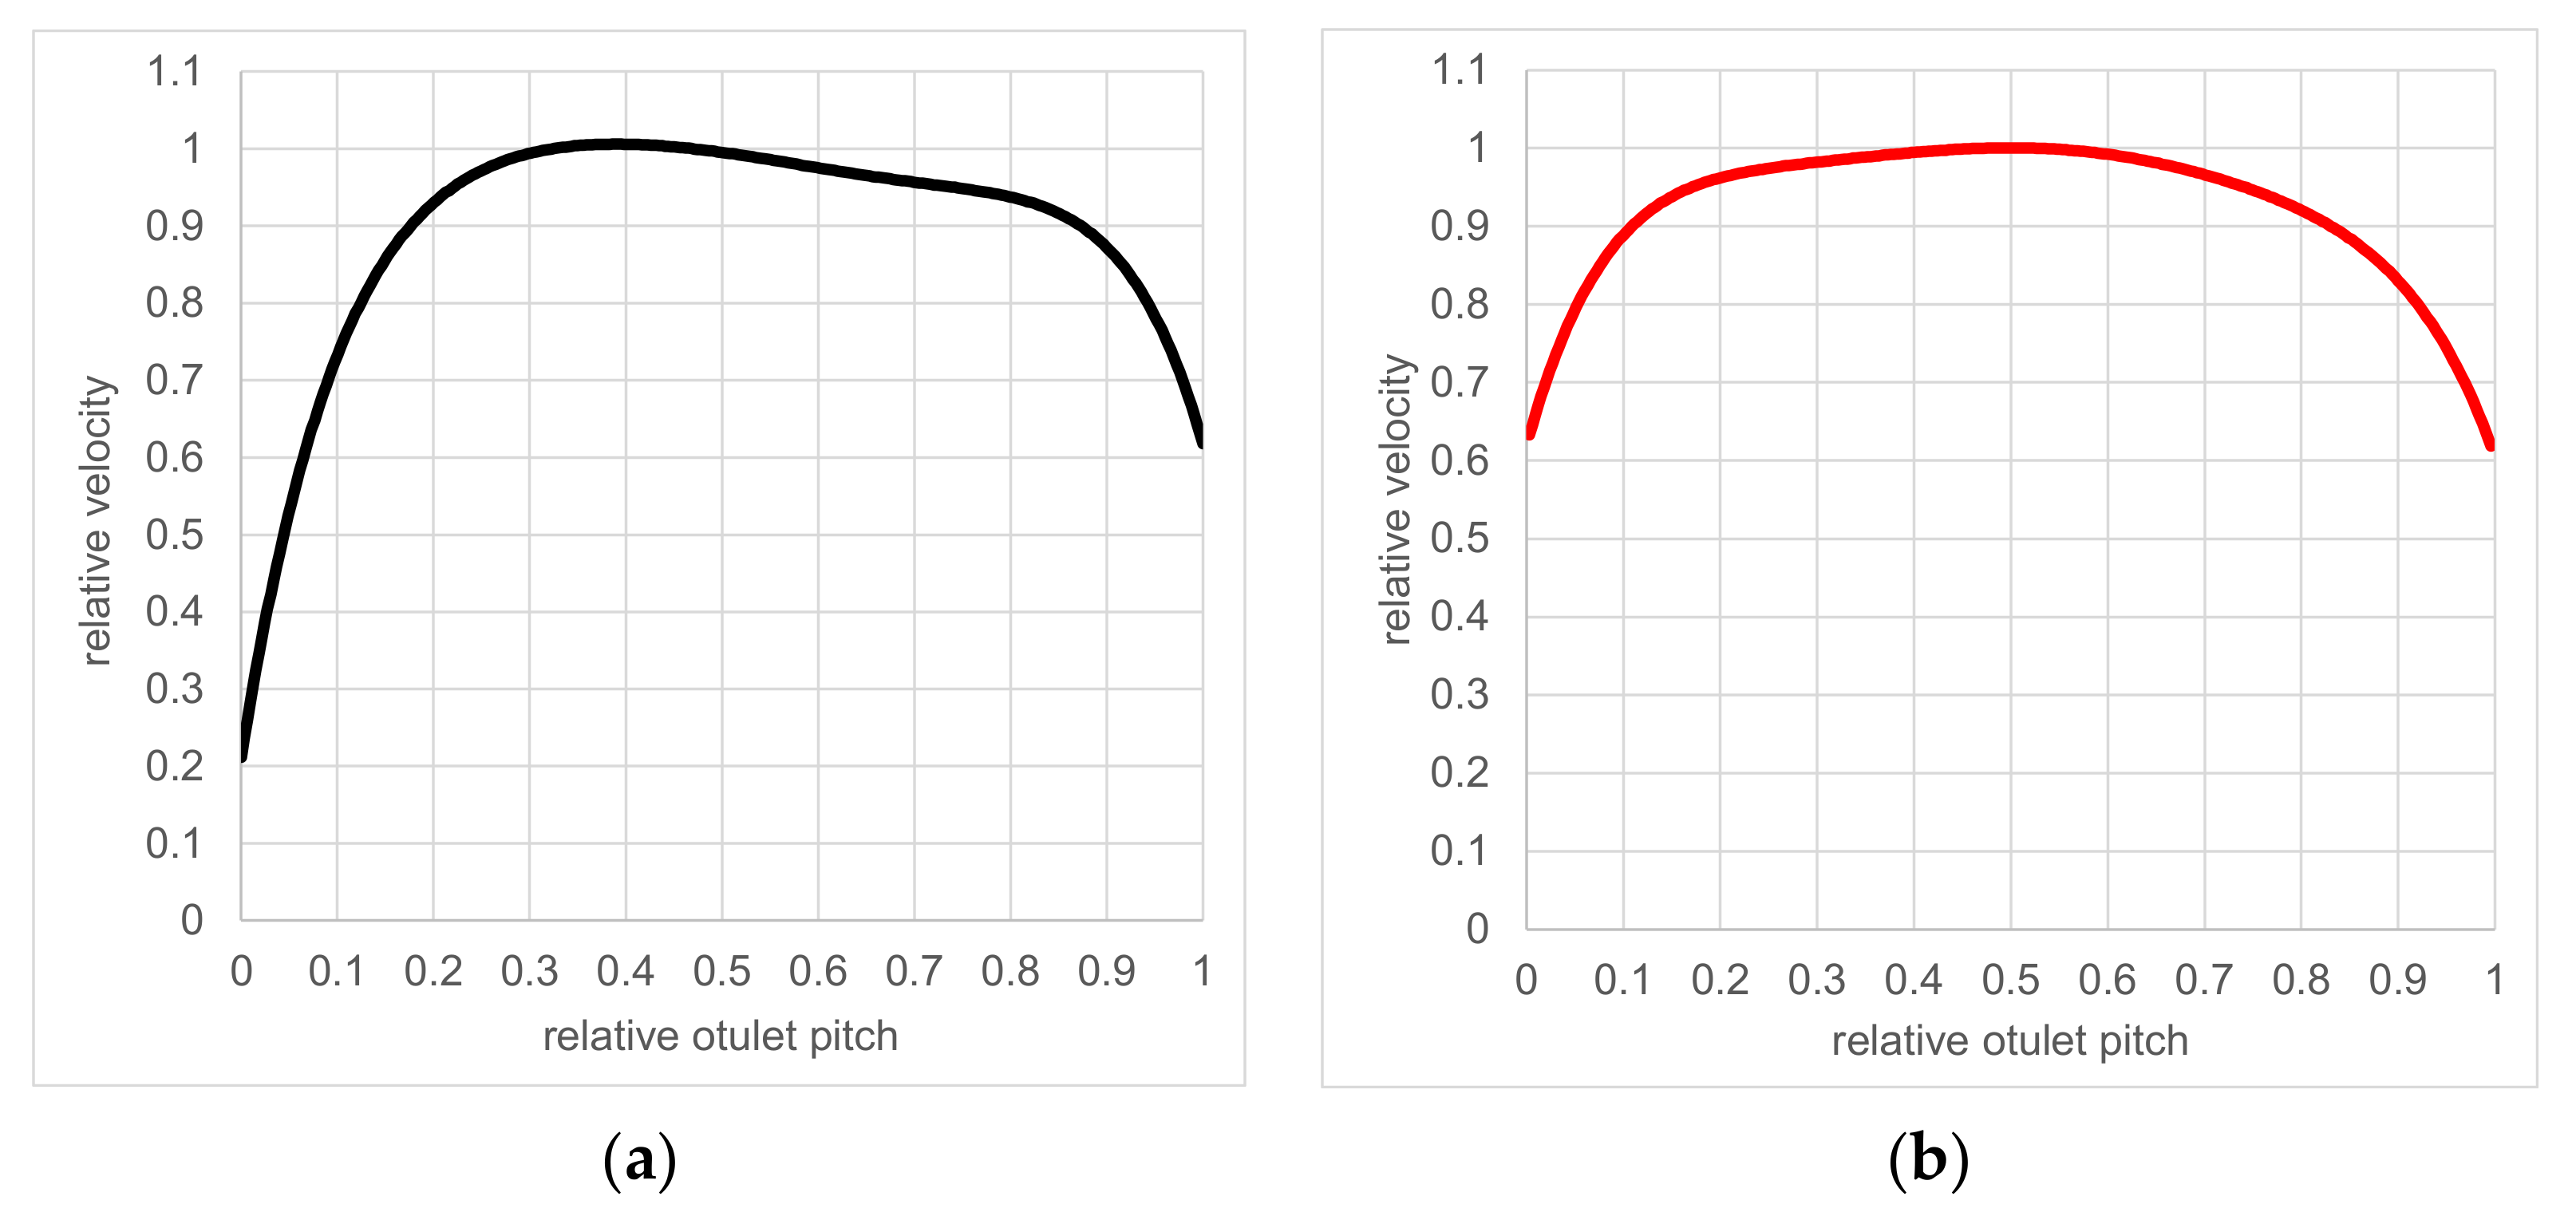
From the velocity streamlines, it can be seen that combination 16 does not perform efficient filling of the runner blade inner channel, creating flow separations in the runner, compared to combination 21. For these two cases, a comparison between their velocity profiles was made. The velocity distribution was observed [
17] at the guide vanes’ outlet radius, between two blades. It can be seen in
Figure 14b that the velocity profile of combination 21 is more symmetrical and uniform compared to combination 16 (
Figure 14a), plotted against the guide vane relative outlet pitch
to.
5. Conclusions
In this paper, an approach for further optimization of the guide vane design for high-head Francis turbines has been presented, by developing several geometries within a design space pre-described by the Francis-99 turbine model from the Waterpower Laboratory at NTNU. First, a MATLAB calculation tool for generating guide vane configurations suitable for Francis turbines was developed; the tool creates plausible cascade geometries according to turbine input data. The free geometry parameters for the final choice of the desired cascade are described and changed in a range which the design space dictates.
Several cascade geometries were developed and tested through CFD simulations for the turbine model in order to obtain the crucial geometrical parameters and their influence on the turbine efficiency, as a way of determining their limits of change which need to be implemented in an automated algorithm for further optimization. In order to obtain the relative values for the system efficiency, the CFD model was simplified and consisted of guide vanes, a runner, and a draft tube cone. All the geometries were developed according to the adopted turbine design point, which is the highest efficiency point, and the analysis was carried out to see how the guide vane configurations deviate from the efficiency around this point.
The results were obtained with curve fitting and surface fitting between two variable parameters and the turbine efficiency, while the third variable parameter was left uncontrolled. This showed how certain geometrical relations, such as inlet/outlet radius, cascade density, guide vanes’ opening clearance, chord line wrap angle, etc., within their tight range, influence the turbine efficiency and design flow rate. According to the results, limits for the mentioned geometrical constraints were interpreted for their further development. One of the main conclusions which can be derived from this analysis is the chord leaning angle towards the guide vanes’ outlet diameter, which has to be collinear with the cascade outflow angle. This conclusion for the chord leaning angle will be implemented, along with the blade thickness distribution law and the maximal blade thickness location, which were fixed geometrical constraints in this analysis, and they will be separately tested within the further developed optimization.
This approach offers a better understanding for the basic cascade geometrical relations and their influence, especially for high-head Francis turbines, whereas for low-head machines, it is expected that the region of the limits will change, as these machines are inclined towards greater guide vanes’ opening angles. Additionally, two optimization objectives can be derived from this analysis, which can be further implemented—one is to maximize the turbine efficiency and the other is to maximize velocity profile uniformity. The second objective comes from the velocity profile comparison, where combination 21 obtained in this analysis shows a more uniform velocity profile towards the turbine runner. Further, an index of asymmetry can be introduced for the relative shape of the velocity profile [
18] of the guide vanes, in a relation with some geometrical parameters, in order to obtain hydraulic/geometry parametrization for further optimization.
It is important to note that some other objectives, such as the static pressure losses or the energy losses through the cascade, turned out to be unnecessary as they can lead to misguidance towards the estimation of optimal turbine operation; however, they are crucial in cases when the guide vane cascade is developed separately from the turbine.


 ,
, 


