Article

Experimental Study on Reservoir Physical Properties and Formation Blockage Risk in Geothermal Water Reinjection in Xining Basin: Taking Well DR2018 as an Example

1
Qinghai Bureau of Environmental Geology Exploration, Xining 810001, China
2
Key Laboratory of Environmental Geology of Qinghai Province, Xining 810001, China
3
Qinghai 906 Engineering Survey and Design Institute, Xining 810001, China
4
School of Petroleum Engineering, China University of Petroleum (East China), Qingdao 266580, China
5
Key Laboratory of Unconventional Oil & Gas Development, China University of Petroleum (East China), Ministry of Education, Qingdao 266580, China
*
Authors to whom correspondence should be addressed.
Energies 2021, 14(9), 2671; https://doi.org/10.3390/en14092671
Submission received: 9 March 2021 / Revised: 27 April 2021 / Accepted: 28 April 2021 / Published: 6 May 2021

Abstract

:
The Xining Basin in Qinghai Province, China, is rich in mid–low temperature geothermal resources, but the reinjection of geothermal water has not yet started. In this paper, the physical properties of rocks sampled from the newly drilled geothermal well DR2018 were analyzed, and a series of core flooding experiments was conducted to assess the formation blockage risk during water reinjection. The experimental results show that the geothermal reservoir has a low porosity of 1.64–18.68% and a low permeability of 0.04–7.23 md. The rocks are weakly consolidated, and the movable clay and sand particles account for 0.18–23.42 wt %, which results in a significant rate and salinity sensitivity. Even at low water flow velocity of 0.31–1.64 cm/min, the core permeability will drop by 35–53% after 25-144PV injection. An obvious fluctuation and decline in core permeability can also be observed as the injected water salinity decreases. The blockage risk induced by the invasion of low-content scaling and suspended particles in injected water can be covered up by the migration of movable particles in cores. The particle migration and blockage in the near-wellbore formation will be the main reason to cause the decline in the well’s geothermal reinjection capacity.

Graphical Abstract

1. Introduction

As an important geothermal resource, deep porous geothermal water needs to be reinjected into reservoirs after utilization to avoid environmental pollution and formation deficit. However, geothermal water reinjection often faces a blockage risk in the near-wellbore formation. In some high-risk cases, it may lead to a dramatic decline in the reinjection capacity and even make the wells shut down [1]. The Xining Basin in western China is rich in mid–low temperature geothermal resources, but the reinjection project has not yet started, which greatly limits the efficient development of geothermal energy in the Xining Basin. It is of great significance to carry out research on the blockage risk in the formation during geothermal water reinjection.
At present, there have been many studies on geothermal reinjection blockage around the world. Ochi et al. [2] found that the hydrodynamic effect of particle migration caused by fluid injection into sandstone reservoirs can reduce the permeability by more than 50%. Lun et al. [3] found that the permeability change caused by the blockage of suspended particles can be divided into two processes: the early slow decline and the late rapid decline in permeability, corresponding to the slow particle deposition and fast blockage in pores, respectively. The initial blockage is mainly affected by the relationship between the pore throat and particle size, and the final blockage is affected by the particle concentration. Ma et al. [4] studied the factors affecting geothermal reinjection blockage through laboratory experiments and simulations, and they found that the physical blockage in the target block was the dominant factor. The clay–sand particle migration at 90 °C contributed 57.5% of the total blockage, followed by the chemical blockage and suspended particle blockage. Badalyan et al. [5] proposed a new method for evaluating formation damage, and they concluded that at low salinity, the clay particles detached and blocked in pores, which led to greater damage to the formation than that of particle migration caused by high flow rate. Oliveira et al. [6] conducted the core flooding experiments and found that the flow speed of movable particles was significantly lower than the carrier fluid velocity. Rosenbrand et al. [7] found that when reinjecting hot water into the sandstones containing the clay mineral kaolinite, heating can reduce permeability due to kaolinite mobilization. You et al. [8] proposed the mathematical modeling for suspension flow with slow migration of detached fines and further straining in geothermal reservoirs. Russell et al. [9] analyzed the damage caused by the particle migration of clay minerals to the unconsolidated formation, and adding CaCl2 to the high-salinity reinjection water to increase the content of calcite in reservoirs was proposed to reduce the particle detachment from the mineral surface. You et al. [10] studied particle migration and permeability decline by experiments and mathematical models, and they found that electrostatic interaction played a leading role in particle adsorption, and the difference of adsorption strength caused by the change of flow rate will result in the migration of particles with different sizes. Compared with oil and gas fields, geothermal reinjection systems are more susceptible to particle migration damage. Carpenter [11] studied the particle migration mechanism in a carbonate reservoir with a high content of clay minerals in Malaysia through experiments and found that the critical water rate to cause particle migration was 2 mL/min. Sun [12] studied the sand production mechanism in a geothermal reservoir in Bohai Bay Basin, which has the characteristics of high clay content and weak consolidation. The production of particles would seriously affect the geothermal development of the target block. As for the reinjection model, Niknam et al. [13,14] built the reinjection model for a mixture of water–CO2 in a geothermal power plant and considered the interaction between various phases when reinjecting water. To sum up, both the blockage mechanism and reinjection model have been studied a lot, but less attention has been paid to the migration of movable particles and invasion of scaling and suspended particles in weakly cement reservoirs during reinjecting water [15,16,17,18].
In this paper, taking the geothermal well DR2018 as an example, the blockage risk during geothermal water reinjection in Xining Basin was assessed through laboratory experiments. The properties of geothermal water and reservoir rocks were tested. Core flooding experiments were conducted to assess the blockage risk caused by self-generated clay and sand particles and invasive scaling and suspended particles. The main mechanism and leading factor of geothermal reservoir blockage caused by the high-salinity geothermal water reinjection are analyzed, which will provide a theoretical basis for effectively maintaining the geothermal reinjection capacity in Xining Basin.

2. Analysis of Geothermal Water and Reservoir Rocks

The mid–low temperature geothermal reservoirs in Xining Basin are mainly of the Mesozoic Cretaceous and Jurassic sandstone and conglomerate with a burial depth of about 700–1600 m and the temperature of 40–80 °C, as shown in Figure 1. The geothermal well DR2018 was completed in early 2019. It is a vertical well with a depth of 1610 m. According to the logging interpretation, the formation can be divided into 179 small layers vertically, which are primarily overlapped fine sandstone, medium sandstone, sandy mudstone, and mudstone with a small amount of coarse sandstone in the middle. The geothermal gradient (°C) is t = 0.0209H + 32.163, where H is the depth in m. The formation temperature at the well bottom is up to 69.9 °C (1590 m). During the well drilling process, eight full-size cores were taken at depths of 764 m, 821 m, 882 m, 1130 m, 1433 m, 1487 m, 1541 m, and 1602 m, respectively (Figure 2). After the well completion, the geothermal water was sampled and analyzed. The identification of the rock thin section and testing of particle size composition, mineral composition, thermal conductivity, and heat capacity of the rock samples were carried out. Then, 82 standard-size cores with a diameter of 2.5cm were drilled, and their porosity and permeability were measured, which laid a foundation for the core flooding experiments.

2.1. Geothermal Water Properties

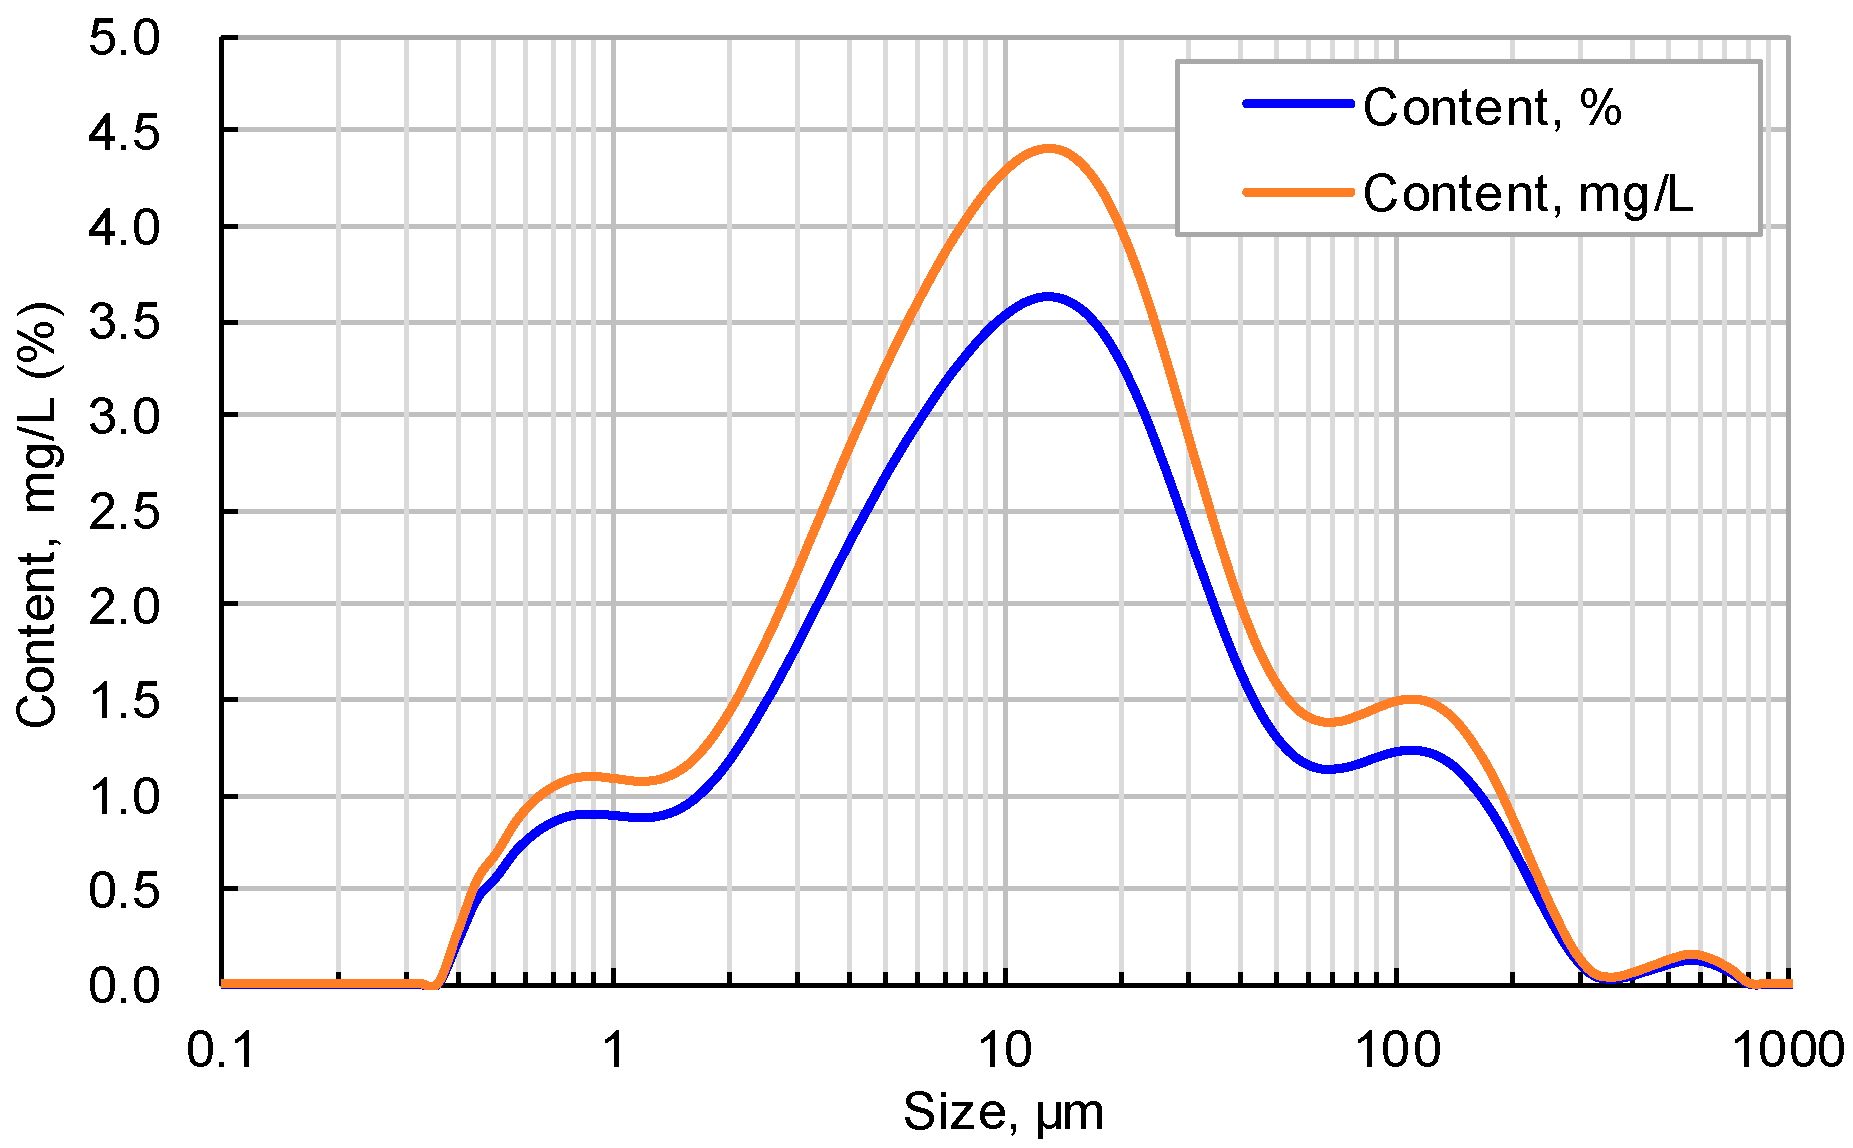
Referring to the experimental methods in the two measurement standards: “HJ493-2009 Water quality sample–technical regulation of the preservation and handing of samples” and “DZ/T0064.1-80-1993 Groundwater quality inspection method”, the properties of geothermal water from well DR2018 were determined, as shown in Figure 3 and Table 1 [19,20]. The raw geothermal water is relatively cloudy and light yellow. The content of the suspended mud particles in water is 122 mg/L. The particle diameter is distributed in a range of 0.39–709.63 μm, which is concentrated in a range of 0.39–300 μm with a peak near 7.76–17.83 μm. The salinity of the geothermal water is 36005.20 mg/L, and it is of Cl·SO4-Na type. The major scaling ions in water are Ca2+, Mg2+, and HCO3. The contents of Sr and metaboric acid in trace elements are 15.57 mg/L and 13.68 mg/L, respectively, which are relatively high and have good medical value (the medical standard of geothermal water: Sr > 10 mg/L, and metaboric acid >1.2 mg/L). In addition, there is a small amount of dissolved gas in the geothermal water. The gas–water ratio is 214 mL/L, of which CO2 accounts for 61.47 mol%, H2S accounts for 10.34 mol%, and CH4 accounts for 14.82 mol%. Geothermal water is characterized by high salinity and high corrosiveness, and there is a risk of calcium carbonate scaling.

2.2. Reservoir Rock Physical Properties

2.2.1. Rock Microscopic Identification

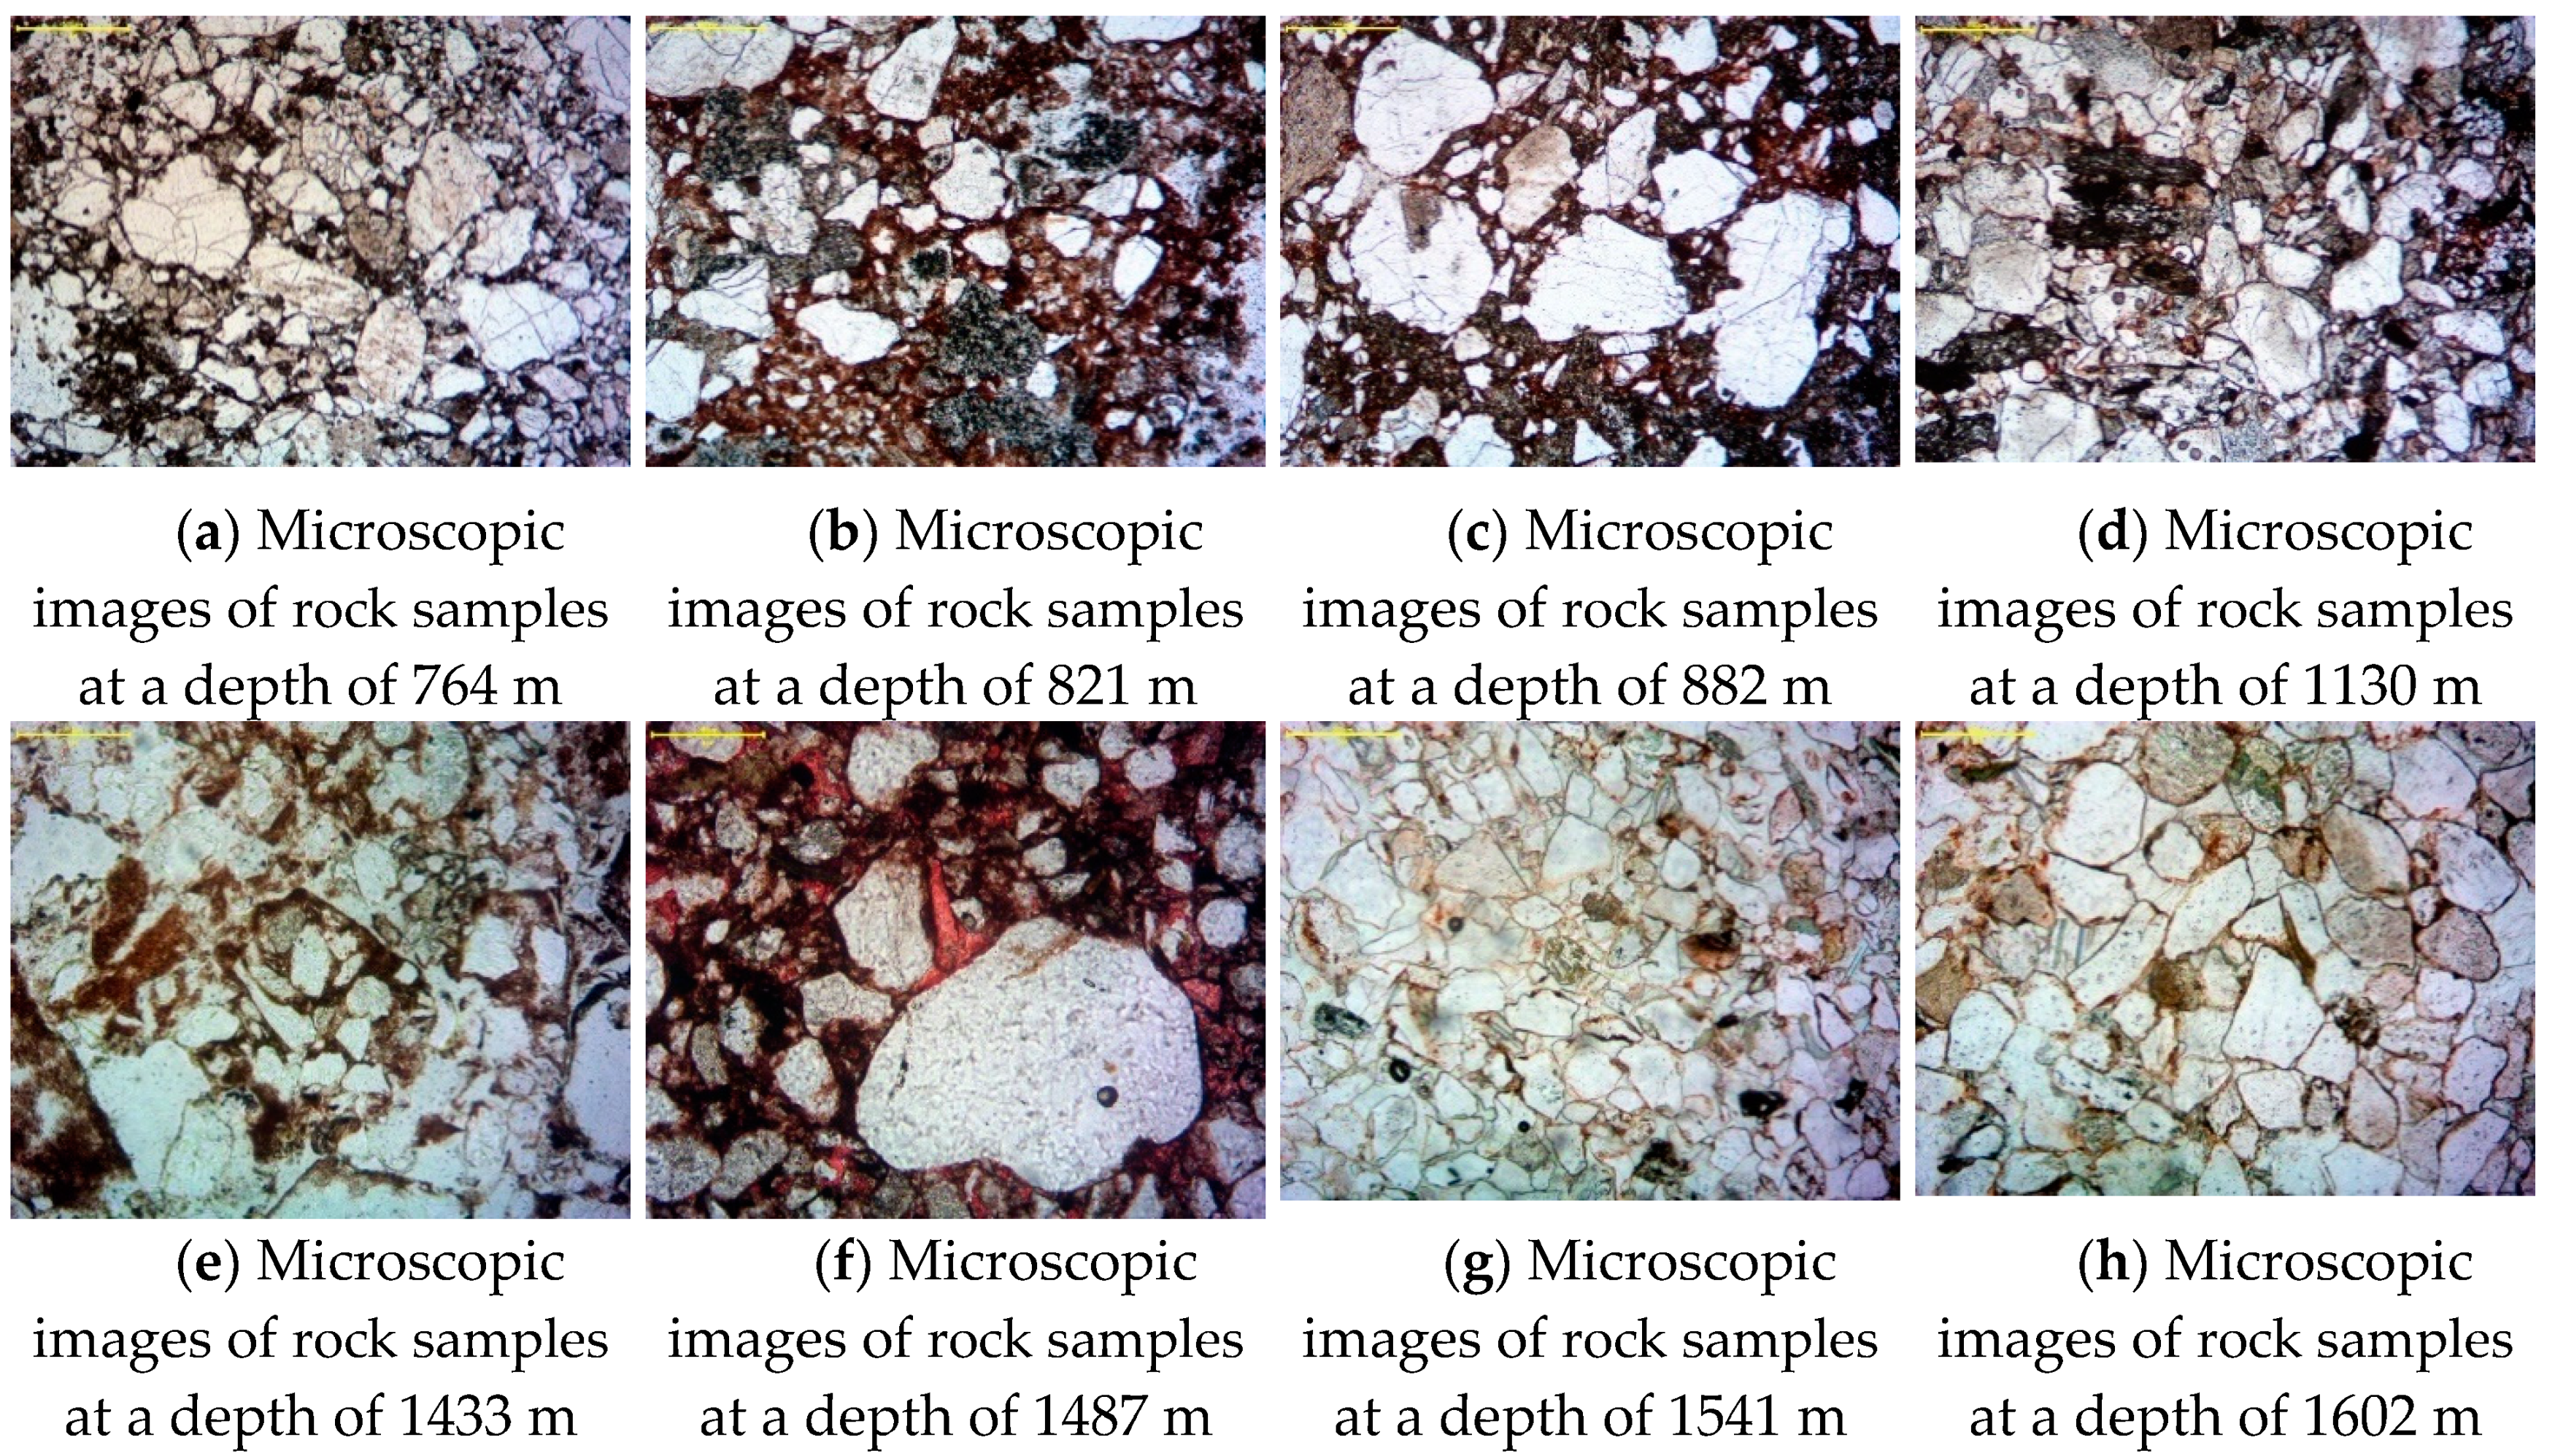
By the polarized light microscope, referring to the standard “GB/T 5368–2000 Thin section examination of rock”, the thin section identification of typical rock samples from well DR2018 was performed, and the typical polarizing microscopic images are shown in Figure 4 [21]. In general, the rock samples at different depths are weakly consolidated, consisting of debris, which has poor sorting. The fillings between debris are mainly clay minerals rich in iron oxide associated with a small amount of calcite and dolomite. The main minerals of debris are quartz, feldspar, calcite, and metamorphic minerals. In mid-deep strata, the rock debris grains are usually covered by a thin mud–iron film and mostly supported and cemented by fillings. This lithology is often formed under a weak hydrodynamic condition. The debris and fillings are deposited at the same time. The content of fillings is high, and the debris gains are distributed in fillings. In some rock samples, quartz gravels were observed.

2.2.2. Mineral Composition of Rocks

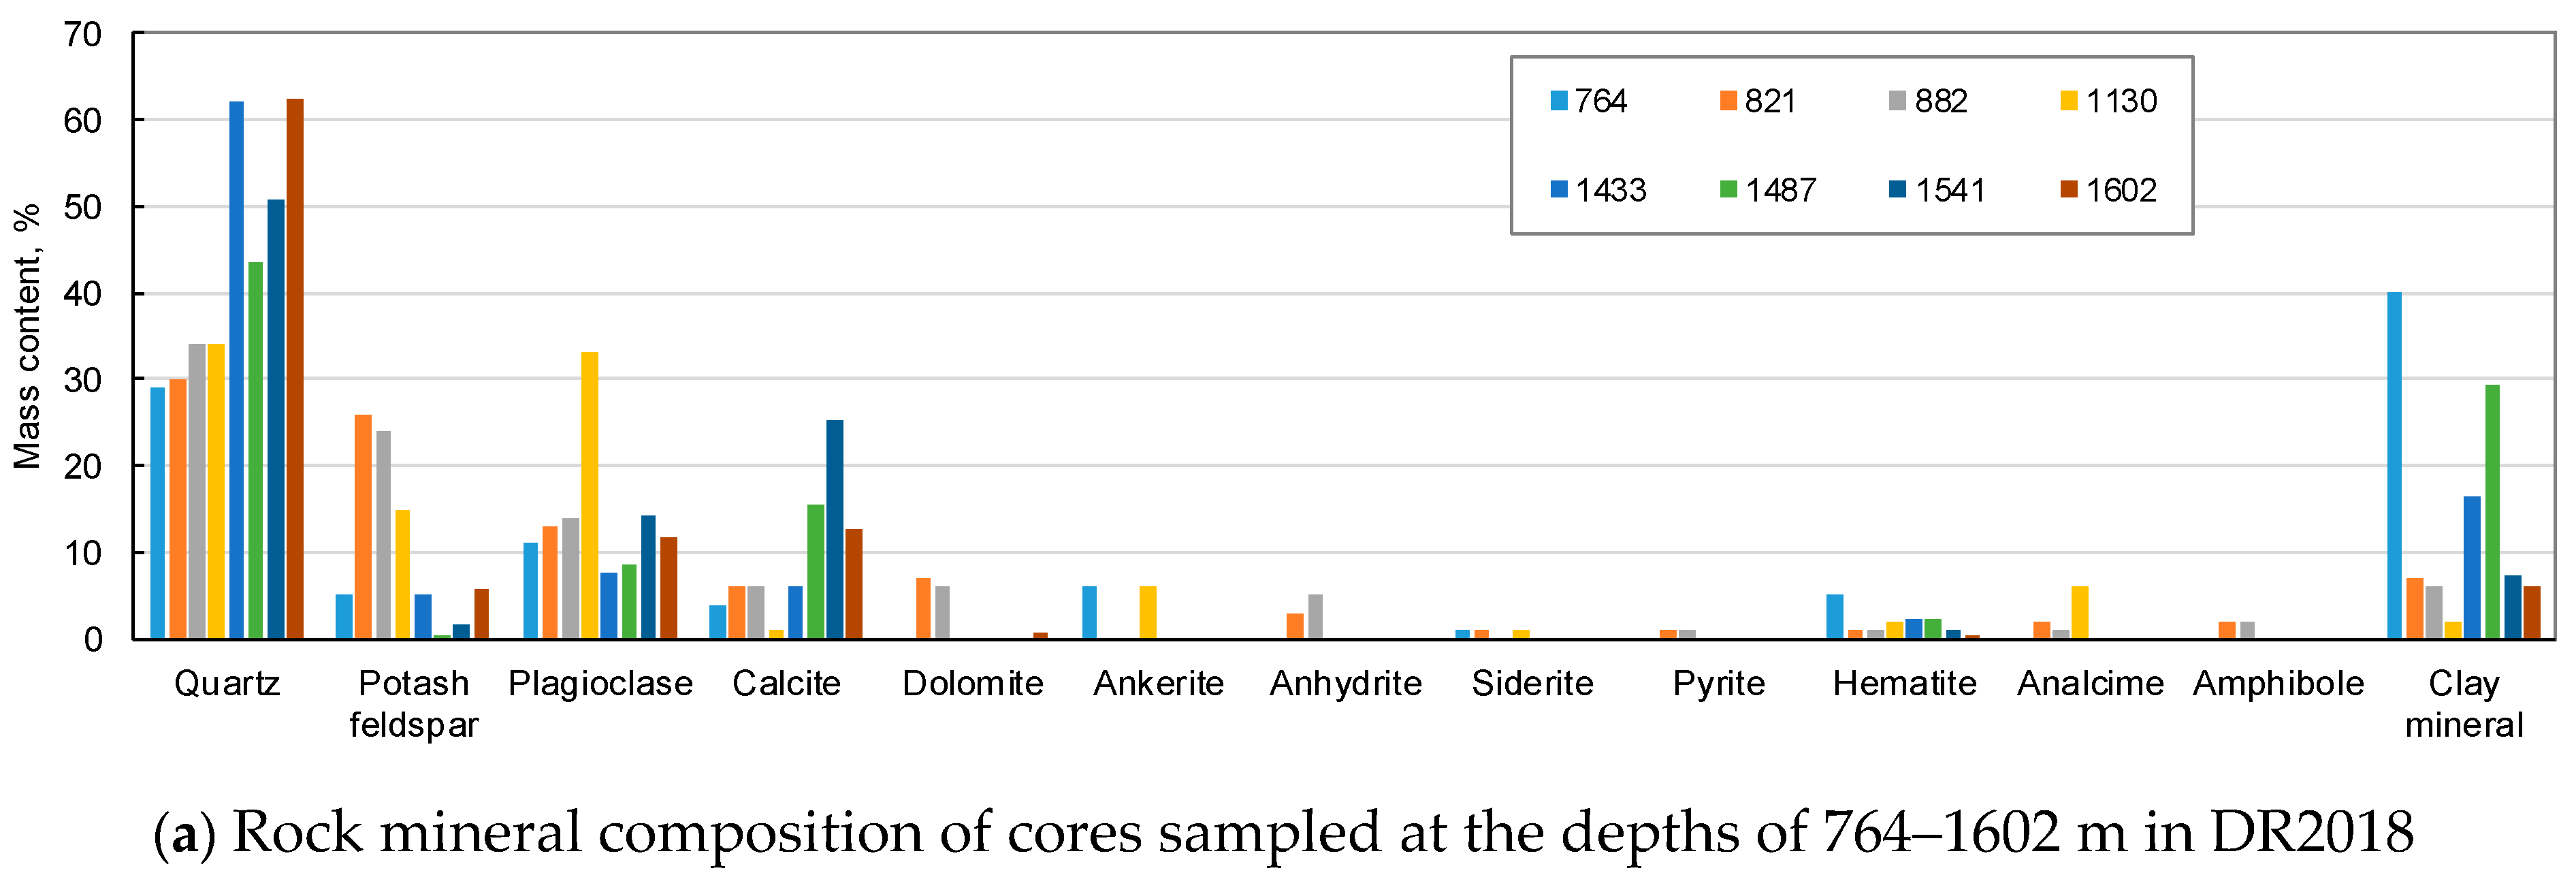
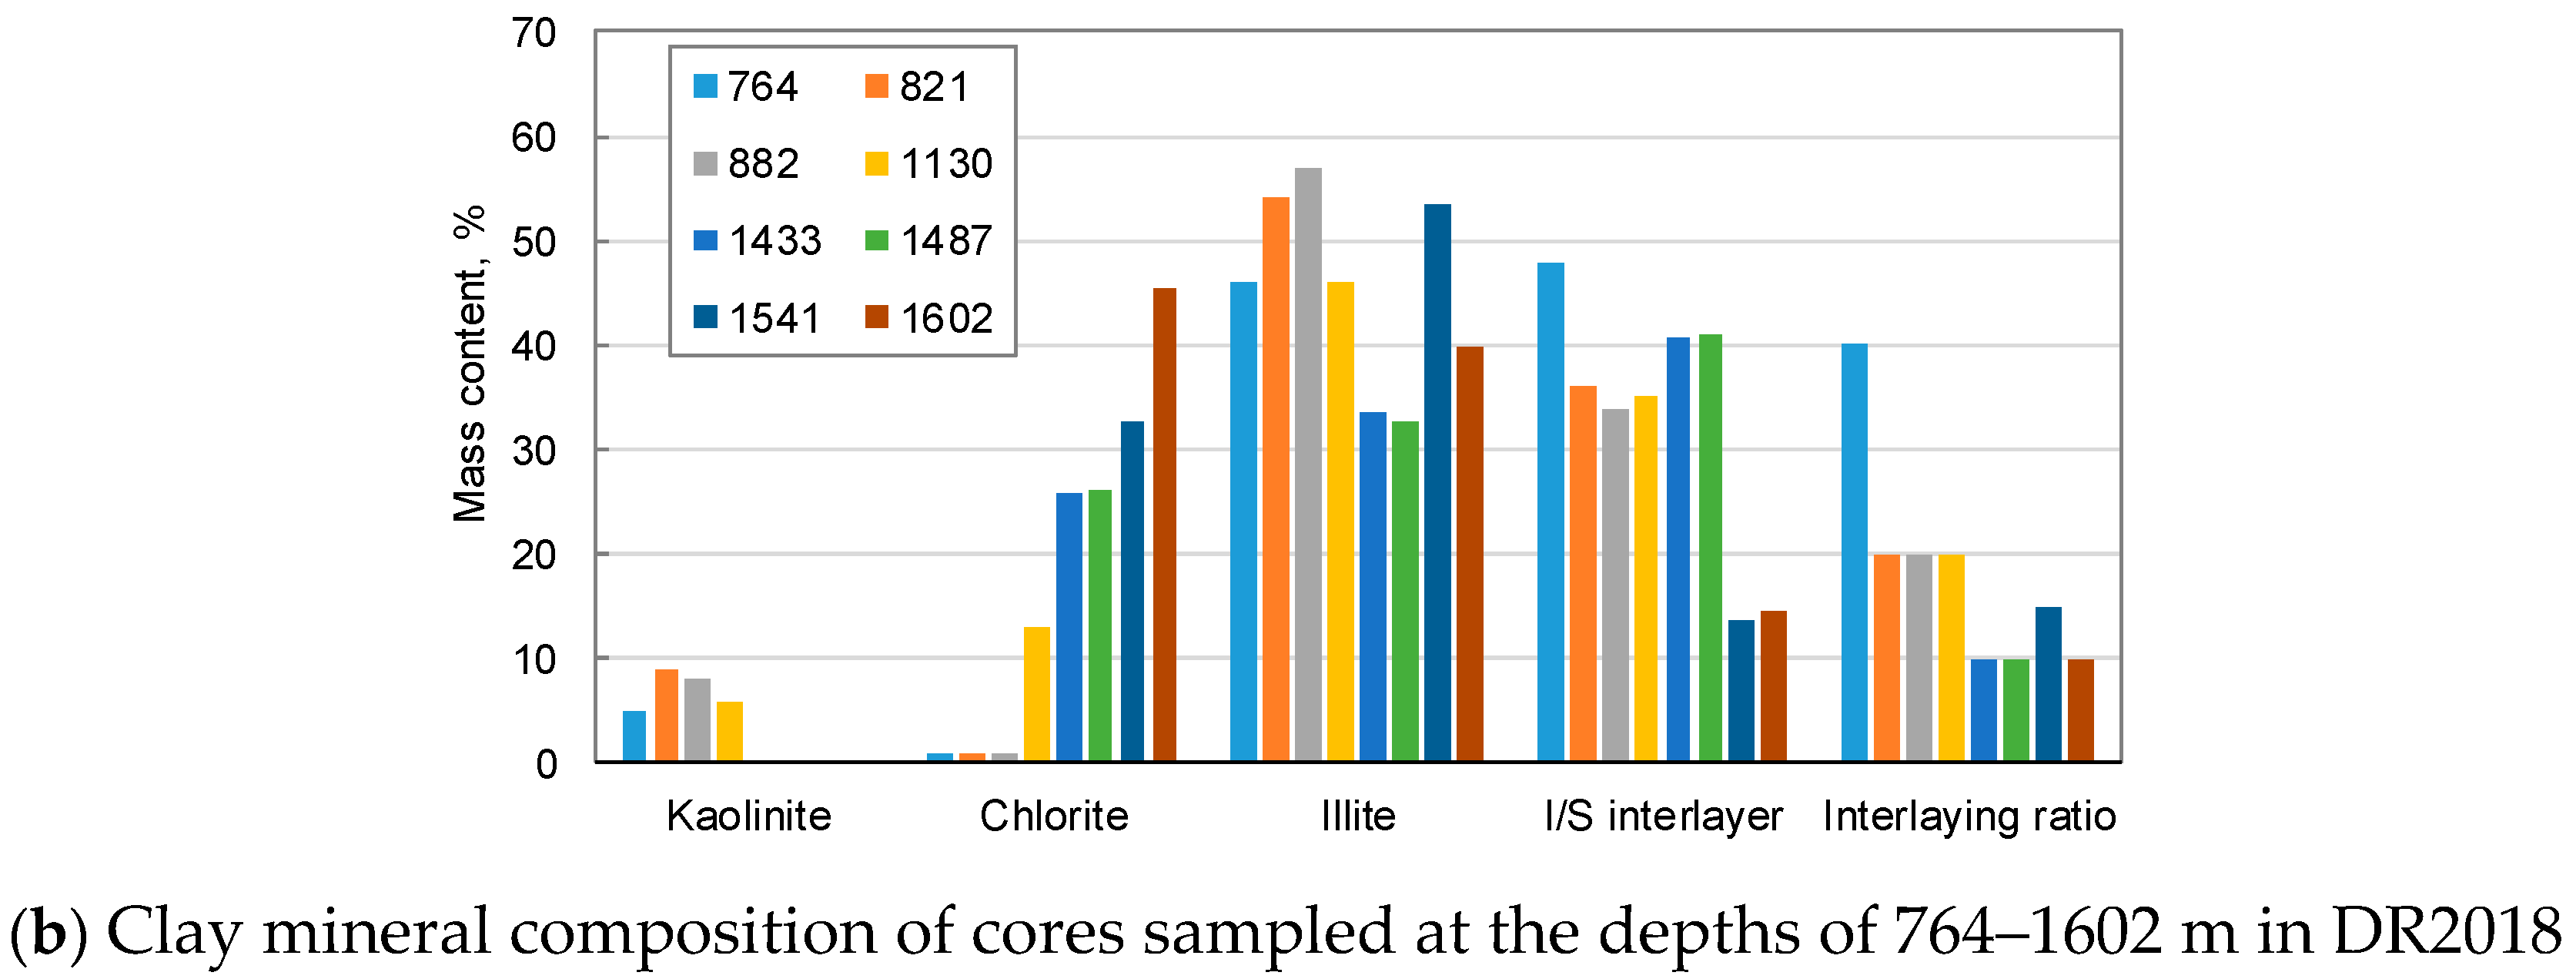
The mineral compositions of eight rock samples in well DR2018 were determined by XRD diffraction analysis, and the preparation and experimental methods refer to the standard “GB/T 14505–2010 Method for chemical analysis of rocks and ores—General rules and regulations”, as shown in Figure 5 [22]. Figure 5a shows rock mineral composition and Figure 5b shows clay mineral composition. The content of clay minerals in the strata decreases gradually with the increase of burial depth. The strata at a depth of 764 m is close to the caprocks, so the content of clay minerals in the rock sample is the largest, with a mass fraction of up to 40 wt %. The formation below 821 m is the geothermal reservoir. The contents of clay minerals at different depths are heterogeneous, ranging from 2–29 wt % with the illite, illite/montmorillonite, and chlorite as the major components. The main minerals in the shallow reservoir (depth < 1130 m) are quartz and feldspar, and a small amount of calcite, dolomite, and clay minerals are contained. In the deep reservoir (depth > 1130 m), quartz, feldspar, clay minerals, and calcite are the main minerals associated with trace dolomite and hematite. In contrast, more calcite and clay minerals are in the deep reservoir, and the porosity and permeability are relatively low.

2.2.3. Distribution of Rock Grain Size

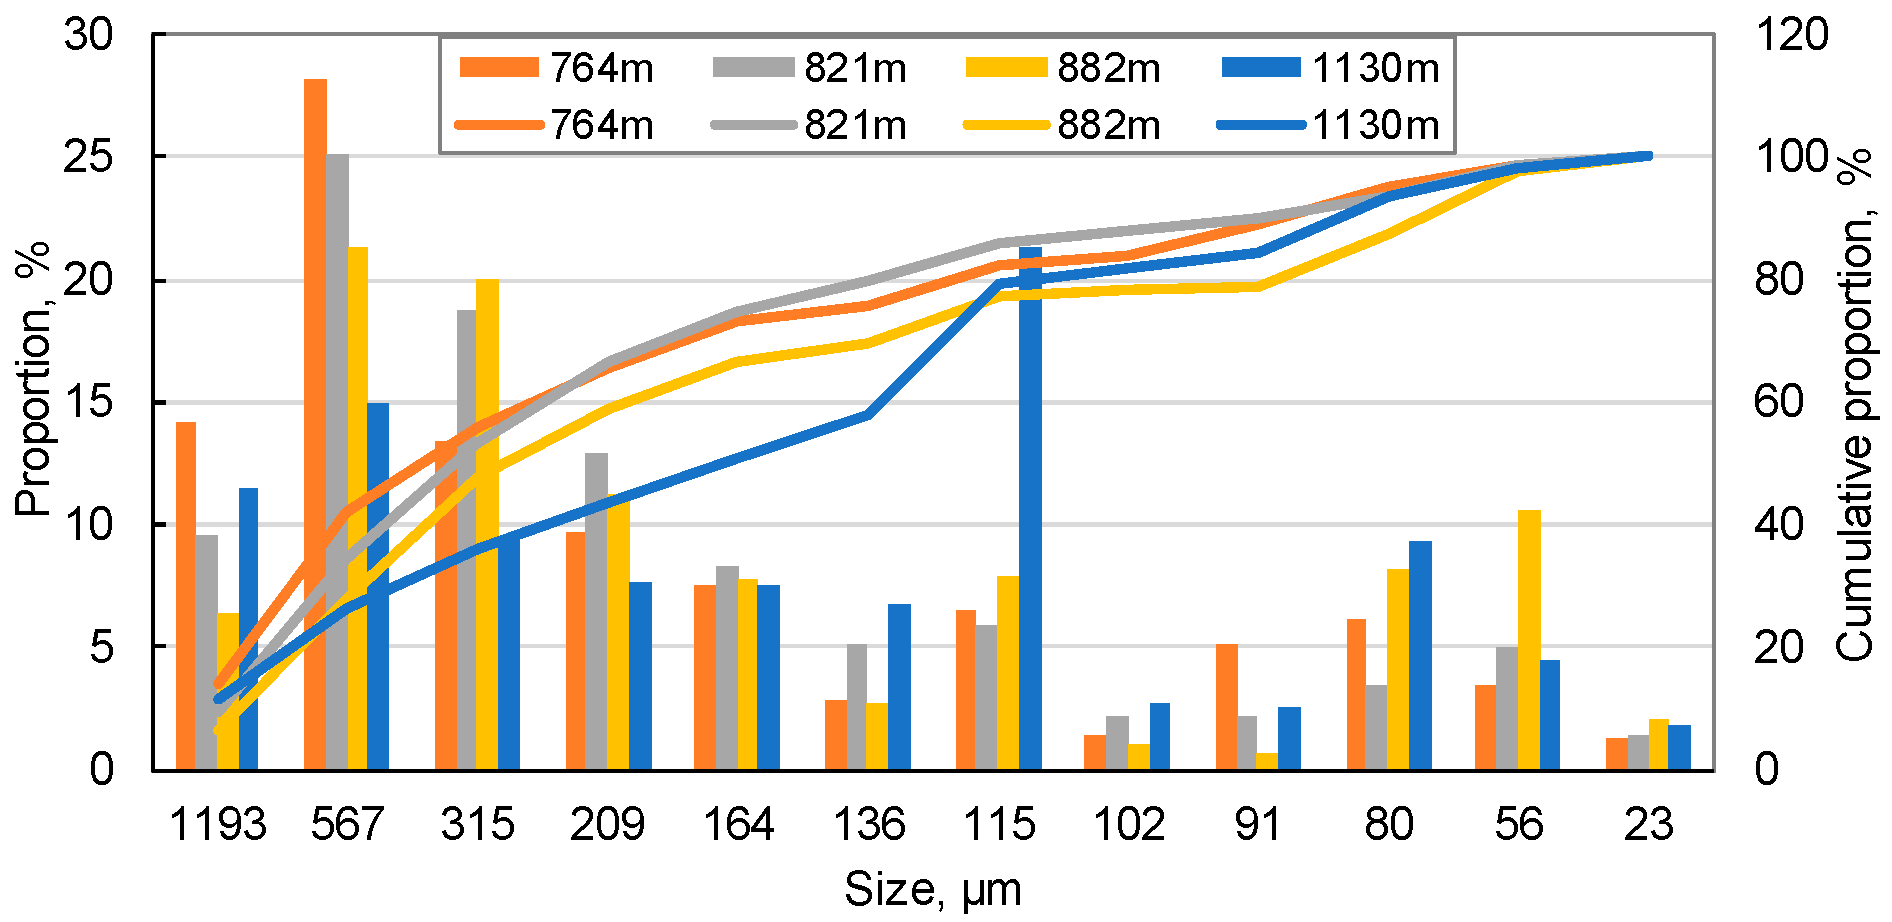
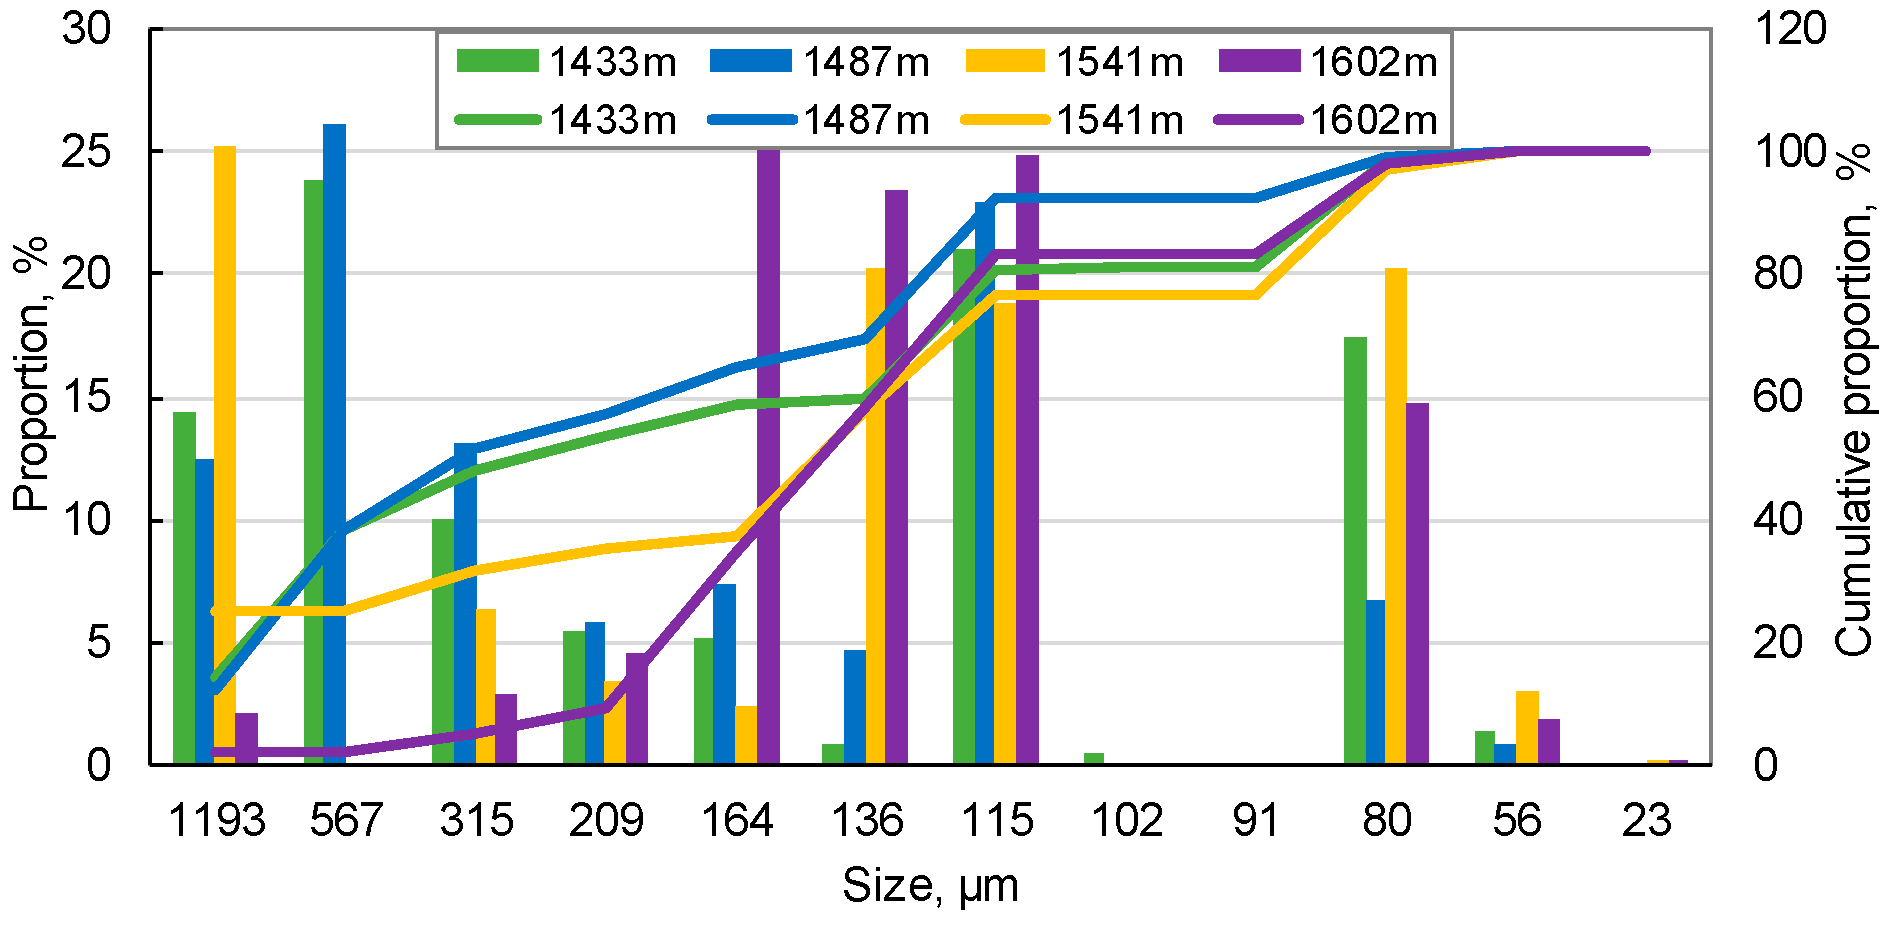
Referring to the standard “SY/T 5434-2018 Analysis method for particle size of clastic rocks”, the grain size distributions of rock samples were measured by manual grinding and screening [23]. As shown in Figure 6, the sizes of mud and sand grains in rock samples of well DR2018 are mainly distributed in a bimodal shape. In most cases, the mud–sand grains can be separated into two groups taking the grain size of 100 μm as a boundary. In order to facilitate the analysis of plugging risk in cores induced by the migration of the mud–sand grains, in this study, the mud–sand grains with a diameter smaller than 100 μm are defined as small grains, and the rest of the grains are defined as large grains. It is assumed that the large grains act as skeletons and cannot migrate, while the small grains have a movable tendency. The migration and blockage risk of small grains in the large grains’ pore throats depends on the matching degree between them. According to the 1/2–1/5 criterion [24], the small grains with a diameter smaller than the 1/2 pore throat of the large grains (defined as movable particles) are movable, of which the small grains with a diameter between 1/2 and 1/5 pore throat (defined as large particles) can migrate and cause severe blockage risk in pores, while the small grains with a diameter less than 1/5 pore throat (defined as small particles) will directly pass through the pores without causing damage [25].
Based on the above assumptions, the pore throat sizes and movable particle contents of rock samples in well DR2018 were calculated, as shown in Table 2. The average diameter of the mud–sand grains acting as the skeleton is 159–504 μm. The maximum pore throat size is 65.66–208.59 μm, and the minimum pore throat size is 24.53–77.94 μm. The content of small grains in the rock samples is 7.68–23.42 wt %. In terms of the maximum pore throat, the content of movable mud–sand particles is determined to be 0.18–23.42 wt %. The content of movable particles varies significantly at different depths, but the large particles with a diameter of 1/2–1/5 pore throat account for the vast major part, which will bring a great risk of particle migration and pore blockage. Determining the content of movable particles in geothermal reservoirs can provide robust guidance for carrying out blockage risk analysis during geothermal water reinjection.

2.2.4. Porosity and Permeability

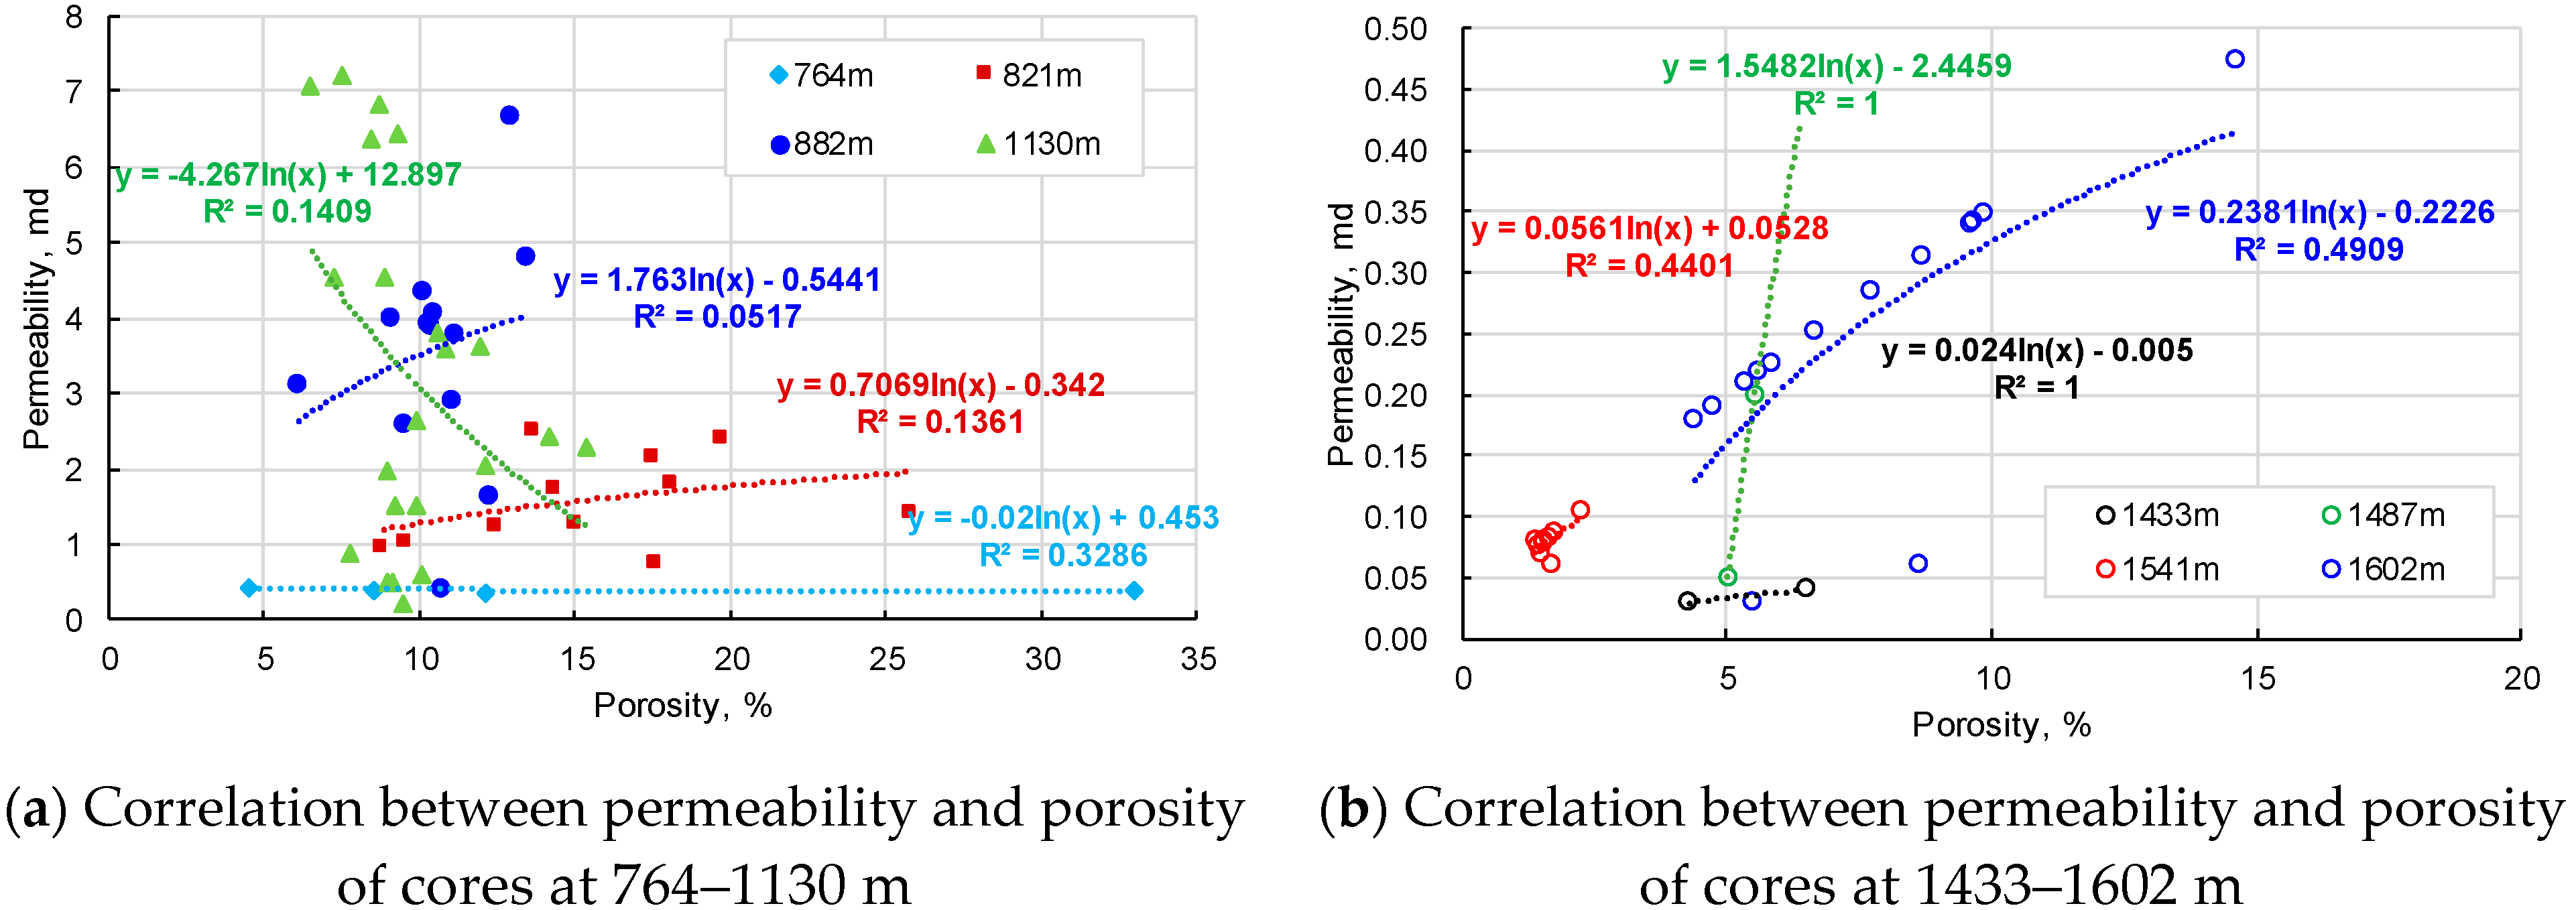
For the drilled 82 standard-size cores, referring to the standard “GB/T 29172-2012 Practices for core analysis”, the porosity and permeability were measured by the weighing method and the core displacement device, respectively [26]. The correlation between porosity and permeability was analyzed, as shown in Figure 7. Figure 7a,b represent rocks with the depths of 764–1130 m and 1433–1602 m, respectively. The cores at 764 m belong to caprocks, which have high clay content and a wide range of porosity but very low permeability. The rest of the cores from the geothermal reservoir are mainly composed of sandy mudstone and fine-grained sandstone. The core permeabilities at 882 and 1130 m are relatively high, generally ranging from 1 to 7 md, and the porosity is 5–25%. Compared with the cores at the depth of 764–1130 m in Figure 6, the correlation between porosity and permeability of cores at the depth of 1433–1602 m is good, and the correlation coefficient R is obviously higher, with porosity ranging from 1 to 15% and permeability ranging from 0 to 1 md. In general, the geothermal reservoir of well DR2018 is low-porosity, low-permeability, considerably heterogeneous in vertical, and weakly consolidated sandstone reservoir, which will bring difficulties for geothermal water pumping and reinjection.

3. Assessment Experiment of Formation Blockage Risk during Geothermal Reinjection

Serials of core flooding experiments were conducted to assess the formation blockage risk and influence factors during geothermal water reinjection using the real cores and water in well DR2018.

3.1. Experimental Equipment and Method

3.1.1. Experimental Equipment

The core flooding equipment used in experiments is shown in Figure 8. It is mainly composed of a core holder, high-pressure constant flow pumps, intermediate containers, a back pressure regulator, measuring cylinder, air bath, pressure transducer, data collector, and computer. The core holder can be filled with 5–60 cm long standard-size cores. The maximum working pressure and temperature of the core holder are 30 MPa and 150 °C, respectively. The maximum working pressure of the constant flow pumps is 40 MPa, which has a flow rate of 0.01–10 mL/min.

3.1.2. Experimental Materials

(1)
Water samples: geothermal water of well DR2018 and distilled water.
(2)
Rock samples: 20 standard-size cores at 1130 m of well DR2018, which have relatively high permeability and uniform quality with a length of about 4–6 cm and a diameter of 2.5 cm.
(3)
Chemicals: CaCl2 and NaHCO3, which are used for generating scaling particles; kaolin clay particles are used to prepare suspended particles in geothermal water.

3.1.3. Experimental Procedures

(1)
Put the core into the core holder, add confining pressure and backpressure, and keep the temperature at the designed value using the air bath to simulate the geothermal reservoir condition.
(2)
Inject geothermal water, scaling ion solution, or suspended particle solution into the core at a certain flow rate using the constant flow pump to simulate the geothermal reinjection process. Simultaneously, monitor the pressures at the two ends of the core holder in real time and collect the produced water using the measuring cylinder.
(3)
After the experiment, open the core holder and observe the blockage on the end face of the core.
(4)
Calculate the change of core permeability according to the flooding pressure difference and comprehensively analyze the blockage risk and mechanism in the core during water injection based on the core permeability fluctuation, sand grain size distribution, and phenomena observed.

3.1.4. Experimental Scheme

During geothermal water reinjection, the main factors inducing formation blockage include self-generated particle migration in pores and the intrusion of scaling and suspended particles in reinjected water. Hence, twenty cases were designed, as shown in Table 3. According to the previous logging data of geothermal well DR2018 and the whole distribution pattern of geothermal reservoirs in Xining Basin, the geothermal reservoir in well DR2018 was buried at a depth of 1000–1200 m. Hence, the cores at a depth of 1130 m were used, and the experimental pressure and temperature in the cores were set to be 12 MPa and 57.8 °C, respectively, corresponding to the formation conditions at that depth. Cases 1–10 were used to assess the influence of water flow rate, salinity, and stress on the blockage risk in cores. The filtered geothermal water of well DR2018 was injected. Cases 11–16 and cases 17–20 were used to assess the blockage risk induced by scaling and suspended particles, respectively. The injected water containing scaling particles was prepared by mixing the CaCl2 solution and NaHCO3 solution at 12 MPa and 57.8 °C prepared using the geothermal water of well DR2018. Six contents of scaling particles in water were designed, ranging from 150 to 1000 mg/L. The injected suspended particle solution was prepared by adding kaolin clay particles in the DR2018 geothermal water. Four contents of suspended particles in water were prepared, ranging from 1000 to 2500 mg/L.

3.2. Experimental Results and Analysis

3.2.1. Blockage Risk Caused by the Migration of Movable Particles

Influence of Water Flow Rate

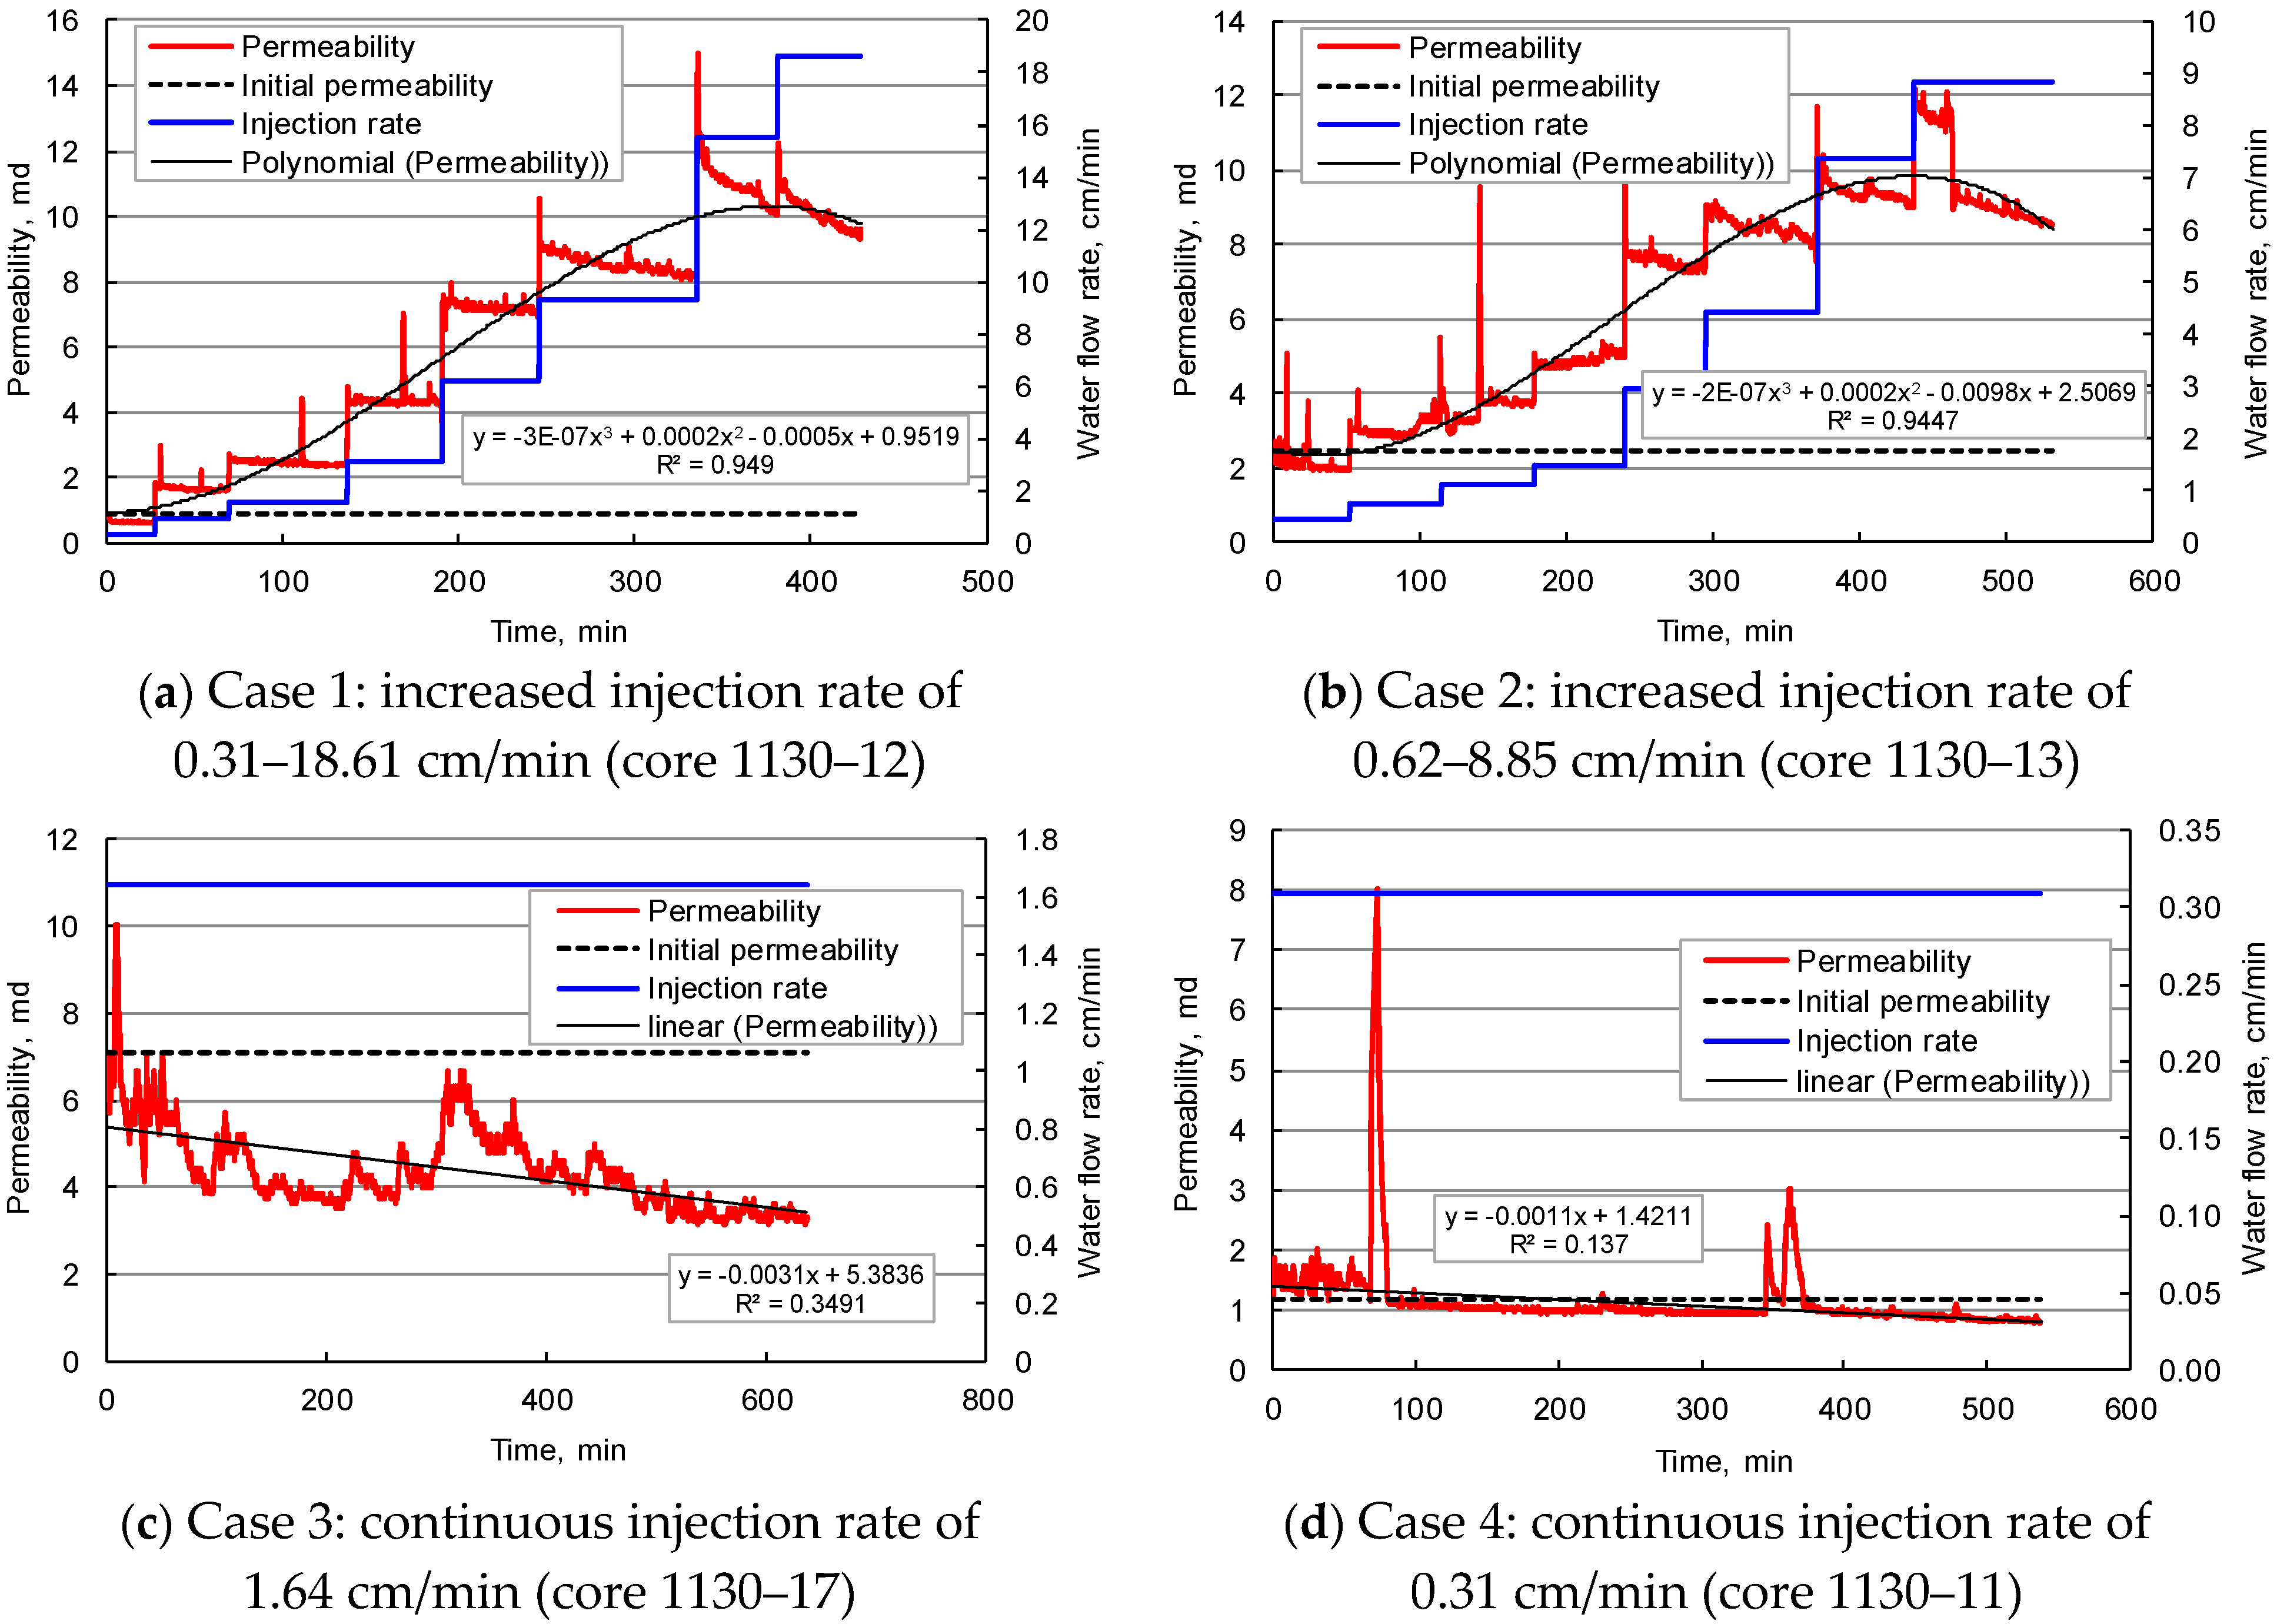
Cases 1–4 were used to assess the influence of water flow rate on the blockage risk during geothermal water reinjection using the cores 1130–11, 1130–12, 1130–13, and 1130–17 with a porosity of 6.53–14.19% and a permeability of 0.89–7.07 md. The water injection rate was 0.1–6 mL/min, which can be transferred to the linear flow velocity by dividing the injection rate by the cross-area of the core x porosity. The experimental results are shown in Figure 9.
Cases 1 and 2 were carried out to determine the sensitivity of water flow velocity in the core by increasing the water injection rate every 60 min. In case 1, as the water rate was increased from 0.1 to 6 mL/min, the water flow velocity in the core was increased from 0.31 to 18.61 cm/min. Accordingly, the core permeability was first raised from 0.89 to 14.95 (16.8×) and then decreased to 9.32 md (by 37.66%), which was calculated according to the displacement pressure difference in the core. When the water flow velocity exceeded 6.20 cm/min (2 mL/min), a significant drop of core permeability could be observed during every 60 min constant injection. So, the flow velocity of 6.20 cm/min can be regarded as the critical flow rate that can cause significant blockage in pores. For case 2, similar results can be obtained. With the increase of water rate, the core permeability rose from 2.46 to 12 md (4.88×) and declined to 8.57 md (by 28.58%). The critical flow velocity causing a significant blockage in pores is 2.95 cm/min (2 mL/min). By analysis, it can be obtained that as the water flow velocity increases, small particles and a small number of large particles will be started and form a weakly temporary blockage in pores at the beginning, the core permeability decreases slowly; when the injection rate is enhanced suddenly, the temporary blockage can be eliminated, and some movable particles will be produced out because of the short length of the core, which cannot form the secondary blockage, this process makes the increase of core porosity and permeability after each rise of injection rate. When the water injection rate is high, more large particles will take part in deposition after a short-distance migration in pores, which can increase the blockage risk in cores significantly, so a higher injection rate associated with a faster decline in core permeability is often observed if the injected rate is enhanced high enough [27].
To reveal the blockage characteristics of cores at a constant and low injection rate, cases 3 and 4 were conducted. In case 3, at a continuous injection rate of 0.5 mL/min (the flow velocity is 1.64 cm/min), the core permeability fluctuated frequently but decreased generally by 52.76% from the initial 7.07 md to the final 3.34 md. For case 4, the core permeability decreased by 35% from 1.2 md to 0.78 md at a constant injection rate of 0.1 mL/min (0.31 cm/min); during the injection, the core permeability experienced two abnormal rises, but it recovered quickly. It can be seen that a long-term low injection rate can still cause the core permeability to decrease. The migration and temporary blockage of particles in pores can make the permeability fluctuate. Especially for the core with a larger permeability, the decline of permeability induced by particle blockage is more serious.
Figure 10 shows the produced water at different flow rates in Case 1. With the increase of the flow rate, the small particles in the core gradually migrate out. After the subsequent increase in the flow rate, the production of small particles has stabilized, so the produced water gradually becomes clear. Meanwhile, large particles will inevitably be adsorbed and deposited at the pore throats during the migration process, causing the pore throats to be blocked. Based on the above analysis, it can be considered that the change of permeability was affected by movable particles.
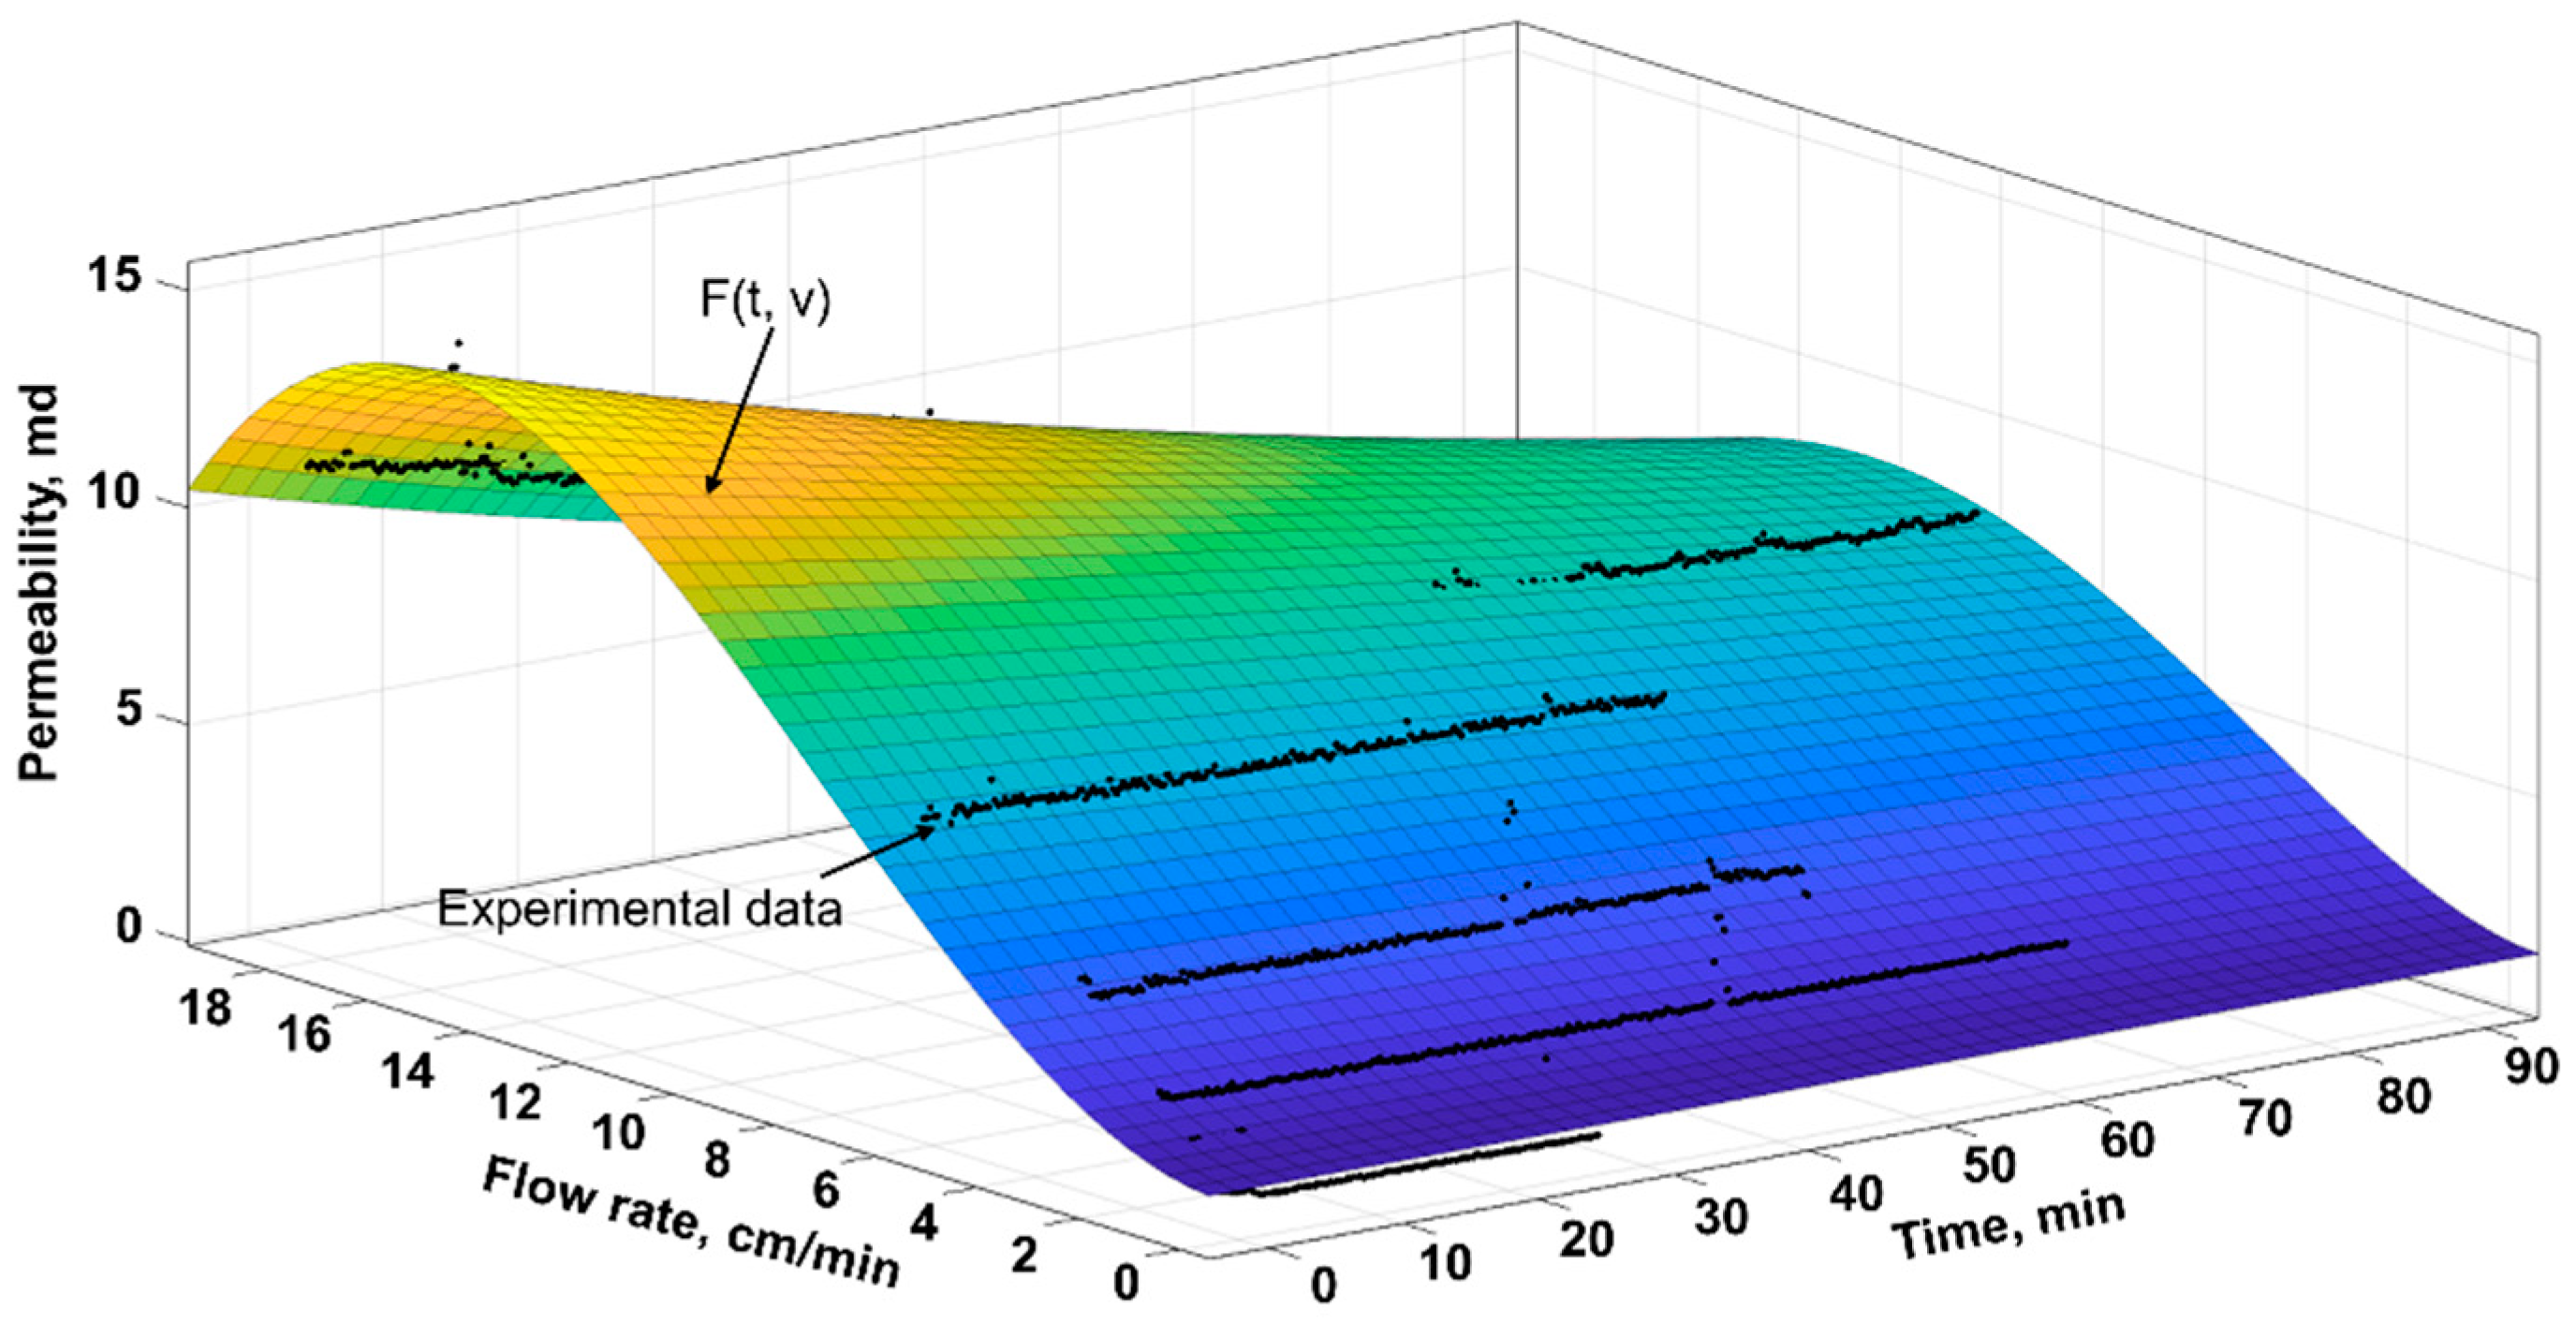
To further explore the influence of flow rate and time on permeability, the experimental data in Case 1 are used to obtain the appropriate permeability as a function of flow rate and time. The time data are processed in the following way: every time the flow rate is changed, the time restarts from zero. The following relationship is considered: the higher the flow rate, the permeability first increases and then decreases; the longer the time, the permeability gradually decreases. So, the permeability function is designed as the following formula.
P = f ( t , v ) = ( a 1 v 3 + a 2 v 2 + a 3 v + a 4 ) × e a 5 v t
where P is permeability, md; t is time, min; v is flow rate, cm/min; a 1 a 6 are fitting coefficients.
By cftool in MATLAB, the permeability function f (t, v) can be fitted. The fitting coefficients obtained are as follows: a 1 = −6.80 × 10⁻³ md·cm−3·min3, a 2 = 0.14 md·cm−2·min2, a 3 = 0.28 md·cm−1·min, a 4 = 1.47 md, a 5 = −4.46 × 10⁻⁴. The fitting result is shown in Figure 11. It can be seen that the experimental data points are scattered on both sides of the fitted function surface, and the determination coefficient R reaches 0.94. In general, the fitting effect of the permeability function is acceptable, which can reflect the influence of flow rate and time on permeability.

Influence of Injected Water Salinity

Cases 5–7 were conducted to assess the influence of injected water salinity on blockage risk in pores using the cores 1130–14, 1130–15, and 1130–16, which have a porosity of 7.25–10.86% and a permeability of 3.62–4.54 md. The geothermal water of well DR2018 was mixed with distilled water to reduce the salinity of water injected. The total injection rate was 0.5 mL/min. During the injection, the proportion of distilled water was gradually increased from 0% to 100%.
The experimental results are shown in Figure 12. It can be observed that the core permeability fluctuated frequently and drastically during water injection as salinity decline. This is because the decrease of injected water salinity can enlarge the diffuse electric double layer on the surface of the clay particles, which will easily cause the expansion, detachment, migration, and temporary blockage of clay particles in pores. Different from the effect of water flow velocity, generally, as the water salinity declines, the core permeability will decrease first and then increase because of the large number of clay particles that detached and produced out of the core under the effect of water salinity sensitivity. As a result, the final core permeability tends to be stable, close to, or slightly less than the initial value. By comparison, the water salinity sensitivity of the three cores can be ranked in an order of 1130–15 (case 7) > 1130–14 (case 6) > 1130–16 (case 5). It can be seen that the stronger the sensitivity of water salinity, the more frequently and drastically the core permeability fluctuates, and the more greatly the core permeability recovers in the final stable state. In terms of the distilled water content corresponding to the timing of core permeability starting to recover, a conservative critical water salinity causing significant clay particle detachment and migration can be determined to be 18,000–25,200 mg/L. The geothermal reservoir of well DR 2018 has a salinity sensitivity, which needs to be considered when the geothermal water is reinjected.

Influence of Confining Pressure

Cases 8–10 were conducted to assess the influence of stress on the blockage risk in pores using the cores 1130–4, 1130–6, and 1130–10, which have a porosity of 9.36–12.15% and a permeability of 2.06–3.07 md. During experiments, increasing confining pressure was applied to the side of the core by the core holder, increasing from 14 to 25 MPa to generate effective stress of 2–13 MPa to compress the sand grains of cores. The injection rate of DR2018 geothermal water was 0.5 mL/min.
The experimental results are shown in Figure 13. In case 8, as the confining pressure increased, the effective stress acting on the core increased. Under normal circumstances, the core permeability will decrease due to the compaction. However, in this case, the prominent migration of clay and sand particles in pores led to an increase in core permeability, which just has the opposite effect of the confining pressure. Under the combined action of these two mechanisms, there is no obvious decline in the final core permeability, but abnormal fluctuations in permeability occurred during injection, which are probably induced by the switch of confining pressure. The deformation of the weakly consolidated rock can promote particle migration and cause a temporary increase in core permeability. In case 9, as the confining pressure increased, the core permeability decreased by 30.08% from the initial 2.46 md to the final 1.72 md, but it is hard to judge the reason, because at a constant confining pressure, the core permeability can also decrease with injection. For case 10, as the confining pressure increased, the core permeability remained stable at 1.09–1.45 md except for the initial permeability fluctuations (the initial permeability is 3.07 md). To sum up, the confining pressure has an effect on core permeability, but the combined action of confining pressure and particle migration determines the increase or decrease of core permeability.

3.2.2. Blockage Risk Caused by the Scaling Particles in Injected Water

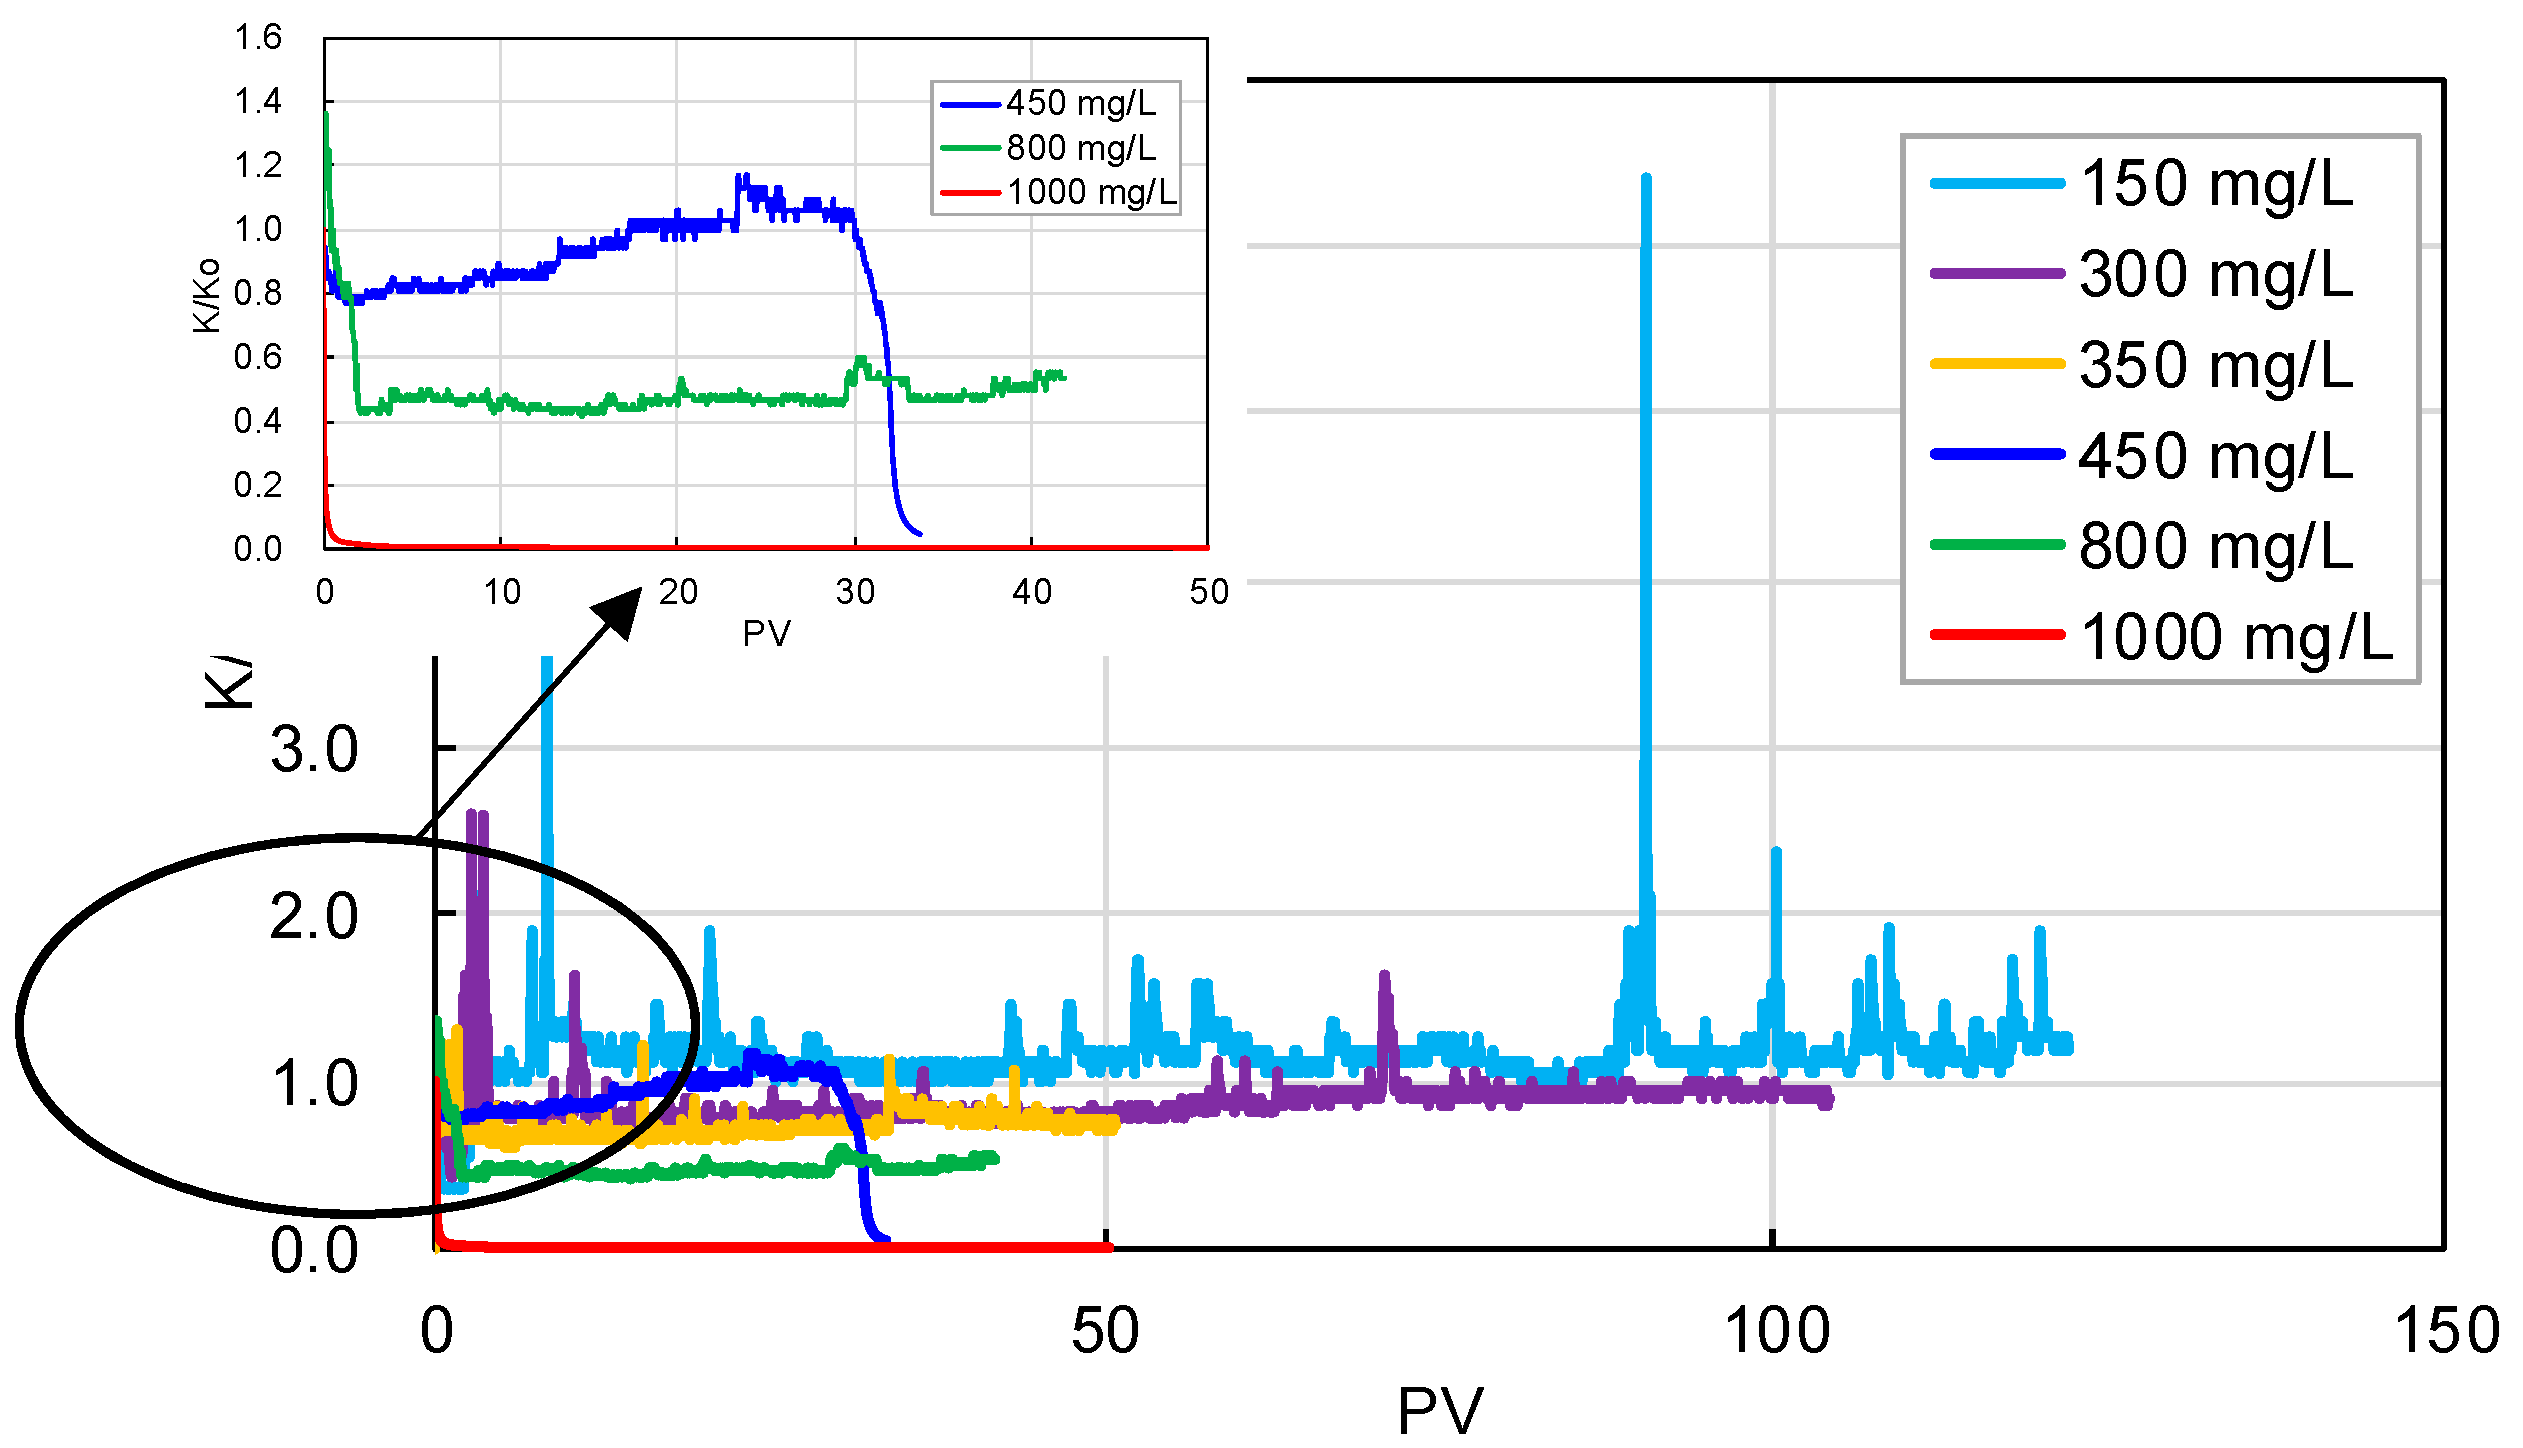
To evaluate the influence of scaling particles on core permeability, core flooding experiments of cases 11–16 were carried out using six cores with a porosity of 7.52–11.99% and a permeability of 3.52–8.2 md. The water injection rate was 0.5 mL/ min. The solution containing 150–1000 mg/L CaCO3 scaling particles has been prepared with various concentrations of CaCl2 and NaHCO3, as shown in Table 4. Using OLIstudio ScaleChem software, combined with the experimental conditions of 57.8 °C, 12 MPa, and 0.5 mL/min, the theoretical CaCO3 scaling concentration has been obtained. It can be seen from this table that the CaCO3 scaling concentration calculated by OLIstudio ScaleChem has some errors with that in the experiments, but the difference is small, with the error of 2.19–10.87%. For example, for the case 11 with 0.0047 mol/L CaCl2 and 0.0092 mol/L NaHCO3, the experimental scaling concentration is 150.00 mg/L, while the scaling concentration is calculated by OLIstudio ScaleChem is 166.30 mg/L, with an error of 10.87%. This also shows that the concentration of CaCO3 scaling particles is reasonable.
The experimental results are shown in Figure 14. When the concentration of scaling particles in injected water is low (<150–350 mg/L), the core permeability fluctuated frequently but maintained stability under the combined effects of clay and sand particle migration and scaling particle intrusion. A typical diameter of a CaCO3 scaling particle is 32 μm at a low concentration without coalescence [28]. Compared with the pore throat size and considering the increase of pore throat due to the clay and sand particle migration, the scaling particles have a very high opportunity to pass through the pore throat [29,30]. This can be proved by the phenomenon that after the core holder was opened, no evident CaCO3 precipitation was observed on the core end face. When the scaling particles in water were injected at a high concentration (>450–1000 mg/L), the scaling particles would be aggregated, and the increased-size scaling particles caused a severe blockage in pores at the initial stage of injection [31,32,33]. For example, when the concentrations of scaling particles in water are 450, 800, and 1000 mg/L, the core permeability was decreased by 3%, 46%, and 99%, respectively, after 30PV was injected. To sum up, under the premise of clay and sand particle migration, as the scaling particles continue to invade the core pore, the core permeability generally shows a declining trend. When the amount of scaling particles precipitated in the pore is high enough, the decrease of core permeability will be accelerated, such as in the case of 450 mg/L.

3.2.3. Blockage Risk Caused by the Suspended Particles in Injected Water

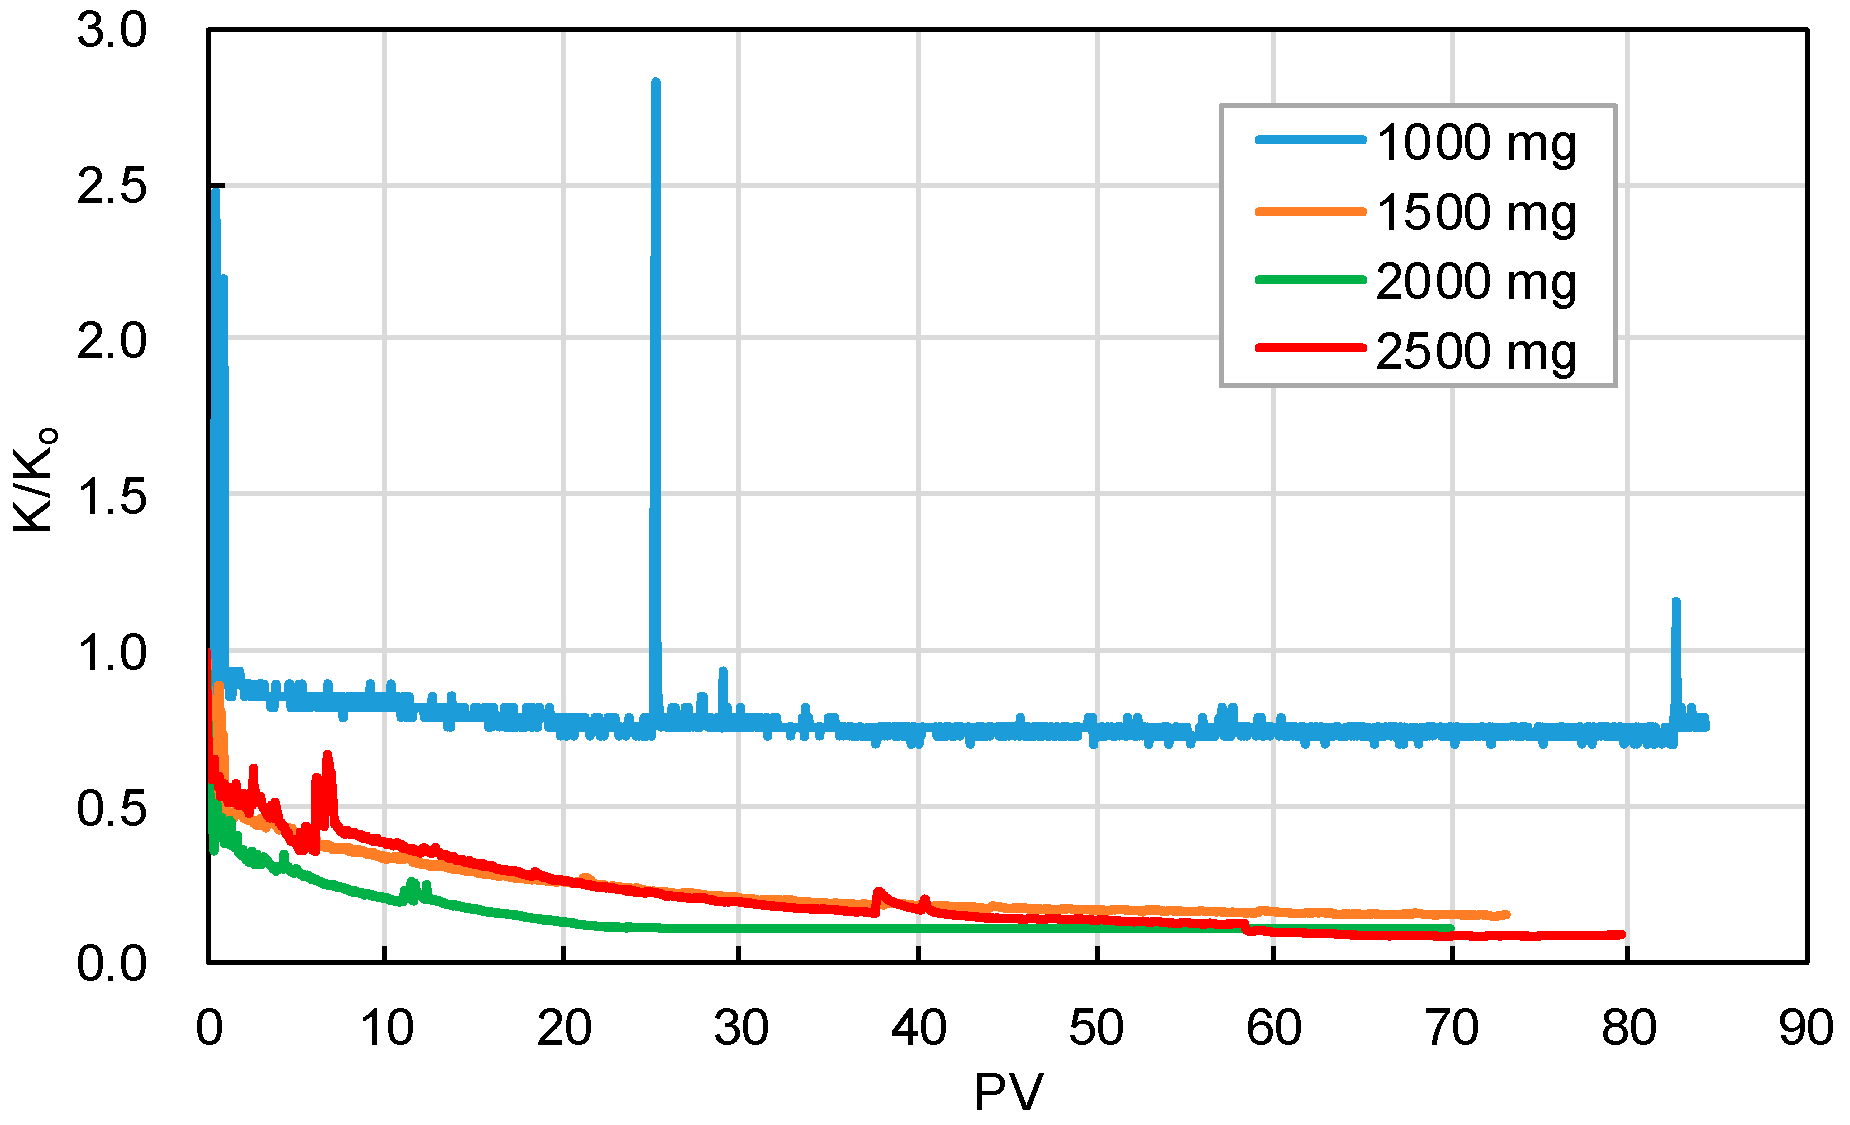
Core flooding experiments of cases 17–20 were conducted to assess the influence of suspended clay particles on the core permeability. Four cores were used with a porosity of 6.55–26.38% and a permeability of 3.42–6.56 md. The concentration of suspended kaolin clay particles in the injected water was 1000, 1500, 2000, and 2500 mg/L, and the water injection rate was 0.5 mL/min.
As shown in Figure 15, it can be seen that as the suspended particles intruded into the core, the core permeability decreased gradually. The core permeability fluctuated significantly at the initial stage of injection, it is because only a small amount of suspended particles was precipitated in the pore, and significant migration and temporary blockage of the self-generated movable particles still dominated in the pore [34]. Although the size of suspended clay particles is usually small, as more and more suspended particles were precipitated in the pore, the fluctuation of core permeability gradually weakened and changed to be a stable and continuous decline, which indicates that the accumulation of clay particles in pores can also cause a blockage risk in formation [35]. Overall, the higher the concentration of suspended particles in injected water, the faster the core permeability decreases. When the suspended particles with a concentration of 1000, 1500, 2000, and 2500 mg/L were injected for 70PV, the core permeability was decreased by 26.94%, 84.87%, 89.35%, and 91.73%. In the field, if there are a large number of suspended particles in the injected water, effective measures should be taken to remove the suspended particles before reinjection. Usually, the diameter of suspended particles after disposal should be reduced to smaller than 12.26μm (<1/5 min. pore throat) [36].

4. Discussion

Through the core flooding experiments in this paper, the main formation blockage risk of geothermal water reinjection in the Xining Basin can be determined. In the experimental results, the blockage rate caused by scaling particles was the fastest, and when the concentration of CaCO3 scaling particles reached 450 mg/L, the core was completely blocked after only 34PV water was injected. The impact of suspended particles on blockage was second, and when the concentration of suspended particles was 1000–2500 mg/L, the permeability decreased by 27–92% of initial permeability after injection of 70PV, whose blockage was weaker than the damage caused by scaling particles. At last, the migration of movable particles in the reservoir can lead to an increase in permeability in a short period of time, but the particle deposition after long-term injection would still reduce the permeability and cause formation blockage. In general, the blockage risk is as follows: scaling particles > suspended particles > movable particles.
For the geological characteristics of the weakly cemented, low-porosity and low-permeability sandstone reservoirs in the Xining Basin, the pore throat of the formation is small, which easily leads to the deposition of movable clay and sand particles and invasion particles, forming blockage near the well. Pumping and reinjection tests were carried out in well DR2018, and the flow rate change was shown in Figure 16. During the periodic reinjection process, when the reinjection pressure was gradually increased from 0.23 to 0.63 MPa, the reinjection rate did not increase significantly, remaining at 12.9–16.2 m3/h, and the reinjection rate in the third reinjection even was lower than that in the second reinjection, indicating that the reservoir had serious blockage. Due to the use of a 5–50 μm two-stage filtration system and relatively high-speed injection, the concentration of suspended particles and scaling particles in the on-site reinjection water was extremely low; hence, the formation blockage was mainly caused by the migration and deposition of movable particles. In Xi’an, China, similar to the Xining Basin, the lithology is dominated by light gray fine-medium sandstone. At the reinjection pressure of 0–1.41 MPa lasting for 38 days, the reinjection rate decreased from 20.40 to 15.96 m3/h, and obvious sand production in the produced water demonstrated that the migration and deposition of self-generated particles and suspended particles resulted in serious formation blockage [37]. The Neustadt–Glewe geothermal field in the northern German basin also faces the problems of formation blockage. The rock in this geothermal reservoir was mainly fine sandstone, and the salinity of geothermal water reached 220,000 ppm. Due to self-generated particle migration and scaling particle invasion after 10 months, the reinjection capacity dropped from 175 to 100 m3/h/MPa, which showed apparent formation blockage [38]. Therefore, it can be seen that there are a large number of formation blockage problems caused by movable self-generated particles and invasion particles in the geothermal water reinjection site.
Based on the analysis of experiment results, the following anti-blockage measure in geothermal water reinjection can be obtained: (1) The reinjection rate is appropriately increased to allow more particles in the near-wellbore zone to be generated and migrated, which will expand the deposition range and disperse the blockage in the formation, so the blockage caused by self-generated particles can be alleviated. (2) The geothermal water is fully filtered before reinjecting to reduce the concentration of suspended particles. In the reinjection test in Tianjin, China, the drop in reinjection capacity can be controlled, and the blockage can be relieved after a two-stage filtration system of 50 μm and 3–5 μm [38]. (3) The pH of reinjection water is adjusted to avoid the generation of scaling particles, including adding acid solution, diluting with fresh water, and pre-scaling before reinjection, so as to prevent blockage of scaling particles [39]. (4) When severe formation blockage occurs, chemicals can be used to treat the near-well formation to eliminate the blockage of solid particles. In the Soutlz geothermal field in France, adopting soil aid and chelating agent can increase the reinjection capacity from 0.20 to 0.50 L·s−1·bar−1 [40].
It can be seen from this study that there are indeed some formation blockage problems during the geothermal water reinjection, so the future work can be carried out from the perspectives of the blockage mechanism and anti-blockage measures: (1) formation blockage during geothermal water reinjection can be simulated by a mathematical model or numerical simulation software; (2) the coupling blockage mechanism of movable particles, scaling particles, and suspended particles can be further analyzed by more experiments; (3) in view of the traditional pumping and reinjection development model, anti-blockage measures can be further verified and studied; (4) the technology of wellbore self-circulation can be further explored to avoid formation blockage.

5. Conclusions

(1)
The geothermal water in well DR2018 has high salinity and high corrosion and scaling risks. The geothermal reservoir is characterized by a low porosity of 1.64–18.68%, a low permeability of 0.04–7.23 md, and weak rock consolidation of sandstone with clay as the main cement. The sand grain size has a bimodal distribution. The movable clay and sand particles in cores account for 0.18–23.42 wt %, which brings a potential risk of formation blockage for the geothermal water reinjection.
(2)
The geothermal reservoir has a significant sensitivity to water flow rate and salinity. The start, migration, deposition, and plugging of clay and sand particles in pores affect the reservoir’s physical properties. Stepped enhancement of water injection rate can increase the core permeability, but when the water flow velocity exceeds 2.95–6.20 cm/min, the core permeability will decline rapidly. Even at low water flow velocity of 0.31–1.64 cm/min, the rock permeability will drop by 35–53% after 25–144 PV injection. With the decrease in the salinity of injected water, the core permeability fluctuates drastically, reflecting the hydration, expansion, and detachment of clay particles in pores and enhancing the reservoir blockage risk. The increase in confining pressure tends to decrease the core permeability, but it may be counteracted by the permeability increase caused by the migration of movable particles.
(3)
The intrusive particles in the near-wellbore formation are mainly scaling and suspended clay and sand particles in the injected geothermal water. The higher the content of solid particles in water, the more significant the decrease in core permeability. The blockage risk induced by low-content solid particles in injected water can be covered up by the migration of movable particles in cores. When the content of scaling particles in water is 450–1000 mg/L, the core permeability can decrease by 3–99% after 30 PV injection. In contrast, when the content of suspended particles is 1000–2500 mg/L, the permeability can reduce by 27–92% after 70PV injection. The invasive particles can be easily removed by pretreatment, such as filtration, while the movable particles generated in the reservoir are hard to be eliminated. Hence, the migration and blockage of movable particles in the near-wellbore formation will be the main reason to cause the decline in the well’s geothermal reinjection capacity.

Author Contributions

Conceptualization, Z.Z. and G.Q.; methodology, Y.L.; software, S.G.; validation, Z.Z., L.Z.; formal analysis, L.Y.; investigation, R.W.; resources, Z.Z.; data curation, J.C.; writing—original draft preparation, S.G.; writing—review and editing, L.Z. All authors have read and agreed to the published version of the manuscript.

Funding

This research is supported by the Basic Research Program Project of Qinghai Province (No. 2020-ZJ-758) and the Special Fund on the Exploration of Clean Energy and Mineral Products in Qinghai Province (20181317146sh 007). It is also partially financed by the General Project of Natural Science Foundation of Shandong Province (ZR2020ME090). We also appreciate the reviewers and editors for their constructive comments to make the paper high quality.

Data Availability Statement

The data presented in this study are available.

Conflicts of Interest

The authors declare no conflict of interest.

Nomenclature List

CSPCaCO3 scaling particles
DRDire, Chinese abbreviation for “geothermal”
GWGeothermal water
mdMillidarcy, equivalent to 10−15 m2
PVPore volume
SKCPSuspended kaolin clay particles

References

  1. Liu, J. The status of geothermal reinjection. Hydrogeol. Eng. Geol. 2003, 30, 100–104, (In Chinese with English abstract). [Google Scholar]
  2. Ochi, J.; Vernoux, J.F. Permeability decrease in sandstone reservoirs by fluid injection: Hydrodynamic and chemical effects. J. Hydrol. 1998, 208, 237–248. [Google Scholar] [CrossRef]
  3. Lun, Z. Study on the blockage characteristics of reservoir pores due to suspension particles of injection water. J. Logist. Eng. Univ. 2006, 3, 30–33, (In Chinese with English abstract). [Google Scholar]
  4. Ma, Z.; Hou, C.; Xi, L.; Yun, H.; Sun, C. Reinjection clogging mechanism of used geothermal water in a super-deep-porous reservoir. Hydrogeol. Eng. Geol. 2013, 40, 133–139, (In Chinese with English abstract). [Google Scholar]
  5. Badalyan, A.; Carageorgos, T.; You, Z.; Schacht, U.; Bedrikovetsky, P.; Matthews, C.; Hand, M. A New Experimental Procedure for Formation Damage Assessment in Geothermal Wells. In Thirty-Ninth Workshop on Geothermal Reservoir Engineering; Stanford University: Stanford, CA, USA, 2014. [Google Scholar]
  6. Oliveira, M.A.; Vaz, A.S.; Siqueira, F.D.; Yang, Y.; You, Z.; Bedrikovetsky, P. Slow migration of mobilised fines during flow in reservoir rocks: Laboratory study. J. Pet. Sci. Eng. 2014, 122, 534–541. [Google Scholar] [CrossRef]
  7. Rosenbrand, E.; Haugwitz, C.; Jacobsen, P.S.M.; Kjøller, C.; Fabricius, I.L. The effect of hot water injection on sandstone permeability. Geothermics 2014, 50, 155–166. [Google Scholar] [CrossRef]
  8. You, Z.; Yang, Y.; Badalyan, A.; Bedrikovetsky, P.; Hand, M. Mathematical modelling of fines migration in geothermal reservoirs. Geothermics 2016, 59, 123–133. [Google Scholar] [CrossRef]
  9. Russell, T.; Pham, D.; Petho, G.; Neishaboor, M.T.; Badalyan, A.; Behr, A.; Bedrikovetsky, P. Kaolinite mobilisation in unconsolidated porous media: Effect of brine salinity and salt type Na and Ca salts. In Proceedings of the SPE-191922-MS SPE Asia Pacific Oil and Gas Conference and Exhibition, Brisbane, Australia, 23–25 October 2018. [Google Scholar]
  10. You, Z.; Badalyan, A.; Yang, Y.; Bedrikovetsky, P.; Hand, M. Fines migration in geothermal reservoirs: Laboratory and mathematical modelling. Geothermics 2019, 77, 344–367. [Google Scholar] [CrossRef]
  11. Carpenter, C. Study of Carbonate Reservoirs Examines Fines Migration in CO2-Saturated-Brine Flow. J. Pet. Technol. 2019, 71, 76–77. [Google Scholar] [CrossRef]
  12. Sun, P.; Song, H.; Qi, J.; Wang, J.; Xu, Z.; Yuan, M. Study on sand control techniques for loose sandstone geothermal wells in Guantao formation of Neogene. Sci. Technol. Innov. 2019, 201906, 12–14, (In Chinese with English abstract). [Google Scholar]
  13. Niknam, P.H.; Talluri, L.; Fiaschi, D.; Manfrida, G. Improved Solubility Model for Pure Gas and Binary Mixture of CO2-H2S in Water: A Geothermal Case Study with Total Reinjection. Energies 2020, 13, 2883. [Google Scholar] [CrossRef]
  14. Niknam, P.H.; Talluri, L.; Fiaschi, D.; Manfrida, G. Sensitivity analysis and dynamic modelling of the reinjection process in a binary cycle geothermal power plant of Larderello area. Energy 2021, 214, 118869. [Google Scholar] [CrossRef]
  15. Steefel, C.; Lasaga, A. A coupled model for transport of multiple chemical species and kinetic precipitation/dissolution reactions with application to reactive flow in single phase hydrothermal systems. Am. J. Sci. 1994, 294, 529–592. [Google Scholar] [CrossRef]
  16. Jafari, S.; Salmanzadeh, M.; Rahnama, M.; Ahmadi, G. Investigation of particle dispersion and deposition in a channel with a square cylinder obstruction using the lattice Boltzmann method. J. Aerosol Sci. 2010, 41, 198–206. [Google Scholar] [CrossRef]
  17. Ungemach, P. Reinjection of cooled geothermal brines into sandstone reservoirs. Geothermics 2003, 32, 743–761. [Google Scholar] [CrossRef]
  18. Rose, P.; Xu, T.; Kovac, K.; Mella, M.; Pruess, K. Chemical Stimulation in Near-Wellbore Geothermal Formations: Silica Dissolution in the Presence of Calcite at High Temperature and High pH. In Proceedings of the Thirty-Second Workshop on Geothermal Reservoir Engineering, Stanford University, Stanford, CA, USA, 22–24 January 2007. [Google Scholar]
  19. Ministry of Ecology and Environment of the People’s Republic of China. HJ 493-2009 Water Quality Sample—Technical Regulation of the Preservation and Handing of Samples; China Environmental Press: Beijing, China, 2009.
  20. Ministry of Geology and Mineral Resources of the People’s Republic of China. DZ/T 0064.1-80-1993 Groundwater Quality Inspection Method; Standards Press of China: Beijing, China, 1993.
  21. State Bureau of Petroleum and Chemical Industry of China. GB/T 5368-2000 Thin Section Examination of Rock; Standards Press of China: Beijing, China, 2000. [Google Scholar]
  22. Standardization Administration of China. GB/T 14505-2010 Method for Chemical Analysis of Rocks and Ores—General Rules and Regulations; Standards Press of China: Beijing, China, 2010.
  23. National Energy Administration of China. SY/T 5434-2018 Analysis Method for Particle Size of Clastic Rocks; Standards Press of China: Beijing, China, 2018.
  24. Yu, L.; Zhang, L.; Zhang, R.; Ren, S.R. Assessment of natural gas production from hydrate-bearing sediments with unconsolidated argillaceous siltstones via a controlled sandout method. Energy 2018, 160, 654–667. [Google Scholar] [CrossRef]
  25. Zhang, L.; Chao, J.; Geng, S.; Zhen, Z.; Chen, H.; Luo, Y.; Qin, G. Particle migration and blockage in geothermal reservoirs during water reinjection: Laboratory experiment and reaction kinetic model. Energy 2020, 206, 118234. [Google Scholar] [CrossRef]
  26. Standardization Administration of China. GB/T 29172–2012 Practices for Core Analysis; Standards Press of China: Beijing, China, 2012. [Google Scholar]
  27. Shi, J.; Gong, W.; Cao, W.; Xu, Y. A research into the damage mechanism of velocity-sensitivity in sandstone of a reservoir. J. Chengdu Univ. Technol. 2003, 30, 501–504, (In Chinese with English abstract). [Google Scholar]
  28. Miyamoto, M.; Ichikawa, H.; Fukumori, Y.; Akine, Y.; Tokuuye, K. Design and Preparation of Gadolinium-Reservoir Microcapsules for Neutron-Capture Therapy by Means of the Wurster Process. Chem. Pharm. Bull. 1997, 45, 2043–2050. [Google Scholar] [CrossRef] [Green Version]
  29. Larsen, T.; Lioliou, M.; Ostvold, T.; Josang, L.; Randhol, P. Kinetics of CaCO3 scale formation during core flooding. In Proceedings of the SPE-114045-MS SPE International Oilfield Scale Conference, Aberdeen, UK, 28–29 May 2008. [Google Scholar]
  30. Ma, L.; Li, X.; Tan, J.; Cai, Y.; Ma, Y. Experimental study on dissolution of carbonate and scaling tendency of formation water in CO2 flooding. J. Xi’an Shiyou Univ. 2016, 31, 68–72, (In Chinese with English abstract). [Google Scholar]
  31. Xu, G.; Ma, Z.; Zhou, X.; Xi, L.; Sun, C. Study on the mechanism of chemical clog for the recharging of geopressured thermal water--taking the recharging well No. 1 in Xianyang as the example. Geotech. Investig. Surv. 2013, 41, 40–44, (In Chinese with English abstract). [Google Scholar]
  32. Brown, C.A.; Compton, R.G.; Narramore, C.A. The Kinetics of Calcite Dissolution/Precipitation. J. Colloid Interface Sci. 1993, 160, 372–379. [Google Scholar] [CrossRef]
  33. Moghadasi, J.; Jamialahmadi, M.; Muller-Steinhagen, H.; Sharif, A. Formation damage due to scale formation in porous media resulting from water injection. In Proceedings of the SPE-86524-MS SPE International Symposium and Exhibition on Formation Damage Control, Lafayette, LA, USA, 17–28 February 2004. [Google Scholar]
  34. Lu, Y.; Du, X.; Chi, B.; Yang, X.; Li, S.; Wang, Z. The porous media clogging due to suspended solid during the artificial rechange of groundwater. J. Jilin Univ. 2011, 41, 448–453, (In Chinese with English abstract). [Google Scholar]
  35. Zhou, X. Reinjection Plugging Mechanism Researching of Sedimentary Basin Type Porous Geothermal Water—As the Reinjection Well in Sanqiao of Xi’an for an Example; Chang’an University: Xi’an China, 2013; (In Chinese with English abstract). [Google Scholar]
  36. Wang, L. A Study of Geothermal Reinjection in the Guantao Reservoir in Tianjin; China University of Geosciences: Beijing, China, 2014; (In Chinese with English abstract). [Google Scholar]
  37. Wu, J.; Zhang, J.; Li, X.; Shi, F.; Zhang, P.; Bai, M. Experiment on artificial pressure re-injection of geothermal water in Xi’an suburb. J. Water Resour. Water Eng. 2014, 25, 215–218, (In Chinese with English abstract). [Google Scholar]
  38. Seibt, P.; Kellner, T. Practical experience in the reinjection of cooled thermal waters back into sandstone reservoirs. Geothermics 2003, 32, 733–741. [Google Scholar] [CrossRef]
  39. Xu, T.; Pruess, K. Numerical Simulation of Injectivity Effects of Mineral Scaling and Clay Swelling in a Fractured Geothermal Reservoir; Lawrence Berkeley National Lab (LBNL): Berkeley, CA, USA, 2004. [Google Scholar]
  40. Sandrine, P.; Francois, V.; Patrick, N. Chemical stimulation techniques for geothermal wells: Experiments on the three-well EGS system at Soultz-sous-Forêts, France. Geothermic 2009, 38, 349–359. [Google Scholar]
Figure 1. Geological map of geothermal well DR2018 in Xining Basin.
Energies 14 02671 g001
Figure 2. Typical full-size cores and standard-size cores sampled at eight depths in well DR2018.
Energies 14 02671 g002
Figure 3. Size distribution of suspended particles in the geothermal water of well DR2018.
Energies 14 02671 g003
Figure 4. Polarizing microscopic images of thin sections of rock samples in well DR2018.
Energies 14 02671 g004
Figure 5. Mineral compositions of rock samples in well DR2018.
Energies 14 02671 g005aEnergies 14 02671 g005b
Figure 6. Grain size distributions of rock samples in well DR2018.
Energies 14 02671 g006aEnergies 14 02671 g006b
Figure 7. Correlation between permeability and porosity of rock samples in well DR2018.
Energies 14 02671 g007
Figure 8. Core flooding equipment.
Energies 14 02671 g008
Figure 9. Influence of water flow rate (velocity) on core permeability.
Energies 14 02671 g009
Figure 10. Comparison of produced water at different flow rates in Case 1.
Energies 14 02671 g010
Figure 11. Fitting results of permeability function (Case 1).
Energies 14 02671 g011
Figure 12. Influence of injected water salinity on core permeability.
Energies 14 02671 g012
Figure 13. Influence of confining pressure on core permeability.
Energies 14 02671 g013
Figure 14. Influence of scaling particle concentration on core permeability (cases 11–16).
Energies 14 02671 g014
Figure 15. The influence of suspended particle concentration on core permeability (cases 17–20).
Energies 14 02671 g015
Figure 16. Pumping and reinjection tests in well DR2018.
Energies 14 02671 g016
Table 1. Properties of the geothermal water in well DR2018.
ParameterValueParameterValueParameterValue
K+, mg/L73.10Li, mg/L0.56Rn, Bq/L<0.01
Na+, mg/L12,328.00Sr, mg/L15.57Metaboric acid, mg/L13.68
K+ + Na+, mg/L12,401.10Zn, mg/L0.04Salinity, mg/L36,005.20
Ca2+, mg/L284.10Se, mg/L<0.02H2SiO3, mg/L43.21
Mg2+, mg/L71.00As, mg/L<0.02Free CO2, mL/L23.3
Cl, mg/L9745.8Hg, mg/L<0.02pH7.56
SO42, mg/L12,122.94Cd, mg/L<0.02Total alkalinity, mg/L2262.79
HCO3, mg/L1380.30B, mg/L1.78Total hardness, mg/L1001.23
CO32, mg/L0.00Ag, mg/L<0.02Suspended particles, mg/L122
NH4+, mg/L2.36Ba, mg/L0.1Dissolved gas, mL/L214
Fe2+, mg/L<0.02Pb, mg/L<0.02CO2 in dissolved gas, mol%61.47
Fe3+, mg/L<0.02Mo, mg/L0.11H2S in dissolved gas, mol%10.34
F, mg/L0Cu, mg/L<0.02CH4 in dissolved gas, mol%14.82
NO3, mg/L25.15Mn, mg/L0.15
Cr6+, mg/L<0.02Al, mg/L0.04
Table 2. Pore throat sizes and movable particle contents of rock samples in well DR2018.
Grain SizeSample Depth, m76482188211301433148715411602
>100 μm
(as skeleton)
Average particle diameter, μm503.84431.55399.54396.12398.25400.18399.09158.59
Max. pore throat, μm208.59178.66165.41163.99164.88165.68165.2265.66
Min. pore throat, μm77.9466.7661.8161.2861.6161.9161.7424.53
<100 μm
(with movable tendency)
Small grain content, wt %17.5414.3022.6820.8819.287.6823.4216.59
<1/2 pore throat particles, wt %17.5410.5119.3312.8718.947.6723.420.18
1/2–1/5 pore throat particles, wt %16.319.3417.7711.5118.877.6023.220.11
<1/5 pore throat particles, wt %1.231.181.561.360.070.070.200.07
Table 3. Experimental scheme of core flooding experiment for blockage risk assessment.
CaseInjection FluidInjection Rate, mL/minConfining Pressure, MPaCoreInitial K, mdPorosity, %Purpose
1DR20180.1–6141130–120.897.82The influence of injection rate
20.1–6141130–132.4614.19
30.5141130–177.076.53
40.1141130–111.26.97
5DR2018 + distilled water0.5 (0–100%)141130–163.6210.86The influence of salinity
60.5 (0–100%)141130–144.547.25
70.5 (0–100%)141130–153.8310.64
8DR20180.514–251130–102.0612.15The influence of confining pressure
90.514–251130–42.469.36
100.514–251130–63.079.46
11DR2018 + NaHCO3 + CaCl20.5 (150 mg/L)141130–187.237.52The influence of scaling particles
120.5 (300 mg/L)141130–196.838.71
130.5 (350 mg/L)141130–227.2511.99
140.5 (450 mg/L)141130–233.529.86
150.5 (800 mg/L)141130–208.208.86
160.5 (1000 mg/L)141130–212.679.92
17DR2018 + kaolin clay particles0.5 (1000 mg/L)141130–76.566.55The influence of suspended particles
180.5 (1500 mg/L)141130–34.8113.4
190.5 (2000 mg/L)141130–24.7326.38
200.5 (2500 mg/L)141130–53.429.87
Table 4. Comparison of CaCO3 concentration between experiments and theoretical calculation.
In the ExperimentsCalculated by OLIstudio ScaleChem
CaseCaCl2, mol/LNaHCO3, mol/LCaCO3 Scaling Concentration, mg/LCaCO3 Scaling Concentration, mg/L
110.00470.0092150.00166.30
120.00660.0129300.00293.43
130.00750.0147350.00360.25
140.00880.0174450.00460.06
150.01370.0270800.00838.16
160.01620.03191000.001036.01
Publisher’s Note: MDPI stays neutral with regard to jurisdictional claims in published maps and institutional affiliations.