Article

Effect of Phase Change Materials on the Thermal Performance of Residential Building Located in Different Cities of a Tropical Rainforest Climate Zone

Department of Civil and Environmental Engineering, School of Engineering and Digital Sciences, Nazarbayev University, Nur-Sultan 010000, Kazakhstan
*
Author to whom correspondence should be addressed.
Energies 2021, 14(9), 2699; https://doi.org/10.3390/en14092699
Submission received: 22 March 2021 / Revised: 10 April 2021 / Accepted: 26 April 2021 / Published: 8 May 2021
(This article belongs to the Section G: Energy and Buildings)

Abstract

:
This study aims to investigate the thermal performance of PCM and PCM combined with nighttime natural (NV) and mechanical ventilation (MV) applied to a residential building located in eight cities of tropical rainforest climate zone (Af). The analysis was accomplished using numerical simulations and developing a unique methodology for selecting the PCM melting temperature based on the thermal comfort limits. The thermal performance of the PCM integrated building was quantitatively evaluated using the concept of peak temperature drop. Additionally, a novel indicator of Total Temperature Drop (TTD) was introduced to determine the overall impact of the PCM and PCM combined with NV/MV on the thermal comfort conditions inside the building. The results showed that PCM 28 was the most efficient in improving the thermal performance of the building located in the Af climate zone, achieving a TTD of up to 356 °C per year. The usage of PCM 28 combined with nighttime natural ventilation improved the TTD values by up to 15%, whereas the integration of PCM 28 combined with mechanical ventilation resulted in a TTD values increase of up to 45%. Conclusively, mechanical ventilation showed its superiority over natural ventilation in the tropical rainforest climate, and PCM 28 applied together with mechanical ventilation could be used as the optimum combination for the whole climate zone.

1. Introduction

Due to fast-growing economic development and high living standards, a considerable increase in energy consumption can be observed worldwide. According to energy consumption reports, around 80% of the global energy consumed comes from fossil fuel combustion [1], which is the primary source of carbon dioxide emissions, significantly contributing to environmental pollution and climate change. The building sector is one of the main energy consumers and contributors to carbon dioxide emissions worldwide. It is responsible for over one-third of the final global energy consumption and 40% of global CO2 emissions [2]. There are predictions that the amount of energy consumed by the building sector will keep on increasing due to more frequent use of energy-consuming devices, better access to energy in developing countries, and the growing construction of buildings worldwide [2]. Therefore, to reduce energy consumption and CO2 emissions, it is crucial to develop renewable energy resources and adopt energy-efficient building designs. In recent years, PCM has attracted many researchers’ attention as a potential tool for passive heating and cooling applications. PCMs represent a type of thermal energy storage materials that possess a large amount of energy during their phase change process [3,4]. With their extensive latent heat storage capacity, they increase the building’s thermal mass, making the indoor temperature more stable [5,6].
There are numerous studies about the thermal performance of PCM-integrated buildings in different climates of the world [7,8,9,10]. For example, Zhou et al. [7] numerically analyzed the effect of the shape-stabilized PCM (SSPCM) plates incorporated into the walls and ceiling on the inside temperature of a building located in Beijing, China. The authors revealed that varying thermophysical properties of SSPCM and incorporating daytime natural ventilation and nighttime mechanical ventilation reduced the indoor maximum temperature by up to 2 °C. Alam et al. [8] conducted a comparative analysis of passive and free cooling application methods of PCM integration into the building. The numerical study undertaken for Melbourne’s climate demonstrated that the passive method of integration of BioPCM reduced the indoor maximum temperature by up to 0.44 °C, and a free cooling application of PCM resulted in a peak temperature reduction of up to 2.63 °C. The effectiveness of applying PCM together with natural ventilation was analyzed by Zhang et al. [9]. The authors evaluated the effect of PCM combined with natural ventilation on the building’s energy efficiency and thermal performance in five cities of China. The study results suggested that, in comparison with daytime ventilation, the nighttime ventilation was more effective in improving the thermal performance of the building integrated with PCM. The authors concluded that a higher air change rate of ventilation resulted in better thermal performance of PCM. Evola et al. [10] studied the impact of PCM on the thermal performance of the lightweight building during summertime for the climate of Chambery, France. The results showed that the application of the PCM notably improved thermal conditions inside the building, achieving a peak temperature reduction of up to 0.9 °C. Jamil et al. [11] examined the PCM’s thermal performance applied to a building located in Melbourne, Australia. The authors conducted both experimental and numerical analyses. The data obtained showed that the incorporation of the PCM resulted in an inside temperature decrease of up to 1.1 °C. Additionally, based on the results obtained, it was concluded that the incorporation of natural nighttime ventilation considerably enhanced the performance of the PCM. Li et al. [12] numerically investigated the impact of a PCM-integrated roof on a building’s thermal performance located in Northeast China. Based on the data obtained, the authors revealed that a PCM application to the roof significantly affected the thermal comfort conditions, shifting the peak temperature by up to 3 h. In the study by Ahangari and Maerefat [13], about PCM-integrated buildings located in different climates of Iran, the authors proposed a double-PCM layer system as an innovative solution for improving both the thermal and energy performances. The results demonstrated that the double-layer PCM system notably improved the thermal comfort conditions, increasing the duration of the thermal comfort by up to 20% for the hot climate. Ramakrishnan et al. [14] analyzed the effectiveness of PCM in reducing the heat stress risk during heatwave periods for the climate of Melbourne, Australia. The data showed that a combination of PCM and natural ventilation could reduce the duration of severe discomfort by up to 65% during summer heatwave periods. In another study, Ramakrishnan et al. [15] evaluated the effectiveness of PCM-integrated composites in improving the thermal comfort conditions inside a building located in Melbourne, Australia. The data obtained revealed that the incorporation of the PCM helped to reduce the indoor peak air temperature by up to 2.8 °C. Sage-Lauck and Sailor [16] conducted both experimental and numerical studies to evaluate the thermal comfort conditions of a PCM-integrated building for the climate of Oregon, USA. The authors revealed that the application of the PCM helped to reduce the annual overheated hours from 400 h to 200 h. Figueiredo et al. [17] experimentally and numerically studied the impact of the PCM on the thermal comfort inside the building with a geothermal system linked to the air conditioning system for the climate of Aviero, Portugal. The results showed that the application of the PCM resulted in an overheating reduction of 7.23%, showing the PCM efficiency of 35.49%. Gao et al. [18] studied the thermal performance of the PCM-filled hollow concrete bricks for the climate of Qingdao City, China. The results obtained revealed that the application of the optimum PCM reduced the attenuation rate of the inside surface temperature from 13.07% to 0.92–1.93%. Liu et al. [19] numerically studied the double glazing unit’s thermal performance filled with PCM in Northeast China over the winter period. The authors conducted a parametric study varying the thickness and melting temperature of the PCM. The results showed that varying the PCM thickness from 4 mm to 50 mm increased the inside surface temperature by 158.7%. The authors concluded that PCMs with melting temperatures in the range of 14–16 °C and thicknesses of 12–30 mm were optimum for Northeast China’s climate. Triano-Juarez et al. [20] numerically studied the thermal performance inside a building with a PCM-integrated roof in a city in Mexico over a typical summer week. The results showed that, for a grey roof, the incorporation of a 2-cm layer of PCM 35 resulted in a decrease of the interior surface temperature by 6.4 °C, while, for a white roof, it was up to 15.4 °C. Dnyandip et al. [21] numerically investigated the thermal performance of a residential building roof integrated with inclined-phase change material for the climate conditions of Chennai, India. The study results showed that a PCM-integrated roof kept the ceiling temperature in the range from 25.5–27.5 °C and notably reduced the peak heat loads compared to no PCM case. Omari et al. [22] developed a model to study the PCM composite board’s thermal performance in a building’s walls for different seasons. The authors highlighted the importance of selecting the appropriate PCM melting temperature and concluded that the PCM composite wall boards demonstrating the best performance over the summer were the least effective in the winter season. Saffari et al. [23] tried to determine the optimum PCM melting temperature to decrease the energy demand of buildings for different climate conditions of the world. For the Af climate zone, the authors selected three cities: Kuala Lumpur (Malaysia), Singapore, and Puerto Barrios (Guatemala). The results demonstrated that the integration of PCM reduced the cooling demand of a building located in the Puerto Barrios (8% reduction); however, it was ineffective in Singapore (0.43%) and Kuala Lumpur (0.36%). Marin et al. [24] evaluated the PCM’s potential to decrease the cooling and heating loads for a lightweight relocatable building. The analysis was conducted for all climate zones, including a tropical rainforest climate. Similar to the study of Saffari et al. [23], the authors found that the utilization of PCM under tropical climate conditions was limited and required further investigation. Lei et al. [25] investigated the impact of the PCM on the thermal comfort and energy consumption of a building located in the tropical climate of Singapore. The results showed that the application of the PCM with a melting temperature of 28 °C resulted in the largest energy savings of up to 32%. According to the authors, in the tropical climate, PCM cannot go through a full melting–solidification cycle due to the low diurnal temperature fluctuation and high temperatures during nighttime. However, the tropics’ main advantage for PCM application over the other climates is the uniform weather conditions throughout the year. Thus, unlike other climates where the optimum PCM is selected for each season, the uniqueness of the tropical rainforest climate is the opportunity to select one optimum PCM for the whole year. The results of the study demonstrated that, by thoroughly selecting simulation parameters, PCM could significantly improve the energy consumption of the building located in the Af climate zone.
According to the literature review mentioned above, some research gaps can be noticed. Firstly, there is a lack of studies about the thermal performance of a PCM-integrated building in the tropical rainforest climate (Af climate zone). Secondly, there is a lack of studies about the impact of natural and mechanical ventilation on the thermal performance of a PCM building located in the Af climate zone. Therefore, this study aims to evaluate the thermal performance of buildings integrated with PCM and PCM combined with natural and mechanical ventilation located in eight cities of Af climate zone: Singapore, Kuala Lumpur, Malacca (both Malaysia), Padang (Indonesia), Davao (Philippines), Belem (Brazil), Iquitos (Peru) and Georgetown (Guyana), developing a unique methodology for selecting the PCM melting temperature based on the thermal comfort limits. The quantitative evaluation of the thermal performances of the PCM-integrated buildings was accomplished through a daily peak temperature drop analysis. To assess the overall impact of the PCM and PCM combined with NV/MV on the thermal performances inside the buildings, a novel indicator of the Total Temperature Drop (TTD), representing a sum of all decreases in the maximum daily operative temperature throughout the year, was introduced. A comparative analysis of the PCM, PCM+NV and PCM+MV was accomplished.

2. Methodology

In this study the impact of PCM on the thermal performance of two-story residential buildings was investigated for different cities of Af climate zone. The analysis was accomplished using numerical simulations in Design Builder software. Figure 1 represents the detailed methodology of the study.

2.1. Climate Characteristics

According to the Köppen-Geiger climate classification, Af represents a tropical rainforest climate with average precipitation of at least 60 mm in each month [26]. It is characterized by comparatively uniform outside air temperature throughout the year, with the average monthly air temperature exceeding 20 °C for all months [27].
For the analysis, eight cities in the Af climate zone were selected. These cities were Singapore, Kuala Lumpur, Malacca, Padang, Davao, Belem, Iquitos and Georgetown. Figure 2 illustrates the location of the Af climate zone on the world map and the eight cities selected for analysis.

2.2. Building Description

For analysis, a two-story pitched roof residential building with a total living space area of 72 m2 was selected. The area of each floor was 36 m2 (9 m × 12 m). The height of each story was 3 m. The door was placed on the northern side of the building, and windows with dimensions of 2 m × 1.5 m and 2.5 m × 1.5 m were placed 0.8 m above the floor level. Figure 3 presents the details of the building envelope, while Table 1, Table 2 and Table 3 summarize the material properties of the wall roof and floor composition. Following the guidelines provided by Lei et al. [25], it was decided to place the PCM layer closer to the outermost layer.
The occupancy schedule was set from 16:00 to 8:00 h, assuming that residents were going to be at work during the daytime. During the weekends, the building was assumed to be occupied for the whole day. The infiltration rate was set to 0.5 ACH.

2.3. Thermal Comfort Limits and PCM Selection

Thermal comfort represents the conditions of human’s satisfaction with the thermal environment. ASHRAE developed formulas to calculate the thermal comfort range inside a building in accordance with the climate conditions of its location. The adaptive thermal comfort approach is based on a large number of surveys conducted by the agency and allows predicting a comfortable temperature range with 80% and 90% acceptance rates [30]. In this study, the formulas of thermal comfort range with an 80% acceptance rate developed by Auliciems and Szokolay [31] were used:
T n e u = 21.5 + 0.11 × T m e a n  
where T m e a n stands for the average temperature for the selected period, and T n e u stands for the neutral temperature, which is further used to calculate the thermal comfort limits:
T m a x = T n e u + 2   ° C
T m i n = T n e u 2   ° C  
where T m a x stands for the upper-temperature limit of the thermal comfort range, and T m i n stands for the lower temperature limit of the thermal comfort range. For developing the thermal comfort range, the monthly temperature data was used.
Both the upper-temperature and lower-temperature limits of the thermal comfort were determined for the selected cities. However, for a comparative analysis of the cities, it was necessary to determine a thermal comfort range that would be suitable for all the cities. In this regard, it was decided to use a simple sorting algorithm to select a single comfort range for the whole tropical region (Equations (7) and (8)).
First, for each city, for each month, the minimum and maximum temperature limits were calculated. Then, for each city, one maximum and one minimum temperature limit was determined. The maximum temperature limit for the city T m a x c i t y   represents the minimum value of the monthly upper-temperature limit values. The minimum temperature limit for the city T m i n c i t y   represents the maximum value of the monthly lower-temperature limit values. The maximum temperature limit for all the cities T m a x g l o b a l represents the minimum value of the maximum temperature limits determined for each city. The minimum temperature limit for all the cities T m i n g l o b a l represents the maximum value of the minimum temperature limits determined for each city.
T m a x g l o b a l = m i n T m a x c i t y 1   = m i n T m a x J a n u a r y T m a x D e c e m b e r   T m a x c i t y 8   = m i n T m a x J a n u a r y T m a x D e c e m b e r
T m i n g l o b a l = m a x T m i n c i t y   1 = m a x T m i n J a n u a r y T m i n D e c e m b e r   T m i n c i t y 8   = m a x T m i n J a n u a r y T m i n D e c e m b e r
T m a x c i t y   n   and T m i n c i t y   n stand for maximum and minimum temperature limits of the thermal comfort of a particular city ( ° C ), respectively; T m a x g l o b a l and T m i n g l o b a l stand for the global maximum and minimum temperature limits of the thermal comfort ( ° C ), respectively. The thermal limits of each city and global thermal limits are presented in Figure 4.
As it has already been mentioned, establishing the thermal comfort limits for the model allows determining the optimum PCM melting temperatures. For the present study, it was found that the thermal comfort range for all cities was within the 22.68–26.37 °C range. Additionally, in the study of Lei et al. [25], the authors claimed that, for the climate of Singapore, the utilization of PCM 28 was the best option. Thus, considering the global thermal limits and the recommendation from reference [25], it was decided to select three PCMs at a regular interval: PCM 22, PCM 25 and PCM 28.

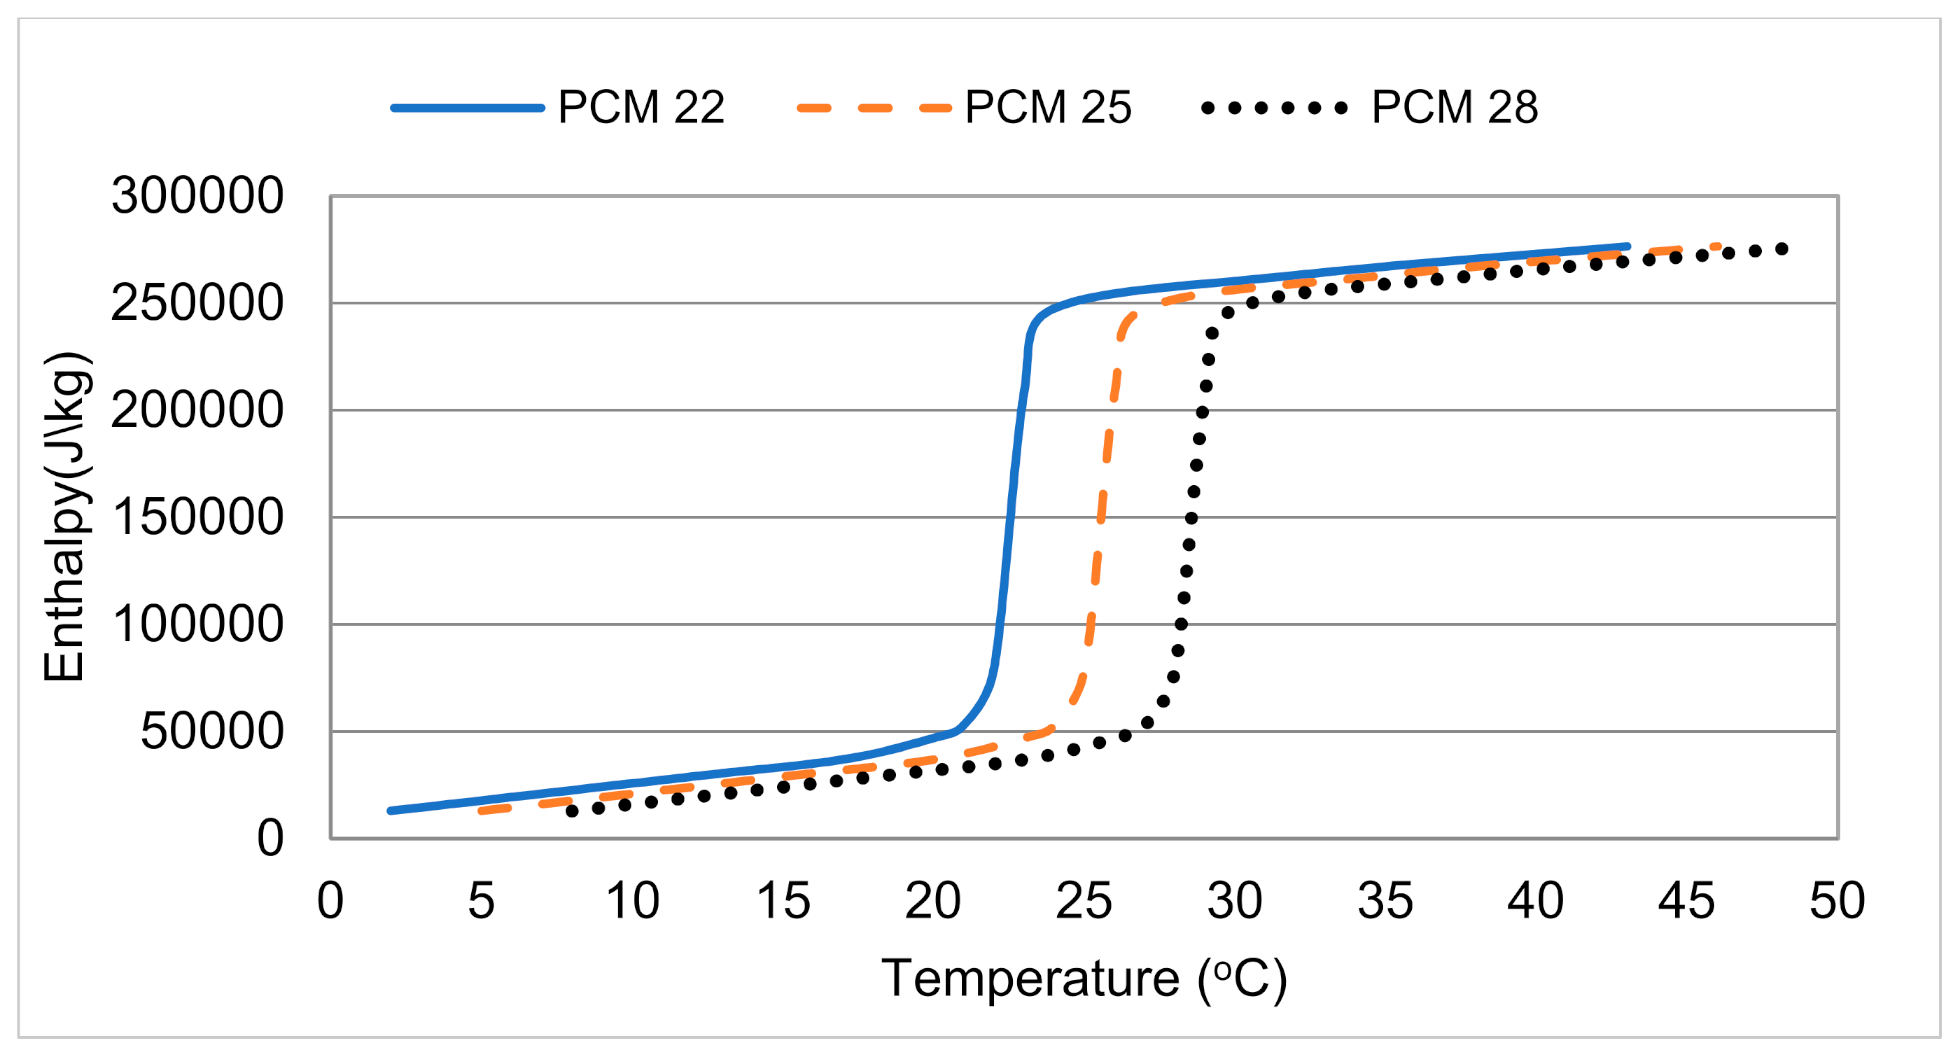
2.4. Characterization of PCM

To investigate the impact of the PCM on the thermal performance of the building, the HVAC system was switched off. PCM was applied in the form of a layer to the building envelope using Design Builder software. The selected type of PCM has a thermal conductivity of 0.2 W/mK, a density of 860 kg/m3, specific heat of 1970 J/kgK and latent heat of 219 kJ/kg. [32]. For analysis, PCMs with the melting temperature of 22 °C, 25 °C and 28 °C were used. Each PCM has a phase change temperature range of 4 °C, so that, for PCM 22, the melting temperature ranges from 20 °C to 24 °C, for PCM 25, it ranges from 23 °C to 27 °C and, for PCM 28, it ranges from 26 °C to 30 °C. Figure 5 shows the enthalpy–temperature curves for the selected PCMs (PCM 22, PCM 25 and PCM 28).

2.5. Energy Plus and Design Builder

The numerical analysis was accomplished by means of Design Builder software using the Energy Plus simulation engine. The Energy Plus software provides a wide range of simulation options for a building’s energy analysis, such as cooling, heating, lighting and ventilation load analysis [33]. In order to simulate materials with changing properties such as the PCM, a one-dimensional conduction finite-difference algorithm, also known as “CondFD”, was used. The heat transfer equation based on the fully implicit scheme is as follows:
ρ C p Δ x T i t + 1 T i t   Δ t = k i + 1 t + 1 + k i t + 1 2 × T i + 1 t + 1 T i t + 1 Δ x + k i 1 t + 1 + k i t + 1 2 × T i 1 t + 1 T i t + 1 Δ x
where t stands for time (t+1 is a new iteration time), 1, i stands for a meshed node, (i−1 is an adjacent exterior node and i+1 is an adjacent interior node), ρ stands for the density of the selected materials (kg/m3), C p stands for the specific heat (kJ/kgK), T stands for the temperature of the node (K), Δ t stands for the time step (s), which is selected to be 2 min, k stands for the thermal conductivity (kW/mK) and Δ x stands for the nodal step (m).
The nodal step is calculated using the following formula:
Δ x = c   · α · Δ t
where c stands for the space discretization constant, which is selected to be 3, and α stands for thermal diffusivity of the materials (mm2/s).
To simulate the phase change process of the material, the CondFD algorithm is used together with the enthalpy–temperature curve of the PCM provided by the user. The value of equivalent specific heat for each time step is calculated in accordance with the enthalpy–temperature curve and is represented by the following formula:
C P = h i t h i t 1 T i t T i t 1
where h stands for the specific enthalpy (kJ/kg).
For a detailed simulation of the PCM in EnergyPlus, Tabasre-Valesco et al. [34] gave some recommendations about the simulation parameters. The values of the time step should be no more than 3 min. Therefore, for this study, a time step of 2 min ( Δ t = 2 min) was used. The space discretization constant is recommended to be equal to 3.

2.6. Validation

In order to verify the reliability of Energy Plus in analyzing the PCM implementation, numerical and analytical solutions to Stephan’s problem described in the study of Tabares-Velasco et al. [34] were repeated. Figure 6 summarizes the results of both the numerical and analytical solutions to Stephan’s problem. According to the data presented, it can be noticed that both solutions are in good agreement. The numerical model could accurately predict the heat flux with a Root Mean Square Error of 18.1 W/m2.

2.7. Evaluation of the Thermal Performance

Initially, the impact of the PCM on the thermal performance of the building was studied using the concepts of daily peak temperature drop and Total Temperature Drop (TTD). Thereafter, the effect of the PCM combined with natural and mechanical ventilation was investigated using the same thermal performance indicators: daily peak temperature drop and TTD.

2.7.1. Daily Peak Temperature Drop

The daily peak temperature drop represents the change in the diurnal inside operative temperature with the integration of PCM. It can be expressed using the following formula:
Δ T d a i l y   m a x   = T d a i l y   m a x   w i t h o u t   P C M   T d a i l y   m a x   w i t h   P C M  
where Δ T d a i l y   m a x   stands for the diurnal peak temperature drop, T d a i l y   m a x   w i t h o u t   P C M   stands for the maximum daily operative temperature with no PCM and T d a i l y   m a x   w i t h   P C M   stands for the maximum daily operative temperature with the integration of PCM. For the quantitative evaluation of the thermal performance of the building over the studied period, the daily peak temperature drop values were classified into six groups, as shown below. It is important to mention that the group of negative values of the peak drop represents the cases when the application of PCM increased the maximum diurnal operative temperature.
G r o u p   1 :             Δ T d a i l y   m a x < 0   ° C
G r o u p   2 :             0   ° C Δ T d a i l y   m a x < 0.5   ° C
G r o u p   3 :             0.5   ° C Δ T d a i l y   m a x < 1   ° C
G r o u p   4 :               1   ° C Δ T d a i l y   m a x < 1.5   ° C
G r o u p   5 :             1.5   ° C Δ T d a i l y   m a x < 2   ° C
G r o u p   6 :               2   ° C Δ T d a i l y   m a x < 2.5   ° C

2.7.2. Total Temperature Drop

The quantitative analysis of the daily peak temperature drop allows determining the number of days when the peak temperature drop fell within the specified temperature range. However, this concept does not allow evaluating the overall annual impact of the PCM on the thermal performance. Therefore, in order to determine the annual thermal performance and select the best PCM melting temperature, a novel indicator of the Total Temperature Drop (TTD) was introduced. The Total Temperature Drop (Reduction) (TTD) represents a sum of all the maximum daily operative temperature reductions throughout the year. The TTD can be expressed by the following formula:
T T D = 1   d a y 1   y e a r ( T d a i l y   m a x   w i t h o u t   P C M T d a i l y   m a x   w i t h   P C M   )
This single value indicator shows how much the temperature can be reduced through the integration of the PCM to the building envelope. The higher TTD value stands for the better performance of the PCM. There are days when PCM integration has a negative impact on the thermal conditions inside the modeled building by increasing the indoor peak operative temperature. The negative values of the temperature change are considered in the TTD. The TTD is measured in °C.

2.8. Ventilation

In Design Builder Software, there are two methods to model natural ventilation: scheduled and calculated [35]. For the scheduled natural ventilation approach, the airflow rate, which involves the airflow coming through the outer windows and doors, is set for each zone, and the natural ventilation is activated only over the specified schedule [35]. This method is useful for the cases when the airflow rate for each zone is known; otherwise, it is less accurate. For the calculated natural ventilation, the values of the airflow rate are calculated in accordance with the dimensions of the openings and wind speed [35]. This approach is more realistic in comparison with the scheduled natural ventilation, since the airflow rate is calculated for each zone of the building based on the dimensions of the openings and outside climate conditions. Therefore, for this study, the calculated natural ventilation approach was applied. Since the effectiveness of the calculated natural ventilation method directly depends on the outside weather conditions, it is worth mentioning that, sometimes, NV may negatively affect the inside thermal conditions. For example, in the cases when the outside air temperature is hotter than the inside air temperature, the application of natural ventilation may result in overheating of the room. Therefore, to avoid the heat flow from the outside environment to the building, natural ventilation operated only when the outside temperature was 2 °C (or more) lower than the inside temperature (Tin–Tout ≥ 2 °C). Natural ventilation was applied over the nighttime from 19:00 to 07:00 h. The opening area was set to 5% of the window area.
Mechanical ventilation is a process of circulating fresh air inside the building using ducts and fans. In Design Builder software, mechanical ventilation is modeled by setting the value of the constant airflow rate and operation schedule [36]. For this study, the airflow rate of 4 ACH was used. The working hours of mechanical ventilation were set in accordance with the occupancy schedule from 16:00 to 08:00 h to prevent the flow of the hot air from the outside environment to the building in periods of heatwave events. This option involves the condition stating that, for initiating the mechanical ventilation process, the indoor air temperature should be at least 2 °C lower than the outside air temperature. In case the condition was not satisfied, the mechanical ventilation would be switched off. Ventilation models used for the simulations are presented in the schematic drawing below (Figure 7).

3. Results

3.1. Impact of PCM the Thermal Performance

In this section, the results of the evaluation of the impact of the PCM on the daily peak temperature drop and Total Temperature Drop (TTD) for all eight cities are presented. Figure 8 summarizes the results of the maximum temperature drop and TTD values for all the cities. According to the data presented, it is seen that, in all the cities, the PCMs decreased the peak operative temperature for most of the days. However, in all the cities, PCM 28 showed a more efficient performance, resulting in a higher number of days when the maximum temperature was reduced by the value in the range from 1.5 °C to 2.5 °C. Additionally, from Figure 8, it is seen that, in all the cities, compared with PCM 22 and PCM 25, the usage of PCM 28 resulted in a higher TTD value of up to 356 °C per year. The superiority of PCM 28 is related to the region’s hot climate conditions, which are more suitable for PCM 28 to complete the phase change cycle. Since the temperature reached high values even at nighttime, the PCM with a higher melting temperature could solidify more frequently in comparison with PCMs with lower melting temperatures.
The results presented in Figure 8 demonstrate that the utilization of PCM increases the maximum temperature of the day. According to the data, in the majority of the cities, a peak temperature rise ( Δ T d a i l y   m a x < 0 ° C ) was observed during less than 5% of the studied period. However, in Iquitos and Georgetown, the application of the PCM resulted in higher values of temperature rise ( Δ T d a i l y   m a x < 0 ° C ). For Iquitos, the integration of PCM 28 to the building envelope increased the daily maximum temperature for 25 days, which is about 7% of the year, and in Georgetown, it was increased for 67 days (18%).
To explain this difference in results, two separate days with the positive and negative impacts of the PCM on the peak temperature were examined. The days with a positive impact of the PCM were termed as “positive days”, whereas days with a negative impact of the PCM were termed as “negative days”. The values of outside air temperature and the hourly inside operative temperature for the cases when the building was without PCM and when it was with PCM 28 during positive and negative days on the peak operative temperature for the city of Georgetown are summarized in Figure 9. According to the results obtained, during the positive day, the inside operative temperature fluctuation was in the range of 26–28.76 °C, while the outside air temperature varied from 23.5 °C to 29 °C. On a negative day, the inside operative temperature fluctuation was from 24 °C to 25.18 °C, whereas the outside air temperature was from 23.2 °C to 26 °C. Thus, it was seen that, during the day, with a positive impact of the PCM, the outside temperature conditions and, as a result, indoor thermal conditions were favorable for PCM 28 to complete its melting–solidification cycle. In contrast, during a negative day, the outside temperature and inside temperature were not favorable for the PCM 28 to completely go through the melting–solidification cycle. Therefore, most of the time, PCM 28 was in a solid state, serving as an additional thermal mass applied to the building envelope. The additional thermal mass resulted in the heating of the building during the daytime and the inability to release the heat over the nighttime. The above statement explains the occasional negative effect of PCM on the daily maximum temperature. The fact that the cities of Iquitos and Georgetown had the highest percentages of negative days in comparison with the other cities is related to the climate conditions of these two cities. According to the weather data, these two cities are characterized by comparatively lower average outside temperatures in comparison with the other cities. For Iquitos and Georgetown, the average outside temperatures for the whole year were 25.68 °C and 26.08 °C, respectively, whereas the average temperatures for the rest of the cities were in the range of 26.7–27.8 °C. This means that, in general, in these cities (Iquitos and Georgetown), the ambient temperatures throughout the day were low. Consequently, the number of days when PCM could go through the melting–solidification cycle was less in comparison with the other cities. This statement explains why these cities were characterized by the highest number of days with a negative performance of PCM 28.

3.2. Impact of PCM Combined with Ventilation Techniques on the Thermal Performance

Several studies [8,9,10,11,14,37,38,39] have shown that the application of ventilation over the nighttime could significantly enhance the performance of the PCM in terms of improving the thermal comfort inside the building. Since, in the previous sections, PCM 28 showed the most efficient performance, it was selected for investigation of the combined effect of the PCM and night ventilation. In this section, both natural ventilation (NV) and mechanical ventilation (MV) were considered. The results of the “PCM 28” case were compared against the “PCM 28 + NV/MV” cases.

3.2.1. Natural Ventilation

Figure 10 and Table 4 summarize the maximum daily temperature drop and TTD values for all the cities for PCM 28 and PCM 28 + NV cases. According to the data presented, it can be observed that applying natural ventilation at night had a positive effect on the values of peak temperature drop and, consequently, on the values of TTD of all eight cities. The incorporation of ventilation for the night period lowered the inside heat, which consequently facilitated the solidification of the PCM layer. In all the cases, the application of natural ventilation during the nighttime increased the TTD values by up to 15% in comparison with the no ventilation case. In Padang and Iquitos, the TTD values were 7.18% and 8.85%, respectively, which were relatively lower when compared with the other cities. The lower values of the rise in TTD for these two cities can be explained by the climate conditions of the cities. It is worth mentioning that natural ventilation heavily depends on wind speed, which itself depends on local climate conditions [9]. To support the results, the monthly average wind speed data for all the cities was considered (Table 5). Comparing the effectiveness of natural ventilation with the local wind speed, the direct relationship between these two can be noticed. The lowest average wind speed values belong to Padang and Iquitos, where the lowest increase in the TTD values were obtained.
Several studies investigated the effect of natural ventilation on the performance of the PCM. For example, Jamil et al. [11] integrated nighttime ventilation along with PCM for the climate of Melbourne. The natural ventilation scheduled from 19:00 to 7:00 h considerably reduced the inside air temperature, including the diurnal maximum temperature. The authors reported 1.5–2 °C, 1–1.5 °C, 0.5–1 °C and 0.5–0 °C peak temperature reductions for 16%, 19%, 16% and 45% of the days, respectively. Liu et al. [39] compared different strategies of introducing PCM and NV to a building to decrease the thermal discomfort inside the buildings located in 10 cities of Western China over the hot season. Comparing the cases of “without PCM and NV”, “with PCM”, “with NV” and “with PCM and NV”, they concluded that coupling PCM with NV was the best strategy for the hot climate. The usage of PCM + NV significantly reduced the intensity of the thermal discomfort and the number of discomfort hours for all the cities. The results showed that the combination of PCM and natural ventilation reduced the inside temperature by up to 2 °C. Thus, based on the studies about the combined application of PCM and natural ventilation mentioned above, it can be concluded that the effectiveness of natural ventilation directly depends on the local weather conditions.
Based on the results presented in this section, it can be concluded that the incorporation of nighttime NV can have a positive effect on the PCM performance. The addition of airflow was able to reduce the inside heat and the maximum daily temperature. Moreover, it was found that the effectiveness of NV is directly related to the weather conditions at which the model is simulated. Finally, Table 3 shows that, in all the cities, most of the time, the wind speed was lower than 3 m/s, which might consequently result in a low airflow rate. Therefore, the application of mechanical ventilation characterized by a controlled airflow rate was considered in the following section.

3.2.2. Mechanical Ventilation

Figure 11 and Table 6 demonstrate the results of the impact of PCM combined with mechanical ventilation on the peak temperature drop and TTD value. Similar to natural ventilation, the application of mechanical ventilation resulted in increased peak temperature drop values in all the cities. For most cities, the TTD values were around 400–500 °C per year, with slightly higher results in Iquitos (513.62 °C per year) and Padang (511.27 °C per year) and comparatively lower results in Georgetown (381.68 °C per year). The improvement of the TTD values due to the controlled airflow rate was in the range of 26–45% in comparison with the PCM-only case. Compared with PCM + NV, the application of PCM together with MV increased the TTD values in the range of 16–37%. Thus, the application of forced ventilation can noticeably decrease the maximum temperature inside the building.
Additionally, MV significantly reduced the number of “negative days” in comparison with NV. Table 7 demonstrates the number of “negative days” for the PCM 28, PCM 28 + NV and PCM 28 + MV cases. Based on the results obtained, the following conclusions can be drawn. Firstly, the integration of NV helped to decrease the number of “negative days” only in a few cases. Secondly, the integration of MV had a substantial impact on the number of “negative days”. The application of MV considerably reduced the number of negative days for all the cities except for Kuala Lumpur.
For a more detailed analysis of the effect of MV on the thermal conditions inside the building, it was decided to conduct a one-day analysis on an hourly basis. Moreover, to examine the difference between MV and NV, the case of PCM + NV was added to the graph. As an example, the city of Georgetown was selected for analysis. Figure 12 summarizes the results of the outside dry bulb temperature (ODBT) and inside temperature of the building for no the PCM, PCM 28, PCM 28 + NV and PCM 28 + MV cases. According to the data, the integration of PCM 28 negatively affected the inside thermal conditions, as its incorporation increased the inside temperature for the whole day. In this regard, the selected day can be considered as the “negative day”. Additionally, the graph demonstrates hours when ventilation was activated. Although the schedules of MV and NV were from 16:00 to 8:00 h and from 19:00 to 7:00 h, respectively, the activation time of both ventilations on this day was from 1:00 to 7:00 h and from 21:00 to 24:00 h. This was due to the operational limits of both ventilations, which prevent overheating of the room by maintaining the condition of Tin—Tout ≥ 2 °C. In Figure 12, the working hours of the ventilations are colored in green. It is seen that, in comparison with the PCM 28 case, the usage of ventilation together with PCM 28 was more efficient in reducing the heat inside the building. During the nighttime period, from 01:00 to 7:00 h, both natural and mechanical ventilation actively decreased the inside temperature. However, since the airflow rate of NV was limited, its effectiveness was significantly lower in comparison with MV. During the daytime, both ventilations were switched off. Nevertheless, since the building was cooled during the night, the inside temperature for these cases was lower in comparison with the PCM 28 case. The ventilation after 21:00 h significantly reduced the inside temperature of the building during the nighttime period. The example showed the effectiveness of ventilation in decreasing the inside temperature of the building. Despite that both natural and mechanical ventilation reduced the inside temperature, MV demonstrated its superiority over NV, as it used a controlled airflow rate. It is important to note that, for PCM 28, the peak daily temperature was 26.18 °C, which is 0.33 °C higher than for the no PCM (25.85 °C) case. The integration of NV helped result in the maximum temperature of 26.05 °C, but it was still higher than for the no PCM (25.85 °C) case, and the day was still considered as the “negative day”. However, the application of MV reduced the daily peak temperature to 25.73 °C, which was slightly lower than for the no PCM (25.85 °C) case. In this regard, PCM 28 + MV could change this particular “negative day” to a positive one. Although the integration of NV improved the thermal performance in terms of the maximum daily temperature, mostly, it was not enough to change “negative days” into positive ones.

4. Conclusions and Recommendations

This study investigated the impact of the PCM on the thermal performance of a building located in eight cities of the Af climate zone: Singapore, Kuala Lumpur, Malacca (both Malaysia), Padang (Indonesia), Davao (Philippines), Belem (Brazil), Iquitos (Peru) and Georgetown (Guyana). The thermal performance of the building integrated with PCM was investigated through the daily peak temperature drop and novel indicator of the Total Temperature Drop (TTD). The thermal comfort limits were set for the whole climate zone using a simplified sorting algorithm. Additionally, the potential of nighttime natural and mechanical ventilation to enhance the performance of the PCM in improving the thermal conditions inside the building was analyzed. The main findings of the study are summarized below.
  • In all cities, compared to PCM 22 and PCM 25, PCM 28 showed the most efficient performance in terms of the daily peak temperature drop and Total Temperature Drop. Thus, it can be considered as optimum for the whole Af climate zone. The usage of PCM 28 resulted in the TTD values of all the cities ranging from 279 °C per year to 356 °C per year.
  • Introducing natural ventilation for the nighttime period helped to increase the TTD values by up to 15%. In Padang and Iquitos, the integration of NV resulted in TTD values of 8.85% and 7.18%, respectively. The less effective performance of NV in these two cities was related to the lower wind speed values. The results suggested that the effectiveness of NV is directly dependent on the wind speed.
  • Introducing mechanical ventilation helped to increase the TTD values for all the cities by 16–45%. It demonstrated that the forced airflow rate could be beneficial for the tropical climate. A comparison between the two ventilation types demonstrated the superiority of MV over NV, as the second one heavily depends on the weather conditions of the location.
  • Overall, PCM 28 combined with MV can be successfully used to improve the thermal performance of a building located in the Af climate zone.
  • For future studies, it is recommended to investigate the impact of the outside relative humidity on the thermal comfort conditions inside a PCM-integrated building located in the Af climate zone. Additionally, the impact of the window opening area on the thermal performance of a building in the Af climate zone should be evaluated.

Author Contributions

Conceptualization, S.A.M. and A.S.; Funding acquisition, S.A.M. and J.K.; Investigation, A.S. and I.A., Methodology, A.S. and S.A.M.; Formal analysis, A.S.; Software, A.S.; Visualization, A.S.; Writing—original draft, A.S. and Writing—reviewing and editing, I.A., S.A.M. and J.K. All authors have read and agreed to the published version of the manuscript.

Funding

This research was supported by Nazarbayev University Faculty development competitive research grants numbers 021220FD0651 and NU Research grant number SOE2017003.

Institutional Review Board Statement

Not applicable.

Informed Consent Statement

Not applicable.

Conflicts of Interest

The authors declare no conflict of interest.

References

  1. IEA Fossil Fuel Energy Consumption. Available online: https://data.worldbank.org/indicator/EG.USE.COMM.FO.ZS (accessed on 24 May 2020).
  2. IEA Energy Efficiency: Buildings. Available online: https://www.iea.org/topics/energyefficiency/buildings/ (accessed on 15 August 2019).
  3. Du, K.; Calautit, J.; Wang, Z.; Wu, Y.; Liu, H. A review of the applications of phase change materials in cooling, heating and power generation in different temperature ranges. Appl. Energy 2018, 220, 242–273. [Google Scholar] [CrossRef]
  4. Oró, E.; de Gracia, A.; Castell, A.; Farid, M.M.; Cabeza, L.F. Review on phase change materials (PCMs) for cold thermal energy storage applications. Appl. Energy 2012, 99, 513–533. [Google Scholar] [CrossRef] [Green Version]
  5. Kasaeian, A.; Bahrami, L.; Pourfayaz, F.; Khodabandeh, E.; Yan, W.M. Experimental studies on the applications of PCMs and nano-PCMs in buildings: A critical review. Energy Build. 2017, 154, 96–112. [Google Scholar] [CrossRef]
  6. Rao, V.V.; Parameshwaran, R.; Ram, V.V. PCM-mortar based construction materials for energy efficient buildings: A review on research trends. Energy Build. 2018, 158, 95–122. [Google Scholar] [CrossRef]
  7. Zhou, G.; Yang, Y.; Wang, X.; Zhou, S. Numerical analysis of effect of shape-stabilized phase change material plates in a building combined with night ventilation. Appl. Energy 2009, 86, 52–59. [Google Scholar] [CrossRef]
  8. Alam, M.; Sanjayan, J.; Zou, P.X.W.; Ramakrishnan, S.; Wilson, J. Evaluating the passive and free cooling application methods of phase change materials in residential buildings: A comparative study. Energy Build. 2017, 148, 238–256. [Google Scholar] [CrossRef]
  9. Zhang, Y.; Cui, H.; Tang, W. Effect of Summer Ventilation on the Thermal Performance and Energy Efficiency of Buildings Utilizing Phase Change Materials. Energies 2017, 10, 1214. [Google Scholar] [CrossRef] [Green Version]
  10. Evola, G.; Marletta, L.; Sicurella, F. A methodology for investigating the effectiveness of PCM wallboards for summer thermal comfort in buildings. Energy Build. 2014, 70, 480–489. [Google Scholar] [CrossRef]
  11. Jamil, H.; Alam, M.; Sanjayan, J.; Wilson, J. Investigation of PCM as retrofitting option to enhance occupant thermal comfort in a modern residential building. Energy Build. 2016, 133, 217–229. [Google Scholar] [CrossRef]
  12. Li, D.; Zheng, Y.; Liu, C.; Wu, G. Numerical analysis on thermal performance of roof contained PCM of a single residential building. Energy Convers. Manag. 2015, 100, 147–156. [Google Scholar] [CrossRef]
  13. Ahangari, M.; Maerefat, M. An innovative PCM system for thermal comfort improvement and energy demand reduction in building under different climate conditions. Sustain. Cities Soc. 2019, 44, 120–129. [Google Scholar] [CrossRef]
  14. Ramakrishnan, S.; Wang, X.; Sanjayan, J.; Wilson, J. Thermal performance of buildings integrated with phase change materials to reduce heat stress risks during extreme heatwave events. Appl. Energy 2017, 194, 410–421. [Google Scholar] [CrossRef]
  15. Ramakrishnan, S.; Wang, X.; Sanjayan, J.; Wilson, J. Thermal performance assessment of phase change material integrated cementitious composites in buildings: Experimental and numerical approach. Appl. Energy 2017, 207, 654–664. [Google Scholar] [CrossRef]
  16. Sage-Lauck, J.S.; Sailor, D.J. Evaluation of phase change materials for improving thermal comfort in a super-insulated residential building. Energy Build. 2014, 79, 32–40. [Google Scholar] [CrossRef]
  17. Figueiredo, A.; Vicente, R.; Lapa, J.; Cardoso, C.; Rodrigues, F.; Kämpf, J. Indoor thermal comfort assessment using different constructive solutions incorporating. PCM. Appl. Energy 2017, 208, 1208–1221. [Google Scholar] [CrossRef]
  18. Gao, Y.; He, F.; Meng, X.; Wang, Z.; Zhang, M.; Yu, H.; Gao, W. Thermal behavior analysis of hollow bricks filled with phase-change material (PCM). J. Build. Eng. 2020, 31, 101447. [Google Scholar] [CrossRef]
  19. Liu, C.; Wu, Y.; Li, D.; Zhou, Y.; Wang, Z.; Liu, X. Effect of PCM thickness and melting temperature on thermal performance of double glazing units. J. Build. Eng. 2017, 11, 87–95. [Google Scholar] [CrossRef] [Green Version]
  20. Triano-Juárez, J.; Macias-Melo, E.V.; Hernández-Pérez, I.; Aguilar-Castro, K.M.; Xamán, J. Thermal behavior of a phase change material in a building roof with and without reflective coating in a warm humid zone. J. Build. Eng. 2020, 32, 101648. [Google Scholar] [CrossRef]
  21. Bhamare, D.K.; Rathod, M.K.; Banerjee, J. Numerical model for evaluating thermal performance of residential building roof integrated with inclined phase change material (PCM) layer. J. Build. Eng. 2020, 28, 101018. [Google Scholar] [CrossRef]
  22. El Omari, K.; Le Guer, Y.; Bruel, P. Analysis of micro-dispersed PCM-composite boards behavior in a building’s wall for different seasons. J. Build. Eng. 2016, 7, 361–371. [Google Scholar] [CrossRef]
  23. Saffari, M.; de Gracia, A.; Fernández, C.; Cabeza, L.F. Simulation-based optimization of PCM melting temperature to improve the energy performance in buildings. Appl. Energy 2017, 202, 420–434. [Google Scholar] [CrossRef] [Green Version]
  24. Marin, P.; Saffari, M.; de Gracia, A.; Zhu, X.; Farid, M.M.; Cabeza, L.F.; Ushak, S. Energy savings due to the use of PCM for relocatable lightweight buildings passive heating and cooling in different weather conditions. Energy Build. 2016, 129, 274–283. [Google Scholar] [CrossRef] [Green Version]
  25. Lei, J.; Yang, J.; Yang, E.H. Energy performance of building envelopes integrated with phase change materials for cooling load reduction in tropical Singapore. Appl. Energy 2016, 162, 207–217. [Google Scholar] [CrossRef]
  26. Mindat.org. Tropical rainforest climate. Available online: https://www.mindat.org/climate-Af.html (accessed on 1 April 2021).
  27. Wikipedia Contributors. Tropical Rainforest Climate. Available online: https://en.wikipedia.org/w/index.php?title=Tropical_rainforest_climate&oldid=948667960 (accessed on 2 April 2020).
  28. Moreno, A.C.R.; De Morais, I.S.; De Souza, R.G. Thermal Performance of Social Housing—A Study Based on Brazilian Regulations. Energy Procedia 2017, 111, 111–120. [Google Scholar] [CrossRef]
  29. Sadeghifam, A.N.; Zahraee, S.M.; Meynagh, M.M.; Kiani, I. Combined use of design of experiment and dynamic building simulation in assessment of energy efficiency in tropical residential buildings. Energy Build. 2015, 86, 525–533. [Google Scholar] [CrossRef]
  30. AHSRAE-55-2010 ASHRAE STANDARD. Thermal Environment Conditions for Human Occupancy; American Society of Heating, Refrigerating and Air-Conditioning Engineers: Atlanta, GA, USA, 2010. [Google Scholar]
  31. Auliciems, A.; Szokolay, S.V. Thermal Comfort, 2nd ed.; Passive and Low Energy Architecture International in association with Department of Architecture, The University of Queensland: Brisbane, Australia, 2007. [Google Scholar]
  32. Alam, M.; Jamil, H.; Sanjayan, J.; Wilson, J. Energy saving potential of phase change materials in major Australian cities. Energy Build. 2014, 78, 192–201. [Google Scholar] [CrossRef]
  33. EnergyPlus. Available online: https://www.energyplus.net/ (accessed on 17 April 2020).
  34. Tabares-Velasco, P.C.; Christensen, C.; Bianchi, M. Verification and validation of EnergyPlus phase change material model for opaque wall assemblies. Build. Environ. 2012, 54, 186–196. [Google Scholar] [CrossRef]
  35. Designbuilder Natural Ventilation Modelling. Available online: https://designbuilder.co.uk/helpv2/Content/_Natural_ventilation_modelling.htm (accessed on 5 June 2020).
  36. Design Builder Mechanical Ventilation. Available online: https://designbuilder.co.uk/helpv4.6/Content/_Air_distribution1.htm (accessed on 5 February 2021).
  37. Pajek, L.; Kuni, R.; Ko, M. Improving thermal response of lightweight timber building envelopes during cooling season in three European locations. J. Clean. Prod. 2017, 156. [Google Scholar] [CrossRef]
  38. Nghana, B.; Tariku, F. Phase change material’s (PCM) impacts on the energy performance and thermal comfort of buildings in a mild climate. Build. Environ. 2016, 99, 221–238. [Google Scholar] [CrossRef]
  39. Liu, J.; Liu, Y.; Yang, L.; Liu, T.; Zhang, C.; Dong, H. Climatic and seasonal suitability of phase change materials coupled with night ventilation for of fi ce buildings in Western China. Renew. Energy 2020, 147, 356–373. [Google Scholar] [CrossRef]
Figure 1. Methodology of the study.
Energies 14 02699 g001
Figure 2. The territory of the tropical rainforest climate (Af) on the world map [27].
Energies 14 02699 g002
Figure 3. Schematic illustration of the building envelope.
Energies 14 02699 g003
Figure 4. Minimum and maximum thermal limits for each city and global thermal comfort limits.
Energies 14 02699 g004
Figure 5. Enthalpy–temperature curves for PCM 22, PCM 25 and PCM 28.
Energies 14 02699 g005
Figure 6. Analytical vs. numerical solution to Stefan’s problem.
Energies 14 02699 g006
Figure 7. Schematic representation of ventilation of the modeled building.
Energies 14 02699 g007
Figure 8. Impact of PCM 22, PCM 25 and PCM 28 on the maximum daily temperature drop and TTD values for all the cities.
Energies 14 02699 g008
Figure 9. Inside operative temperature and outside temperature for positive and negative days for the city of Georgetown.
Energies 14 02699 g009
Figure 10. Impact of PCM 28 and PCM 28 + NV on the maximum daily temperature drop and TTD values for all the cities.
Energies 14 02699 g010
Figure 11. Maximum daily temperature drop and TTD values for all the cities integrating PCM 28 and PCM 28 + MV.
Energies 14 02699 g011
Figure 12. One-day analysis of the inside operative temperature of the building for the no PCM, PCM 28, PCM 28 + NV and PCM 28 + MV cases for the city of Georgetown.
Energies 14 02699 g012
Table 1. Thermophysical properties of the wall composition [28,29].
MaterialThickness (mm)Thermal Conductivity (W/mK)Density (kg/m3)Specific Heat (J/kgK)
Wall
Cement plaster200.81600840
PCM200.28601970
Clay block1901.01800920
Cement plaster200.81600840
Table 2. Thermophysical properties of the roof composition.
MaterialThickness (mm)Thermal Conductivity (W/mK)Density (kg/m3)Specific Heat (J/kgK)
Roof
Ceramic tile101.32000840
Air gap50Thermal resistance (m2K/W)
0.21
PCM200.28601970
Roofing felt50.19960837
Table 3. Thermophysical properties of the floors.
MaterialThickness (mm)Thermal Conductivity (W/mK)Density (kg/m3)Specific Heat (J/kgK)
Intermediate floor
Concrete slab1001.1320001000
Ground floor
Dense concrete1001.422400880
Ceramic floor tile121.22500640
Table 4. TTD values for all the cities for the PCM 28 and PCM 28 + NV cases.
CityPCM 28
(°C per Year)
PCM 28 + NV
(°C per Year)
Increase (%)
Singapore288.43326.9613.36
Kuala Lumpur339.90383.4412.81
Malacca355.82401.8712.94
Padang355.52381.047.18
Belem315.06361.1214.62
Davao340.58385.9313.32
Georgetown279.86323.8815.73
Iquitos354.41385.768.85
Table 5. Average monthly wind speed data and TTD increase values for all the cities.
CityPadangIquitosKuala LMalaccaDavaoBelemSingaporeGeorgetown  
 Average Monthly Wind Speed (m/s)  
January0.931.541.302.282.751.572.402.49 Energies 14 02699 i001Wind speed, m/s
February1.341.451.722.572.992.453.782.72
March0.882.861.652.452.582.411.763.37
April1.240.661.411.002.052.321.362.63
May0.790.371.791.301.652.391.642.73
June1.060.701.501.341.772.511.712.21
July1.300.841.981.081.021.502.651.55
August1.150.751.681.211.761.922.911.58
September0.980.851.831.271.331.731.711.98
October0.811.121.691.801.313.301.592.34
November0.710.481.302.171.082.011.922.34
December0.721.351.471.491.971.523.741.95
          Energies 14 02699 i002
Annual Average0.991.081.611.661.862.142.262.32
         
TTD increase (%)7.188.8512.8112.9413.3214.6213.3615.73
* Values of the wind speed colored in a gradient pattern, with the red being lowest and the green being highest (for visualization purposes).
Table 6. TTD values for all the cities for the PCM 28 and PCM 28 + MV cases, and the difference in the TTD increase between PCM 28 + NV and PCM 28 + MV.
CityPCM 28 (°C per Year)PCM 28+MV (°C per Year)Increase (%)Difference between NV and MV (%)
Singapore288.43413.9843.5330.17
Kuala Lumpur339.90434.7527.9015.09
Malacca355.82449.0326.2013.26
Padang355.52511.2743.8136.63
Belem315.06431.0936.8322.21
Davao340.58484.3942.2328.91
Georgetown279.86381.6836.3820.65
Iquitos354.41513.6244.9236.07
Table 7. The number of “negative days”.
CityPCM 28PCM 28 + NVReduction (%)PCM 28 + MVReduction (%)Difference between NV and MV (%)
Singapore17165.88664.7158.82
Kuala Lumpur181516.671422.225.56
Malacca7528.57185.7157.14
Padang13130.00192.3192.31
Belem171511.761135.2923.53
Davao7442.86185.7142.86
Georgetown67627.464631.3423.88
Iquitos25238.00484.0076.00
Publisher’s Note: MDPI stays neutral with regard to jurisdictional claims in published maps and institutional affiliations.

