Abstract
The Taiwanese government has set an energy transition roadmap of 20% renewable energy supply by 2025, including a 20 GW installed PV capacity target, composed of 8 GW rooftop and 12 GW ground-mounted systems. The main trend of feed-in tariffs is downwards, having fallen by 50% over a ten-year period. Predicting the future ten-year equity internal rate of return (IRR) in this study, we examine the investability of PV systems in Taiwan when subsidies and investment costs descend. We have found that the projected subsidies scheme favours investment in small-sized PV systems. Unless the investment costs of medium-sized PV systems fall or subsidies rise over the next decade, investing in medium-sized PV systems will be less attractive. Nonlinear and linear degradation causes slight IRR differences when using higher-reliability modules.
1. Introduction
With growing environmental consciousness, renewable energy has been used to fight against global climate change by reducing greenhouse gas emissions [1]. Renewable energy development is a growing trend worldwide [2]. The largest proportion of renewable energy investment is photovoltaic (PV) power, or solar power. From 2010 to 2019, global renewable energy investment reached USD 2.6 trillion, with PV accounting for 52%, which was USD 1.3 trillion [3]. REmap from IRENA predicted that global installed capacity of solar power would increase six times larger to 2840 GW by 2030, compared to 2018, and with nearly 9% growth annually to 8519 GW by 2050, equivalent to USD 8 trillion in investments from equity and debt markets [4,5]. Owing to the mature manufacturing technologies of PV panels and the reduction of system installation costs over the past ten years, the PV industry has reached economies of scale, and hence become the electricity source with the most potential [6,7].
Like most governments, the Ministry of Economic Affairs (MOEA) in Taiwan has set a goal for renewable energy development and legislated related regulations to accommodate the energy transition [8,9,10,11]. The goal is to make renewable energy 20% of total energy production by 2025; the PV capacity would then reach 20 GW, which is equivalent to 66.3% of the total goal and composed of 8 GW roof-top and 12 GW ground-mounted systems. It would also make the PV capacity in Taiwan up to 1% of the world in 2030. As shown in Figure 1, the annual increments in PV cumulative installed capacity and production has risen from 2016 to 2020. Figure 2 displays different proportions of PV systems in Taiwan. As shown in Figure 1 and Figure 2, Taiwan has cumulatively installed 5817.21 MW solar power systems, composed of 78% rooftop, 21% ground-mounted, and 1% floating, and generated 6085.79 GWh of electricity at the end of 2020 [12].
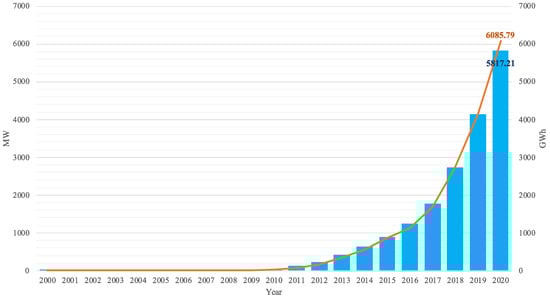
Figure 1.
Photovoltaic cumulative installed capacity and power generation Source: [12], self-elaboration.
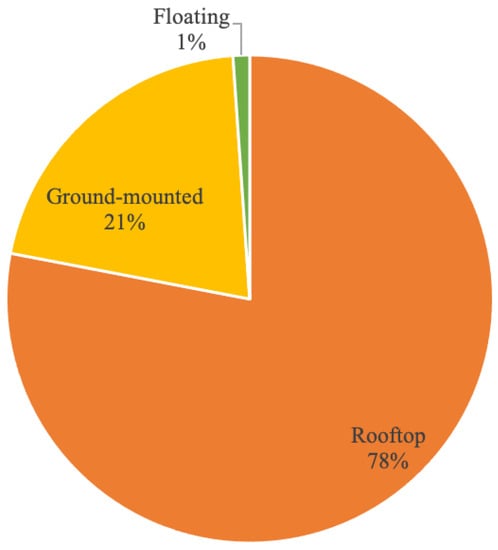
Figure 2.
Different proportions of PV power systems in Taiwan (2020). Source: [13,14] self-elaboration.
The drop in investment costs has led to subsidies, such as the feed-in tariff (FIT), decreasing gradually year by year in Taiwan. Overall FITs have dropped 50% over the past ten years. As the trend from 2012 to 2020 in Figure 3 demonstrates, FITs for rooftop PV power plants for which capacities are 100 kW–499 kW and above 500 kW have decreased by 53.85%, and 49.92%, respectively. FITs for ground-mounted PV systems with capacities more than 1 kW have declined by 47.13%. All of the PV power systems converged to around 0.12 EUR/kWh from 2011 to 2020, resulting from contracting investment costs, shown in Figure 3.
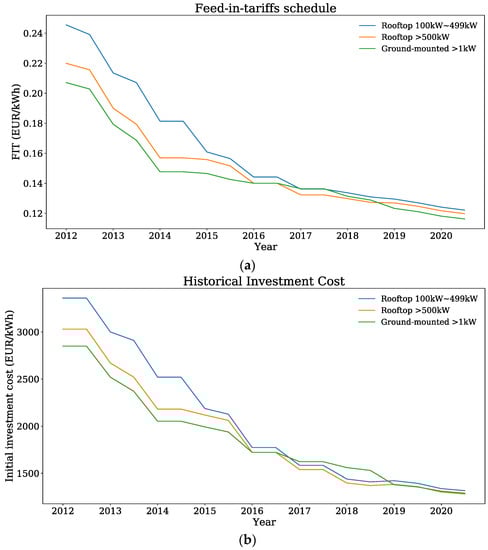
Figure 3.
(a) FIT schedule from 2012 to 2020 (b) Investment cost from 2012 to 2020 Source: [15], self-elaboration.
Different feed-in tariff incentives may cause variable PV investability. For example, Greek feed-in tariffs changed from constant to de-escalating, declined annually from 2009 to 2014, and been set as the average wholesale electricity price plus a premium after 2015. Danchev et al., argued that, although feed-in tariffs were larger than wholesale prices, the returns are not attractive [16]. If the investment cost did not decline dramatically after 2015, it would not be profitable to enter into the Greek PV market.
In general, previous studies have been done on feed-in tariffs in Taiwan from different viewpoints, including policy [17,18,19,20,21,22], economy [23], financial assessment [24], and investors [25]. The purpose of this paper is to examine the investability of PV systems in Taiwan when subsidies and investment costs descend. Unlike the linear degradation rates used in prior studies, our study considered nonlinear degradation rates and financing costs when calculating cash flows. Unfortunately, there have been few longitudinal studies. Our study showed predictions of returns on investment in PV systems with capacities 1 kW to 1 MW from 2021 to 2030. The following sections of this paper contain more details of the FIT in Taiwan. In order to evaluate whether the entry of PV systems is attractive, this paper calculated the return on investment from the project and equity perspectives. Then, sensitivity analysis was performed to check how the changes in the values of parameters, policy and the linearity or nonlinearity of the degradation curve would impact on the results.
2. Feed-In Tariffs Incentive Scheme
To achieve sustainable development, MOEA lowered the threshold of PV investment by introducing feed-in tariffs in December 1999, rather than other regulatory policies, such as electric utility quota obligation, net metering, tradable REC, etc. [26]. In the monopolized electricity market in Taiwan, a fixed rate for unit power will be fair and will not violate The Electricity Act [18]. The unit cost varies according to project capacity, allowing large-scale commercial developers to benefit from economies of scale and creating entry barriers for citizens or small-scale developers. By setting FIT rates with respect to capacity levels and taking unit costs into consideration, investors of different scales would receive reasonable compensations [27,28].
The FIT and its formula are reviewed and announced annually by committee. It considers several market and technological factors, such as actual market investment costs, operation and maintenance costs, annual electricity generation, etc. FITs were calculated by the levelized cost approach and should be larger than the average domestic cost of fossil-fired power [28].
Investors are compensated with the FIT at the time of signing a power purchase agreement (PPA) throughout the entire 20 years. By this method, bond-like characteristics of cash flow offered by PV power plants would be ensured and exempted from price fluctuations in the energy market [21,29]. FIT not only increases the certainty of cash inflows but also reduces downside risk, making it more likely for investors to borrow money from the bank, and eventually reducing the cost of renewable electricity [30,31].
The government proposed several plans to stimulate PV development in Taiwan. The Million Solar Rooftop PVs project was implemented in March 2012, and the development of the solar community was subsidized in March 2013 [32]. A short-term goal of 2 years of PV promotion was set to ensure that the total installed capacity reached 1.52 GW from July 2016 to December 2018. The total capacity installed in Dec. 2018 was 1.7 GW, surpassing the short term goal. The second phase of the 2-year PV promotion plan was set to ensure that incremental installed capacities would be 1.5 GW and 2.2 GW, respectively, in 2019 and 2020.
3. Methodology
Researchers have indicated that PV markets become economically viable due to drops of LCOE [33], but lower LCOE does not guarantee the profitability of PV investments. Therefore, most firms normally use IRR, NPV, and payback periods in capital budgeting [34,35,36]. The IRR is the discount rate that makes the present value of the future after-tax cash flows equal to the initial cost of the project [37]. The advantage of IRR is that it calculates profitability as a percentage, indicating the return on each dollar invested.
Two types of IRR, project and equity IRR, will be estimated in this study. Project IRR considers the overall return of the project, which does not meet the required return of sponsors. To decide the feasibility of an investment project, project investors may compare the project IRR with the cost of capital. If the project IRR is larger than the cost of capital, meaning that the project has the chance to make profits, then project investors would consider investing. Therefore, the project IRR can be regarded as the bottom line of the lowest return for the feasibility of an investment project.
The IRR of the project with leverage, like debt, is literally the investors’ return on investment in a project, namely equity IRR [38]. For ensuring higher equity returns, sponsors would leverage the project by borrowing money from the bank under the circumstances that loan interest rates are lower than project IRR. For project developers, project IRR is an indicator often used to compare different projects [39]. After choosing a project, a reasonable debt ratio, along with risk exposure, confidence of investors and financing barriers, will then be considered together to determine an equity IRR [40].
This study predicted returns from 2021 to 2030 based on predicted FITs and projected capital cost reductions in comparative reference cases from EIA, shown in Figure 1 [41]. The predicted FIT set by Taiwan government is derived from substituting assumed values into Formulaes (1) and (2) [15].
where InvCost is the initial investment cost; WACC is the weighted average cost of capital, including debt and equity; CRF is the capital recovery factor, combinations of WACC and the contract duration; OMCost is the operation and maintenance (O&M) cost ratio, which is the ratio of annual O&M cost to initial investment cost. Several assumptions are made by the government as follows: WACC to be 5.25%, annual energy generation to be 1250 kWh, and OMCost to be the same as year 2020. EIA varied capital costs in PV technologies, incorporating learning factors for three cases: high renewable, comparative reference, and low renewable cost cases. In the energy production industry, capital costs fall according to learning curves, which are defined as the experience improved with a specific technology [42,43]. With learning factor assumptions, capital costs in the comparative reference cases declined by 87% of their levels by 2030.
This study calculated the net cash flows for the overall and levered return of the project between 2012 and 2030. Investors would own the asset, the PV system, for the whole period with a lifetime of 20 years. Residual value of PV systems is assumed to equal disposal costs after 20 years. Other assumptions are presented in Table 1.

Table 1.
Net cash flow calculations.
4. Results and Sensitivity Analysis
This section first covers project IRR and equity IRR for the past ten years, along with predicted equity IRR in the next decade. Then, to provide more information to prospective investors and decision makers, sensitivity analyses of future IRR are carried out.
Figure 4 presents the project IRRs for rooftop PV systems (PVS) with capacity 1 to 1000 kW from 2012 to 2020, illustrated from different angles by Figure 4a,b. From Figure 4b, the smaller scales of the PV systems, the higher returns. As commented in Section 2, smaller PV systems with greater costs per kW are compensated with higher feed-in tariffs, corresponding with the long term policies. Nonetheless, it seems like the difference in returns regarding capacities is overestimated.
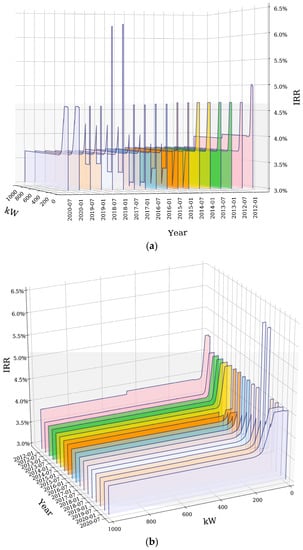
Figure 4.
Project IRRs (Internal Rate of Returns) for rooftop PVS with capacity 1 to 1000 kW (2012–2020), from different angles (a,b) Source: self-elaboration.
Figure 4a shows that project IRRs of capacities lower than 19 kW slightly declined from 4.96% with the contract date in January 2012 to 4.56% in July 2020. Note that the IRRs of capacities greater than 19 kW have sharply decreased for 5 years starting from 2015, and this is caused by FIT adjustments. In the first half-year of 2014, the installation of 10~19 kW applications was relatively lower than other capacities. In order to encourage the public to make efficient use of house rooftops, the government has adjusted the first level from its original range of 1–9 kW to 1–19 kW. Also note that the IRR drop is caused by the FIT difference between capacity levels. The FIT difference between the first level (1–9 kW) and second level (10–99 kW) was around 10 % from 2012 to 2014; however, the difference between the first level (1–19 kW) and second level (20–99 kW) became 21.86% and, hence, resulted in a sharper drop. Project IRRs of capacities greater than 150 kW slightly decreased from 4.00% with the contract date in January 2012 to 3.65% in July 2020. The calculation of FITs includes O&M costs, while loan interest payment and tax payment are excluded. In real cases when these payments are considered, the actual unlevered project IRR will be lower than the WACC (5.25%) in FIT calculation.
Figure 5 illustrates that equity IRRs of capacities lower than 19 kW declined from 7.95% with the contract date in January 2012 to 7.01% in July 2020. IRRs of larger installed capacity, greater than 150 kW, slightly decreased from 6.46% with the contract date in January 2012 to 5.61% in July 2020. The majority of the installed capacities were higher than WACC for the past ten years, which is financially feasible, except for the capacities of 19 to 99 kW from 2015 to 2019. Most rooftop PV systems were profitable for the past ten years, and capacities 19 to 99 kW were unprofitable from 2015 to 2019. This indicates that the FIT of 19 to 99 kW is lower than its reasonable value.
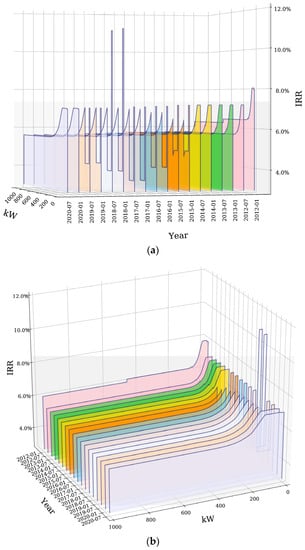
Figure 5.
Equity IRRs (Internal Rate of Returns) for rooftop PVS with capacity 1 to 1000 kW, from different angles (a,b) (2012–2020) Source: self-elaboration.
The IRR of rooftop PV power systems with capacity from 1 kW to 19 kW increased to 10.89% in 2018 as a result of the incentives provided by the government, which proactively encourage public installations of small distributed rooftop PV systems. There are many reasons why the government emphasizes small-capacity PV power systems. Generated electricity could be consumed in close proximity rather than long-distance transmission to realize local power generation and reduce transmission losses. It could lower unit power generation costs and further improve the stability of the regional grid.
Figure 6 shows that predicted equity IRRs for rooftop PV systems with capacities lower than 19 kW are around 7.012%, and more than 300 kW are around 5.605% from 2021 to 2030. Investments in small-sized PV systems remain attractive, and medium-sized PV systems are less profitable since IRR is slightly greater than WACC, based on previous assumptions, as the FIT and investment costs descend in the next decade.
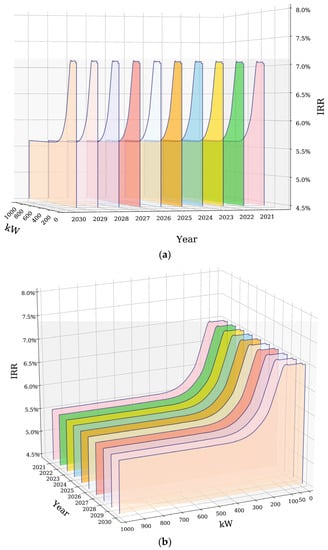
Figure 6.
Predicted equity IRRs (Internal Rate of Returns) for rooftop PVS with capacity 1 to 1000 kW (2021–2030), from different angles (a,b) Source: self-elaboration.
Previous IRR calculations are based on several subjective assumptions. In order to understand the impact of different parameter variations and consider that changes of the investment environment or the government policy in the future may result in different estimates, a sensitivity analysis is performed.
The results of sensitivity analysis for a 250 kW rooftop PVS with the contract in 2030 are presented in Figure 7. The equity IRR is largely sensitive to three parameters, which are initial investment cost, feed-in tariff and annual electricity generation. The results are the same with the sensitivity analysis in the USA and Greece [16,44,45]. Large upfront costs and incentives like feed-in tariffs may cause great impacts on the IRRs [46]. The comparative reference value of equity IRR with no changes is 5.87%. An initial investment cost lower than the reference case by 15% would generate an IRR that is higher by 5.81 points. When the feed-in tariff or annual electricity generation increases by 15%, which means that the revenue side gets 15% higher than the reference case, it would lead to an IRR that is larger by 4.92 points.
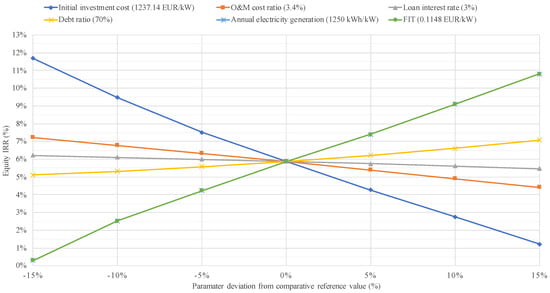
Figure 7.
Sensitivity of equity IRR for a 250 kW rooftop PVS with the contract in 2030. Source: self-elaboration.
The returns of small-sized PV systems are higher, as shown in Figure 6. From Figure 7, the profitability between small- and medium-sized PV systems were equal, if one of the following conditions met: initial investment costs are 4% lower, FIT and annual electricity generation are 4% higher, O&M cost ratio is 15% lower, or debt ratio is 15% higher than reference case. From the results, the best case for the profitability of an investment is the combinations with the lowest initial investment cost, the highest feed-in tariff, and the highest annual electricity generation.
Previous results of predicted equity IRRs summarizes that medium-sized rooftop PV systems become less profitable in the next ten years. Figure 8 shows the dependence of predicted equity IRR variation on FIT deviation from the prediction of 2030. As long as the FITs do not reduce to between 1% to 4% less than current projections in 2030, the investments in PV systems are financially feasible.
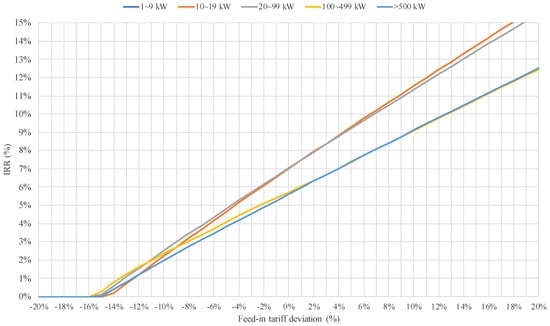
Figure 8.
Predicted equity IRR and FIT deviation for PVS with the contract in 2030. Source: self-elaboration.
When making investment decisions, investors are more concerned about IRR. Many researchers have concluded that nonlinear and linear degradation curves may have a significant impact on the LCOE [45,47]. It may result in a difference of IRR. Table 2 shows the degradation rates of different degradation curves with different total degradations. In the nonlinear degradation case, the curve is at a stable phase, namely the degradation rate is 0, in the first 10 years, followed by a fixed degradation rate in the remaining 10 years; while in the linear degradation case, the degradation rate is fixed throughout the entire 20 years. Since the degradation period of the nonlinear case is half that of linear case, the rates of nonlinear case would then be 2 times that of linear case under the same total degradation.
Table 2.
Degradation rates of different cases Source: self-elaboration.
Figure 9 displays the IRRs with nonlinear and linear degradation curves. For PV systems with higher reliability, total degradation less than 15%, the IRR difference between linear and nonlinear degradation is smaller than 0.9%, and when total degradation is greater than 20%, the IRR difference becomes larger than 1.4%. It indicates that nonlinear and linear degradation curves have less impact on the IRRs when using modules with higher reliability, and have significant impact on the IRRs when using modules with lower reliability. In the case of equity IRRs for 55 kW rooftop PV systems with contract in 2030, calculating cash flows by applying nonlinear and linear degradation curves may result in different investment decisions, when total degradation is larger than 15%.
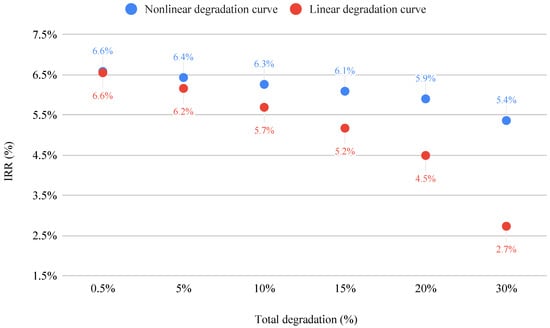
Figure 9.
Equity IRRs for 55 kW rooftop PVS with contract in 2030 under different cases Source: self-elaboration.
5. Conclusions
With the emerging concerns around climate change, energy transition has become an unignorable issue. Governments have proposed related policies to support energy transition. However, while FITs are gradually adjusted to lower levels due to descending costs, the investability and profitability of renewable energy, such as PV, must be ensured to make energy transition sustainable.
Unlike previous studies [24,25], this paper has presented longitudinal studies on the investability of PV systems when subsidies and investment costs descend. It could shed lights on future possible energy policies and returns which may assist prospective investors in identifying a potential PV market and making investment decisions. Consistent with Danchev et al., our study has found that small-sized PV systems have simpler access and will remain at higher levels of investability; while medium-sized PV systems will be less attractive over the next decade, even if investment is financially feasible. If the investment cost of larger capacities PV systems does not fall, entering into the PV market in Taiwan in the next ten years will not have many incentives. Our analysis has pointed out that the subsidies policy for medium-sized PV systems may be 4% higher than projections to make its investment more profitable and hence contribute to energy transition.
The government and prospective investors of PV systems are concerned about how changes in economic and financial conditions may affect the investability of PV systems. The factors on which IRR values depend are, from most to least: initial investment cost, FIT and annual electricity generation, O&M cost ratio, debt ratio, and loan interest rate. Moreover, our analysis also shows that nonlinear and linear degradations cause slight IRR differences when using modules with higher reliability, and significant IRR differences when using modules with lower reliability, which may lead to the diametrically opposed investment decisions.
Supplementary Materials
The following are available online at https://www.mdpi.com/article/10.3390/en14092728/s1, Table S1. Photovoltaic cumulative installed capacity and power generation, Table S2. (a) FIT schedule from 2012 to 2020 (b) Investment cost from 2012 to 2020.
Author Contributions
Conceptualization, C.-T.Y.; software, C.-T.Y.; validation, C.-N.C., C.-T.Y.; formal analysis, C.-T.Y.; investigation, C.-N.C.; resources, C.-T.Y.; data curation, C.-T.Y.; writing—original draft preparation, C.-T.Y.; writing—review and editing, C.-N.C., C.-T.Y.; visualization, C.-T.Y.; supervision, C.-N.C. All authors have read and agreed to the published version of the manuscript.
Funding
This research received no external funding.
Data Availability Statement
The data presented in this study are available in Supplementary Materials. Projected capital cost reductions from EIA. Available online: https://www.eia.gov/outlooks/ieo/excel/IEO_2020_Asia_figure2.xlsx (accessed on 29 October 2020). [41]: Projected capital cost reductions from EIA.
Conflicts of Interest
The authors declare no conflict of interest.
References
- Aleixandre-Tudó, J.L.; Castelló-Cogollos, L.; Aleixandre, J.L.; Aleixandre-Benavent, R. Renewable energies: Worldwide trends in research, funding and international collaboration. Renew. Energy 2019, 139, 268–278. [Google Scholar] [CrossRef]
- REN21. Renewables 2020-Global Status Report; REN21: Paris, France, 2020. [Google Scholar]
- Ajadi, T.; Boyle, R.; Strahan, D.; Kimmel, M.; Collins, B.; Cheung, A.; Becker, L. Global Trends in Renewable Energy Investment 2019; Frankfurt, Germany, 2019; Available online: https://www.unep.org/resources/report/global-trends-renewable-energy-investment-2019 (accessed on 23 February 2020).
- IRENA. Global Energy Transformation: A Roadmap to 2050 (2019 Edition); International Renewable Energy Agency: Abu Dhabi, United Arab Emirates, 2019. [Google Scholar]
- Hsi, E.P.H.; Shieh, J.C.P. Insurability of PV Performance Liability and its Impact on Overall PV Financing Costs. In Proceedings of the 2019 IEEE 46th Photovoltaic Specialists Conference (PVSC), Chicago, IL, USA, 16–21 June 2019; pp. 1653–1655. Available online: ieeexplore.ieee.org (accessed on 23 February 2020). [CrossRef]
- Cook, J.J.; Ardani, K.B.; Margolis, R.M.; Fu, R. Cost-Reduction Roadmap for Residential Solar Photovoltaics (PV), 2017–2030; National Renewable Energy Lab. (NREL): Golden, CO, USA, 2018. [Google Scholar]
- Jones-Albertus, R.; Cole, W.; Denholm, P.; Feldman, D.; Woodhouse, M.; Margolis, R. Solar on the rise: How cost declines and grid integration shape solar’s growth potential in the United States. MRS Energy Sustain. 2018, 5. [Google Scholar] [CrossRef]
- Kaygusuz, K. Energy for Sustainable Development: Key Issues and Challenges. Energy Sources Part. B Econ. Plan. Policy 2007, 2, 73–83. [Google Scholar] [CrossRef]
- Müller, S.; Brown, A.; Ölz, S. Renewable Energy: Policy Considerations for Deploying Renewables; International Energy Agency: Paris, France, 2011. [Google Scholar]
- Philibert, C. Interactions of Policies for Renewable Energy and Climate; IEA Energy Papers; Organisation for Economic Co-Operation and Development (OECD): Paris, France, 2011. [Google Scholar]
- Ahmad Ludin, N.; Ahmad Affandi, N.A.; Purvis-Roberts, K.; Ahmad, A.; Ibrahim, M.A.; Sopian, K.; Jusoh, S. Environmental Impact and Levelised Cost of Energy Analysis of Solar Photovoltaic Systems in Selected Asia Pacific Region: A Cradle-to-Grave Approach. Sustain. Sci. Pract. Policy 2021, 13, 396. [Google Scholar]
- BOE Energy Statistics. Available online: https://www.moeaboe.gov.tw/wesnq/ (accessed on 24 February 2020).
- Big Jump in Photovoltaic Installed Capacity. Available online: https://money.udn.com/money/story/8888/4855651 (accessed on 22 April 2021).
- Water Resources Agency, MOEA. Available online: https://www.wra.gov.tw/Default.aspx (accessed on 22 April 2021).
- BOE Renewable Energy Development Act. Available online: https://www.moeaboe.gov.tw/ECW/renewable/content/ContentLink.aspx?menu_id=778 (accessed on 19 February 2021).
- Danchev, S.; Maniatis, G.; Tsakanikas, A. Returns on investment in electricity producing photovoltaic systems under de-escalating feed-in tariffs: The case of Greece. Renew. Sustain. Energy Rev. 2010, 14, 500–505. [Google Scholar] [CrossRef]
- Hsu, C.-W.; Ho, S.-P. Assessing feed-in tariffs on wind power installation and industry development in Taiwan. Renew. Sustain. Energy Rev. 2016, 58, 548–557. [Google Scholar] [CrossRef]
- Liou, H.M. Comparing feed-in tariff incentives in Taiwan and Germany. Renew. Sustain. Energy Rev. 2015, 50, 1021–1034. [Google Scholar] [CrossRef]
- Tsai, W.-T. Feed-in tariff promotion and innovative measures for renewable electricity: Taiwan case analysis. Renew. Sustain. Energy Rev. 2014, 40, 1126–1132. [Google Scholar] [CrossRef]
- Lin, J.-X.; Wen, P.-L.; Feng, C.-C.; Lin, S.-M.; Ko, F.-K. Policy target, feed-in tariff, and technological progress of PV in Taiwan. Renew. Sustain. Energy Rev. 2014, 39, 628–639. [Google Scholar] [CrossRef]
- Hsu, C.-W. Using a system dynamics model to assess the effects of capital subsidies and feed-in tariffs on solar PV installations. Appl. Energy 2012, 100, 205–217. [Google Scholar] [CrossRef]
- Huang, Y.-H.; Wu, J.-H. Assessment of the feed-in tariff mechanism for renewable energies in Taiwan. Energy Policy 2011, 39, 8106–8115. [Google Scholar] [CrossRef]
- Chang, M.-C.; Hu, J.-L.; Han, T.-F. An analysis of a feed-in tariff in Taiwan’s electricity market. Int. J. Electr. Power Energy Syst. 2013, 44, 916–920. [Google Scholar] [CrossRef]
- Chou, S.-Y.; Nguyen, T.A.T.; Yu, T.H.-K.; Phan, N.K.P. Financial assessment of government subsidy policy on photovoltaic systems for industrial users: A case study in Taiwan. Energy Policy 2015, 87, 505–516. [Google Scholar] [CrossRef]
- Lin, Z.-H.; Wang, H.-F. Assessment of the solar power investment with feed-in tariff policy: A case in Taiwan. In Proceedings of the 2015 International Conference on Industrial Engineering and Operations Management (IEOM), Dubai, United Arab Emirates, 3–5 March 2015; pp. 1–8. [Google Scholar]
- REN21. REN21 Renewables 2019 Global Status Report; REN21: Paris, France, 2019; Available online: https://www.ren21.net/gsr-2019 (accessed on 7 March 2020).
- Couture, T.; Cory, K. State Clean Energy Policies Analysis (SCEPA) Project: An. Analysis of Renewable Energy Feed-in Tariffs in the United States (Revised); National Renewable Energy Lab.(NREL): Golden, CO, USA, 2009. [Google Scholar]
- Wang, K.M.; Cheng, Y.J. The Evolution of feed-in tariff policy in Taiwan. Energy Strategy Rev. 2012, 1, 130–133. [Google Scholar] [CrossRef]
- Campbell, M. The economics of PV systems. In Photovoltaic Solar Energy: From Fundamentals to Applications; John Wiley & Sons: Hoboken, NJ, USA, 2017; pp. 623–649. [Google Scholar]
- de Jager, D.; Rathmann, M. Policy Instrument Design to Reduce Financing Costs in Renewable Energy Technology Projects. Available online: http://citeseerx.ist.psu.edu/viewdoc/download?doi=10.1.1.592.3720&rep=rep1&type=pdf (accessed on 2 February 2021).
- Komendantova, N.; Patt, A.; Williges, K. Solar power investment in North Africa: Reducing perceived risks. Renew. Sustain. Energy Rev. 2011, 15, 4829–4835. [Google Scholar] [CrossRef]
- Hwang, J.J. Promotional policy for renewable energy development in Taiwan. Renew. Sustain. Energy Rev. 2010, 14, 1079–1087. [Google Scholar] [CrossRef]
- Jean, J.; Woodhouse, M.; Bulović, V. Accelerating Photovoltaic Market Entry with Module Replacement. Joule 2019, 3, 2824–2841. [Google Scholar] [CrossRef]
- Brounen, D.; de Jong, A.; Koedijk, K. Corporate Finance in Europe: Confronting Theory with Practice. Financ. Manag. 2004, 33, 71–101. [Google Scholar]
- Graham, J.R.; Harvey, C.R. The theory and practice of corporate finance: Evidence from the field. J. Financ. Econ. 2001, 60, 187–243. [Google Scholar]
- Martín, H.; Coronas, S.; Alonso, À.; de la Hoz, J.; Matas, J. Renewable Energy Auction Prices: Near Subsidy-Free? Energies 2020, 13, 3383. [Google Scholar] [CrossRef]
- Finnerty, J.D. Project Financing: Asset-Based Financial Engineering; John Wiley & Sons: Hoboken, NJ, USA, 2007; ISBN 9780470139240. [Google Scholar]
- Higuchi, T. Others Natural Resource and PPP Infrastructure Projects and Project Finance. In Economics, Law, and Institutions in Asia Pacific; Springer: Berlin/Heidelberg, Germany, 2019. [Google Scholar]
- Yescombe, E.R. Principles of Project Finance, 2nd ed.; Academic Press: London, UK, 2013; ISBN 9780124157552. [Google Scholar]
- IEA. Mapping the Road Ahead; IEA: Paris, France, 2019. [Google Scholar]
- Effects of Changes in Natural Gas Prices and Renewable Capital Costs on the Electric Sector in Asia; EIA: Paris, France, 2020.
- McDonald, A.; Schrattenholzer, L. Learning rates for energy technologies. Energy Policy 2001, 29, 255–261. [Google Scholar] [CrossRef]
- van der Zwaan, B.; Rabl, A. Prospects for PV: A learning curve analysis. Sol. Energy 2003, 74, 19–31. [Google Scholar] [CrossRef]
- Talavera, D.L.; Nofuentes, G.; Aguilera, J. The internal rate of return of photovoltaic grid-connected systems: A comprehensive sensitivity analysis. Renew. Energy 2010, 35, 101–111. [Google Scholar] [CrossRef]
- Jordan, D.C.; Kurtz, S.R.; VanSant, K.; Newmiller, J. Compendium of photovoltaic degradation rates. Prog. Photovolt. Res. Appl. 2016, 24, 978–989. [Google Scholar] [CrossRef]
- Drury, E.; Denholm, P.; Margolis, R. Impact of Different Economic Performance Metrics on the Perceived Value of Solar Photovoltaics; National Renewable Energy Lab. (NREL): Golden, CO, USA, 2011. [Google Scholar]
- Stein, J.S.; Robinson, C.; King, B.; Deline, C.; Rummel, S.; Sekulic, B. PV Lifetime Project: Measuring PV Module Performance Degradation: 2018 Indoor Flash Testing Results. In Proceedings of the 2018 IEEE 7th World Conference on Photovoltaic Energy Conversion (WCPEC). A Joint Conference of 45th IEEE PVSC, 28th PVSEC 34th EU PVSEC, Waikoloa, HI, USA, 10–15 June 2018; pp. 0771–0777. [Google Scholar]


Publisher’s Note: MDPI stays neutral with regard to jurisdictional claims in published maps and institutional affiliations. |
© 2021 by the authors. Licensee MDPI, Basel, Switzerland. This article is an open access article distributed under the terms and conditions of the Creative Commons Attribution (CC BY) license (https://creativecommons.org/licenses/by/4.0/).