
Standardizing Performance Metrics for Building-Level Electrical Distribution Systems

 , , ,
, , ,
Abstract
:1. Introduction
1.1. Background
1.2. Motivation
1.3. Contribution
- Boundary allocation
- Metrics estimation
2. Proposed Approach
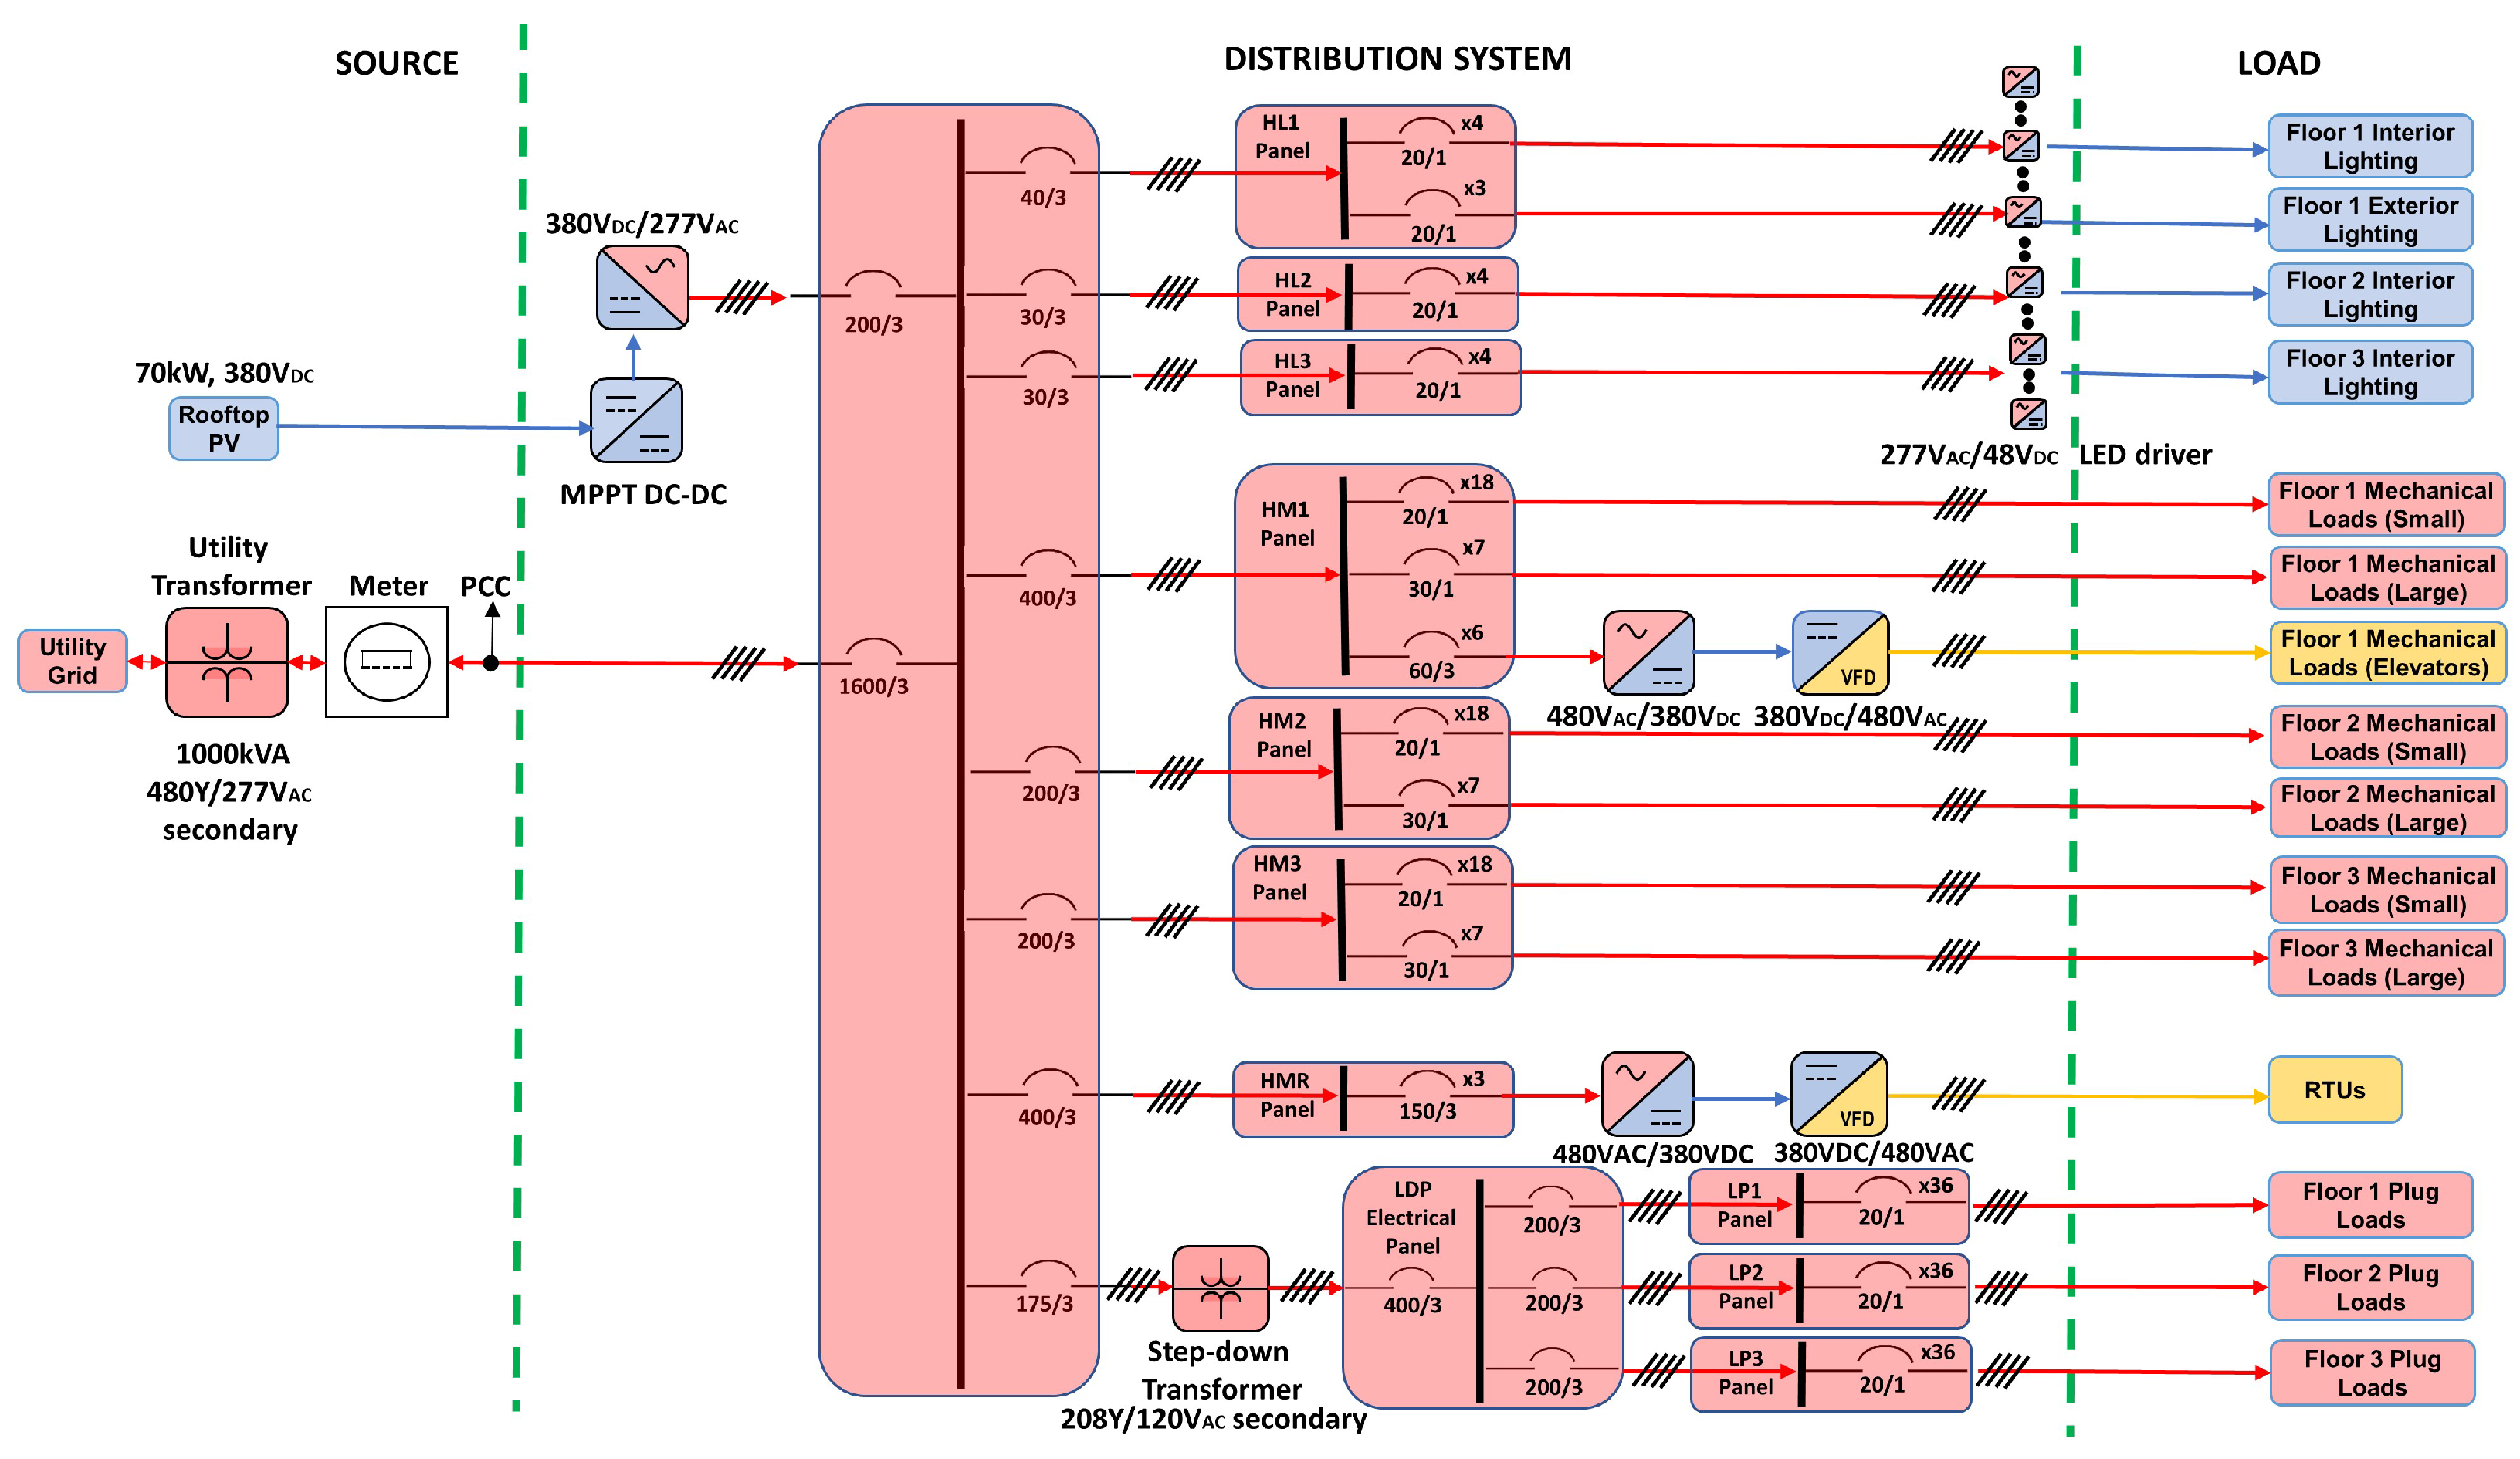
2.1. Typical Building Electrical Distribution System
2.2. Boundary Allocation
- The whole-building boundary comprises the entire building electrical distribution system, starting from the point of common coupling. On-site energy sources (PV, BESS, DG, etc.) are also considered part of the whole-building boundary, as they are not metered by the electric utility.
- The building electrical distribution system boundary includes the intermediate equipment between the point of common coupling and the end-use loads. In the case of a building that has interconnected on-site energy sources, this boundary also includes the converters associated with them.
- The building electrical distribution system boundary plus primary conversion stages includes all the equipment encompassed by the previous boundary plus the internal conversion equipment associated with the end-use loads.
- The DC-only distribution boundary encompasses all the DC distribution of the overall system.
- The end-use load boundary includes the loads and their associated conversion equipment.
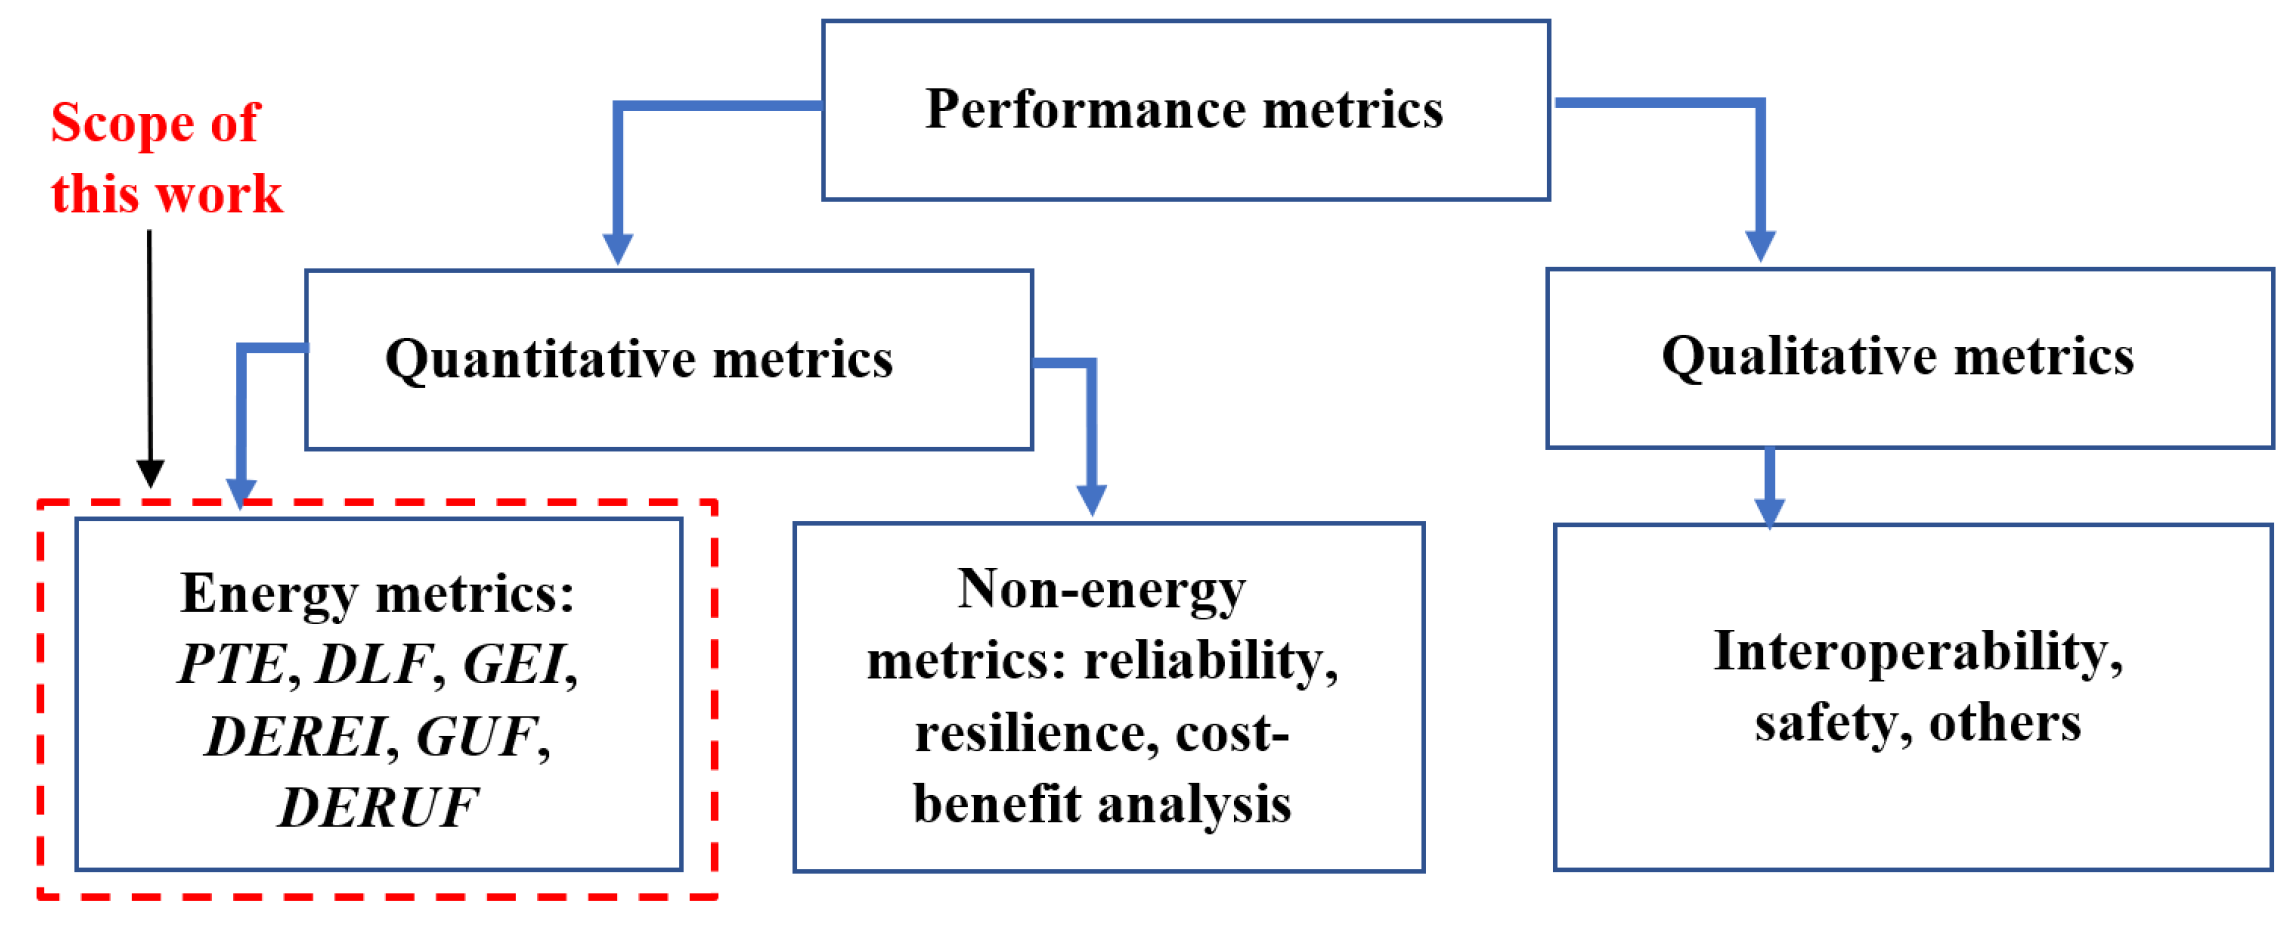
2.3. Metrics Estimation
- i
- Power Transfer Effectiveness (PTE)
- ii
- Distribution Loss Function (DLF)
- iii
- Grid Energy Intensity (GEI)
- iv
- DER Energy Intensity (DEREI)
- v
- Grid Utilization Fraction (GUF)
- vi
- DER Utilization Fraction (DERUF)
3. Case Study
3.1. AC Distribution System Models
3.2. Hybrid AC/DC Distribution System Model
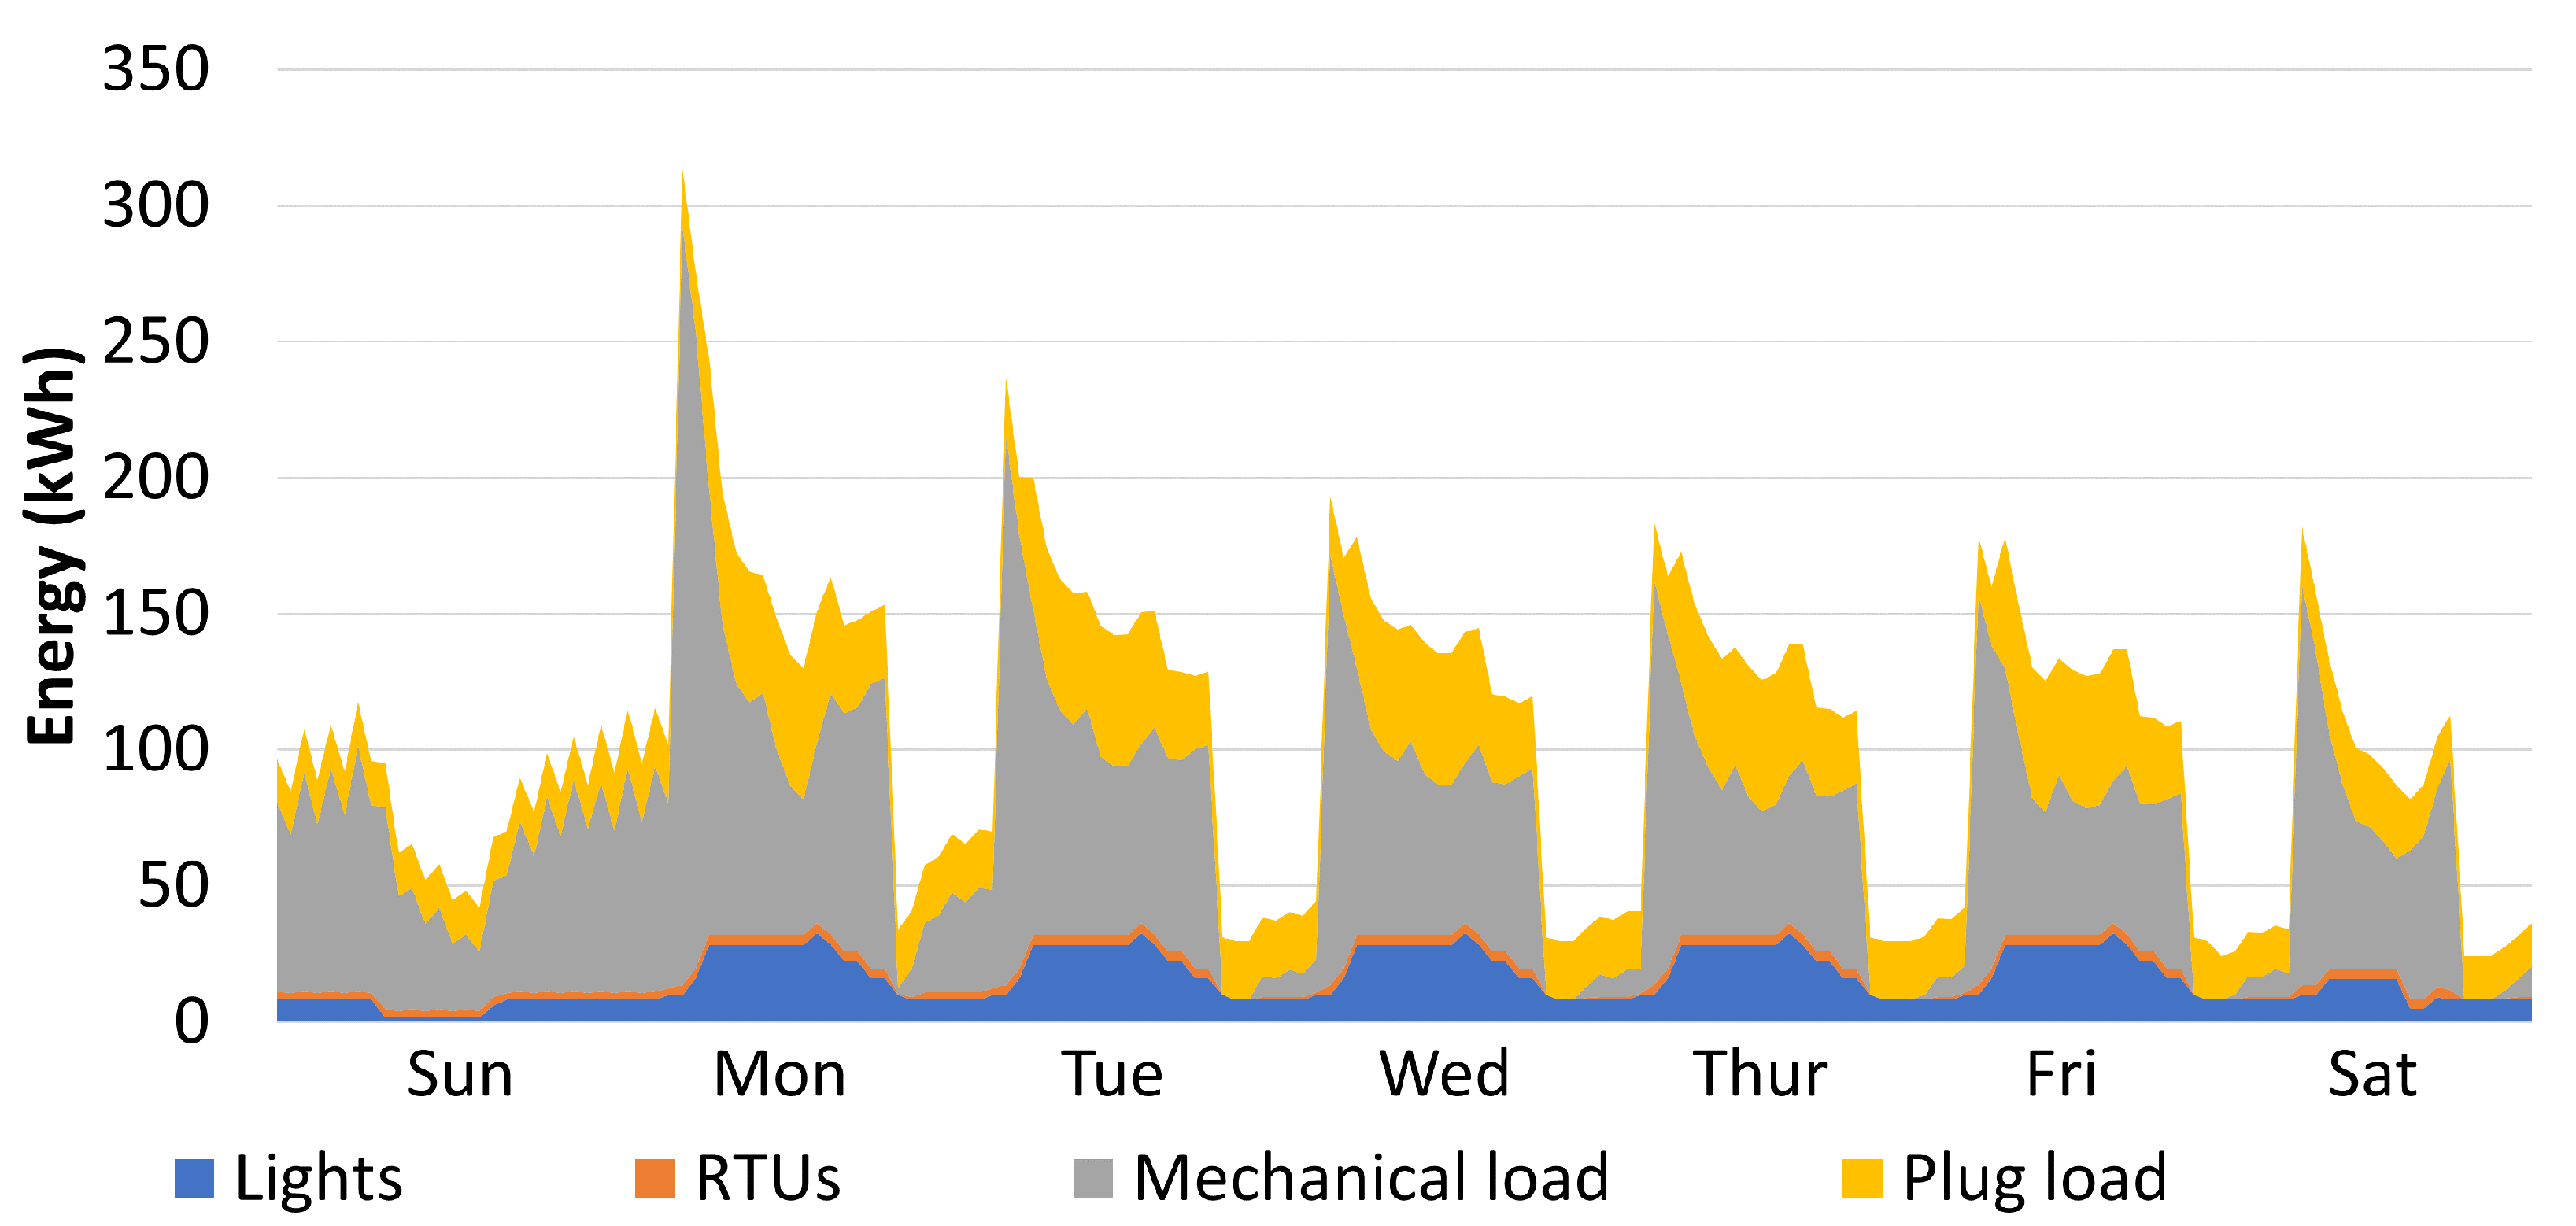
4. Simulation Results
5. Discussion
6. Conclusions and Future Work
Author Contributions
Funding
Institutional Review Board Statement
Informed Consent Statement
Data Availability Statement
Acknowledgments
Conflicts of Interest
Appendix A

| Load Type | System | Manufacturer | Part Number | (V) | (V) | (kW) |
|---|---|---|---|---|---|---|
| Interior Lighting | AC | Osram | Oti-48 | 277 AC | 48 DC | 0.048 |
| Hybrid | SynQor | BQ4H480FTx64 | 380 (230–400) DC | 48 DC | 3.04 | |
| Exterior Lighting | AC | Murata | MVAB120 | 277 AC | 48 DC | 0.12 |
| Hybrid | Emerson | C 400/48-3500e | 380 (260–400) DC | 48 DC | 3.5 | |
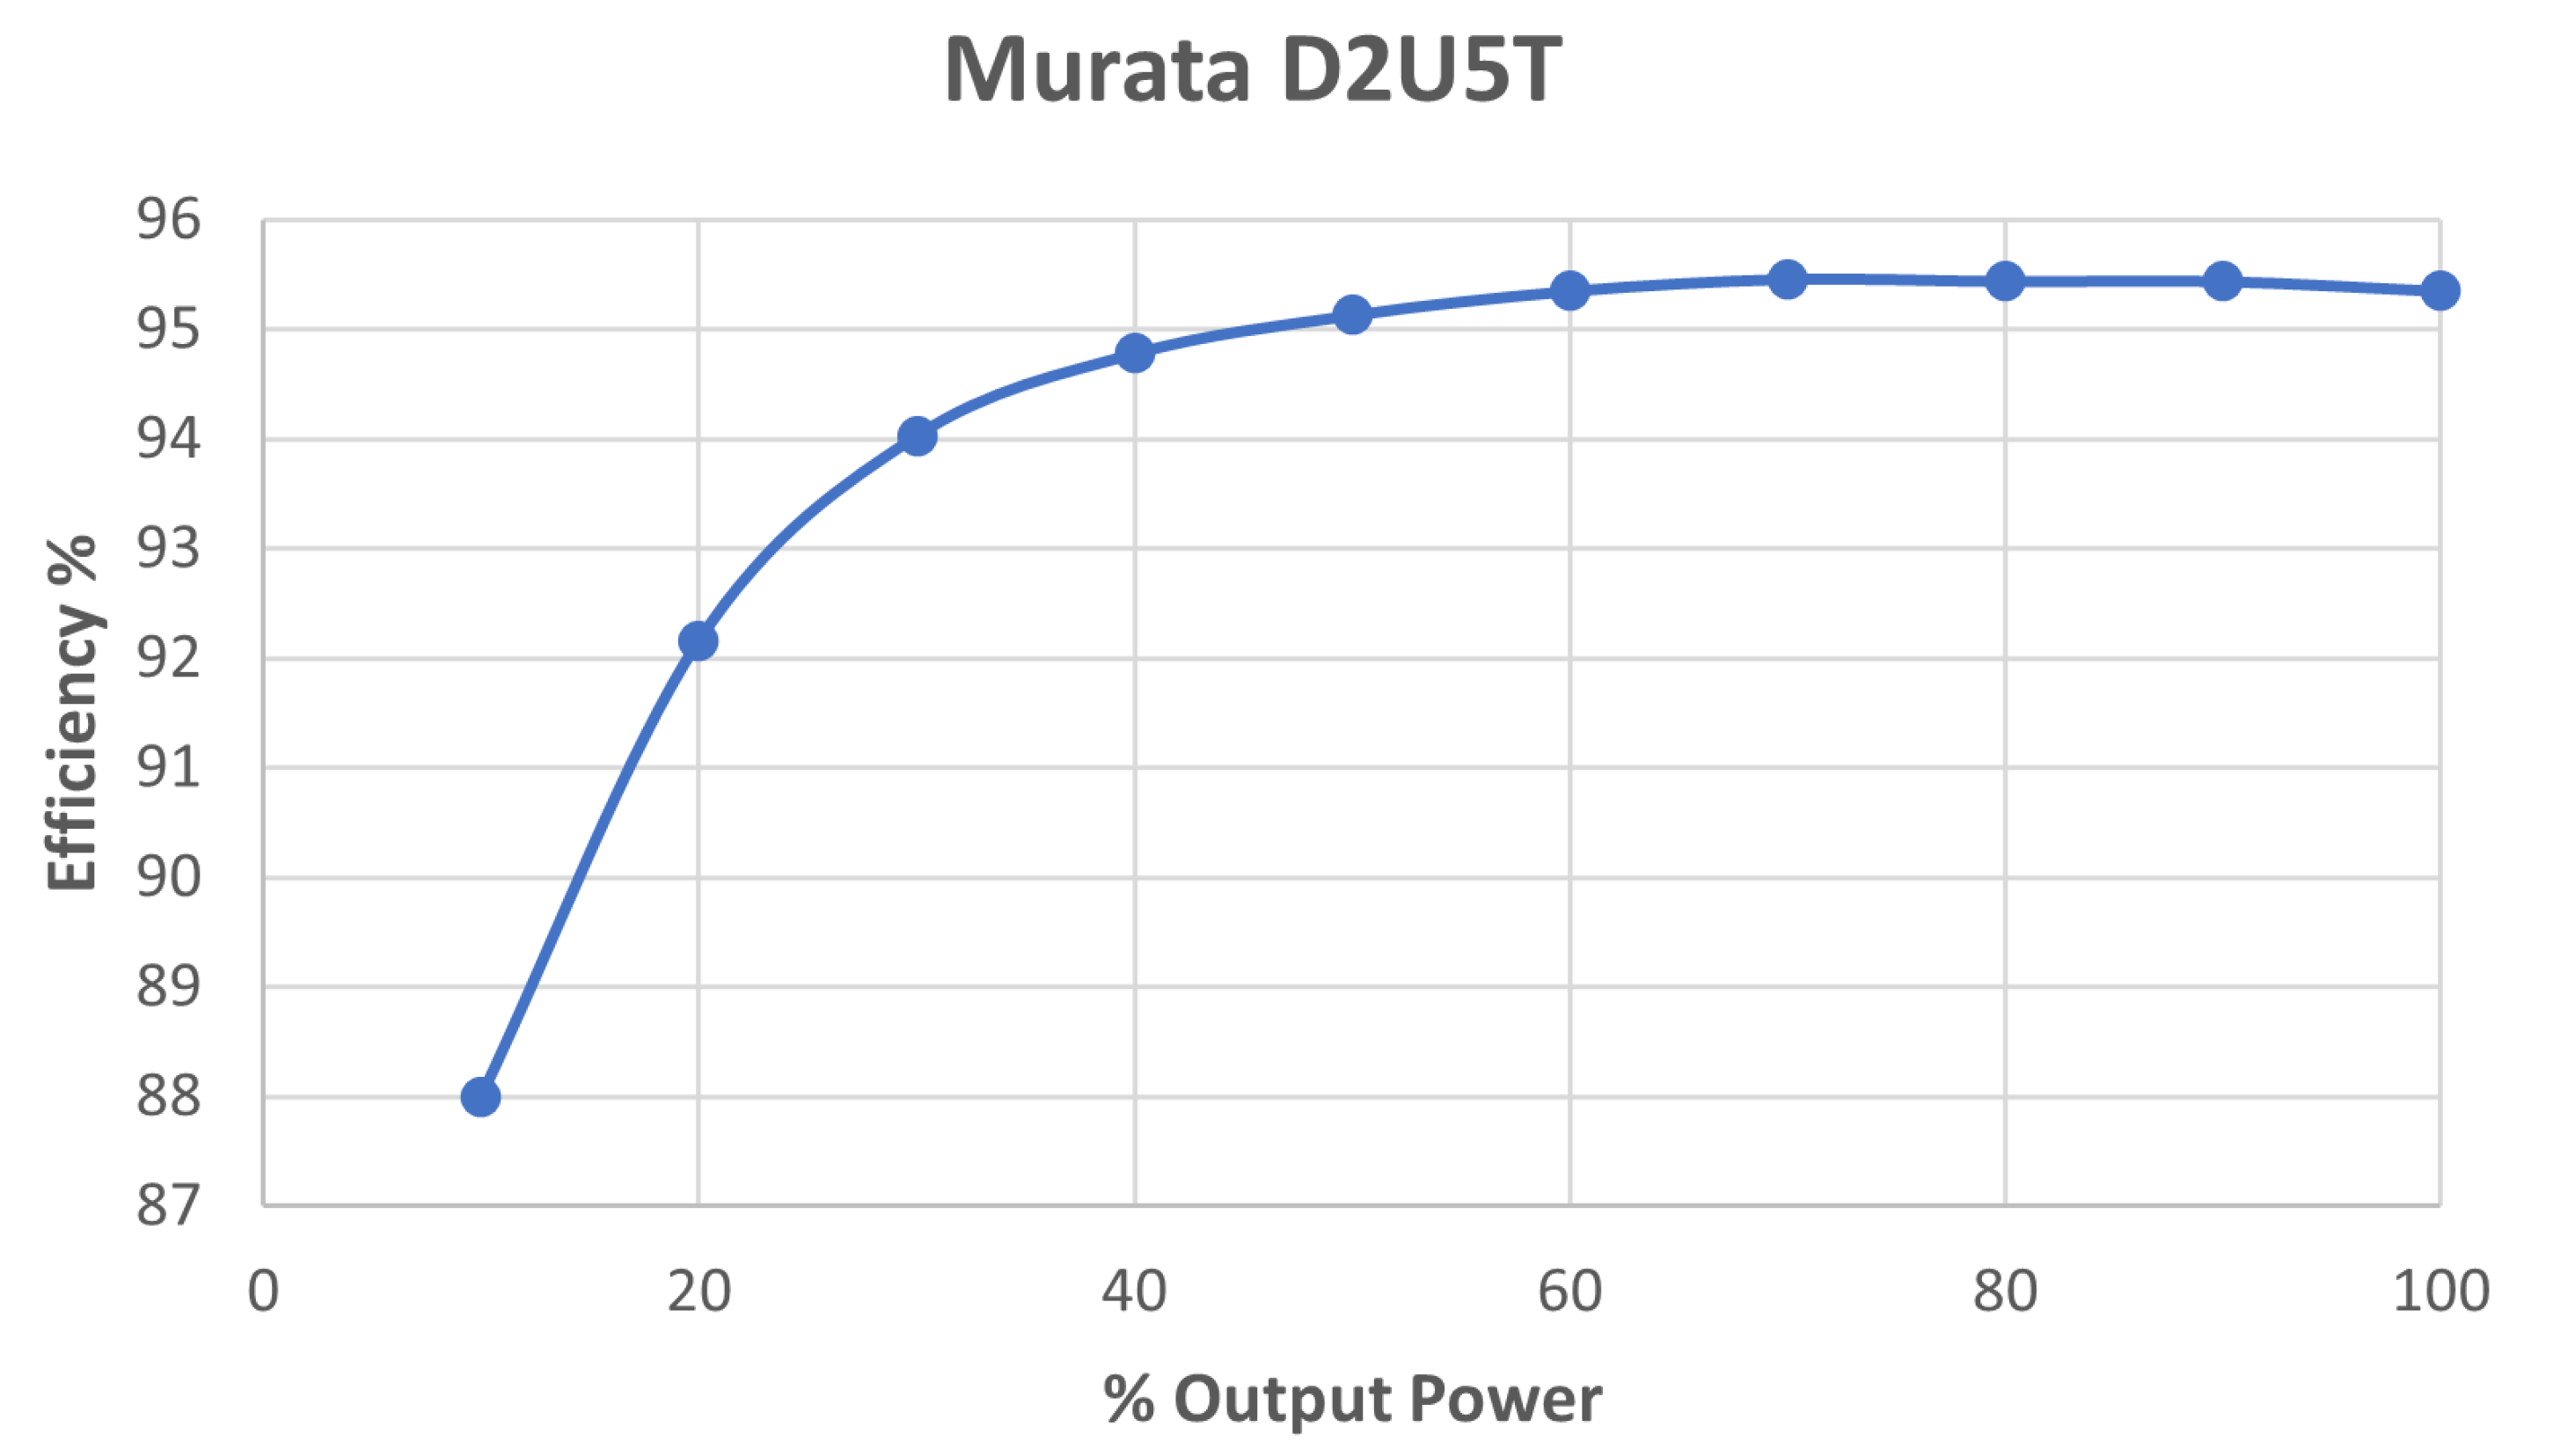
| Elevators | AC/Hybrid | Murata | D2U5T | 480 (320–528) AC3LL | 380 (290–400) DC | 5 |
| Eltek | 3.8HE-t UL | 360 (230–500) DC | 208 AC3LL | 3.8 | ||
| RTUs | AC/Hybrid | CET Power | Sierra 25 | 480 (260–530) AC3LL | 380 (290–600) DC | 30 |
| ABB | TRIO-27.6-TL-OUTD-US-480 | 715 (200–950) DC | 480 AC3LL | 27.6 | ||
| Solar (MPPT) | AC/Hybrid | Foshan SC Power | SC-MH MPPT 40A | 380 (110–380) DC | 240 (96–240) DC | 11.04 |
| Solar (Bidirectional) | Rhombus Energy Solutions | RES-BESS60DP-480 | 480 AC3LL | 441 (270–870) DC | 59.789 |
References
- Fairey, P.; Goldstein, P. Metrics for energy efficient buildings: How do we measure efficiency. In ACEEE Summer Study on Energy Efficiency in Buildings; ACEEE: Pacific Grove, CA, USA, 2016. [Google Scholar]
- Alhorr, Y.; Eliskandarani, E.; Elsarrag, E. Approaches to reducing carbon dioxide emissions in the built environment: Low carbon cities. Int. J. Sustain. Built Environ. 2014, 3, 167–178. [Google Scholar] [CrossRef] [Green Version]
- Lantero, A. The War of the Currents: AC vs. DC Power; Energy.Gov: Washington, DC, USA, 2013.
- Dastgeer, F.; Kalam, A. Efficiency comparison of DC and AC distribution systems for distributed generation. In Proceedings of the 2009 Australasian Universities Power Engineering Conference, Adelaide, Australia, 27–30 September 2009; pp. 1–5. [Google Scholar]
- Prabhala, V.A.; Baddipadiga, B.P.; Fajri, P.; Ferdowsi, M. An overview of direct current distribution system architectures & benefits. Energies 2018, 11, 2463. [Google Scholar]
- Sirsi, R.; Ambekar, Y. Efficiency of DC microgrid on DC distribution system. In Proceedings of the 2015 IEEE Innovative Smart Grid Technologies-Asia (ISGT ASIA), Bangkok, Thailand, 3–6 November 2015; pp. 1–6. [Google Scholar]
- Vossos, V.; Gerber, D.; Bennani, Y.; Brown, R.; Marnay, C. Techno-economic analysis of DC power distribution in commercial buildings. Appl. Energy 2018, 230, 663–678. [Google Scholar] [CrossRef] [Green Version]
- Vossos, E.; Gaillet-Tournier, M.; Gerber, D.; Nordman, B.; Brown, R.; Bernal, W.; Ghatpande, O.; Saha, A.; Deru, M.; Frank, S. Direct-DC Power in Buildings: Identifying the Best Applications Today for Tomorrow’s Building Sector; Technical Report; Lawrence Berkeley National Lab. (LBNL): Berkeley, CA, USA, 2021.
- Becker, D.J.; Sonnenberg, B. DC microgrids in buildings and data centers. In Proceedings of the 2011 IEEE 33rd International Telecommunications Energy Conference (INTELEC), Amsterdam, The Netherlands, 9–13 October 2011; pp. 1–7. [Google Scholar]
- Frank, S.M.; Rebennack, S. Optimal design of mixed AC–DC distribution systems for commercial buildings: A Nonconvex Generalized Benders Decomposition approach. Eur. J. Oper. Res. 2015, 242, 710–729. [Google Scholar] [CrossRef]
- Seo, G.S.; Baek, J.; Choi, K.; Bae, H.; Cho, B. Modeling and analysis of DC distribution systems. In Proceedings of the 8th International Conference on Power Electronics-ECCE Asia, Jeju, Korea, 30 May–3 June 2011; pp. 223–227. [Google Scholar]
- Kakigano, H.; Nomura, M.; Ise, T. Loss evaluation of DC distribution for residential houses compared with AC system. In Proceedings of the 2010 International Power Electronics Conference-ECCE ASIA, Sapporo, Japan, 21–24 June 2010; pp. 480–486. [Google Scholar]
- Nilsson, D.; Sannino, A. Efficiency analysis of low-and medium-voltage DC distribution systems. In Proceedings of the IEEE Power Engineering Society General Meeting, Denver, CO, USA, 6–10 June 2004; pp. 2315–2321. [Google Scholar]
- Salomonsson, D.; Sannino, A. Low-voltage DC distribution system for commercial power systems with sensitive electronic loads. IEEE Trans. Power Deliv. 2007, 22, 1620–1627. [Google Scholar] [CrossRef]
- Gerber, D.L.; Vossos, V.; Feng, W.; Marnay, C.; Nordman, B.; Brown, R. A simulation-based efficiency comparison of AC and DC power distribution networks in commercial buildings. Appl. Energy 2018, 210, 1167–1187. [Google Scholar] [CrossRef] [Green Version]
- Dastgeer, F.; Gelani, H.E. A Comparative analysis of system efficiency for AC and DC residential power distribution paradigms. Energy Build. 2017, 138, 648–654. [Google Scholar] [CrossRef]
- Starke, M.; Tolbert, L.M.; Ozpineci, B. AC vs. DC distribution: A loss comparison. In Proceedings of the 2008 IEEE/PES Transmission and Distribution Conference and Exposition, Chicago, IL, USA, 21–24 April 2008; pp. 1–7. [Google Scholar]
- Barros, J.; de Apráiz, M.; Diego, R.I. Power quality in DC distribution networks. Energies 2019, 12, 848. [Google Scholar] [CrossRef] [Green Version]
- Van den Broeck, G.; Stuyts, J.; Driesen, J. A critical review of power quality standards and definitions applied to DC microgrids. Appl. Energy 2018, 229, 281–288. [Google Scholar] [CrossRef]
- Whaite, S.; Grainger, B.; Kwasinski, A. Power quality in DC power distribution systems and microgrids. Energies 2015, 8, 4378–4399. [Google Scholar] [CrossRef] [Green Version]
- Zhang, L.; Good, N.; Mancarella, P. Building-to-grid flexibility: Modelling and assessment metrics for residential demand response from heat pump aggregations. Appl. Energy 2019, 233, 709–723. [Google Scholar] [CrossRef]
- Hutchinson, S.; Heredia, W.G.B.; Ghatpande, O.A. Resilience Metrics for Building-Level Electrical Distribution Systems with Energy Storage. 2021; Under Review. [Google Scholar]
- Panteli, M.; Mancarella, P.; Trakas, D.N.; Kyriakides, E.; Hatziargyriou, N.D. Metrics and quantification of operational and infrastructure resilience in power systems. IEEE Trans. Power Syst. 2017, 32, 4732–4742. [Google Scholar] [CrossRef] [Green Version]
- Turner, A.J.; Monahan, W.; Cotter, M. Quantifying the ilities: A literature review of robustness, interoperability, and agility. In Disciplinary Convergence in Systems Engineering Research; Springer: Cham, Switzerland, 2018; pp. 1035–1049. [Google Scholar]
- Koç, Y.; Warnier, M.; Kooij, R.E.; Brazier, F.M. An entropy-based metric to quantify the robustness of power grids against cascading failures. Saf. Sci. 2013, 59, 126–134. [Google Scholar] [CrossRef] [Green Version]
- Waters, C.E.; Polese, L.G.; Alahmad, M.; Frank, S.; Lee, K. Electrical distribution systems for commercial reference building models. J. Archit. Eng. 2014, 20, 04013005. [Google Scholar] [CrossRef]
- Wang, N.; Gorrissen, W.J. Commercial Building Energy Asset Score System: Program Overview and Technical Protocol (Version 1.0); Technical Report; Pacific Northwest National Lab. (PNNL): Richland, WA, USA, 2013.
- California Energy Commission, Grid Support Inverter List Full Data ADA. Available online: https://www.energy.ca.gov/media/2365 (accessed on 24 December 2021).
- Crawley, D.B.; Pedersen, C.O.; Lawrie, L.K.; Winkelmann, F.C. EnergyPlus: Energy Simulation Program. ASHRAE J. 2000, 42, 49–56. [Google Scholar]
- Dobos, A.P. PVWatts Version 5 Manual; National Renewable Energy Lab. (NREL): Golden, CO, USA, 2014. [CrossRef] [Green Version]


| Metric | Equation | Definition | Significance |
|---|---|---|---|
| Ratio of total power from electrical end-use loads in a building to the total power used to serve that load . | Measures the efficiency of building-level electrical distribution systems. Ranges from 0 (no load in distribution system) to 1 (all source power is consumed by the load). | ||
| Ratio of losses to the total power supplied to the building . | Measures the losses within a distribution system. Ranges from 0 (all source power goes to distribution system loss) to 1 (no losses in the distribution system). | ||
| Ratio of total energy supplied by the utility grid to a building to its total floor area . Measured in . | Used for standardization of grid–DER mix for different building types. | ||
| Ratio of total energy supplied by DERs to a building (-) to its total floor area . Measured in . | Used for standardization of grid–DER mix for different building types. | ||
| Ratio of total energy supplied by the utility grid to a building to the total energy demand of the building . | Measures the grid energy share to total energy consumed in the building. Ranges from 0 (no energy consumed from the utility grid) to 1 (only utility grid energy consumed). | ||
| Ratio of total energy supplied by DERs to a building () to the building’s total energy demand . | Measures the share of the DERs to total energy consumed in the building. Ranges from 0 (no energy consumed from der) to 1 (only DER energy consumed). |
| Metric | AC without PV | AC with PV | Hybrid AC/DC | Scale |
|---|---|---|---|---|
| PTE |  |  |  |  |
| DLF |  | 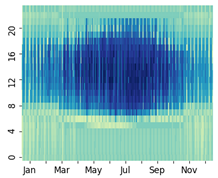 |  |  |
| GUF | 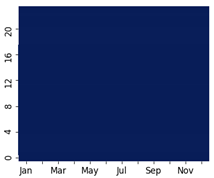 | 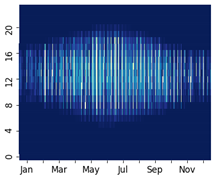 |  |  |
| DERUF | NA |  | 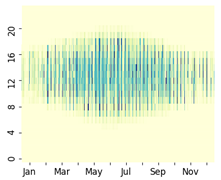 |  |
| GEI |  |  |  |  |
| DEREI | NA |  |  |  |
| Metric | Jan. (AC with PV) | June (AC with PV) | Jan. (Hybrid AC/DC) | June (Hybrid AC/DC) |
|---|---|---|---|---|
| PTE |  |  | 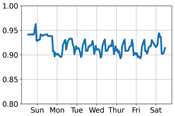 | 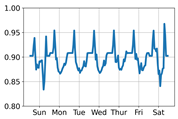 |
| DLF |  | 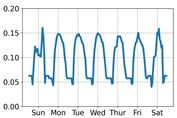 | 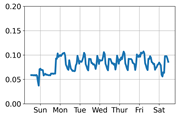 | 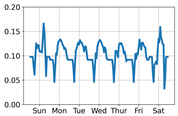 |
| GUF | 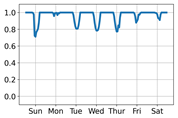 |  |  |  |
| DERUF | 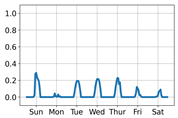 | 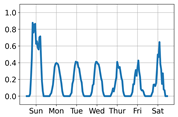 |  |  |
| GEI |  |  |  |  |
| DEREI |  |  |  |  |
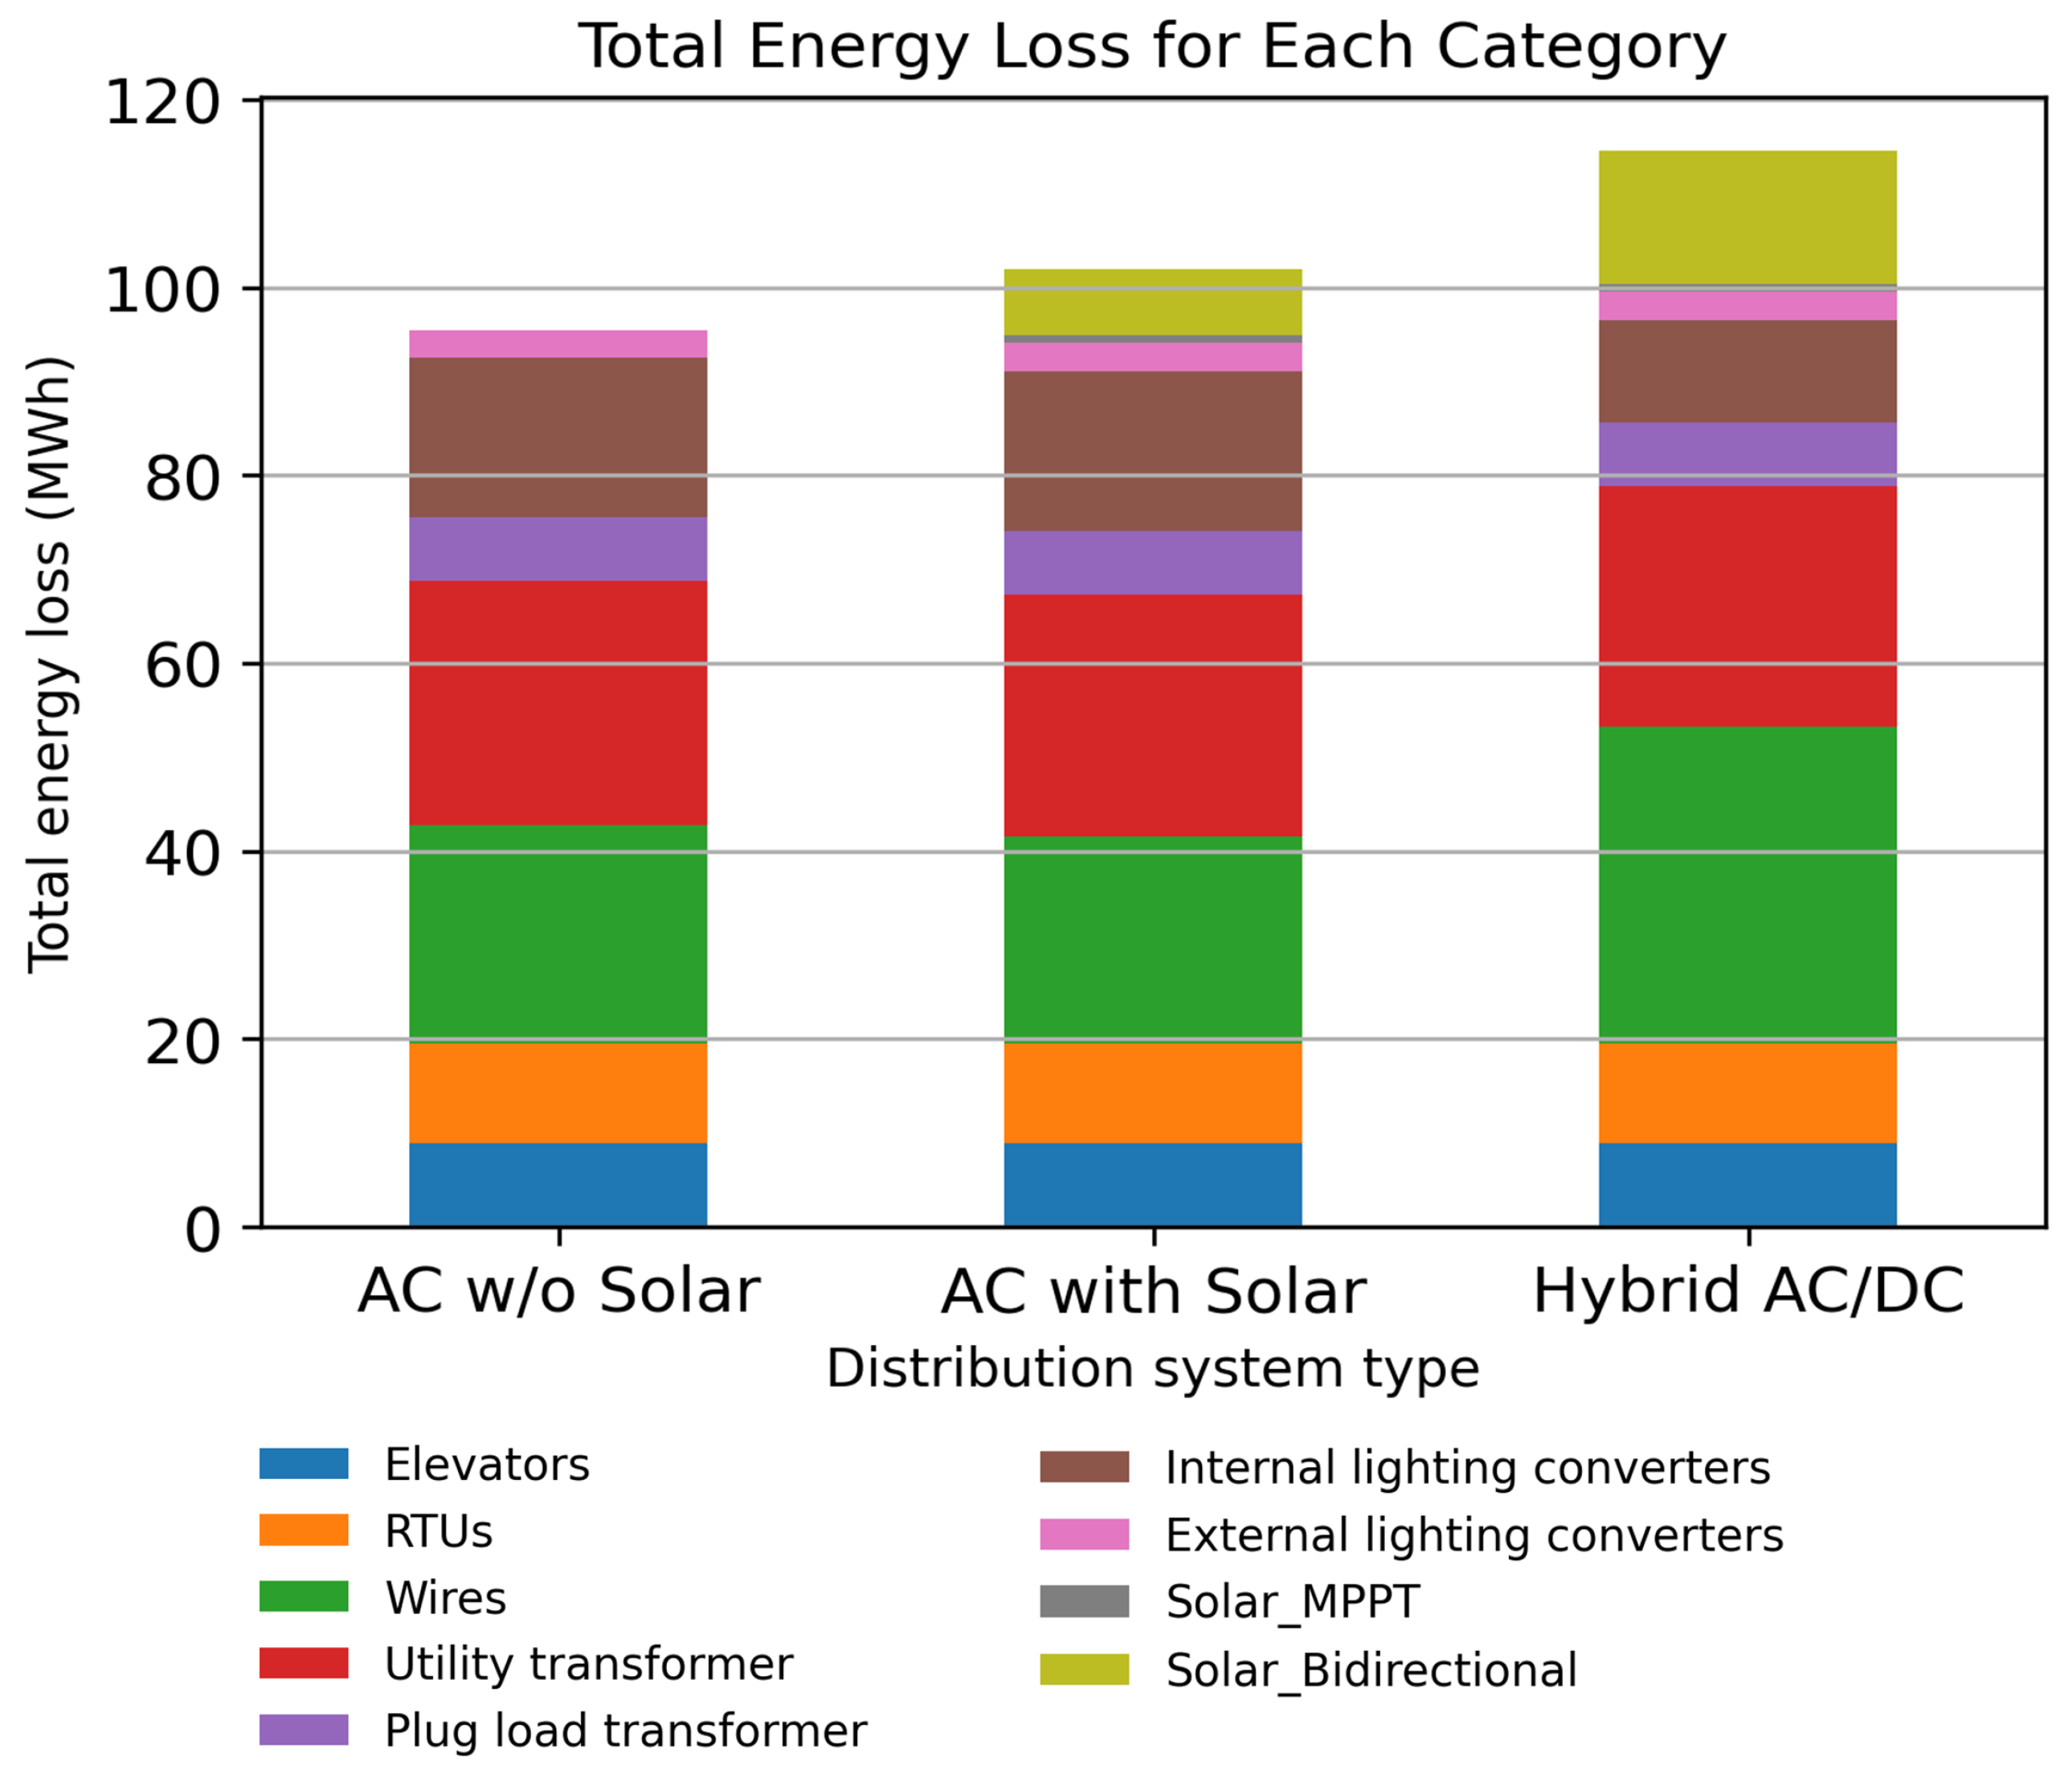
| Considered Boundary | AC without Solar | AC with Solar | Hybrid AC/DC |
|---|---|---|---|
| Distribution system | 95.36% | 94.34% | 90.46% |
| Distribution plus primary conversion | 92.60% | 91.62% | 90.46% |
Publisher’s Note: MDPI stays neutral with regard to jurisdictional claims in published maps and institutional affiliations. |
© 2021 by the authors. Licensee MDPI, Basel, Switzerland. This article is an open access article distributed under the terms and conditions of the Creative Commons Attribution (CC BY) license (https://creativecommons.org/licenses/by/4.0/).
Share and Cite
Nazir, M.; Ghatpande, O.; Bernal Heredia, W.; Wierzbanowski, C.; Gerber, D.; Saha, A. Standardizing Performance Metrics for Building-Level Electrical Distribution Systems. Energies 2022, 15, 136. https://doi.org/10.3390/en15010136
Nazir M, Ghatpande O, Bernal Heredia W, Wierzbanowski C, Gerber D, Saha A. Standardizing Performance Metrics for Building-Level Electrical Distribution Systems. Energies. 2022; 15(1):136. https://doi.org/10.3390/en15010136
Chicago/Turabian StyleNazir, Moazzam, Omkar Ghatpande, Willy Bernal Heredia, Cameron Wierzbanowski, Daniel Gerber, and Avijit Saha. 2022. "Standardizing Performance Metrics for Building-Level Electrical Distribution Systems" Energies 15, no. 1: 136. https://doi.org/10.3390/en15010136