
Reusing Flowback and Produced Water with Different Salinity to Prepare Guar Fracturing Fluid


Abstract
:
1. Introduction
2. Materials and Methods
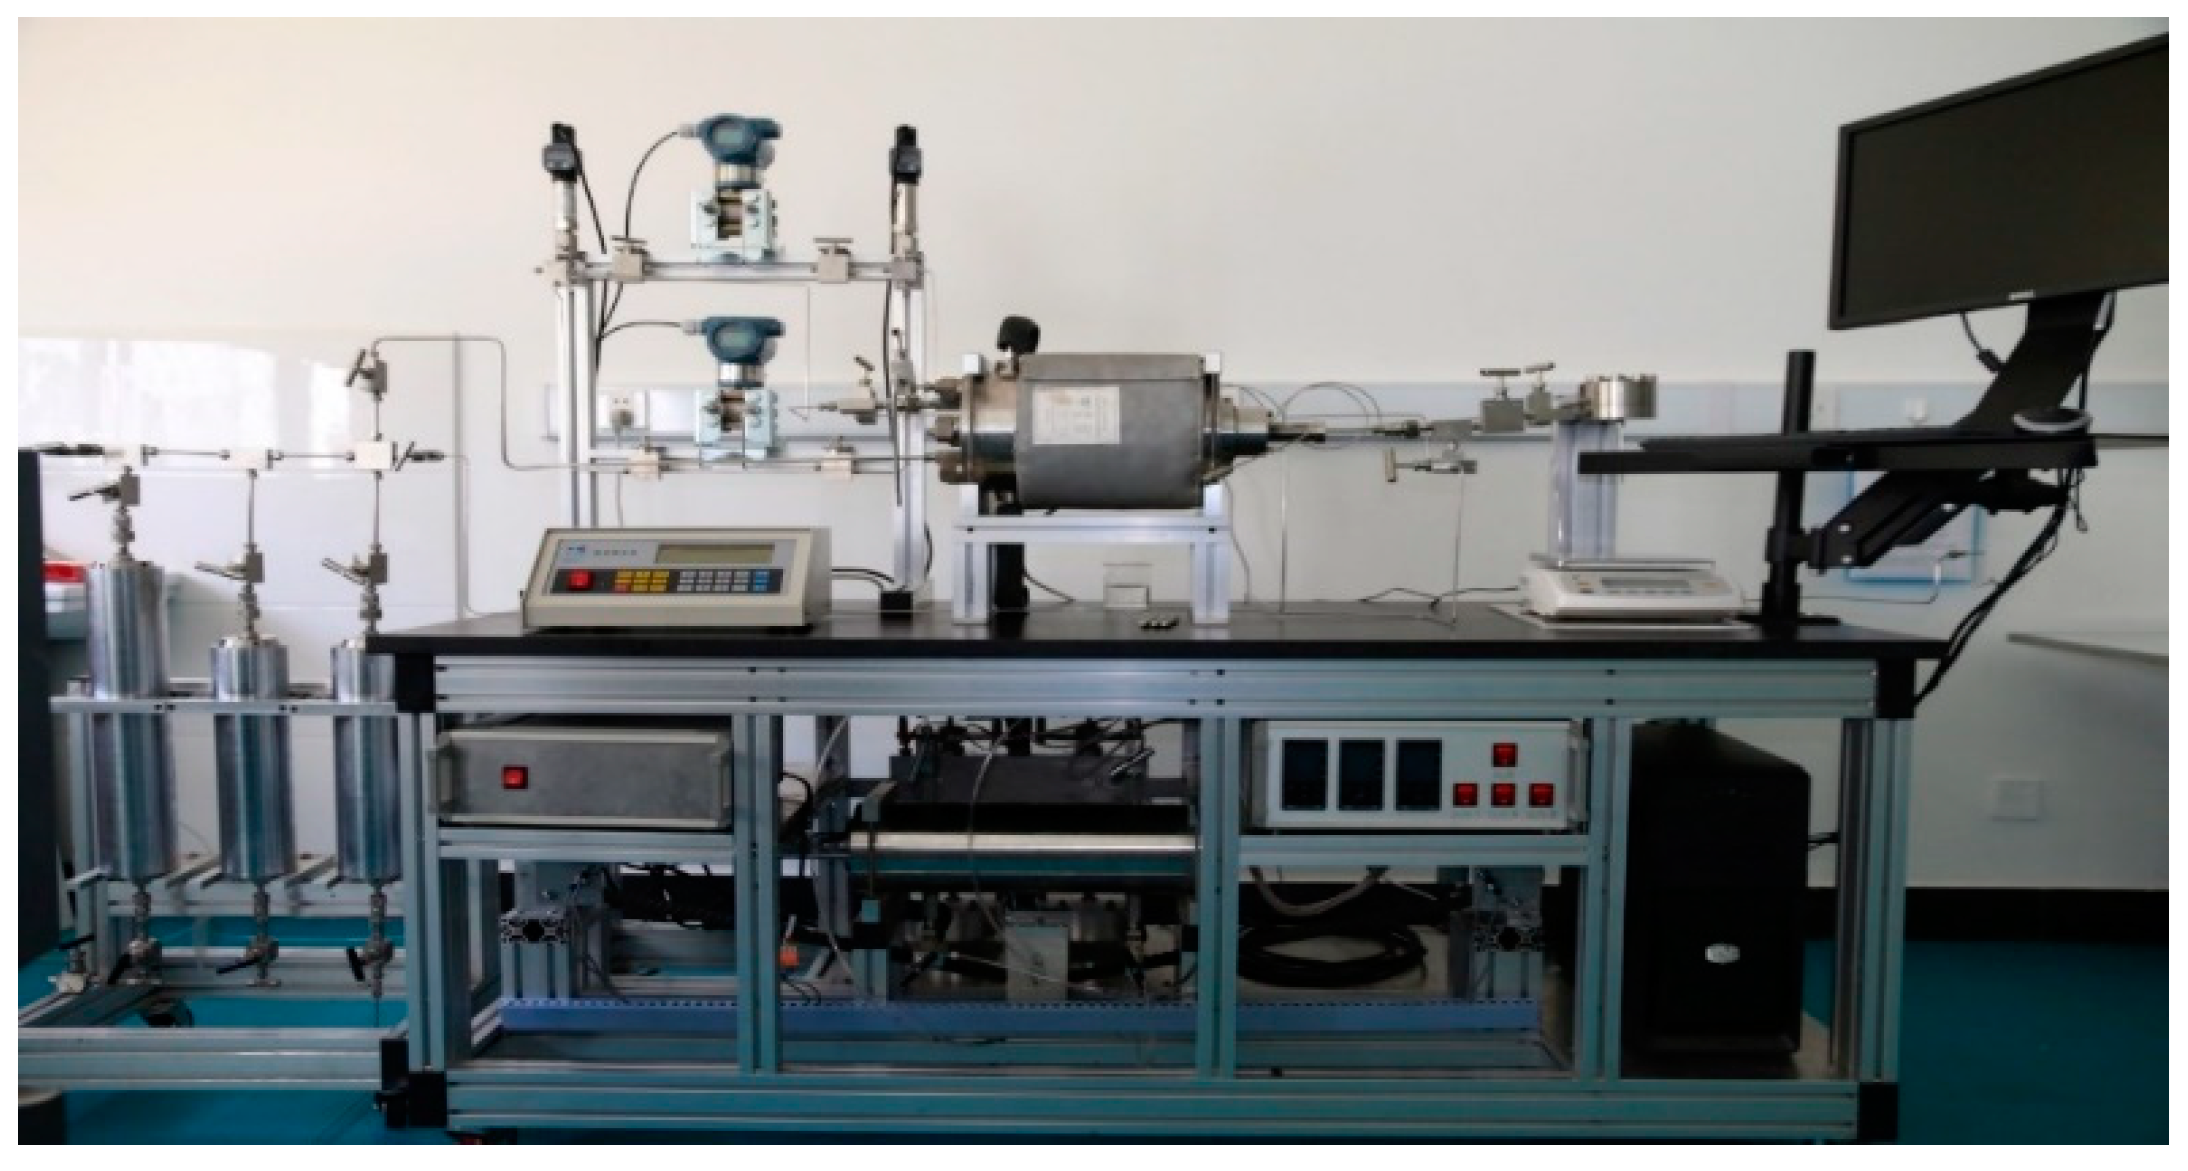
2.1. Materials and Devices
2.2. Preparation of Water Samples with Different Salinity
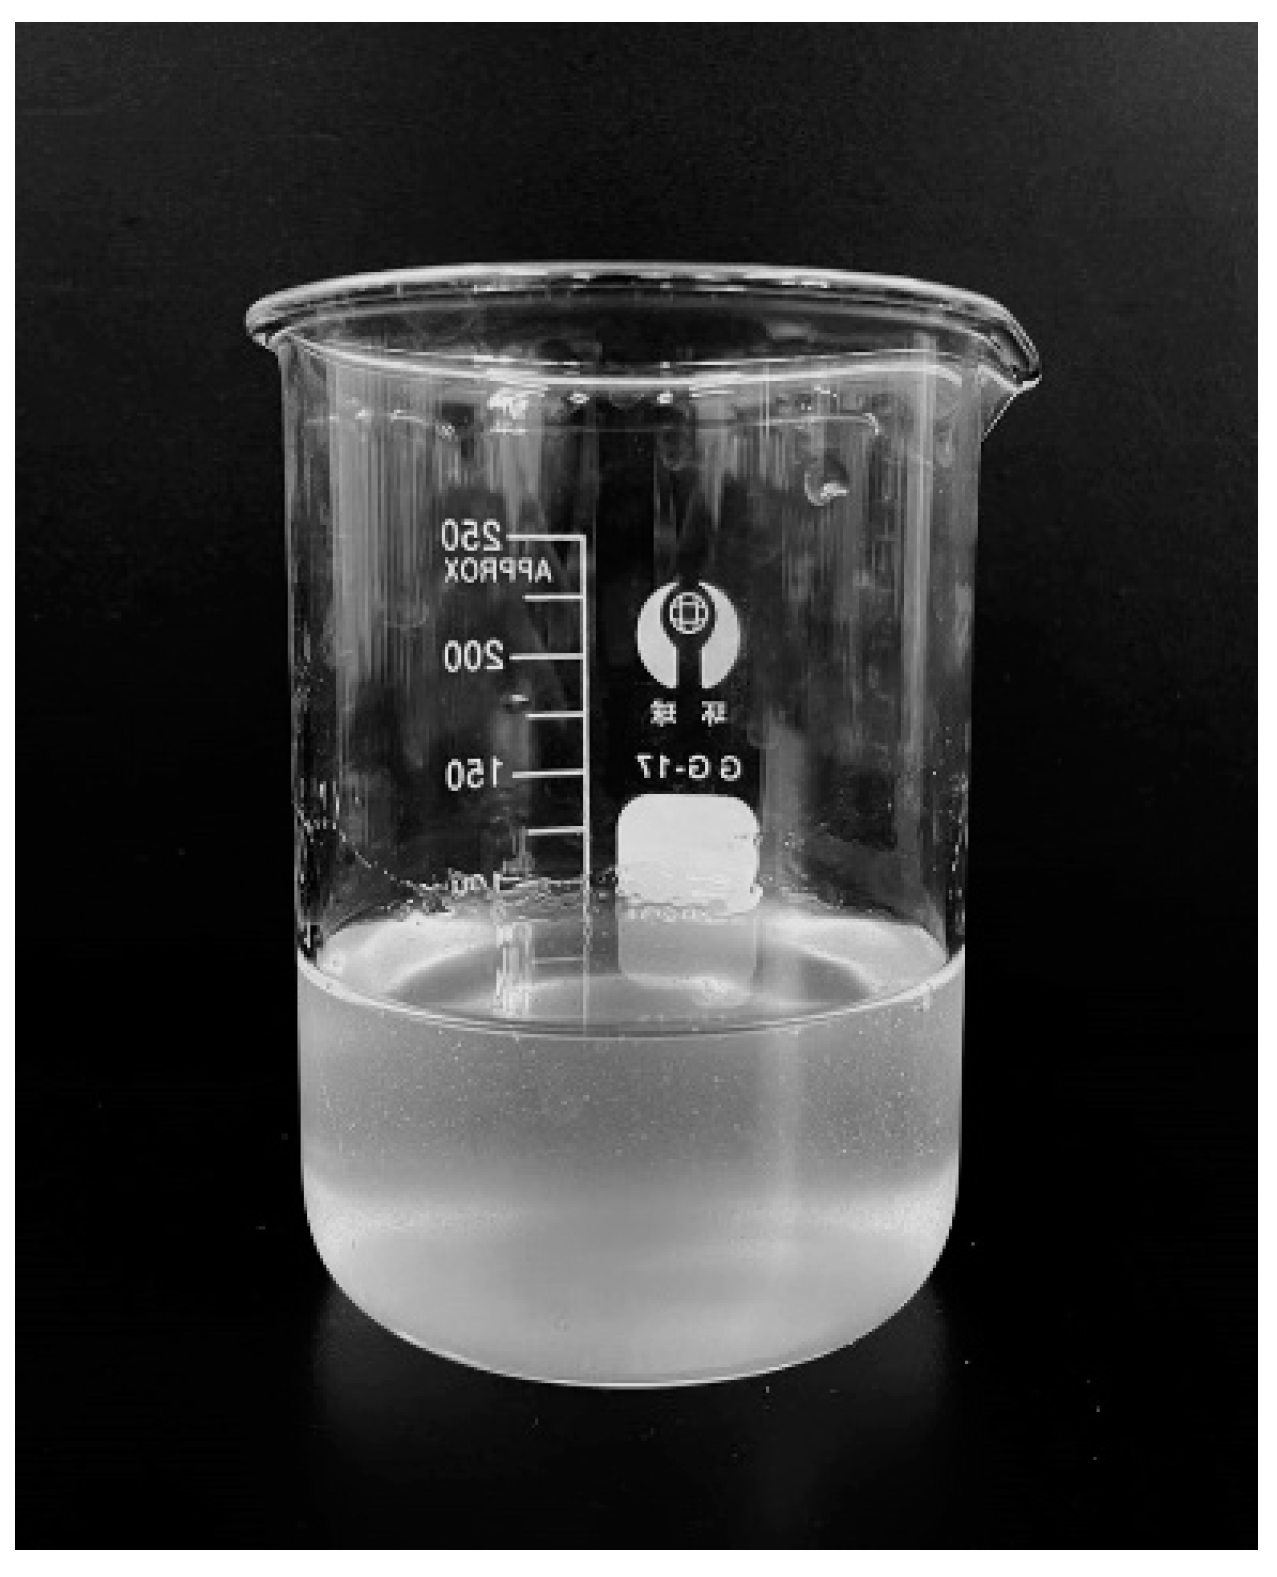
2.3. Synthesis of Crosslinker
2.4. Complexometric Titration Experiment
2.5. Preparation of Fracturing Fluid
2.6. Fracturing Fluid Performance Test
2.6.1. Temperature and Shear Resistance Test
2.6.2. Friction Reduction Test
2.6.3. Gel-Breaking Test
2.6.4. Formation Damage Test
3. Results and Discussion
3.1. Optimization of Fracturing Fluid Formula
3.1.1. Thickener
3.1.2. Chelating Agent
- (1)
- Dosage optimization
- (2)
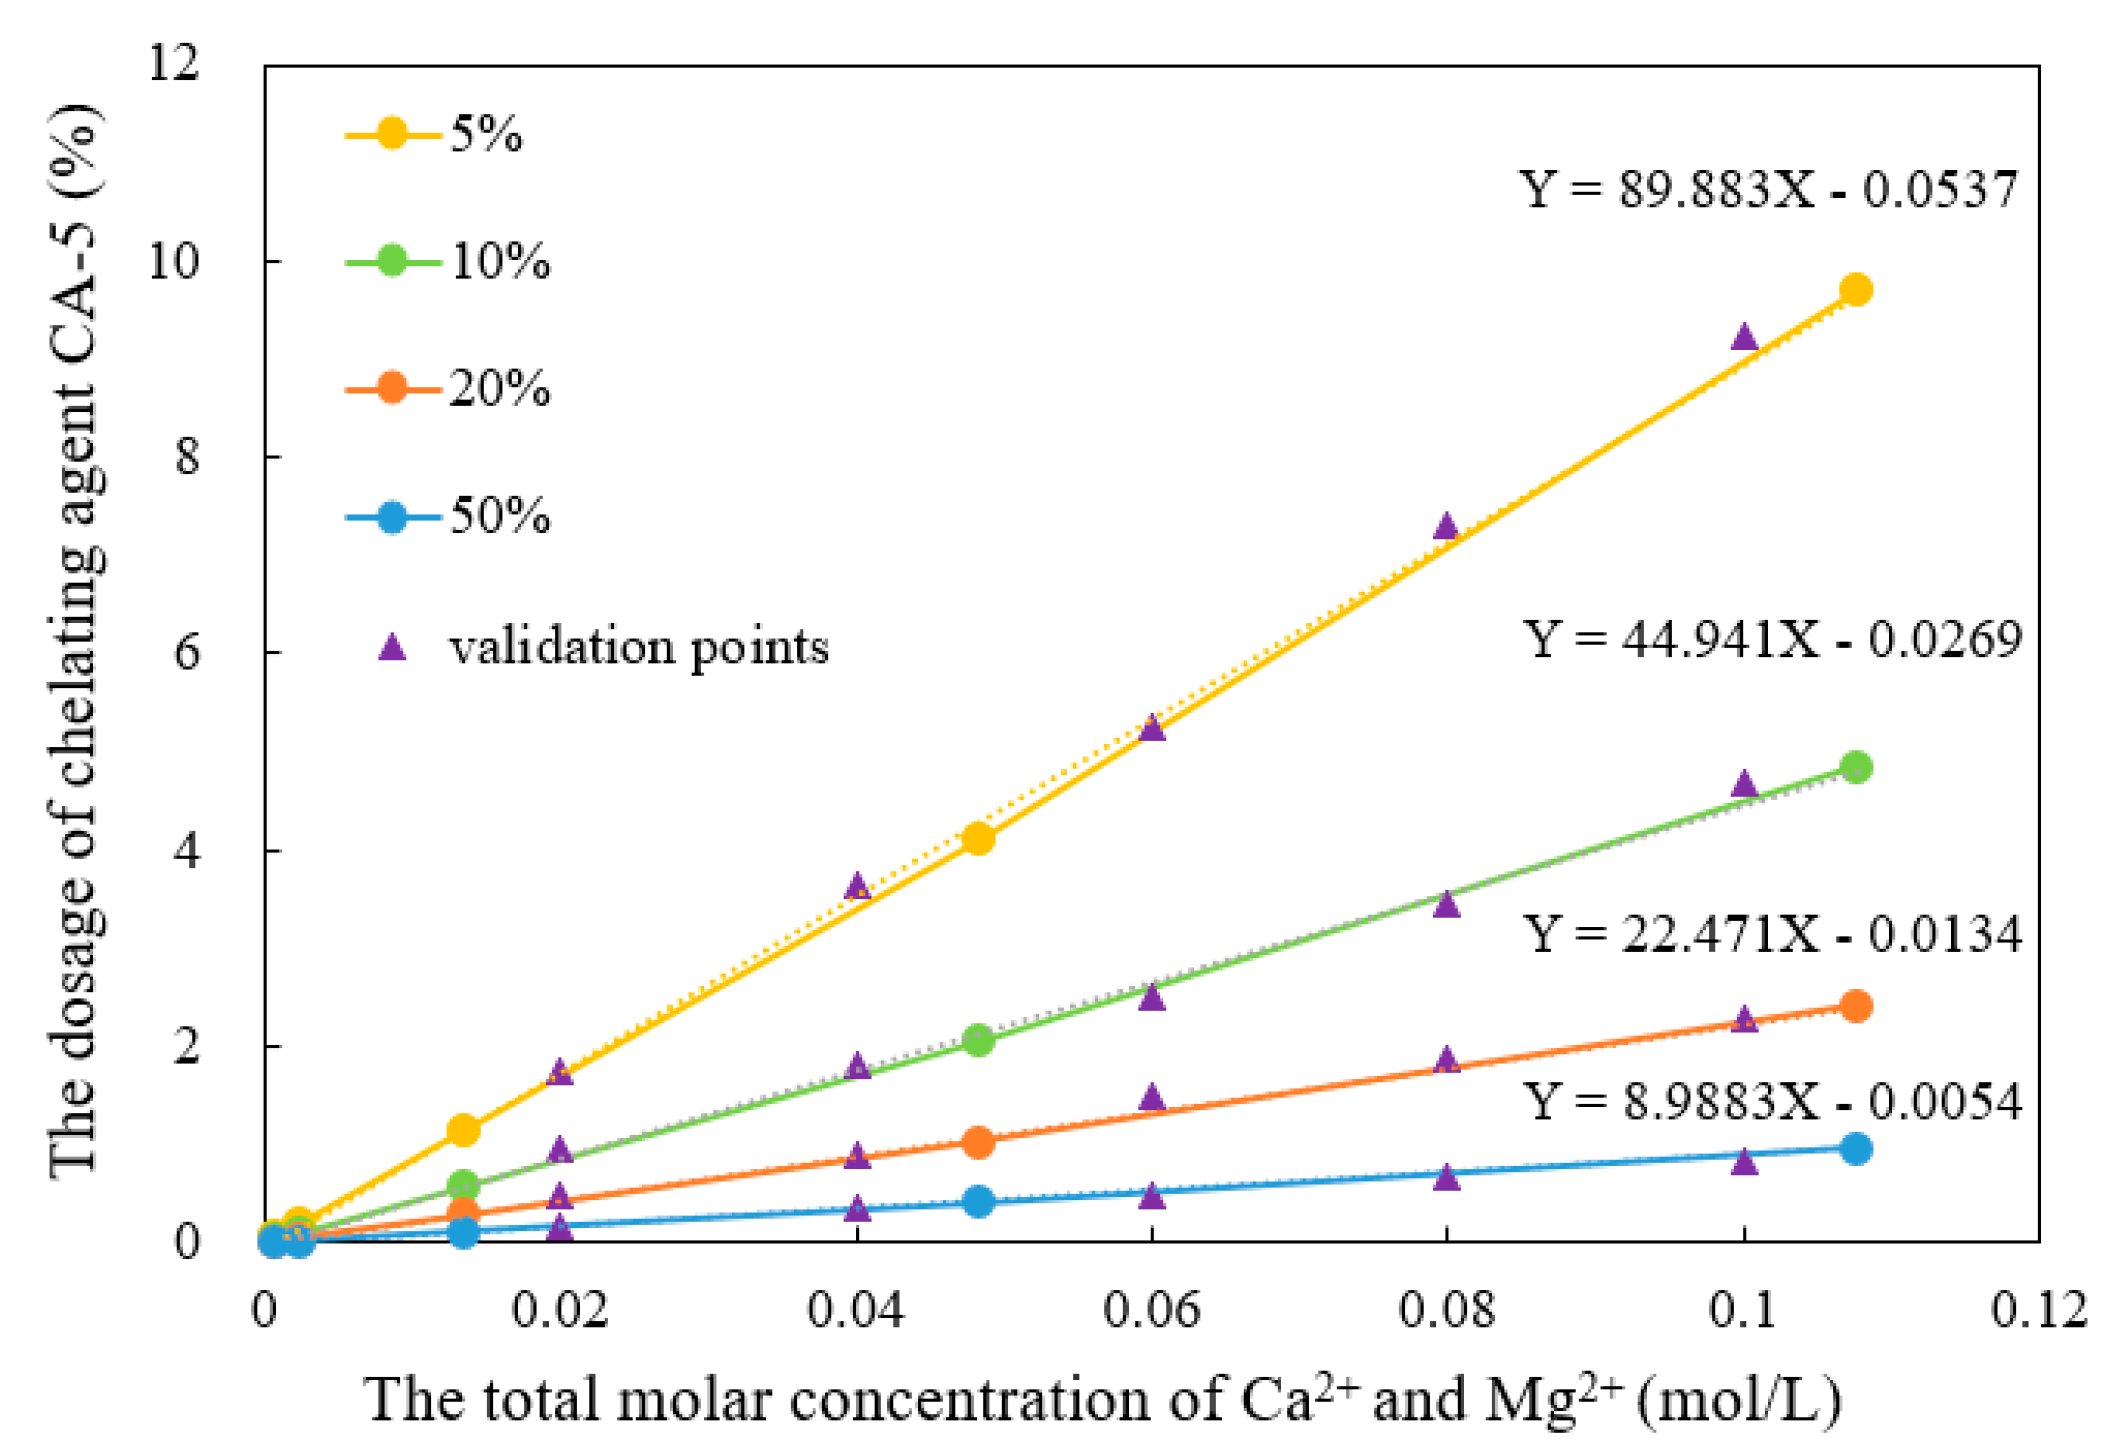
- Relationship between chelating agent dosage and Ca2+/Mg2+ concentration
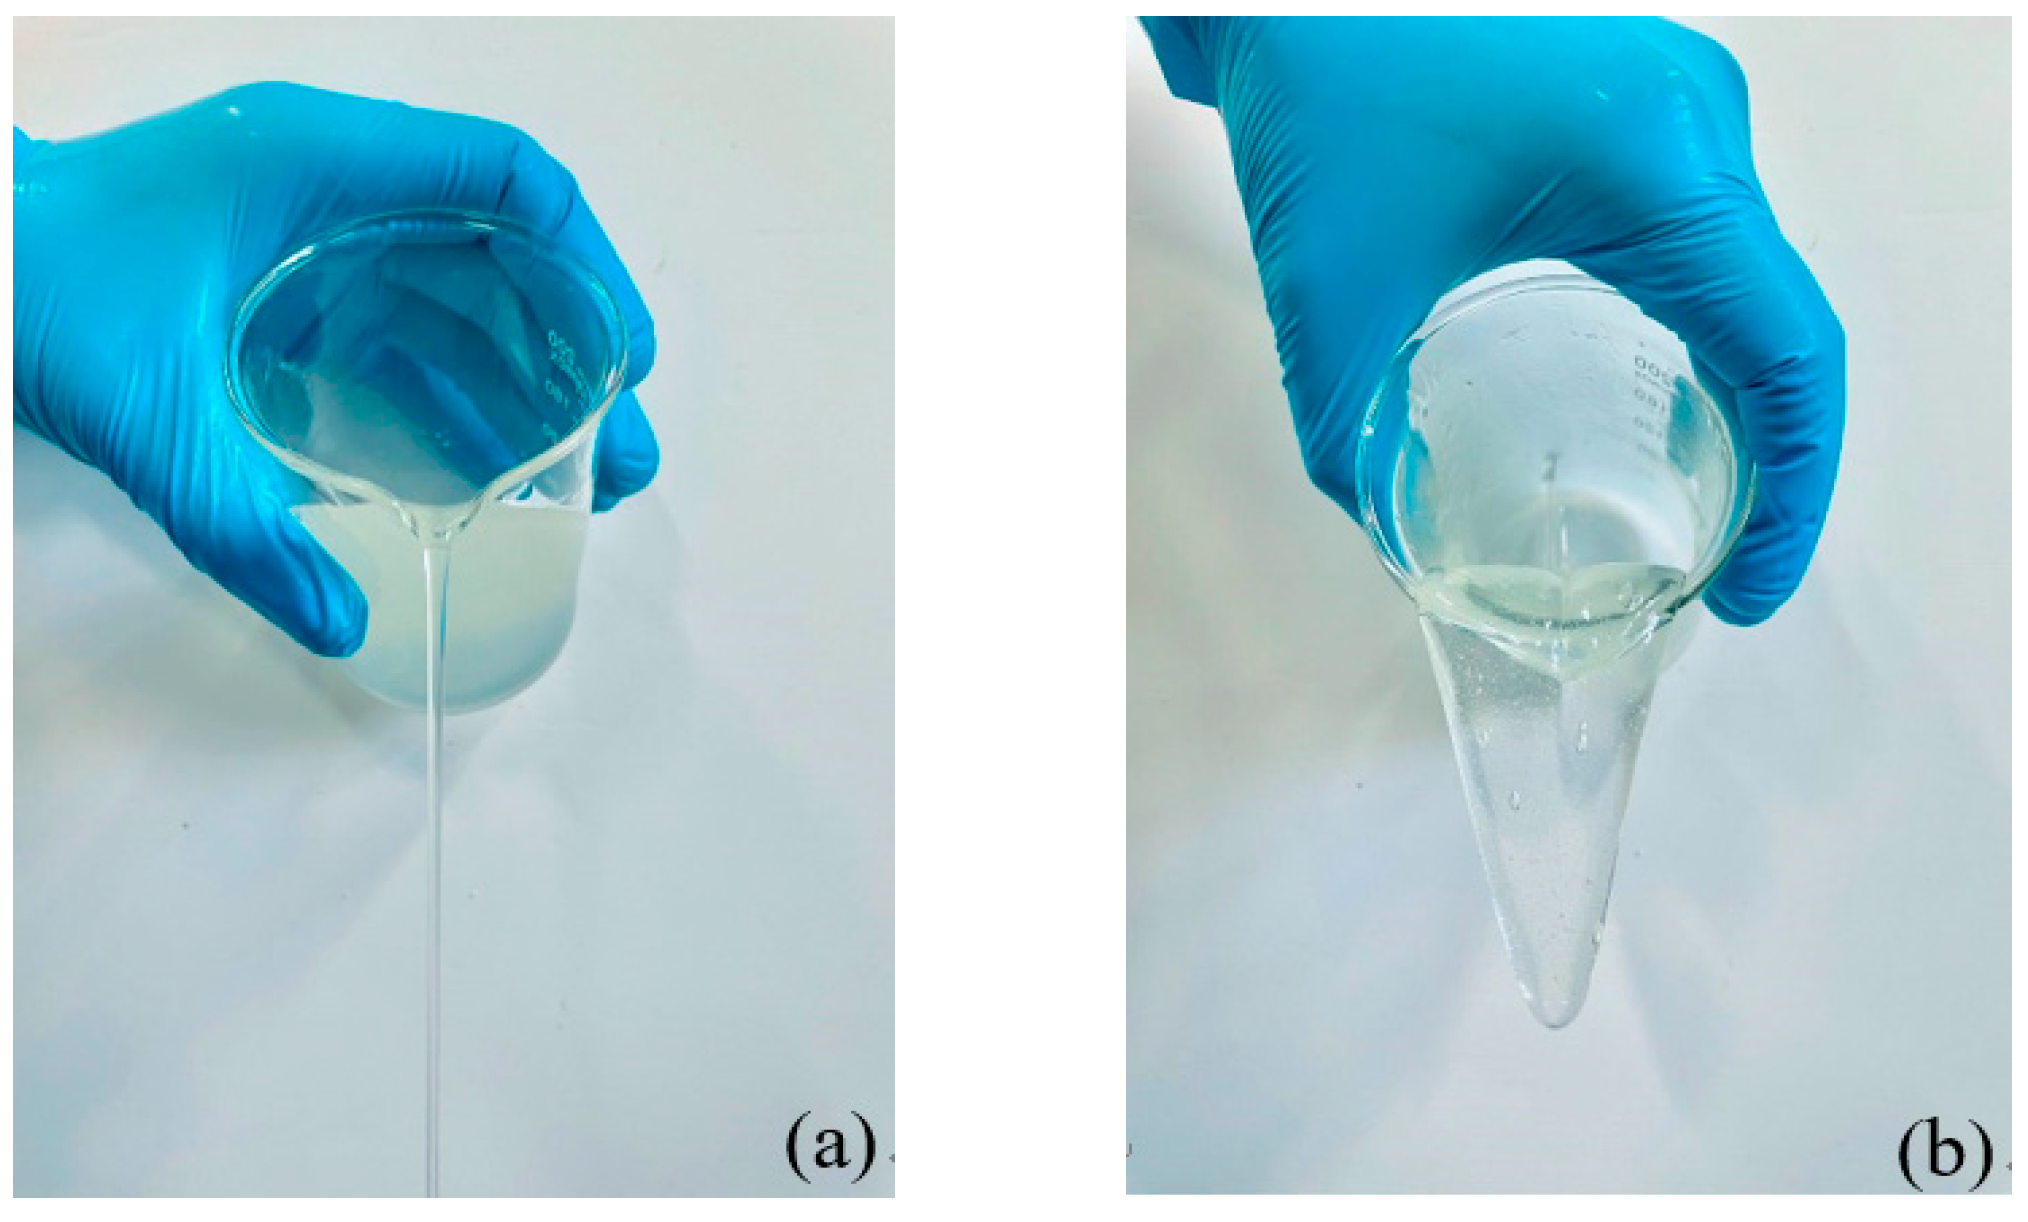
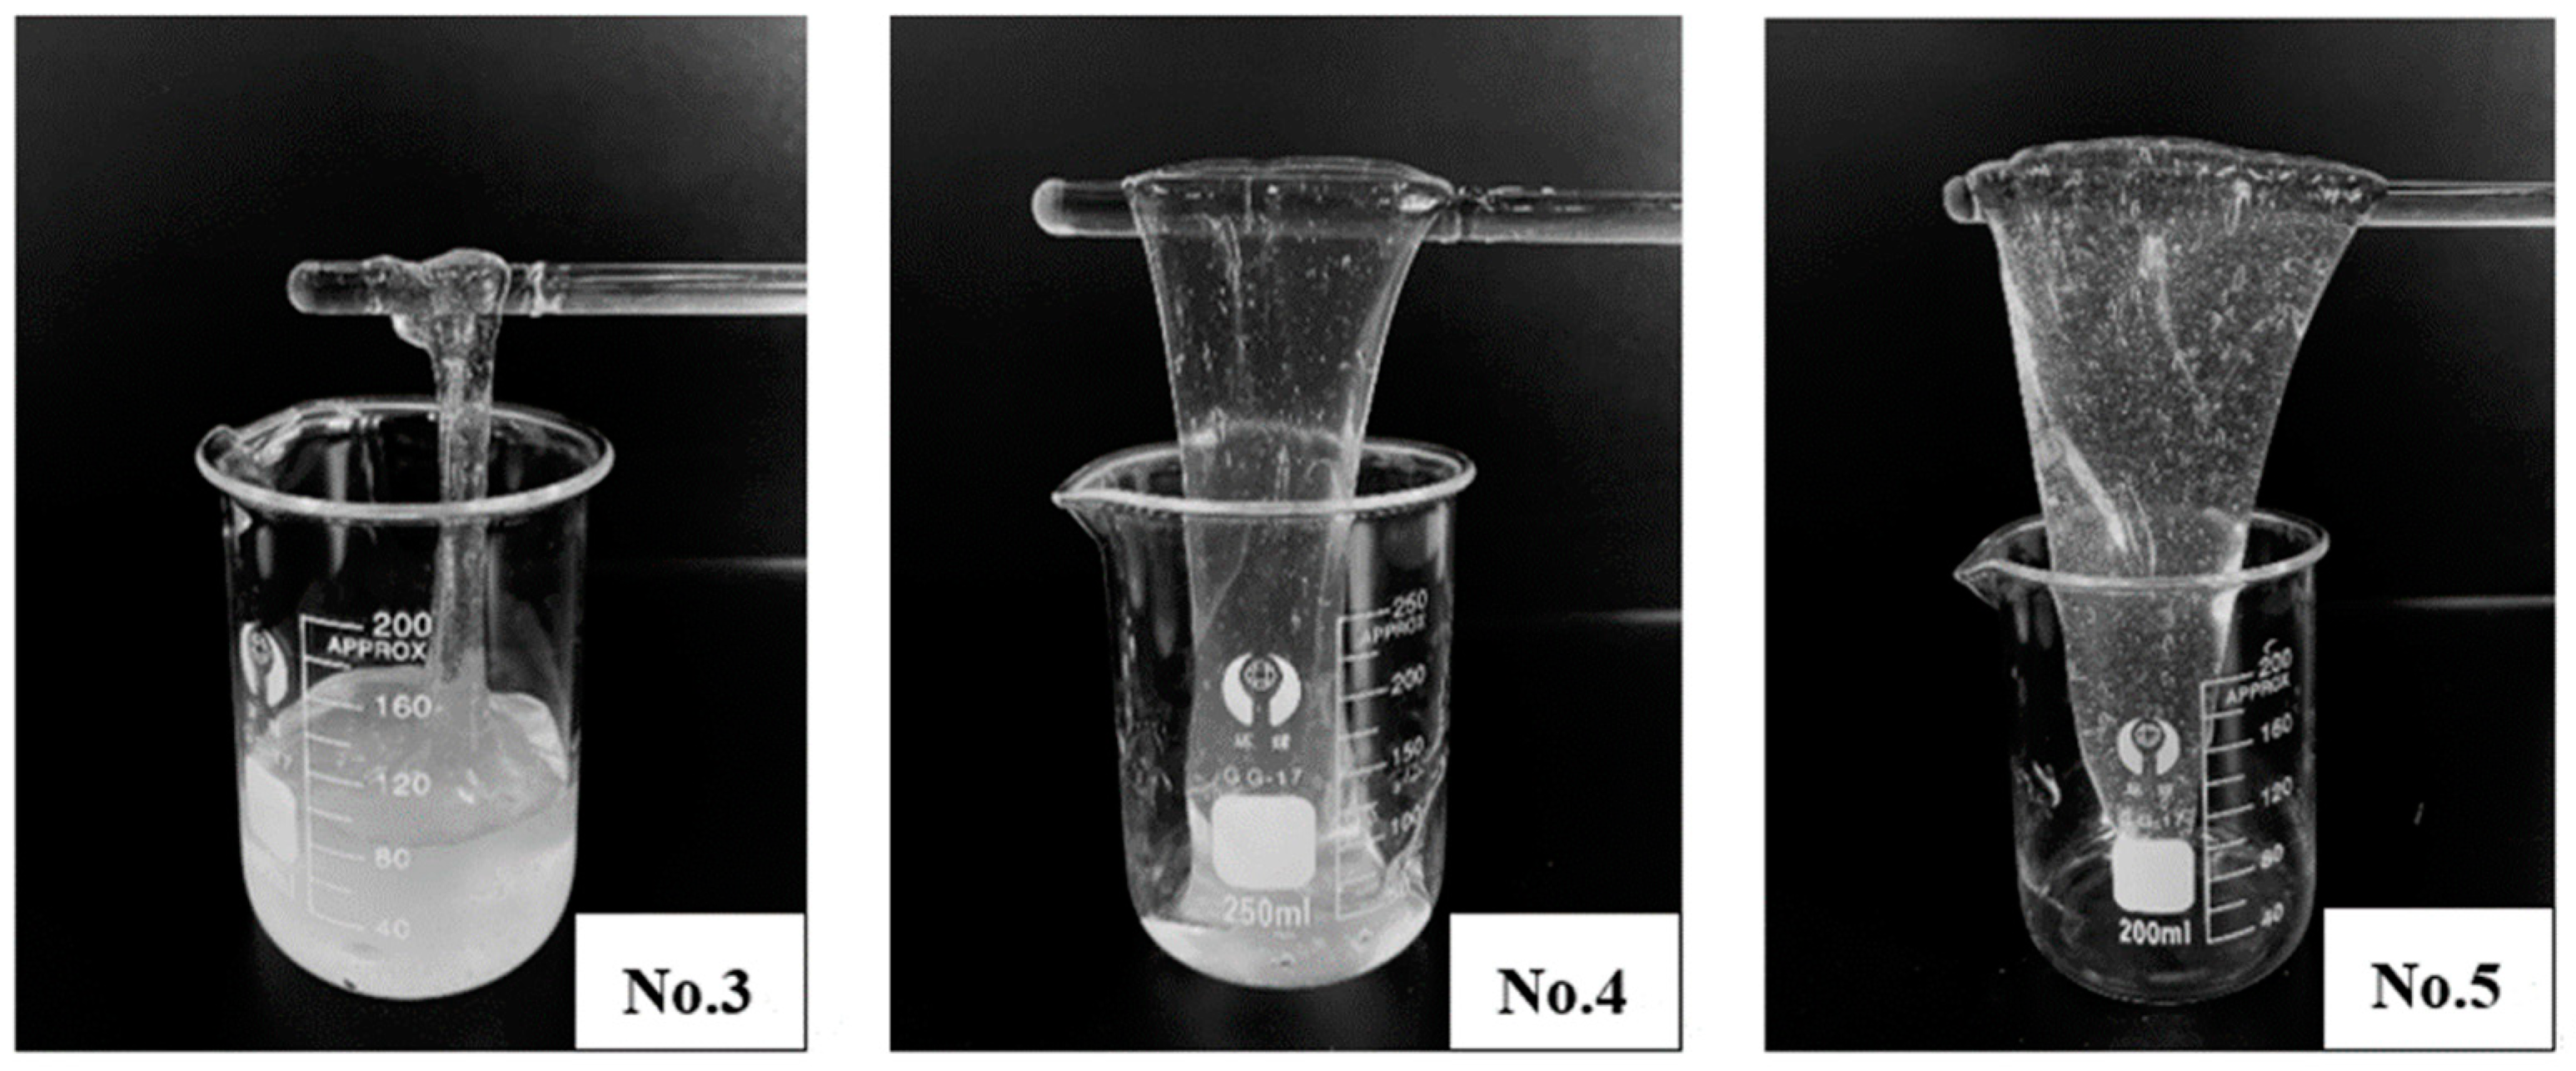
3.1.3. Crosslinker
- (1)
- Dosage optimization
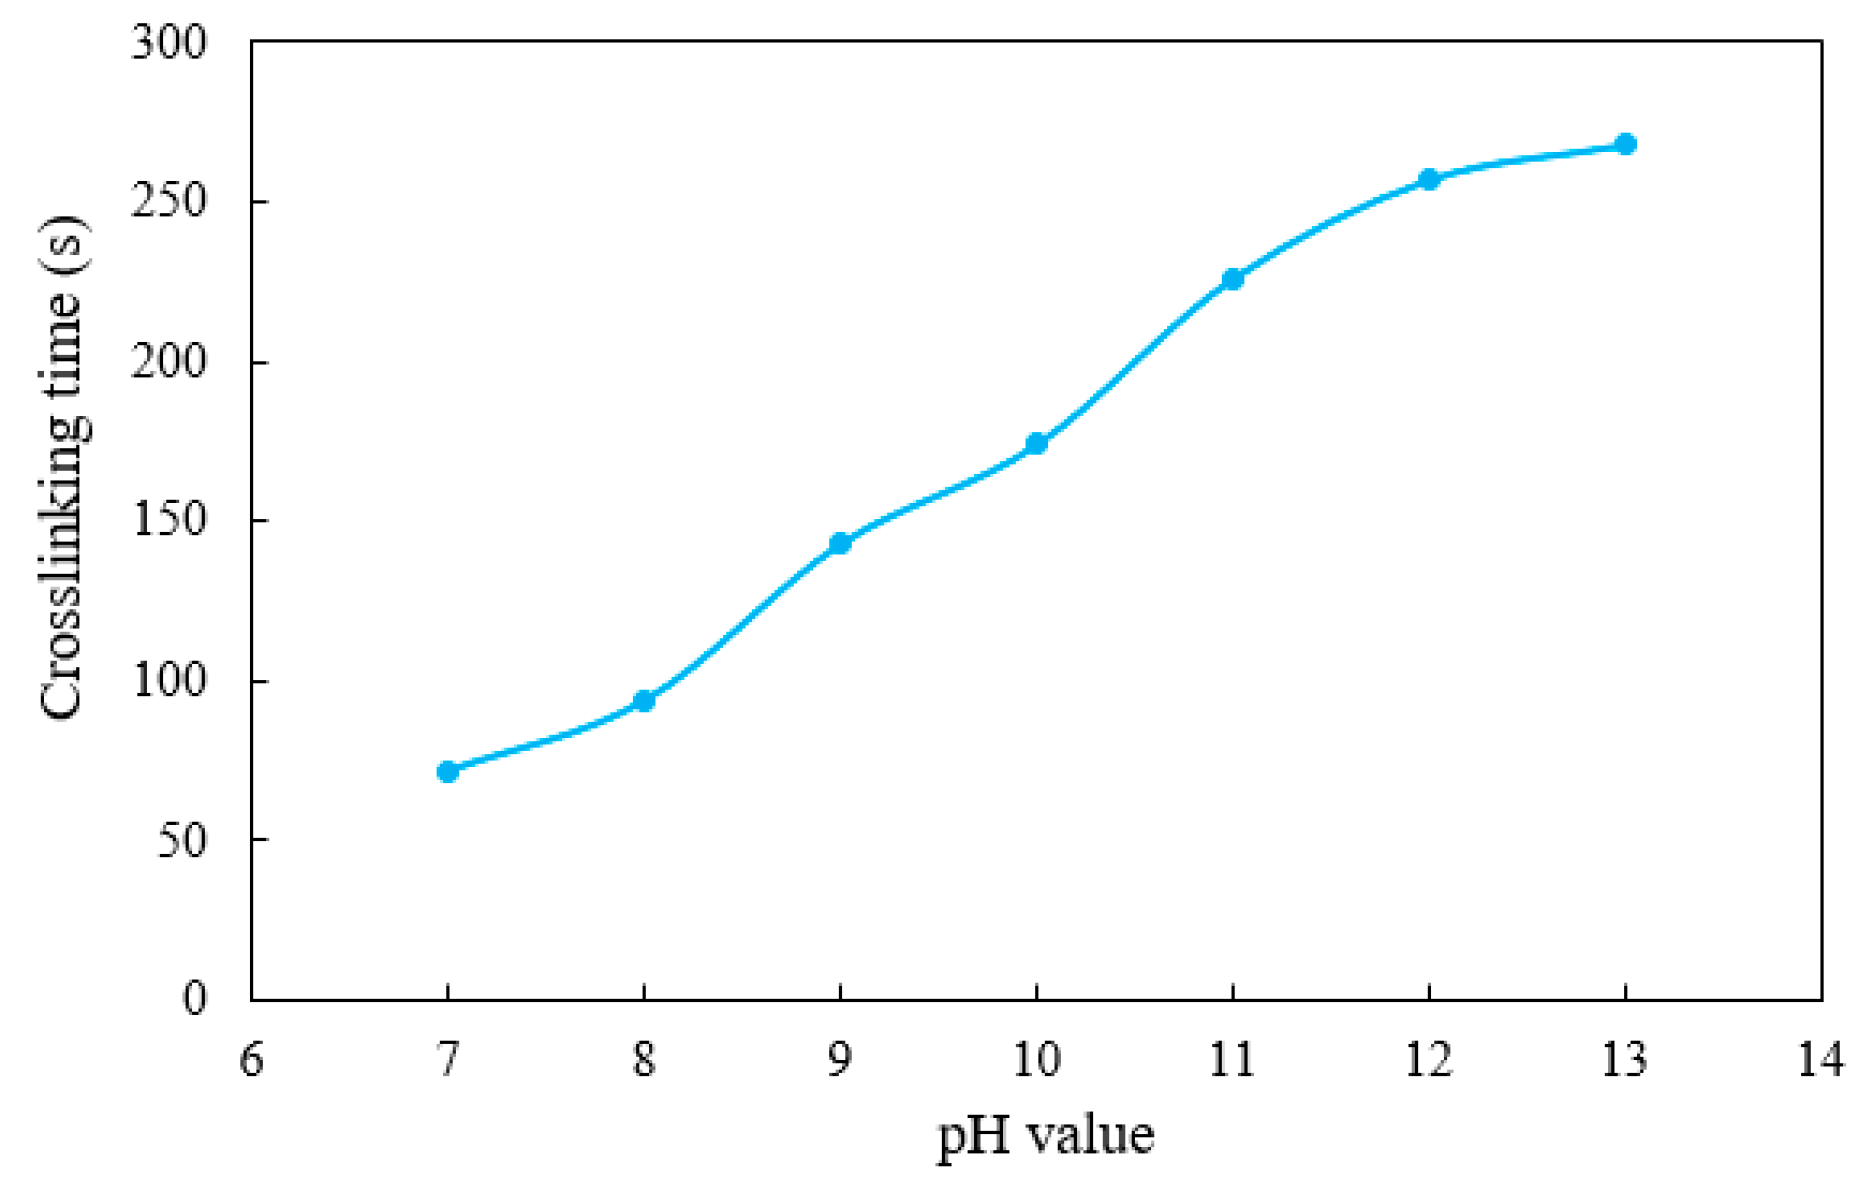
- (2)
- Delayed crosslinking
3.1.4. Determination of Fracturing Fluid Formula
3.2. Performance Evaluation of the Fracturing Fluid
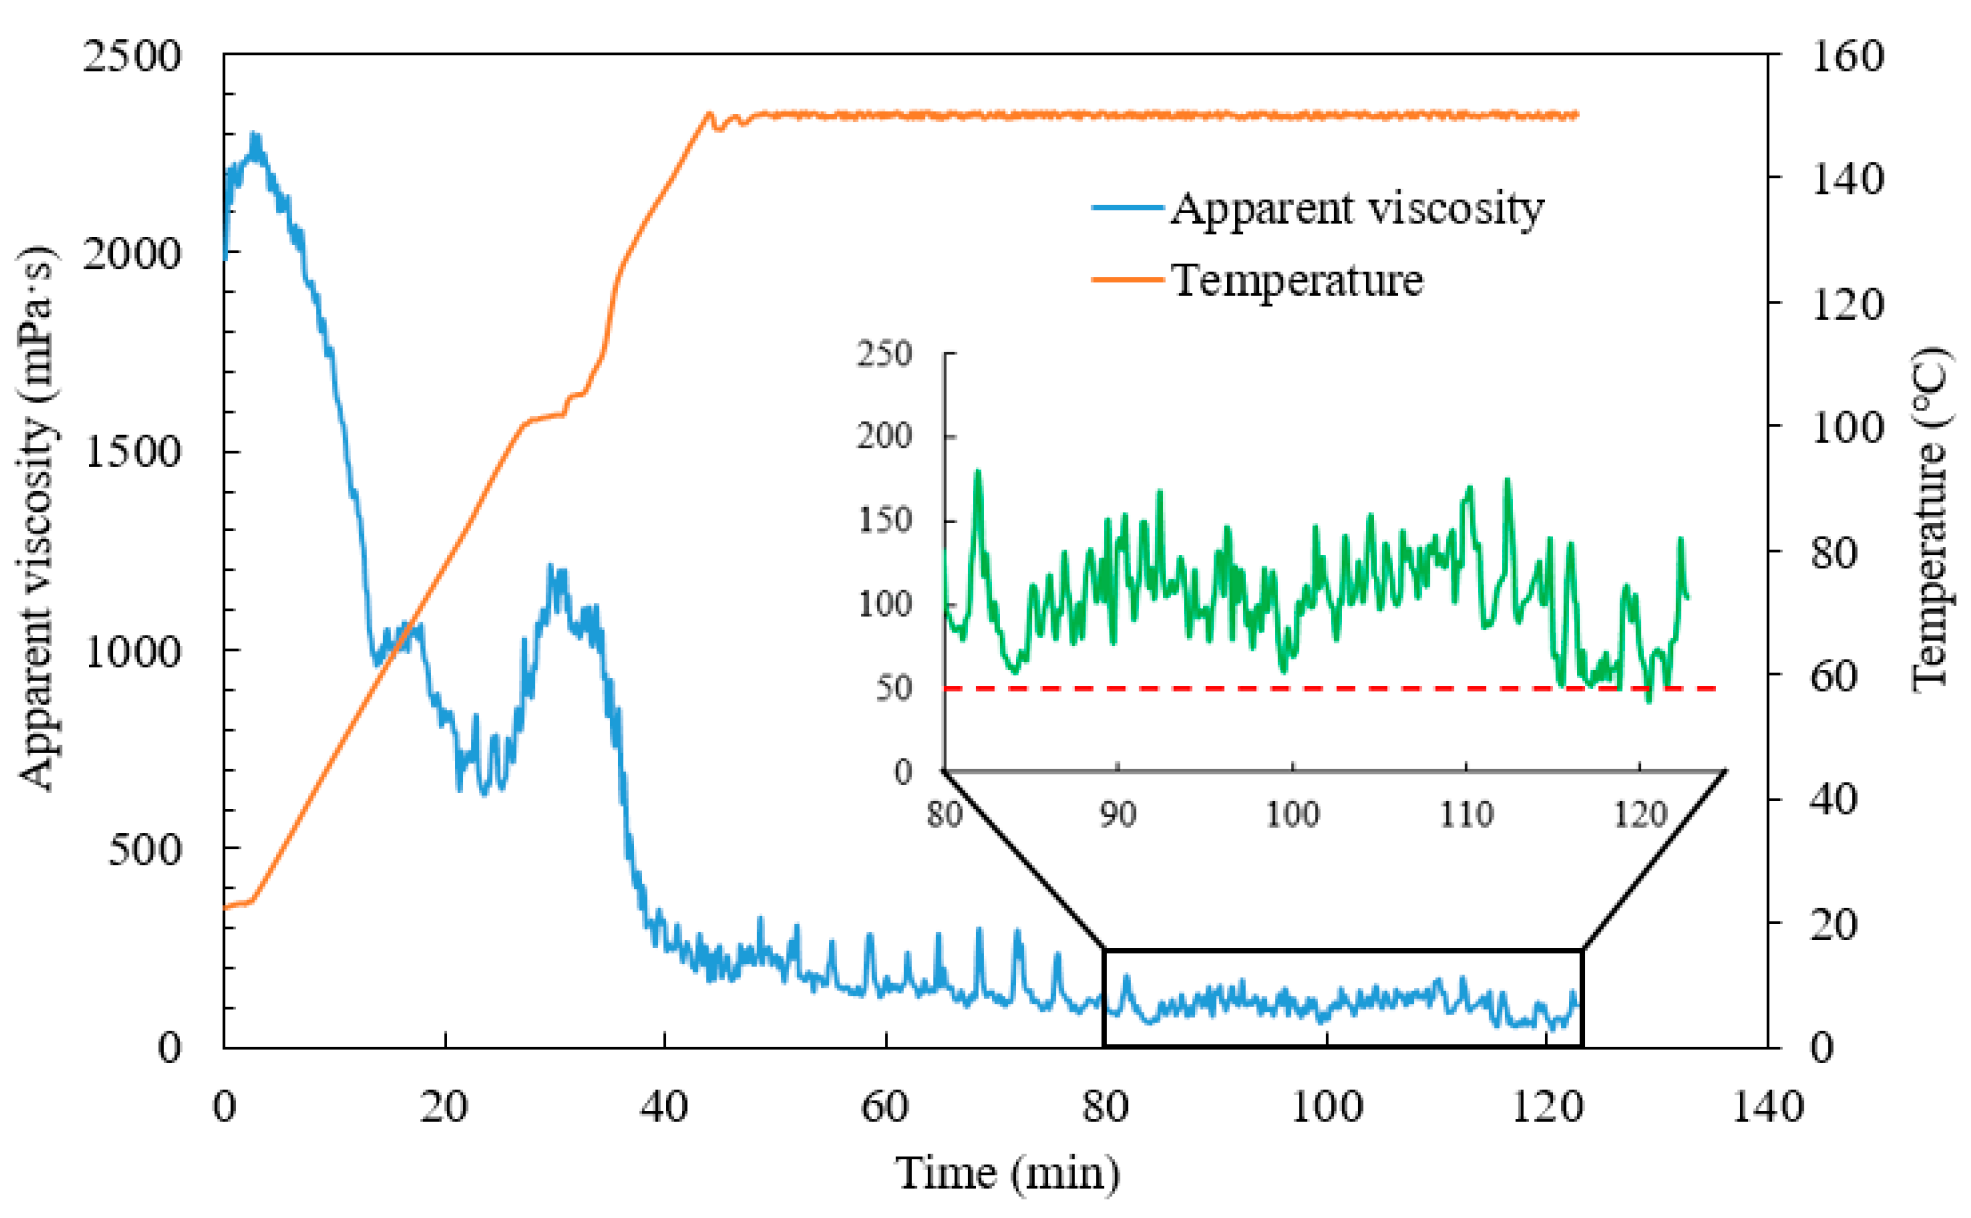
3.2.1. Temperature and Shear Resistance Performance
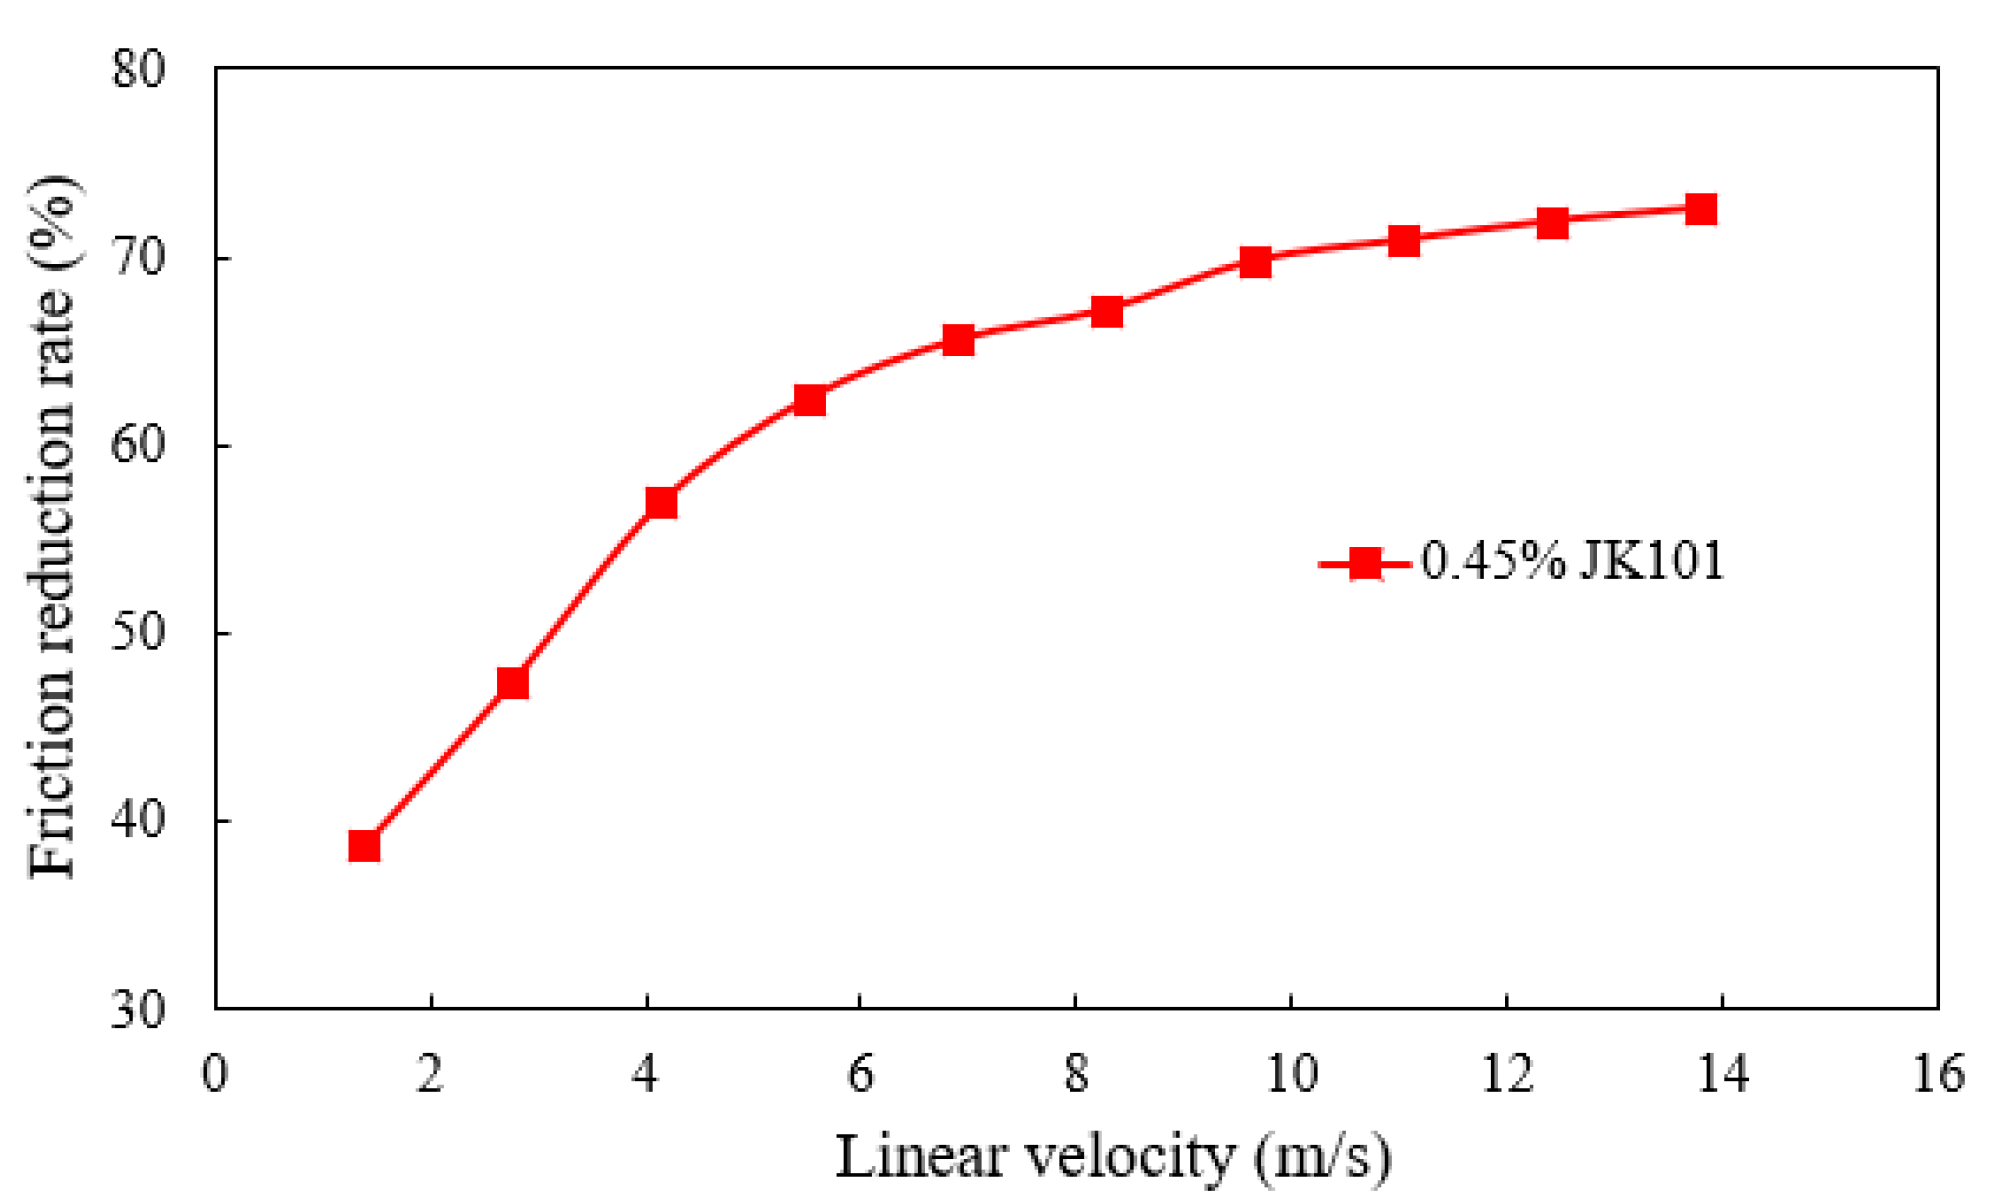
3.2.2. Friction Reduction Performance
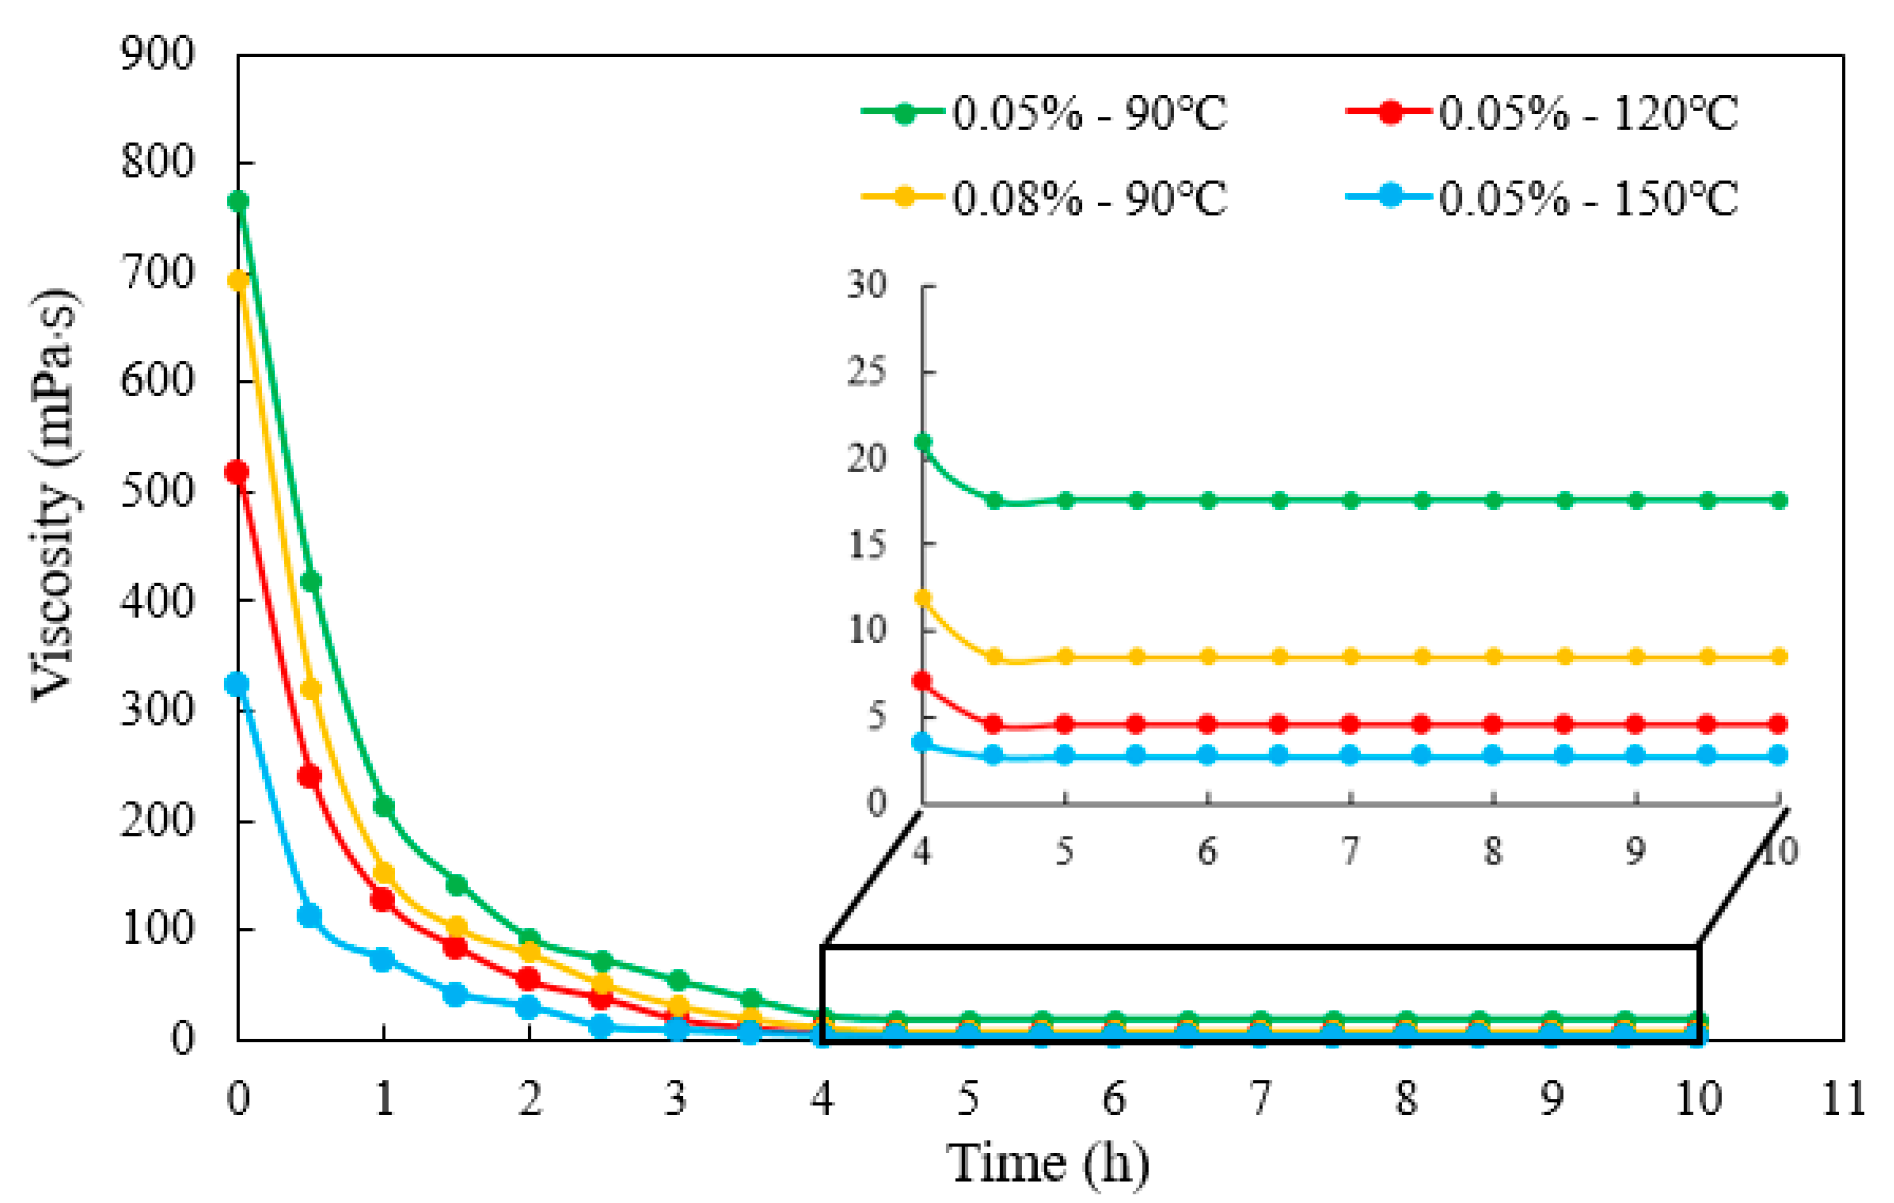
3.2.3. Gel-Breaking Performance
3.2.4. Core Damage Performance
4. Conclusions
- For flowback and produced water with different salinities, a complex masking method can effectively solve the crosslinking problem caused by high-valence metal ions. Among the three chelating agents, the organophosphate CA-5 chelating agent had the best chelating effect on Ca2+ and Mg2+;
- There was a good linear relationship between the dosage of the chelating agent and the total molar concentrations of Ca2+ and Mg2+ in the solution. The main mechanism was that the chelating agents formed complexes with Ca2+ and Mg2+ at a chelation ratio of 1:5;
- A novel organic boron crosslinker with temperature and salt resistance was synthesized. Crosslinking and hanging tests were carried out to optimize the dosage of the crosslinker, and the formed gel fracturing fluid exhibited various crosslinking strengths at different dosages. The designed crosslinker could also realize delayed crosslinking, and the time could be flexibly adjusted according to the pH value of base fluid;
- Taking the highest salinity water sample as an example, the novel guar fracturing fluid was successfully formulated. Its composition was water sample E + 1 wt.% CA-5 (50 wt.%) chelating agent + 0.45 wt.% JK101 guar gum + 0.80 wt.% YC-150 regulator + 0.55 wt.% YZ-1 crosslinker. The novel guar fracturing fluid showed an excellent temperature and shear performance. The final apparent viscosity remained above 50 mPa·s after shearing for 80 min at 150 °C and 170 s−1. The maximum friction reduction rate of the base fluid measured by a laboratory loop friction test reach 73.2%. Ammonium persulfate breaker quickly broke down the gel fracturing fluid. The viscosity of gel-breaking fluid was less than 5 mPa·s within 5 h at 150 °C, and the lowest residue content was only 197 mg/L, which is far below international standards. The average damage rate of the gel-breaking fluid was 25.67%, indicating the proposed fracturing fluid was less damaging to formation.
- This study solves the crosslinking problem caused by high-valence metal ions. It can optimize the most economic and effective chelating agent dosage for flowback and produced water with different salinities, providing a research basis for the reuse of flowback water.
Author Contributions
Funding
Data Availability Statement
Acknowledgments
Conflicts of Interest
References
- Liu, Y.-G.; Hou, J.; Zhao, H.-F.; Liu, X.-Y.; Xia, Z.-Z. A method to recover natural gas hydrates with geothermal energy conveyed by CO2. Energy 2018, 144, 265–278. [Google Scholar] [CrossRef]
- Zhou, F.-J.; Su, H.; Liang, X.-Y.; Meng, L.-F.; Yuan, L.-S.; Li, X.-H.; Liang, T.-B. Integrated hydraulic fracturing techniques to enhance oil recovery from tight rocks. Petrol. Explor. Dev. 2019, 46, 1065–1072. [Google Scholar] [CrossRef]
- Wang, W.-Y.; Pang, X.-Q.; Chen, Z.-X.; Chen, D.-X.; Zheng, T.-Y.; Luo, B.; Li, J.; Yu, R. Quantitative prediction of oil and gas prospects of the Sinian-Lower Paleozoic in the Sichuan Basin in central China. Energy 2019, 174, 861–872. [Google Scholar] [CrossRef]
- Harman, C.; McDonald, M.; Short, P.; Ott, W. Silica gel fracturing fluids an alternative to guar systems that allows the use of west Texas produced water. In Proceedings of the SPE Hydraulic Fracturing Technology Conference and Exhibition, Virtual Conference, 4–6 May 2021. [Google Scholar]
- Clark, C.-E.; Veil, J.-A. Produced Water Volumes and Management Practices in the United States; Argonne National Lab (ANL): Argonne, IL, USA, 2009.
- Gregory, K.-B.; Vidic, R.-D.; Dzombak, D.-A. Water management challenges associated with the production of shale gas by hydraulic fracturing. Elements 2011, 7, 181–186. [Google Scholar] [CrossRef]
- Whistler, R.-L.; BeMi, J.-N. Industrial Gums: Polysaccharides and Their Derivatives; Elsevier: Amsterdam, The Netherlands, 2012. [Google Scholar]
- Muhammad, S.-K.; Mohammed, M.; Elkatatny, S. Development of chelating agent-based polymeric gel system for hydraulic fracturing. Energies 2018, 11, 1663. [Google Scholar]
- Al-Muntasheri, G.-A. A critical review of hydraulic-fracturing fluids for moderate-to ultralow-permeability formations over the last decade. SPE Prod. Oper. 2014, 29, 243–260. [Google Scholar] [CrossRef]
- Jennings, A.-R. Fracturing fluids-then and now. J. Petrol. Technol. 1996, 48, 604–610. [Google Scholar] [CrossRef]
- Cheng, Y.; Brown, K.-M.; Prud’homme, R.-K. Characterization and intermolecular interactions of hydroxypropyl guar solutions. Biomacromolecules 2002, 3, 456–461. [Google Scholar] [CrossRef] [PubMed]
- Banerjrr, P.; Mukherjee, I.; Bhattacharya, S.; Datta, S.; Moulik, S.-P.; Sarkar, D. Sorption of water vapor, hydration, and viscosity of carboxymethylhydroxypropyl guar, diutan, and xanthan gums, and their molecular association with and without salts (NaCl, CaCl2, HCOOK, CH3COONa, (NH4)2SO4 and MgSO4) in aqueous solution. Langmuir 2009, 25, 11647–11656. [Google Scholar] [CrossRef] [PubMed]
- Gittings, M.-R.; Cipelletti, L.; Trappe, V.; Weitz, D.-A.; Ln, M.; Lal, J. The effect of solvent and ions on the structure and rheological properties of guar solutions. J. Phys. Chem. A 2001, 105, 9310–9315. [Google Scholar] [CrossRef]
- Li, Y.; Guan, B.-S.; Xu, Y. The research of complexant about using high-salinity water for fracturing fluid. Sci. Technol. Eng. 2016, 16, 175–180. [Google Scholar]
- Ali, S.-A.; Pickering, W.-M.; Sketchler, B.-C.; Powell, R.-J.; Vitthal, S. Offshore frac packs benefit from seawater-based borate fluid. Oil Gas J. 1998, 96, 49–62. [Google Scholar]
- Fedorov, A.; Carrasquilla, J.; Cox, A. Avoiding damage associated to produced water use in hydraulic fracturing. In Proceedings of the SPE International Symposium and Exhibition on Formation Damage Control, Lafayette, LA, USA, 26–28 February 2014. [Google Scholar]
- LeBas, R.-A.; Sha, H.; Wayne, T.; Lord, P.; Luna, D. Development and use of high-TDS recycled produced water for crosslinked-gel-based hydraulic fracturing. In Proceedings of the SPE Hydraulic Fracturing Technology Conference, The Woodlands, TX, USA, 4–6 February 2013. [Google Scholar]
- Gupta, D.-V.; Carman, P.-S.; Venugopal, R.-A. Stable fracturing fluid for produced water applications. In Proceedings of the SPE Annual Technical Conference and Exhibition, San Antonio, TX, USA, 8–10 October 2012. [Google Scholar]
- Bulat, D.; Chen, Y.; Graham, M.-K.; Marcinew, R.-P.; Adeogun, A.-S.; Sheng, J.; Abad, C. A faster cleanup, produced water-compatible fracturing fluid: Fluid designs and field case studies. In Proceedings of the SPE International Symposium and Exhibition on Formation Damage Control, Lafayette, LA, USA, 13–15 February 2008. [Google Scholar]
- Elsarawy, A.-M.; Nasr-El-Din, H.-A.; Cawiezel, K.-E. The effect of chelating agents on the use of produced water in crosslinked-gel-based hydraulic fracturing. In Proceedings of the SPE Low Perm Symposium, Denver, CO, USA, 5–6 May 2016. [Google Scholar]
- Taylor, K.-C.; Nasr-EI-Din, H.-A. A systematic study of iron control chemicals-part 2; Paper SPE 50772. In Proceedings of the International Symposium on Oilfield Chemistry, Houston, TX, USA, 16–19 February 1999. [Google Scholar]
- Liu, Y.-T.; Guan, B.-S.; Liu, P.; Wang, L.-W.; Cui, W.-X. Research and field application of fracturing sequester. Chem. Reag. 2010, 32, 545–547. [Google Scholar]
- Li, W.-W.; Wen, Z.; Bo, C.; Li, Y.-J.; Qiu, X.-H. 220 °C Ultra-temperature fracturing fluid in high pressure and high temperature reservoirs. In Proceedings of the Offshore Technology Conference Asia, Kuala Lumpur, Malaysia, 22–25 March 2016. [Google Scholar]
- Huang, Q.; Liu, S.; Wang, G.; Wu, B.; Zhang, Y. Coalbed methane reservoir stimulation using guar-based fracturing fluid: A review. J. Nat. Gas Sci. Eng. 2019, 66, 107–125. [Google Scholar] [CrossRef]
- Zhang, L.-F.; Zhou, F.-J.; Zhang, S.-C.; Li, Z.; Wang, J.; Wang, Y.-C. Evaluation of permeability damage caused by drilling and fracturing fluids in tight low permeability sandstone reservoirs. J. Petrol. Sci. Eng. 2019, 175, 1122–1135. [Google Scholar]
- Liang, X.-Y.; Zhou, F.-J.; Liang, T.-B.; Wang, C.; Yuan, S. Impacts of low harm fracturing fluid on fossil hydrogen energy production in tight reservoirs. Int. J. Hydrog. Energy 2020, 45, 21195–21204. [Google Scholar] [CrossRef]
- Wang, J.; Huang, Y.-X.; Zhang, Y.; Zhou, F.-J.; Yao, E.-D.; Wang, R. Study of fracturing fluid on gel breaking performance and damage to fracture conductivity. J. Petrol. Sci. Eng. 2020, 193, 107443. [Google Scholar] [CrossRef]
- Almubarak, T.; Ng, J.-H.; Ramanathan, R.; Nasr-EI-Din, H.-A. Chelating agents for oilfield stimulation: Lessons learned and future outlook. J. Petrol. Sci. Eng. 2021, 205, 108832. [Google Scholar] [CrossRef]


| Ion Type | Sample A (mg/L) | Sample B (mg/L) | Sample C (mg/L) | Sample D (mg/L) | Sample E (mg/L) |
|---|---|---|---|---|---|
| K++Na+ | 1733.94 | 5386.3 | - | 9640.7 | 115,124.4 |
| Mg2+ | 7.22 | 43.3 | 282 | 83.2 | 2309 |
| Ca2+ | 17.85 | 17.2 | 1462 | 396.9 | 458.5 |
| Cl− | 2539.28 | 7355.2 | 21,742 | 15,028.4 | 178,948.8 |
| HCO3− | 112 | 1836.5 | 69 | 349.1 | 215.4 |
| OH− | 2.13 | - | - | 4.7 | - |
| CO32− | 246.26 | - | - | 34.2 | - |
| SO42− | 58.00 | 49.4 | 1050 | 776.2 | 8012.4 |
| TDS | 4716.68 | 14,687.9 | 24,605 | 26,313.7 | 305,068.5 |
| Temperature (°C) | Apparent Viscosity (mPa·s) |
|---|---|
| 22.5 | 60.2 |
| 31.2 | 49.8 |
| 49.7 | 37.6 |
| 62.6 | 21.4 |
| 95.3 | 16.3 |
| 106.4 | 12.6 |
| 110.7 | 10.2 |
| Type | Consumption Volume at the End of Titration (mL) | |
|---|---|---|
| MgCl2 (1 mol/L) | CaCl2 (1 mol/L) | |
| 5 mL, 5 wt.%, CA-1 | 0.9 | 0.8 |
| 5 mL, 5 wt.%, CA-3 | 0.7 | 0.6 |
| 5 mL, 5 wt.%, CA-5 | 5.5 | 6.0 |
| Ion Type | Chelation Values of Ca2+ and Mg2+ (mg/mL) | ||
|---|---|---|---|
| CA-1 | CA-3 | CA-5 | |
| Mg2+ | 86.4 | 67.2 | 528 |
| Ca2+ | 128 | 96 | 960 |
| Group | Dosage of YZ-1 Crosslinker (wt.%) | Crosslinking Performance | Hanging Performance |
| 1 | 0.35 | Weak | Unable |
| 2 | 0.40 | Weak | Unable |
| 3 | 0.45 | Weak | Slight |
| 4 | 0.50 | Strong | Slight |
| 5 | 0.55 | Strong | Complete |
| 6 | 0.60 | Strong | Complete |
| Dosage of YC-150 Regulator (wt.%) | pH Value | Crosslinking Time (s) |
|---|---|---|
| 0.32 | 7 | 72 |
| 0.42 | 8 | 94 |
| 0.51 | 9 | 143 |
| 0.61 | 10 | 174 |
| 0.70 | 11 | 226 |
| 0.80 | 12 | 257 |
| 0.90 | 13 | 268 |
| Lab test displacement (kg/h) | 250 | 500 | 750 | 1000 | 1250 | 1500 | 1750 | 2000 | 2250 | 2500 |
| Linear velocity (m/s) | 1.38 | 2.76 | 4.14 | 5.52 | 6.90 | 8.28 | 9.66 | 11.04 | 12.42 | 13.80 |
| Field fracturing displacement (m3/min) | 0.37 | 0.74 | 1.11 | 1.48 | 1.85 | 2.22 | 2.59 | 2.96 | 3.33 | 3.70 |
| Friction reduction rate (%) | 38.7 | 47.4 | 56.9 | 62.5 | 65.6 | 67.2 | 69.8 | 70.9 | 71.9 | 72.6 |
| Entry | Thickener Concentration | Crosslinker Concentration | Ammonium Persulfate Concentration | Gel-Breaking Temperature | Gel- Breaking Time | Residue Content |
|---|---|---|---|---|---|---|
| #1 | 0.45 wt.% | 0.55 wt.% | 0.05 wt.% | 90 °C | 5 h | 634 mg/L |
| #2 | 0.45 wt.% | 0.55 wt.% | 0.08 wt.% | 90 °C | 5 h | 278 mg/L |
| #3 | 0.45 wt.% | 0.55 wt.% | 0.05 wt.% | 120 °C | 5 h | 326 mg/L |
| #4 | 0.45 wt.% | 0.55 wt.% | 0.05 wt.% | 150 °C | 5 h | 197 mg/L |
| Core No. | Permeability before Damage K1, 10−3 μm2 | Permeability after Damage K2, 10−3 μm2 | Core Damage Rate, % | Average Damage Rate, % |
|---|---|---|---|---|
| S-1 | 0.084 | 0.061 | 27.38 | 25.67 |
| S-2 | 0.167 | 0.119 | 28.74 | |
| S-3 | 0.359 | 0.284 | 20.89 |
Publisher’s Note: MDPI stays neutral with regard to jurisdictional claims in published maps and institutional affiliations. |
© 2021 by the authors. Licensee MDPI, Basel, Switzerland. This article is an open access article distributed under the terms and conditions of the Creative Commons Attribution (CC BY) license (https://creativecommons.org/licenses/by/4.0/).
Share and Cite
Yao, E.; Xu, H.; Li, Y.; Ren, X.; Bai, H.; Zhou, F. Reusing Flowback and Produced Water with Different Salinity to Prepare Guar Fracturing Fluid. Energies 2022, 15, 153. https://doi.org/10.3390/en15010153
Yao E, Xu H, Li Y, Ren X, Bai H, Zhou F. Reusing Flowback and Produced Water with Different Salinity to Prepare Guar Fracturing Fluid. Energies. 2022; 15(1):153. https://doi.org/10.3390/en15010153
Chicago/Turabian StyleYao, Erdong, Hang Xu, Yuan Li, Xuesong Ren, Hao Bai, and Fujian Zhou. 2022. "Reusing Flowback and Produced Water with Different Salinity to Prepare Guar Fracturing Fluid" Energies 15, no. 1: 153. https://doi.org/10.3390/en15010153
APA StyleYao, E., Xu, H., Li, Y., Ren, X., Bai, H., & Zhou, F. (2022). Reusing Flowback and Produced Water with Different Salinity to Prepare Guar Fracturing Fluid. Energies, 15(1), 153. https://doi.org/10.3390/en15010153