Article

Efficiency Evaluation of the Dual System Power Inverter for On-Grid Photovoltaic System

1
Department of Electric Power Systems, Kaunas University of Technology, LT-51367 Kaunas, Lithuania
2
Department of Electric Power Engineering, Norwegian University of Science and Technology, 7491 Trondheim, Norway
*
Author to whom correspondence should be addressed.
Energies 2022, 15(1), 161; https://doi.org/10.3390/en15010161
Submission received: 5 November 2021 / Revised: 17 December 2021 / Accepted: 23 December 2021 / Published: 27 December 2021

Abstract

:
The implementation of a dual electric system that is capable of operating with either constant current and variable voltage, or constant voltage and variable current appliances, is one of the possible options to solve low-intensity stochastic energy utilization problems from renewable energy sources. This research paper analyzes the potential benefit of a novel three-phase dual system power inverter over the conventional inverter used in a solar power plant. The concept of such a power inverter is explained, and the digital twin model is created in a MATLAB Simulink environment. The efficiency characteristic of the simulated inverter is compared to the efficiency characteristic of a real conventional inverter. A standalone data logging system and an additional data acquisition system were used to collect and process data from the real inverter. Comparison of the digital twin inverter and the real conventional inverter shows the potential benefit of this novel inverter technology. It is shown that the novel inverter can operate in a wider range of DC input power. The potential economic benefit is also presented and discussed in the paper.

1. Introduction

During the energy transition [1,2] of recent decades, special attention has been paid to energy production from renewable energy sources [3]. The production of electricity using solar energy has gained great acceleration. In developing countries and off-grid areas, photovoltaic (PV) power plants are sometimes the main or the only energy source [4]. Operating in a standalone mode with electrochemical batteries, off-grid PV systems ensure power supply to consumers who use electricity for cooking [5], water heating [6] or lighting [7]. Furthermore, PV plants increase fuel savings when operating in parallel with standalone biofuel [8] or diesel [9] power plants. The solar energy sector is growing particularly rapidly in developed countries [10], in order to reduce the impact of human activities on climate change [11].
The largest PV parks that were installed before the year 2021 exceeded the installed capacity of 2 GW. The largest installations in the world are Bhadla Solar Park, India (2245 MWp); Huanghe Hydropower Hainan Solar Park, China (2200 MWp); and Pvagada Solar Park, India (2050 MWp) [12]. In 2020, the global cumulative capacity of solar PV plants was recorded at 707 495 MW [13]. PV plants produced 856 TWh of electricity in 2020, which represented 11.5% of the total electricity produced by renewable energy sources (RES), including hydropower. During the last decade, the total installed capacity of RES worldwide increased 17.6 times (40,129 MWh in 2010) and electricity production increased 25 times (the PV share in total RES energy production was only 0.8% in 2010) [14]. The above indicators are related to the photovoltaic and power electronics technology becoming cheaper; the average prices of solar PV modules were 106.09 USD/W in 1976, 2.4 USD/W in 2010 and only 0.38 USD/W in 2019 [15].
Although photovoltaic energy might seem to be a very attractive solution to help limit climate change, the use of RES also faces challenges: energy production depends on environmental conditions and the time of day [16]; there is a need for power balancing [17]; and there are issues of quality, stability, and reliability of the power supply [18]. How to increase the efficiency of solar photovoltaic systems is a highly researched topic.
The efficiency of the PV system depends on the efficiency of its individual components: the module [19], the arrangement of the DC network [20], the performance of the optimizer [21], and the DC-AC inverter [22]. In large-scale applications, the design of the AC electricity network containing AC cables and power transformers should be taken into account in order to evaluate the efficiency of all PV power plants.
PV cells are the lowest efficiency components in the PV system. The efficiency of cells used in PV power plants ranges from 16% (poly passivated emitter and rear cell technology, or poly PERC) to 23% (interdigitated back contact, or IBC cells, and heterojunction, or HJT cells), and the efficiency range of modern PV modules reaches 21.6–21.8% [23]. The declared efficiency is specified at 25 °C and 1000 W/m2 irradiance. The actual efficiency of a PV cell is highly dependent on environmental conditions [24]. Shading, temperature differences between PV modules, and manufacturing tolerance can cause a 5–7% [25] decrease in solar array efficiency due to the mismatch in the current-voltage characteristics [26] of PV modules. Much research is being done on the development of maximum power point tracking (MPPT) methods for PV systems to minimize mismatched power loss. Researchers have compared existing MTTP control methods [27] and some have improved or suggested novel methods that are better in terms of tracking time and accuracy [28] or that increase the PV generation system efficiency in a wider solar irradiation condition [29]. The authors in [30] have summarized 62 MTTP algorithms and identified the three most commonly used algorithms. The authors of [31] have reviewed 50 MPPT methods and highlighted the pros and cons of each method. It was stated that choosing an optimal MPPT method depends on the specified application.
Power losses in a DC network of the PV system usually do not exceed 1%. The high efficiency of the DC network is achieved by choosing the right size of the power cables that couple PV arrays. Good practice is to choose AC power cables between the inverter and the electricity meter so that ohmic power losses do not exceed 1% on the AC side as well.
The evaluation criteria for an inverter are efficiency, reliability, durability, power quality, and price [32]. There are many inverter topologies, but the two main types that are used in PV systems can be distinguished: single-stage and multistage. In microgrids, where the inverter is the main source of electricity, higher requirements for the power quality of the inverter exist; therefore, multistage topologies are more often used there. Because these inverters have more components, they are more expensive and less energy efficient. In small-scale on-grid applications, the topology of on-grid inverters is typically implemented in two stages [33], thus selecting the optimal ratio of efficiency to power quality.
Research related to the development of inverter technologies covers various areas for their improvement. For example, it was proposed by the authors of [34] that using the resonant DC-link soft switching method may increase the efficiency and reliability of the inverter. The authors claim that the DC-link soft switching losses can be limited to 50% of the total hard switching losses compared to the conventional inverter. In [35], it was proposed to increase the reliability and durability of a three-phase grid-connected PV inverter by replacing electrolytic capacitors with small film capacitors. The authors argued that this modification would only slightly increase the voltage ripple on the DC bus.
The main selection criterion for an on-grid inverter is its efficiency [36]. The efficiency of an inverter that converts the DC current to the AC current is typically 95–98% [37]. However, it should be mentioned that such efficiency is achieved when the inverter is operating at more than about 20% of the rated capacity. As the solar power plant generates less power, the efficiency of the inverter is significantly reduced. The latter problem is analyzed in [38], where the authors of the work studied boost converter topologies and sought to achieve higher energy conversion efficiency under different PV conditions, by using DC-DC boost converters. The efficient utilization of both low and high intensity of the solar energy is problematic, which requires a complex control system to maintain high efficiency in the power inverter [39]. Recent studies show that the application of highly efficient H bridge, flyback structure inverters with integrated computing methods for power inverter control, such as artificial intelligence or fuzzy logic control methods, require highly expensive computing resources, which significantly increases the cost of the overall system [40]. The results of previous research demonstrated that low and high energy intensity can be utilized very efficiently by using a three-phase dual system power inverter with an incorporated, cost effective, low frequency control system [39]. Although part of the structure of the developed DSPI is similar to the structure of the current source inverter, such an inverter operates at a completely different regime and has a significantly simpler structure. The electrical power based on the voltage electric system is supplied from a renewable energy resource to the input of the DSPI and converted to the electrical power on the basis of the current electric system. Moreover, the specific interconnection of the highly efficient energy storage device to the DSPI operating with a high frequency switching regime enables significantly higher stability of the output parameters and its quality at different three phase load operating regimes. Furthermore, the application of the DSPI in the power conversion system of the solar power plant leads to major benefits related to the avoidance of the incorporation of the DC/DC buck converter. Avoidance of the additional converter enables higher efficiency, potentially reduces cost effectiveness, and increases potential reliability of the overall power conversion system.
Research and experimental results of the three-phase dual system power inverter demonstrated that the highly variable intensity of renewable energy can be converted to conventional power grid parameters and the efficiency of such inverters varied up to 98.9%. This paper will demonstrate the economic cost-benefit analysis of the solar power conversion system with integrated conventional and three-phase dual-system power inverter.

2. Three-Phase On-Grid PV Power Inverter Based on Dual System Concept

2.1. Discussion of Phenomena of Dual Electric Systems

Two types of electric power sources can be found in electric engineering theory [40]. The nature of the power source defines which parameter (voltage or current) is constant. For example, if the voltage is constant and the current is variable, such systems are defined as the voltage electric systems, and vice-versa; if the current is constant and the voltage is variable, such systems are defined as the current electric systems [41].
The electric systems of the voltage are mainly used in the electrical networks. The effectiveness, performance and usage capabilities of electric power technologies depend greatly on the characteristics of such electrical power systems. The fundamental features, and patterns of the functioning have significant difference. The voltage and current dual electric systems supplement each other and enable highly performing operation and sophisticated operation of the devices, and reveal wider possibilities for their application. The area of photovoltaics is one of the most widely developed renewable generation areas in current integrated electric power technologies. A p-n junction photovoltaic element is a current source. It converts solar energy to direct current (DC) electric power, for which the dominating pattern is based on the current electric system. Following prospective technology, which has current electric source pattern of the DC electric power, is a nuclear fusion generator. Gamma radiation of the nuclear energy is converted directly to direct current electric system power [42]. Moreover, the current electric system is used in other prospective and modern technologies, such as solid-state lasers, illumination, electrothermal metal welding, and irradiation of gas discharge lamp equipment [43]. Such advanced power conversion systems are applied as current sources for most of the technologies indicated above.
The conversion of the voltage electric system electric power to a current electric system electric power is applied in the above indicated devices. Voltage and current electric power systems can be combined with each other into a single piece of equipment and can create a dual electric system. The application of such a system enables efficient power utilization of renewable energy technologies.

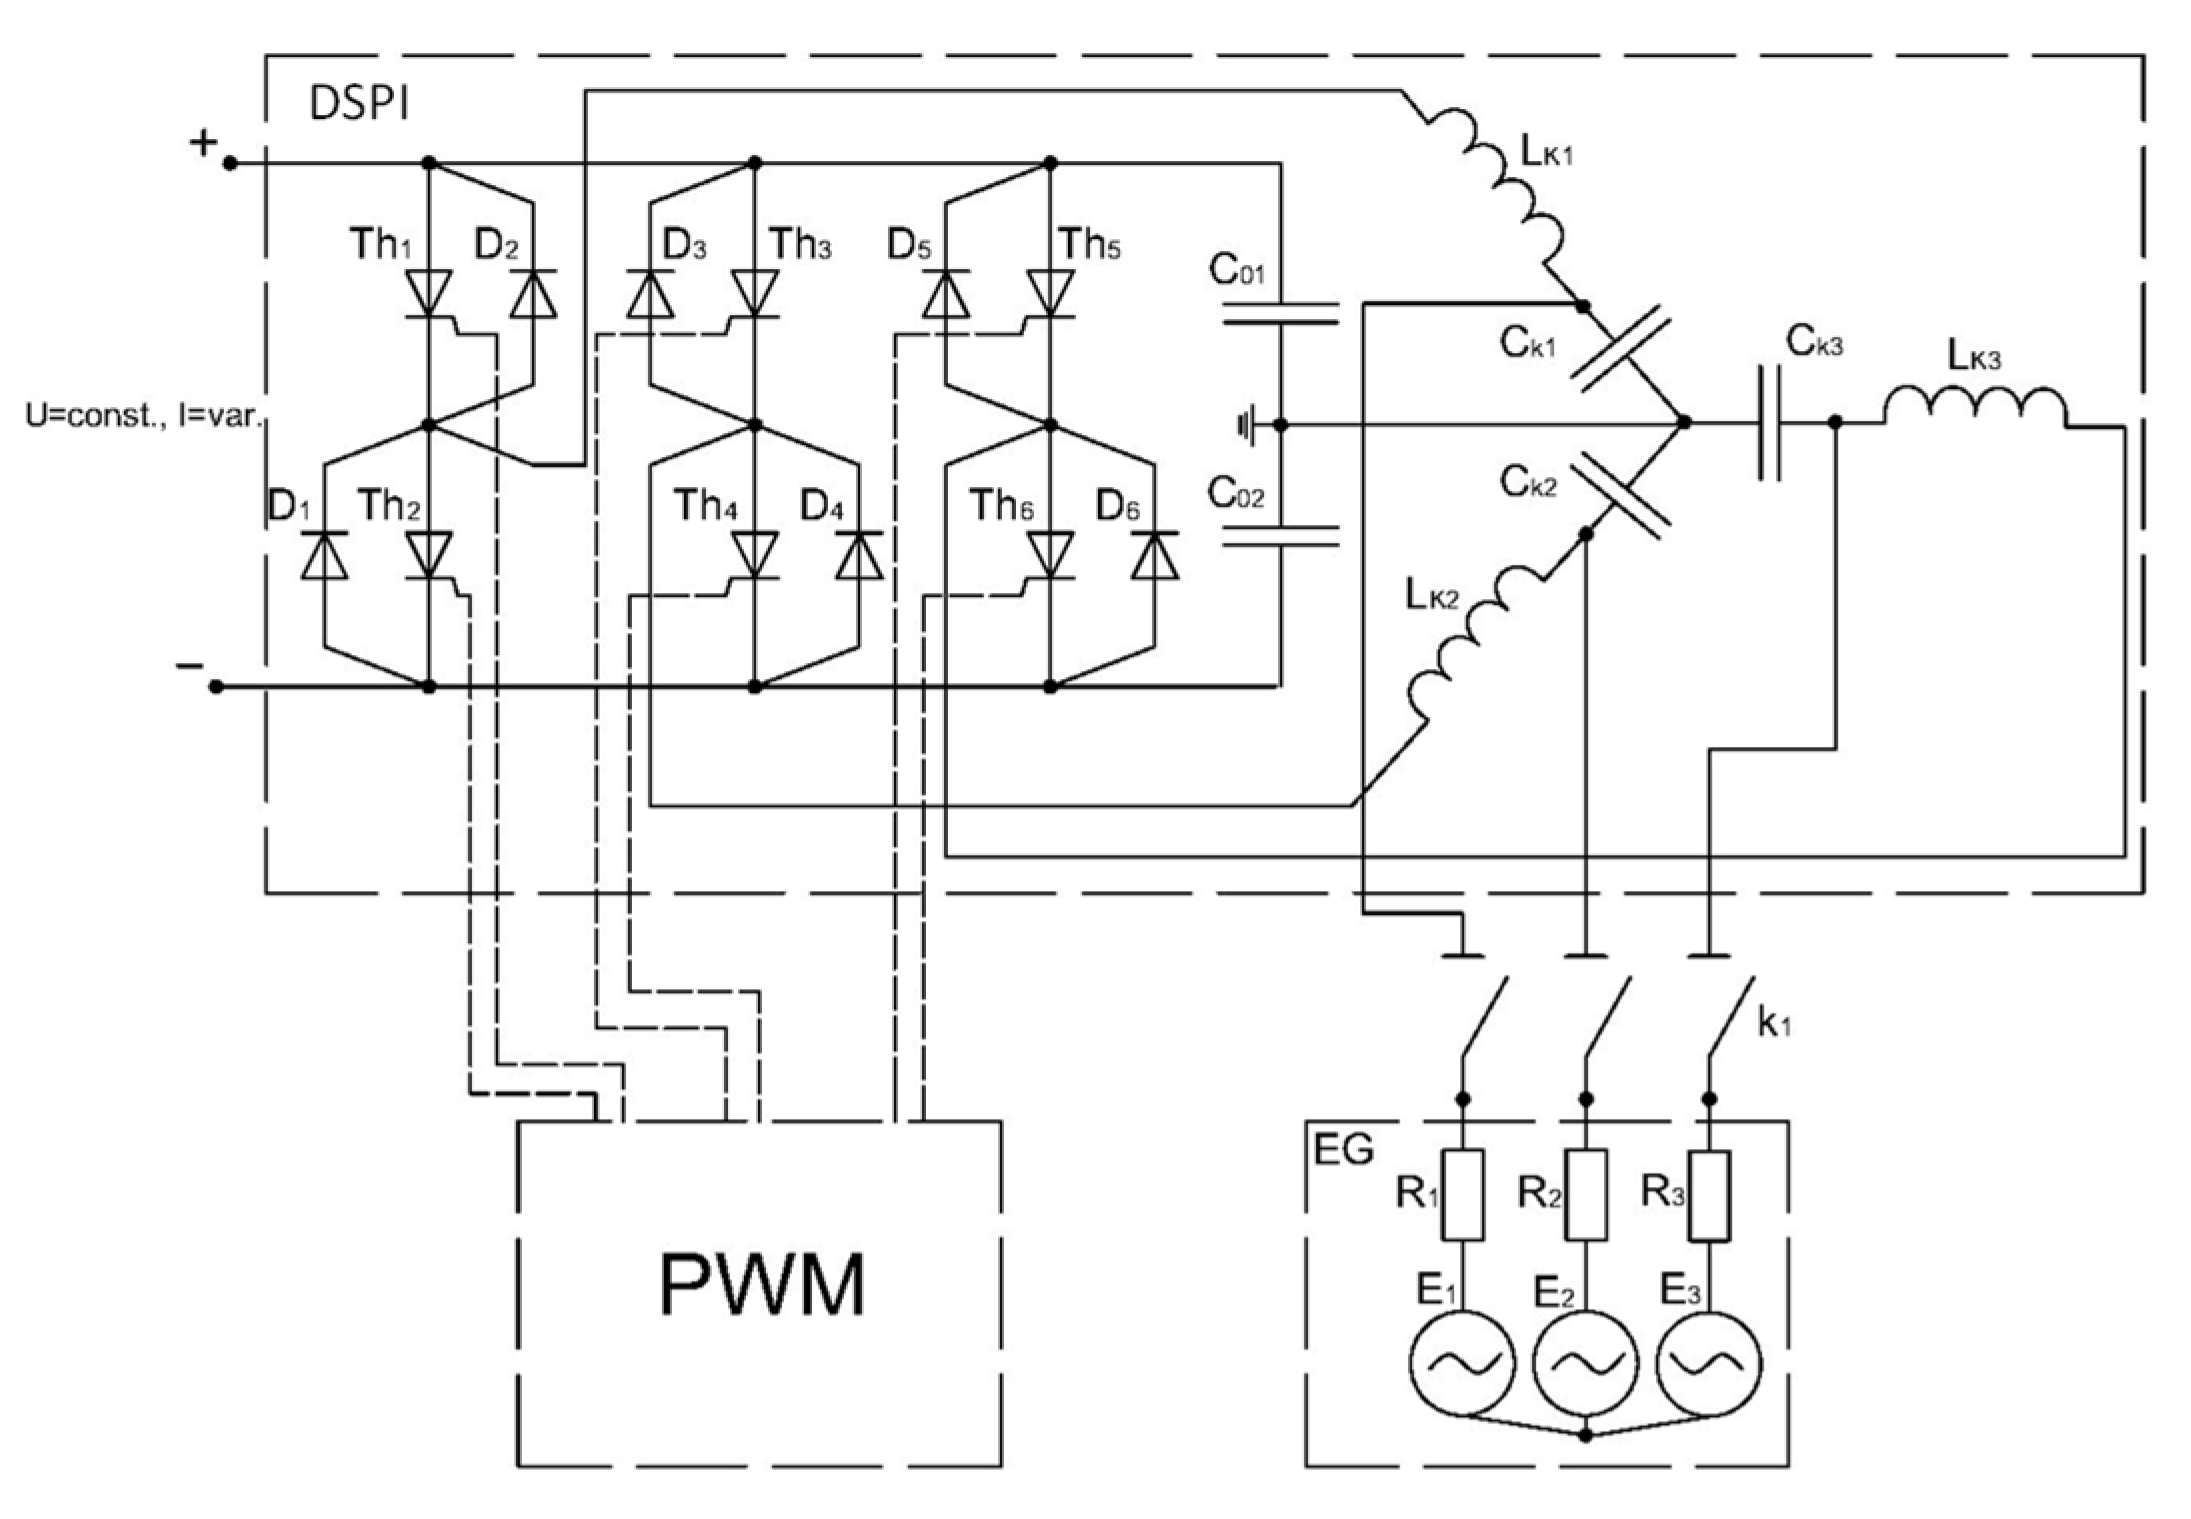
2.2. The Structure of a Three-Phase Dual System Power Inverter

The electrical diagram of the three-phase dual system power inverter (DSPI) is presented in Figure 1. DSPI consists of: semiconducting elements D1–D6 and Th1–Th6; active and reactive circuit elements LK1–LK3, C01, C02, CK1–CK3; electricity network (EG) with internal resistances R1–R3; and voltage sources E1–E3. The DC/DC buck converter is not incorporated for a power conversion system and is not necessary for a power conversion system of a solar power plant. Such avoidance of the additional converter enables higher efficiency, potentially increases cost effectiveness, and increases the potential reliability of the overall power conversion system.
An experimental prototype [39] was built to verify the phenomena of efficient operation of the dual electric system phenomena. MATLAB software was used to create a digital twin of a DSPI and to analyze the energy conversion processes. Such a digital twin model easily enables one to analyze the required scale DSPI with different sets of input and output electrical parameters and investigate approaches to its operation optimization.
The structure of the digital twin model of the solar power plant with DSPI is shown in Figure 2. There are five main model blocks: PV array, three-phase dual system power inverter DSPI, electricity network, controlled switches K1 and K4. The semiconducting components of the DSPI are controlled by a basic pulse width modulation PWM. The complex control system with PID controllers for resolving PWM control algorithms is not required; therefore, it could reduce the costs of such system and simplify the maintenance.

2.3. Validation of the Digital Twin Model of the DSPI Operation

Previous research of the simulated and experimental dual system power inverter confirmed the potentially efficient conversion of electric power and the highly efficient utilization of low-intensity renewable energy [39,40]. Moreover, the incorporation of the DSPI in the renewable power conversion system could potentially enable deployment of the non-complex control system of the DSPI and avoid the integration of the additional DC/DC converter. The research results of the experimental and digital twin models confirmed that when the DSPI system is applied, filter systems can be simplified and the quality of the electric power system under grid and off-grid operating conditions can be improved [39,40]. This basis led to research on the potential economic benefits of integrating the DSPI in a small power PV plant.
The simulation of the digital twin model with incorporated DSPI was performed in MATLAB software. The simulation model of the DSPI was scaled to 17 kVA of rated power, which was adequate for the scale of the experimental solar power plant. The research results are presented in Figure 3, which shows the reference characteristic of the phase current IAC versus the AC output power PAC supplied by DSPI to the power grid, IAC = f(PAC). The reference characteristic shows that the current IEG deviates by a maximum of 6% when the power PEG varies from 0 to 1 p.u.
Such a high permanence of the current IAC at highly variating of the output PAC caused by variation in electric power generated by the PV array confirms the phenomena that the DSPI has a pattern of the dual electric power systems concept. The DSPI converts electrical power from a DC voltage electric power system with random variation (U = const.; I = var.) to a three-phase electric system (I = const.; U = var.) of the AC power and delivers it to the electricity network.

3. Inverter Efficiency Evaluation Methodology

Inverter efficiency η is expressed as the ratio of the output active power PAC in the AC circuit and the input power PDC in the DC circuit of the inverter:
η = P AC P DC   .
The efficiency of a three-phase inverter, whose input contains several DC strings, can be expressed as:
η = i = 1 3 ( I AC , i V AC , f , i P F i ) j = 1 n ( I DC , j V DC , j ) ,
where IAC,i, VAC,i and PFi are phase-to-ground AC voltage, AC current, and power factor of the i-th phase; IDC,j and VDC,j are DC current and DC voltage of the j-th string; and n is the number of strings.
Inverter efficiency depends on the load of the inverter, and the function describing the characteristic of efficiency versus output power is non-linear. The characteristic can be evaluated if the AC power output and DC power input values are known. The shape of the inverter efficiency characteristic for the entire range of the inverter operation is rather complex. The authors of this paper suggest an approximation based on the following empirical expression:
η = f ( P AC ) = a b ( P AC + c ) d g · exp ( h · P AC k ) ,
where a, b, c, d, g, h, and k are the coefficients of the approximation curve.
In Section 5, it is shown that the suggested equation effectively approximates the curve of the PV inverter efficiency.
When the efficiency characteristics of the reference inverter and the digital twin inverter are known, the AC output power profiles of both inverters can be compared in order to analyze the difference in energy transferred to the electricity network. The potential annual AC output power profile of the DSPI is calculated according to the algorithm presented in Figure 4.

4. Experimental Evaluation of the Reference Inverter Efficiency

4.1. Experimental Equipment

The efficiency characteristics of the digital twin model of the DSPI were compared with the characteristics of a real inverter installed in a real solar power plant, later called a reference solar power plant. The 17 kVA installed capacity reference solar power plant consists of 36 photovoltaic modules connected in two parallel strings and a SolarEdge SE17K type inverter. The inverter is equipped with an integrated MPPT system, which enables steady DC side input voltage in the range from 745 V to 750 V. The outgoing clamps (AC side) of the inverter are connected to the electricity distribution network, and the rated voltage is 0.4 kV. The inverter is equipped with a data logging system which records the AC output line currents, line-to-line voltages, frequency, active and reactive power, power factor, and DC input voltage. The recorded and processed data are stored in a cloud with a 5 min time resolution. The absence of DC current input data in the existing data logging system makes it impossible to evaluate the efficiency of the inverter, thus additional data acquisition equipment was installed to record DC current and determine the efficiency of the inverter in various operating modes.
The functional diagram of the experimental equipment used to evaluate inverter efficiency is presented in Figure 5. A measurement system (CS), based on BECKHOFF Industrial PC C6015, was used for inverter efficiency evaluation. The DC input power and the AC output power of the inverter (INV), were calculated from the voltage and current measurements at the points A1 and A2. At the DC input, currents of two strings and voltage were measured by EL3702 modules, which performed the function of a current converter and a voltage divider. At the AC output, the module EL3443 equipped with current transformers was used to measure RMS currents and phase-to-ground voltages of three phases, as well as power factor values. All parameters were recorded simultaneously, with the sampling step of 20 ms and downsampled to 1 min time step obtained by averaging the recorded data. The DC parameters were recorded with 16 bit resolution, and the AC parameters were recorded with 32 bit resolution.

4.2. Characteristic of Recorded Data

The data recorded during a one year period, from 1 June 2020 to 31 May 2021, were used to investigate the characteristics of the reference solar power plant. The power generated by the solar plant is equal to the AC output power of the inverter. The annual power profile in a 3D view is presented in Figure 6a. The data in the figure have been rearranged to show the change from January to December. The power is presented in per units (p.u.), based on the installed capacity of the inverter—17 kW. Analysis shows that the solar power plant generated the highest amount of power from March to October, from 10 a.m. to 5 p.m. Peak power of 0.940 p.u. or 15.98 kW, accounting for 5 min resolution and 0.834 p.u. or 14.18 kW, was recorded in May; zero generation was observed in February. The latter phenomenon was caused by the low intensity of solar energy and the PV array being covered by snow.
The solar power plant produced 14,406 kWh in one year. The distribution of energy produced by the solar power plant at different values of AC output power is presented in Figure 6b. Analysis of 5 min resolution data shows that the highest amount of energy was produced at the output power of 0.7–0.75 p.u. However, averaging the data to 1 h resolution provides a different shape of energy distribution. Accounting for 1 h resolution, this shows that the highest amount of energy per hour is produced at output power of 0.5–0.7 p.u.
To evaluate the efficiency characteristics of the reference inverter, additional measurement equipment described in Section 4.1 was used. The electrical parameters of the DC input and AC output of the inverter were recorded from March to July 2021. Although the data sampling step of the measuring system was 20 ms, the data of DC currents and voltages and AC RMS currents, RMS voltages and power factors were recorded with 1 min time resolution. The measured data allowed us to calculate the DC input and AC output powers of the inverter and the amount of electrical energy supplied to the electricity network by the inverter at different load levels. Profile examples of the inverter DC input power and AC output power, as well as the calculated efficiency, are shown in Figure 7.
Additional analysis of the results shows that, with an input power of less than 1% of the maximum inverter power (<170 W), the inverter energy efficiency decreases significantly, as the inverter control circuit cannot provide the MPPT function. With an input power of less than 0.5% of the maximum inverter power (<85 W), the evaluation of inverter efficiency is no longer coherent, as the inverter and its control circuits operate in transient modes (transition to standby, wake-up, ‘capture’ of MPPT, etc.).

5. Results and Discussion Regarding Efficiency of the Dual System Power Inverter

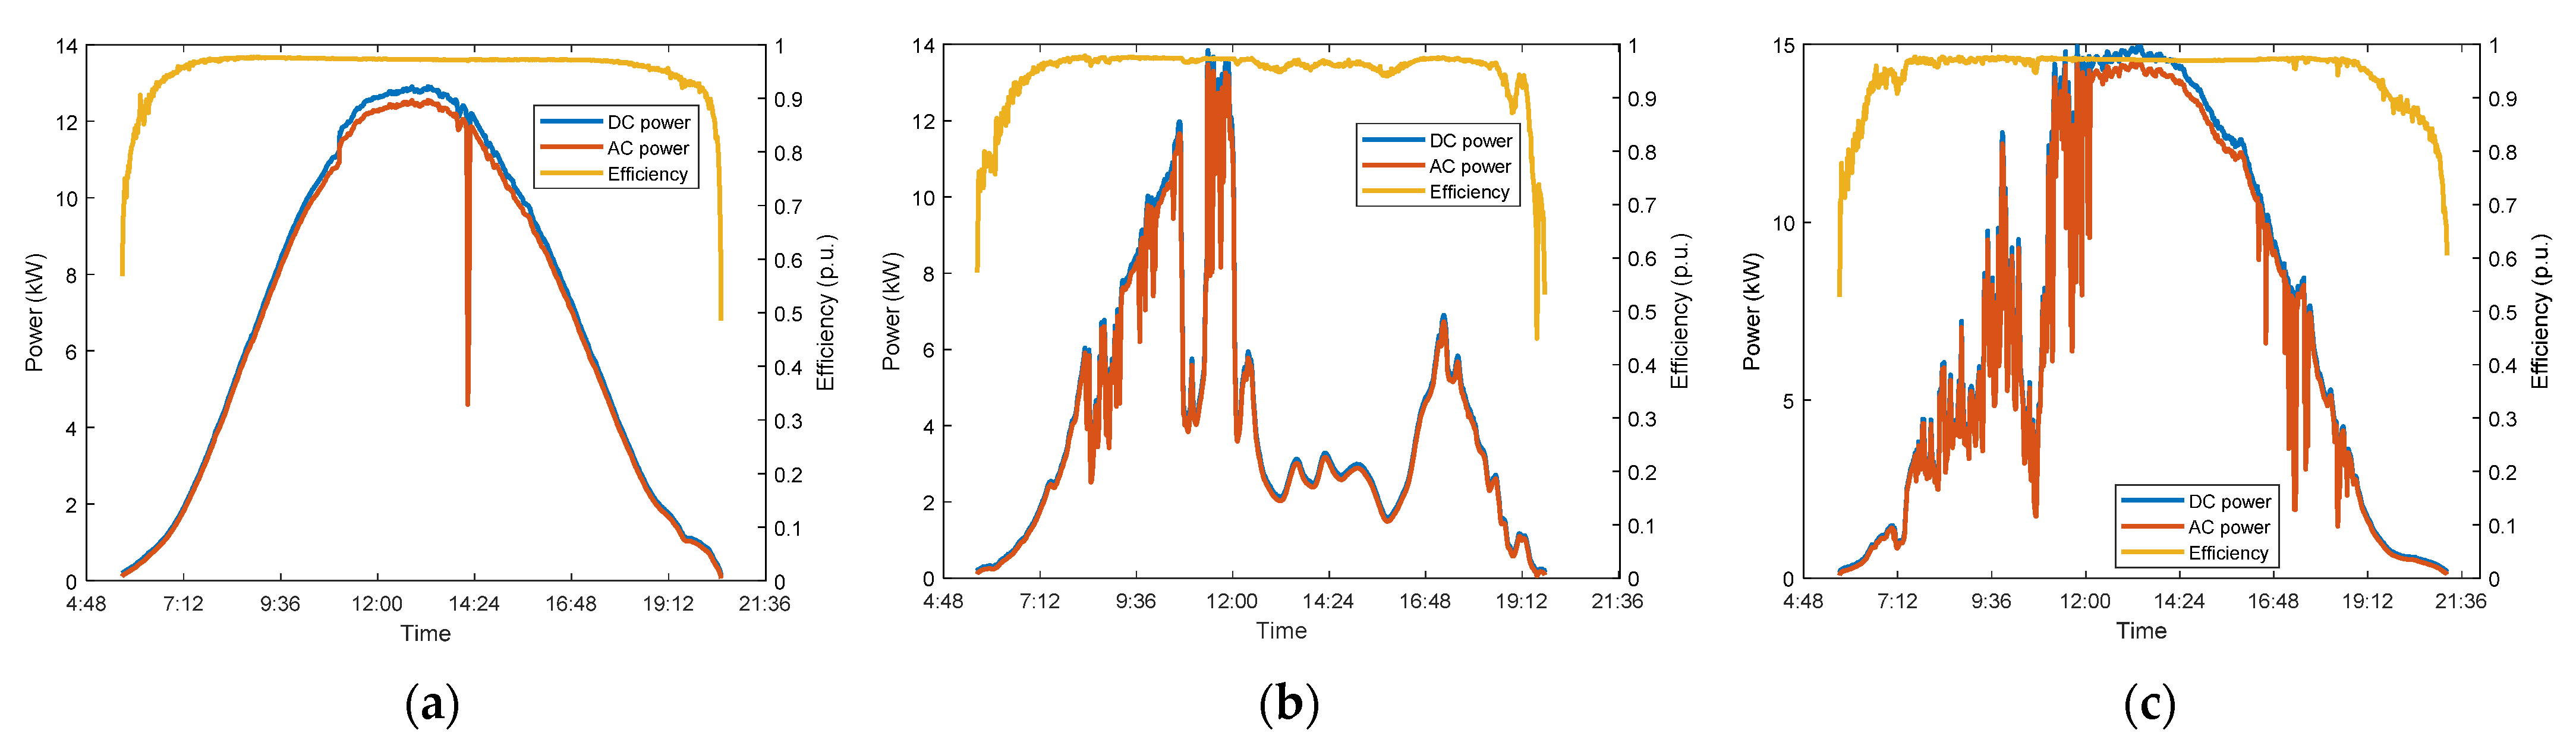
5.1. Evaluation of the Inverter Efficiency Characteristic

The efficiency characteristics of the reference inverter and the DSPI digital twin are evaluated by approximation of the measured and simulated data. The approximate characteristic of the efficiency versus AC output power of the reference inverter is presented in Figure 8a and the characteristic of the DSPI digital twin is presented in Figure 8b. The characteristics were approximated according to the empirical Equation (3), and the defined coefficients of the equation are listed in Table 1. The quality of the approximated characteristic is evaluated by three metrics—sum square error (SSE), R-square (R2) and root mean square error (RMSE)—which show that the suggested empirical equation provides high precision (Table 2) to the PV inverter efficiency curve. The characteristics of the reference inverter and the DSPI digital twin are visually compared in Figure 8c.
The DSPI digital twin can operate in a wide range of the AC output power, from 0 to 1 p.u., meanwhile the reference inverter starts generating only when PAC exceeds 0.0037 p.u. The weighted efficiency of the reference inverter and the DSPI digital twin is evaluated according to the Euro efficiency [44] and the CEC efficiency method of the California Energy Commission [45]:
η EUR = 0.03 η ( 0.05 ) + 0.06 η ( 0.10 ) + 0.13 η ( 0.20 ) + 0.1 η ( 0.30 ) + 0.45 η ( 0.50 ) + 0.20 η ( 1.00 ) ,
η CEC = 0.04 η ( 0.10 ) + 0.05 η ( 0.20 ) + 0.12 η ( 0.30 ) + 0.21 η ( 0.50 ) + 0.53 η ( 0.75 ) + 0.05 η ( 1.00 ) .
The weighted efficiency values are listed in Table 3. In both cases, the efficiency of the DSPI digital twin is higher by 0.22–0.27 percent.

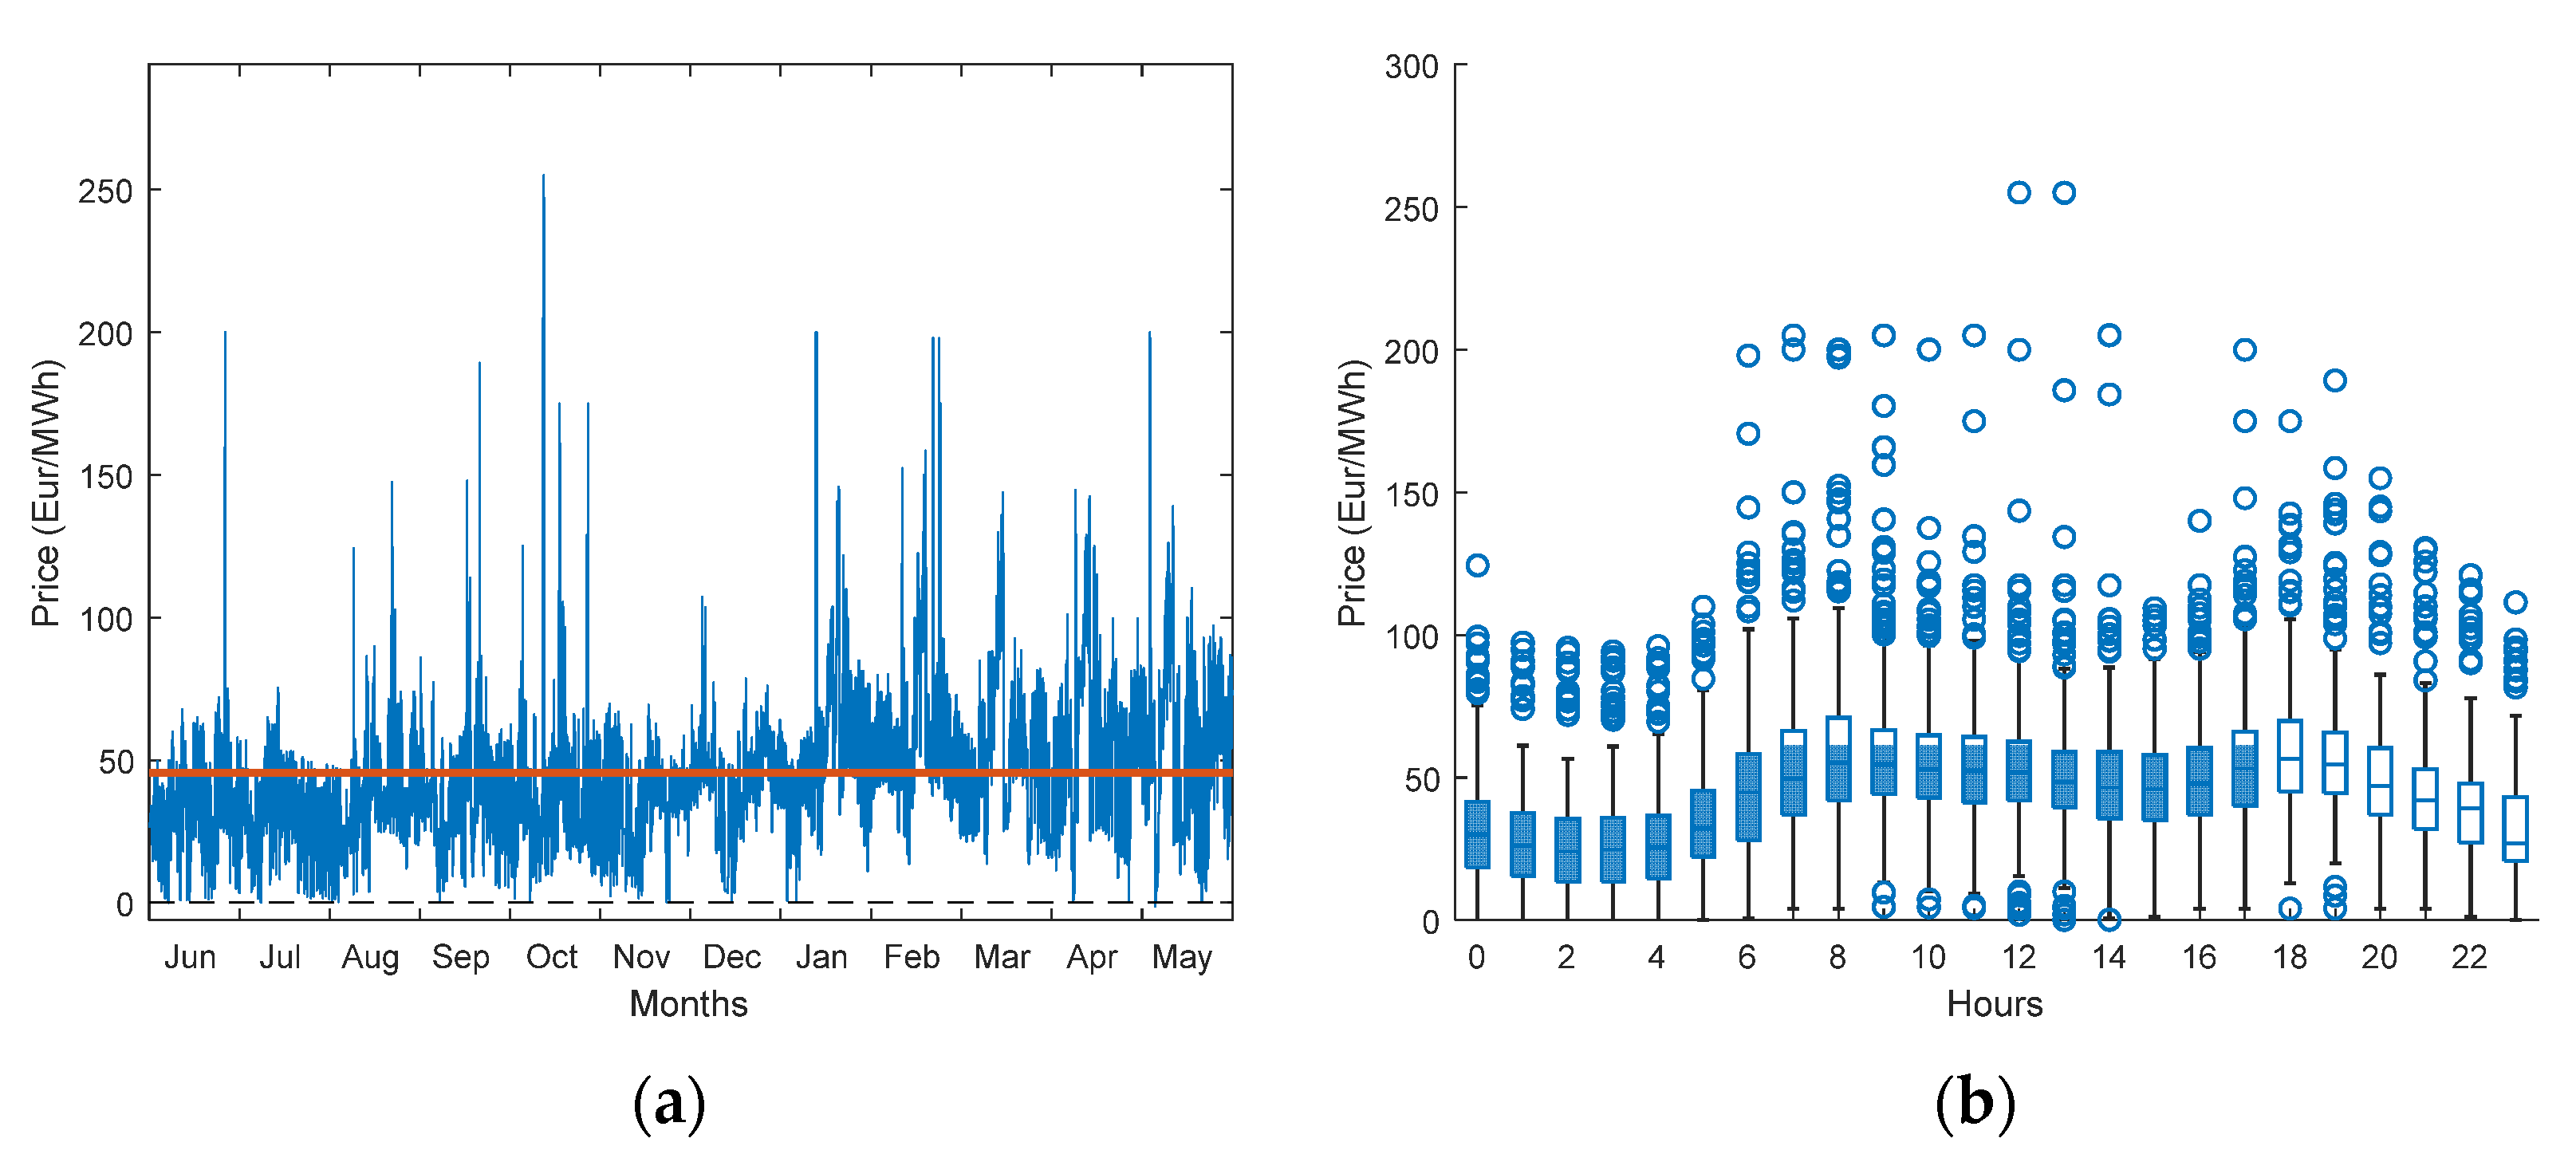
5.2. Evaluation of Potential Economic Benefit of the DSPI Inverer

Higher efficiency and wider range of operation of the DSPI inverter lead to increased energy production by the solar power plant with the same PV array. The difference in annual power profiles of the DSPI digital twin and the reference inverter is presented in a 3D view in Figure 9. The benefit of the DSPI inverter can be observed during a wide range of the day.
When considering the efficiency of the DSPI inverter, several profile zones need to be distinguished. The effect of higher efficiency is observed when the DSPI is operating at more than 4% power. This mode is predominant from March to October and is typical from 8 a.m. to 4 p.m. in the summer months. In addition, the advantage of the DSPI is observed at a relatively low intensity of the solar energy in the early morning and late evening hours when the reference inverter is not operational. In addition, during winter months, for example, in February, when the reference inverter did not generate electricity, the DSPI inverter may show its advantage (this situation is illustrated by the red peaks in February in Figure 9). However, when the solar power plant operates at a low power of 0.37–4%, the reference inverter is superior and can transmit more power in particular hours.
The potential benefit of the DSPI inverter was evaluated by accounting for energy market prices. The data used in the analysis were the hourly prices of the NordPool spot market (Elspot) over a period of time [46]. Historical hourly prices are presented in Figure 10a. The figure shows that prices are volatile, and in a time period from 2020 to 2021, the price increased almost by 50%, indicating that in the 2020 summer, the average market prices were significantly lower than in the 2021 winter. The box plot in Figure 10b shows that higher electricity prices prevail during the daytime period and the higher efficiency of the DSPI inverter may provide economic benefit.
The correlation between the potential revenue of the DSPI inverter and the difference in energy transferred by the DSPI and the reference inverter is shown in Figure 11. The DSPI inverter is seen to provide additional revenue for many hours.
The analysis clearly demonstrates the positive revenue of the DSPI from February to November, by utilizing solar energy and converting more electrical energy by up to 0.17% and earning an up to 0.18% larger amount of the revenue, instead of incorporating the reference inverter (Figure 12). Research demonstrates that usage of the DSPI inverter can increase the yearly revenue by 0.9259% in a given year. Further economic research that accounts for the cost of inverter manufacturing and the forecast of electricity prices, as well as different tariff policies, should be done to more accurately assess the economic effect of the proposed DSPI inverter.

6. Conclusions

The research results regarding the potential economic benefit of the incorporation of the three-phase dual system power inverter applied in the experimental solar power plant, confirm the potential positive impact on solar power conversion efficiency and annual electrical energy generation. Substituting the conventional inverter, with the advanced inverter based on combination of the dual electric system, enables a 0.911% increase in annual electrical energy generation. Particularly, the application of the dual system power inverter in the solar power plant potentially enables significantly higher utilization of the low solar energy intensity as well as a potential economic benefit. The research results show that when the solar power plant operates at low power which is less than 0.37% and higher than 4% of its rated power, the dual system power inverter is superior and can transmit more power in particular hours.
Further, experimental research is envisaged of the operation of the three-phase dual system power inverter, which would relate to the optimization of the control system for different connected load conditions in on-grid and off-grid operation regimes.

Author Contributions

Conceptualization, J.V. and P.N.; methodology, J.V. and P.N.; software, P.N.; validation, J.V. and P.N.; formal analysis, J.V. and A.J.; investigation, A.B.; resources, S.G. and A.B.; data curation, A.B., P.N. and J.V.; writing—original draft preparation, J.V., P.N., A.J. and A.B.; writing—review and editing, S.G. and D.P.; visualization, J.V. and A.B.; P.N. and A.J.; supervision, S.G. and A.J.; project administration, A.J.; funding acquisition, S.G. and A.J. All authors have read and agreed to the published version of the manuscript.

Funding

This work was supported in part by the European Economic Area (EEA) and Norway Financial Mechanism 2014–2021 under Grant EMP474 and in part by the Estonian Research Council grant (PRG1086).

Informed Consent Statement

Informed consent was obtained from all subjects involved in the study.

Conflicts of Interest

The authors declare no conflict of interest.

References

  1. Solomon, B.D.; Krishna, K. The coming sustainable energy transition: History, strategies, and outlook. Energy Policy 2011, 39, 7422–7431. [Google Scholar] [CrossRef]
  2. Berdysheva, S.; Ikonnikova, S. The Energy Transition and Shifts in Fossil Fuel Use: The Study of International Energy Trade and Energy Security Dynamics. Energies 2021, 14, 5396. [Google Scholar] [CrossRef]
  3. Blazquez, J.; Fuentes-Bracamontes, R.; Bollino, C.A.; Nezamuddin, N. The renewable energy policy Paradox. Renew. Sustain. Energy Rev. 2018, 82, 1–5. [Google Scholar] [CrossRef]
  4. Feron, S. Sustainability of Off-Grid Photovoltaic Systems for Rural Electrification in Developing Countries: A Review. Sustainability 2016, 8, 1326. [Google Scholar] [CrossRef] [Green Version]
  5. Khan, M.R.; Alam, I. A Solar PV-Based Inverter-Less Grid-Integrated Cooking Solution for Low-Cost Clean Cooking. Energies 2020, 13, 5507. [Google Scholar] [CrossRef]
  6. Langniss, O.; Ince, D. Solar water heating: A viable industry in developing countries. Refocus 2004, 5, 18–21. [Google Scholar] [CrossRef]
  7. Pode, R. Solution to enhance the acceptability of solar-powered LED lighting technology. Renew. Sustain. Energy Rev. 2010, 14, 1096–1103. [Google Scholar] [CrossRef]
  8. Eteiba, M.B.; Barakat, S.; Samy, M.M.; Wahba, W.I. Optimization of an off-grid PV/Biomass hybrid system with different battery technologies. Sustain. Cities Soc. 2018, 40, 713–727. [Google Scholar] [CrossRef]
  9. Adaramola, M.S.; Quansah, D.A.; Agelin-Chaab, M.; Paul, S.S. Multipurpose renewable energy resources based hybrid energy system for remote community in northern Ghana. Sustain. Energy Technol. Assess. 2017, 22, 161–170. [Google Scholar] [CrossRef]
  10. Jäger-Waldau, A.; Kougias, I.; Taylor, N.; Thiel, C. How photovoltaics can contribute to GHG emission reductions of 55% in the EU by 2030. Renew. Sustain. Energy Rev. 2020, 126, 109836. [Google Scholar] [CrossRef]
  11. Trenberth, K.E. Climate change caused by human activities is happening and it already has major consequences. J. Energy Nat. Resour. Law 2018, 36, 463–481. [Google Scholar] [CrossRef]
  12. Statista. Largest Solar Photovoltaic Power Plants Worldwide as of June 2021, by Capacity. Available online: https://www.statista.com/statistics/217265/largest-solar-pv-power-plants-in-operation-worldwide/ (accessed on 1 October 2021).
  13. Our World in Data. Solar PV Cumulative Capacity. Available online: https://ourworldindata.org/grapher/solar-pv-cumulative-capacity (accessed on 1 October 2021).
  14. Our World in Data. Installed Solar Energy Capacity. Available online: https://ourworldindata.org/grapher/installed-solar-pv-capacity (accessed on 1 October 2021).
  15. Our World in Data. Solar PV Module Prices vs. Cumulative Capacity. Available online: https://ourworldindata.org/grapher/solar-pv-prices-vs-cumulative-capacity (accessed on 1 October 2021).
  16. Jonaitis, A.; Gudzius, S.; Morkvenas, A.; Azubalis, M.; Konstantinaviciute, I.; Baranauskas, A.; Ticka, V. Challenges of integrating wind power plants into the electric power system: Lithuanian case. Renew. Sustain. Energy Rev. 2018, 94, 468–475. [Google Scholar] [CrossRef]
  17. Lorenz, C. Balancing reserves within a decabonized European electricity System in 2050—From market developments to model insights. In Proceedings of the 2017 14th International Conference on the European Energy Market (EEM), Dresden, Germany, 6–9 June 2017; pp. 1–8. [Google Scholar] [CrossRef]
  18. El-Sayed, M.M.; El-Ela, A.A.A.; El-Sehiemy, R.A. Effect of photovoltaic system on power quality in electrical distribution networks. In Proceedings of the 2016 Eighteenth International Middle East Power Systems Conference (MEPCON), Cairo, Egypt, 27–29 December 2016; pp. 1005–1012. [Google Scholar] [CrossRef]
  19. Nayan, M.F.; Ullah, S.M.S.; Saif, S.N. Comparative analysis of PV module efficiency for different types of silicon materials considering the effects of environmental parameters. In Proceedings of the 2016 3rd International Conference on Electrical Engineering and Information Communication Technology (ICEEICT), Dhaka, Bangladesh, 22–24 September 2016; pp. 1–6. [Google Scholar] [CrossRef]
  20. Rauf, S.; Wahab, A.; Rizwan, M.; Rasool, S.; Khan, N. Application of Dc-grid for Efficient use of solar PV System in Smart Grid. Procedia Comput. Sci. 2016, 83, 902–906. [Google Scholar] [CrossRef] [Green Version]
  21. Sinapis, K.; Tsatsakis, K.; Dörenkämper, M.; van Sark, W.G.J.H.M. Evaluation and Analysis of Selective Deployment of Power Optimizers for Residential PV Systems. Energies 2021, 14, 811. [Google Scholar] [CrossRef]
  22. Vignola, F.; Mavromatakis, F.; Krumsick, J. Performance of PV inverters. In Proceedings of the 37th ASES Annual Conference, San Diego, CA, USA, 3–8 May 2008. [Google Scholar]
  23. Clean Energy Reviews. Most Efficient Solar Panels 2021 by Jason Svarc. Available online: https://www.cleanenergyreviews.info/blog/most-efficient-solar-panels (accessed on 1 October 2021).
  24. Kumar, B.S.; Sudhakar, K. Performance evaluation of 10 MW grid connected solar photovoltaic power plant in India. Energy Rep. 2015, 1, 184–192. [Google Scholar] [CrossRef] [Green Version]
  25. Mansur, A.A.; Amin, M.R.; Islam, K.K. Performance Comparison of Mismatch Power Loss Minimization Techniques in Series-Parallel PV Array Configurations. Energies 2019, 12, 874. [Google Scholar] [CrossRef] [Green Version]
  26. Koirala, B.; Sahan, B.; Henze, N. Study on MPP Mismatch Losses in Photovoltaic Applications. In Proceedings of the 24th European Photovoltaic Solar Energy Conference, Hamburg, Germany, 21–25 September 2009; pp. 3727–3733. [Google Scholar] [CrossRef]
  27. Elbarbary, Z.M.S.; Alranini, M.A. Review of maximum power point tracking algorithms of PV system. Front. Eng. Built Environ. 2021, 1, 68–80. [Google Scholar] [CrossRef]
  28. Li, L.L.; Lin, G.Q.; Tseng, M.L.; Tan, K.; Lim, M.K. A maximum power point tracking method for PV system with improved gravitational search algorithm. Appl. Soft Comput. 2018, 65, 333–348. [Google Scholar] [CrossRef]
  29. Zhao, J.; Zhou, X.; Ma, Y.; Liu, W. A novel maximum power point tracking strategy based on optimal voltage control for photovoltaic systems under variable environmental conditions. Sol. Energy 2015, 122, 640–649. [Google Scholar] [CrossRef]
  30. El-Khozondar, H.J.; El-Khozondar, R.J.; Matter, K.; Suntio, T. A review study of photovoltaic array maximum power tracking algorithms. Renewables 2016, 3, 3. [Google Scholar] [CrossRef] [Green Version]
  31. Podder, A.K.; Roy, N.K.; Pota, H.R. MPPT methods for solar PV systems: A critical review based on tracking nature. IET Renew. Power Gener. 2019, 13, 1615–1632. [Google Scholar] [CrossRef]
  32. Ali Khan, M.Y.; Liu, H.; Yang, Z.; Yuan, X. A Comprehensive Review on Grid Connected Photovoltaic Inverters, Their Modulation Techniques, and Control Strategies. Energies 2020, 13, 4185. [Google Scholar] [CrossRef]
  33. Zeng, Z.; Yang, J.; Zhao, R.; Cheng, C. Topologies and control strategies of multi-functional grid-connected inverters for power quality enhancement: A comprehensive review. Renew. Sustain. Energy Rev. 2013, 24, 223–270. [Google Scholar] [CrossRef]
  34. Khaled, U.; Farh, H.; Alissa, S.; Abanmi, A.; Aldraimli, O. Efficient solution of the DC-link hard switching inverter of the PV system. J. King Saud Univ.-Eng. Sci. 2020, 32, 425–431. [Google Scholar] [CrossRef]
  35. Karanayil, B.; Agelidis, V.G.; Pou, J. Performance Evaluation of Three-Phase Grid-Connected Photovoltaic Inverters Using Electrolytic or Polypropylene Film Capacitors. IEEE Trans. Sustain. Energy 2014, 5, 1297–1306. [Google Scholar] [CrossRef]
  36. Kouro, S.; Leon, J.I.; Vinnikov, D.; Franquelo, L.G. Grid-Connected Photovoltaic Systems: An Overview of Recent Research and Emerging PV Converter Technology. IEEE Ind. Electron. Mag. 2015, 9, 47–61. [Google Scholar] [CrossRef]
  37. Park, C.-Y.; Hong, S.-H.; Lim, S.-C.; Song, B.-S.; Park, S.-W.; Huh, J.-H.; Kim, J.-C. Inverter Efficiency Analysis Model Based on Solar Power Estimation Using Solar Radiation. Processes 2020, 8, 1225. [Google Scholar] [CrossRef]
  38. Babaa, S.E.; Armstrong, M. Novel control strategy for PV systems based on the irradiation. In Proceedings of the 2017 8th International Renewable Energy Congress (IREC), Amman, Jordan, 21–23 March 2017; pp. 1–6. [Google Scholar] [CrossRef]
  39. Norkevičius, P.; Balčiūnas, P. Research and practical utilisation of low-intensity stochastic energy. IET Renew. Power Gener. 2015, 9, 739–746. [Google Scholar] [CrossRef]
  40. Balčiūnas, P. Dual Electric Systems Circuit Theory and Application. Science Monography; Technologija: Kaunas, Lithuania, 2011; pp. 138–149. [Google Scholar]
  41. Piasecki, S.; Zaleski, J.; Jasinski, M.; Bachman, S.; Turzyński, M. Analysis of AC/DC/DC Converter Modules for Direct Current Fast-Charging Applications. Energies 2021, 14, 6369. [Google Scholar] [CrossRef]
  42. Hirota, J.; Tarusawa, K.; Kudo, K.; Uchida, M. Proposal for Electric Power Generation by Using X-Rays and Gamma Rays. J. Nucl. Sci. Technol. 2011, 48, 103–107. [Google Scholar] [CrossRef]
  43. Balčiūnas, P. Synthesis of High Frequency Voltage-Current Power Converters Theory; Technologija: Kaunas, Lithuania, 1994; pp. 125–162. [Google Scholar]
  44. Bletterie, B.; Bründlinger, R.; Lauss, G. On the characterisation of PV inverters’ efficiency—Introduction to the concept of achievable efficiency. Prog. Photovolt. Res. Appl. 2011, 19, 423–435. [Google Scholar] [CrossRef]
  45. Bower, W.; Whitaker, C.; Erdman, W.; Behnke, M.; Fitzgerald, M. Performance Test Protocol for Evaluating Inverters Used in Grid-Connected Photovoltaic Systems. Sandia National Laboratory Technical Report. Available online: https://www.energy.ca.gov/sites/default/files/2020-06/2004-11-22_Sandia_Test_Protocol_ada.pdf (accessed on 21 October 2021).
  46. Nordpool. Historical Market Data. Available online: https://www.nordpoolgroup.com/historical-market-data/ (accessed on 21 October 2021).
Figure 1. Dual system, three-phase power inverter diagram (DSPI—the dual system three-phase power inverter, EG—electricity grid, PWM—pulse with modulator).
Energies 15 00161 g001
Figure 2. The digital twin of the DSPI developed in the MATLAB Simulink environment.
Energies 15 00161 g002
Figure 3. Dependence of the phase current IAC supplied by DSPI to the power grid versus the power PAC supplied by DSPI to the power grid.
Energies 15 00161 g003
Figure 4. Algorithm for calculating the output power of the DSPI.
Energies 15 00161 g004
Figure 5. The measurement structure of the electrical parameters for the inverter (INV—inverter, A1—measuring point of DC electrical parameters, A2—measuring point of AC electrical parameters. Black blocks represent electrical equipment and stationary data recording system; blue blocks represent the installed data acquisition system for inverter efficiency evaluation).
Energies 15 00161 g005
Figure 6. 3D power profile of the reference solar power plant (a) and distribution of annual energy versus AC output power (b).
Energies 15 00161 g006
Figure 7. Examples of the recorded profiles of the reference inverter input DC power, output AC power and efficiency during three days with different cloud conditions: (a) 16 July 2021 (b) 17 July 2021 (c) 18 July 2021.
Energies 15 00161 g007
Figure 8. Efficiency characteristics of the reference inverter (a), the DSPI digital twin model (b), and comparison of them (c).
Energies 15 00161 g008
Figure 9. 3D power difference profile of the DSPI digital twin and the reference inverter.
Energies 15 00161 g009
Figure 10. NordPool spot market prices: (a) annual profile (the red line shows the average price value); (b) day profile.
Energies 15 00161 g010
Figure 11. Revenue of the DSPI inverter versus the difference in energy transferred to the electricity network (the red line is a trend line of dispersed data).
Energies 15 00161 g011
Figure 12. The difference of the converted electric power and revenue between the reference inverter and DSPI digital twin for a 1 year period.
Energies 15 00161 g012
Table 1. Coefficients of the approximation of the inverter efficiency curves according to Equation (3).
CoefficientReference InverterModelled Inverter
a0.97391.088
b0.0034310.09944
c0.0036130.0000894
d1.030.09316
g0.011310.851
h3.0271283
k2.3731.866
Table 2. Parameters of the approximation characteristics of the power efficiency.
ParameterReference InverterModelled Inverter
SSE0.030980.0001942
R20.99750.9999
RMSE0.0028550.004926
Table 3. Weighted efficiency evaluation of the reference inverter and DSPI digital twin.
Parameter η E U R η C E C
Reference inverter0.96870.9788
Modelled inverter0.97090.9815
Difference0.00220.0027
Publisher’s Note: MDPI stays neutral with regard to jurisdictional claims in published maps and institutional affiliations.

