
Impact of Demand Response on Optimal Sizing of Distributed Generation and Customer Tariff


Abstract
:1. Introduction
2. Literature and Contributions of the Work
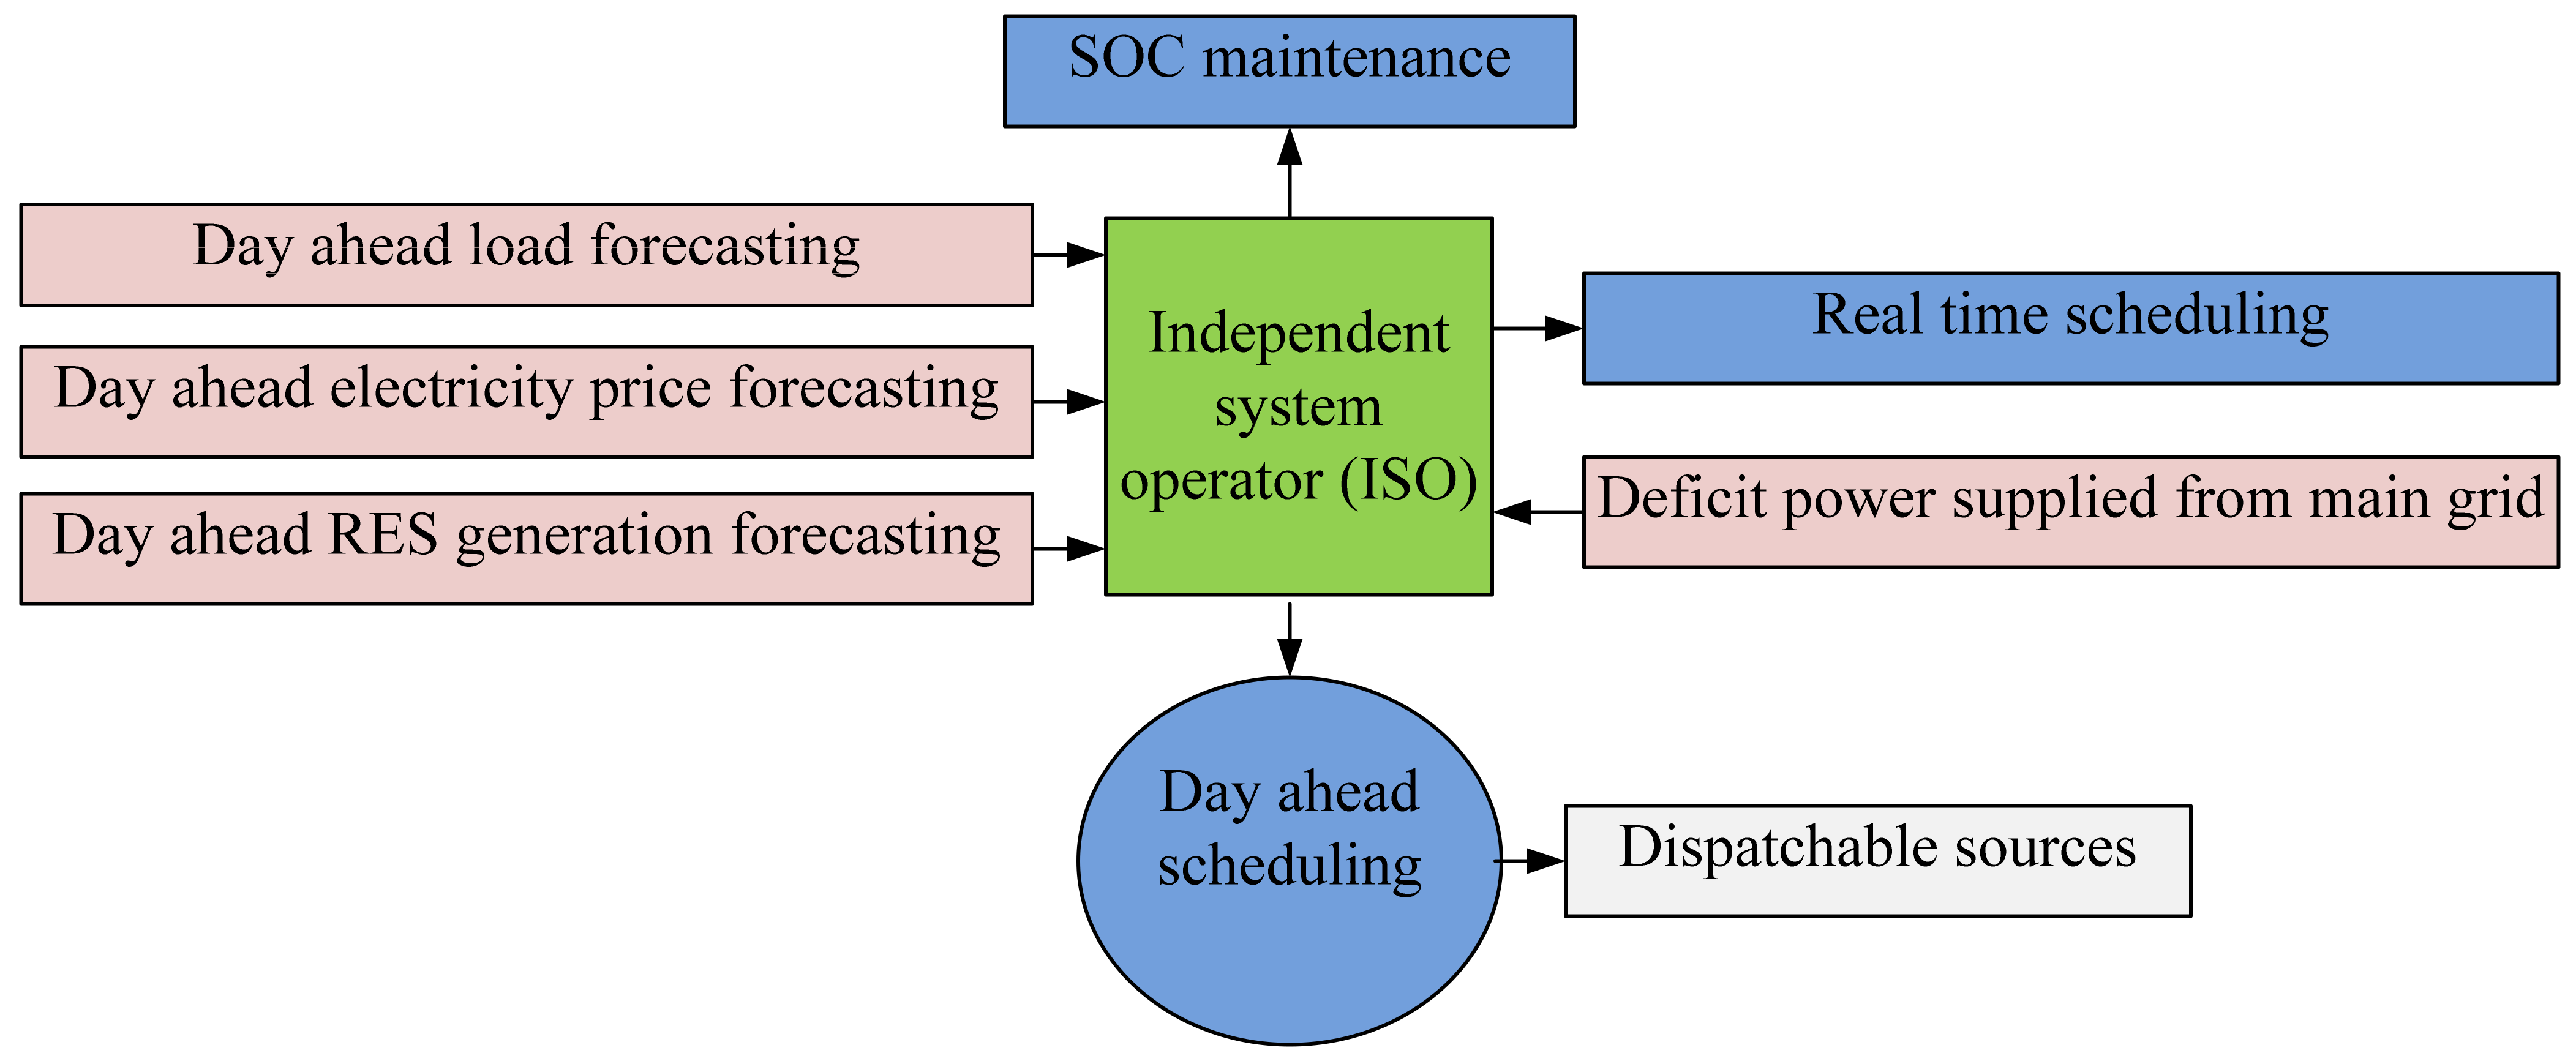
2.1. A Brief Introduction on Optimal Scheduling in a MG
2.2. The Necessity of Optimal Sizing of DERs in a MG
2.3. Functions of DR Aggregator
2.4. Recap of Energy Trading Models
2.5. A Combined Literature Survey on Various EMS
2.6. Load Clustering and Its Significance
2.7. Noteworthy Points
- Effective load clustering is required to avoid unnecessary compromise in consumers’ satisfaction and lifestyle.
- The size of DGs is proportional to the peak load demand which has to be supplied by the sources.
- The consumer’s tariff is a direct function of electricity price, therefore, if there is any change in the consumers’ load pattern in accordance with the electricity price, it may reduce the consumers’ tariff.
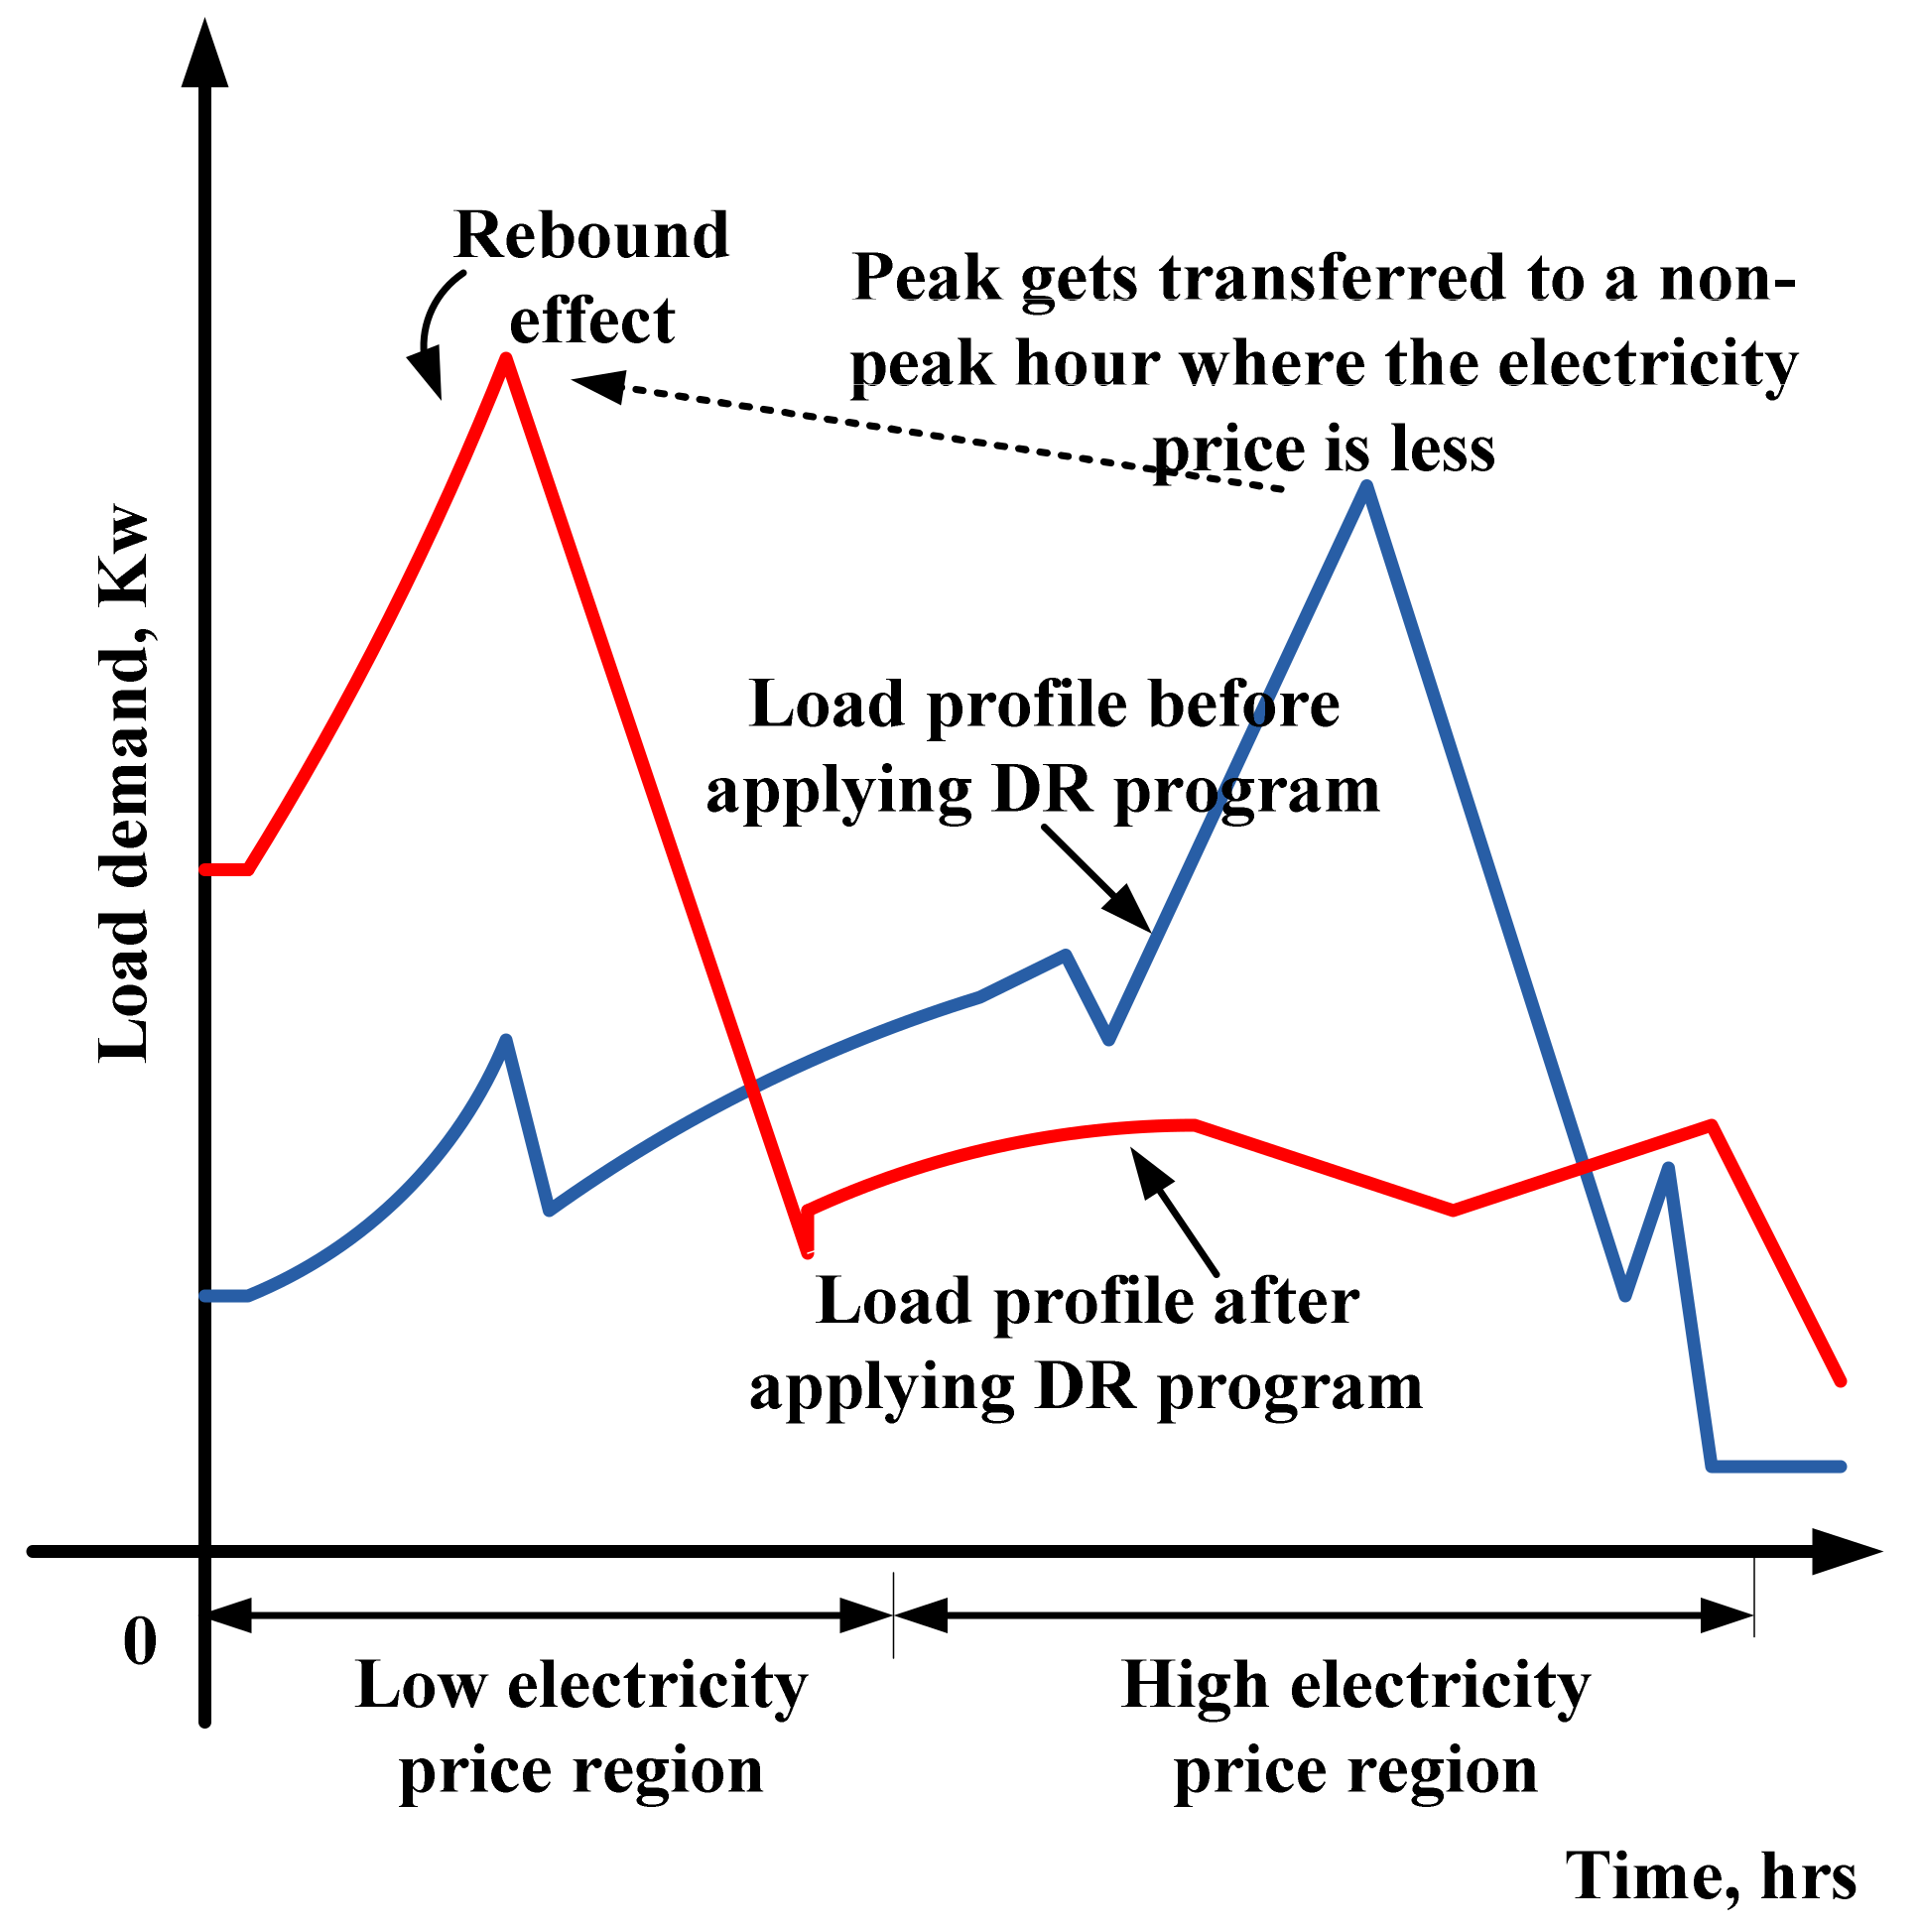
- Occurrence of payback or rebound effect during low electricity price zone.
2.8. Contributions of the Work
3. Objective Function Modeling
- Minimize the size of DGs in the power system.
- Minimize the consumer’s electricity bill and improve the load factor.
- Air conditioners, heating loads.
- Washing machines
- EV’s
4. Proposed Methodology
- Read the load data, electricity price in each hour, generator data such as the minimum and maximum capacity, operating costs, and maintenance cost of each generator.
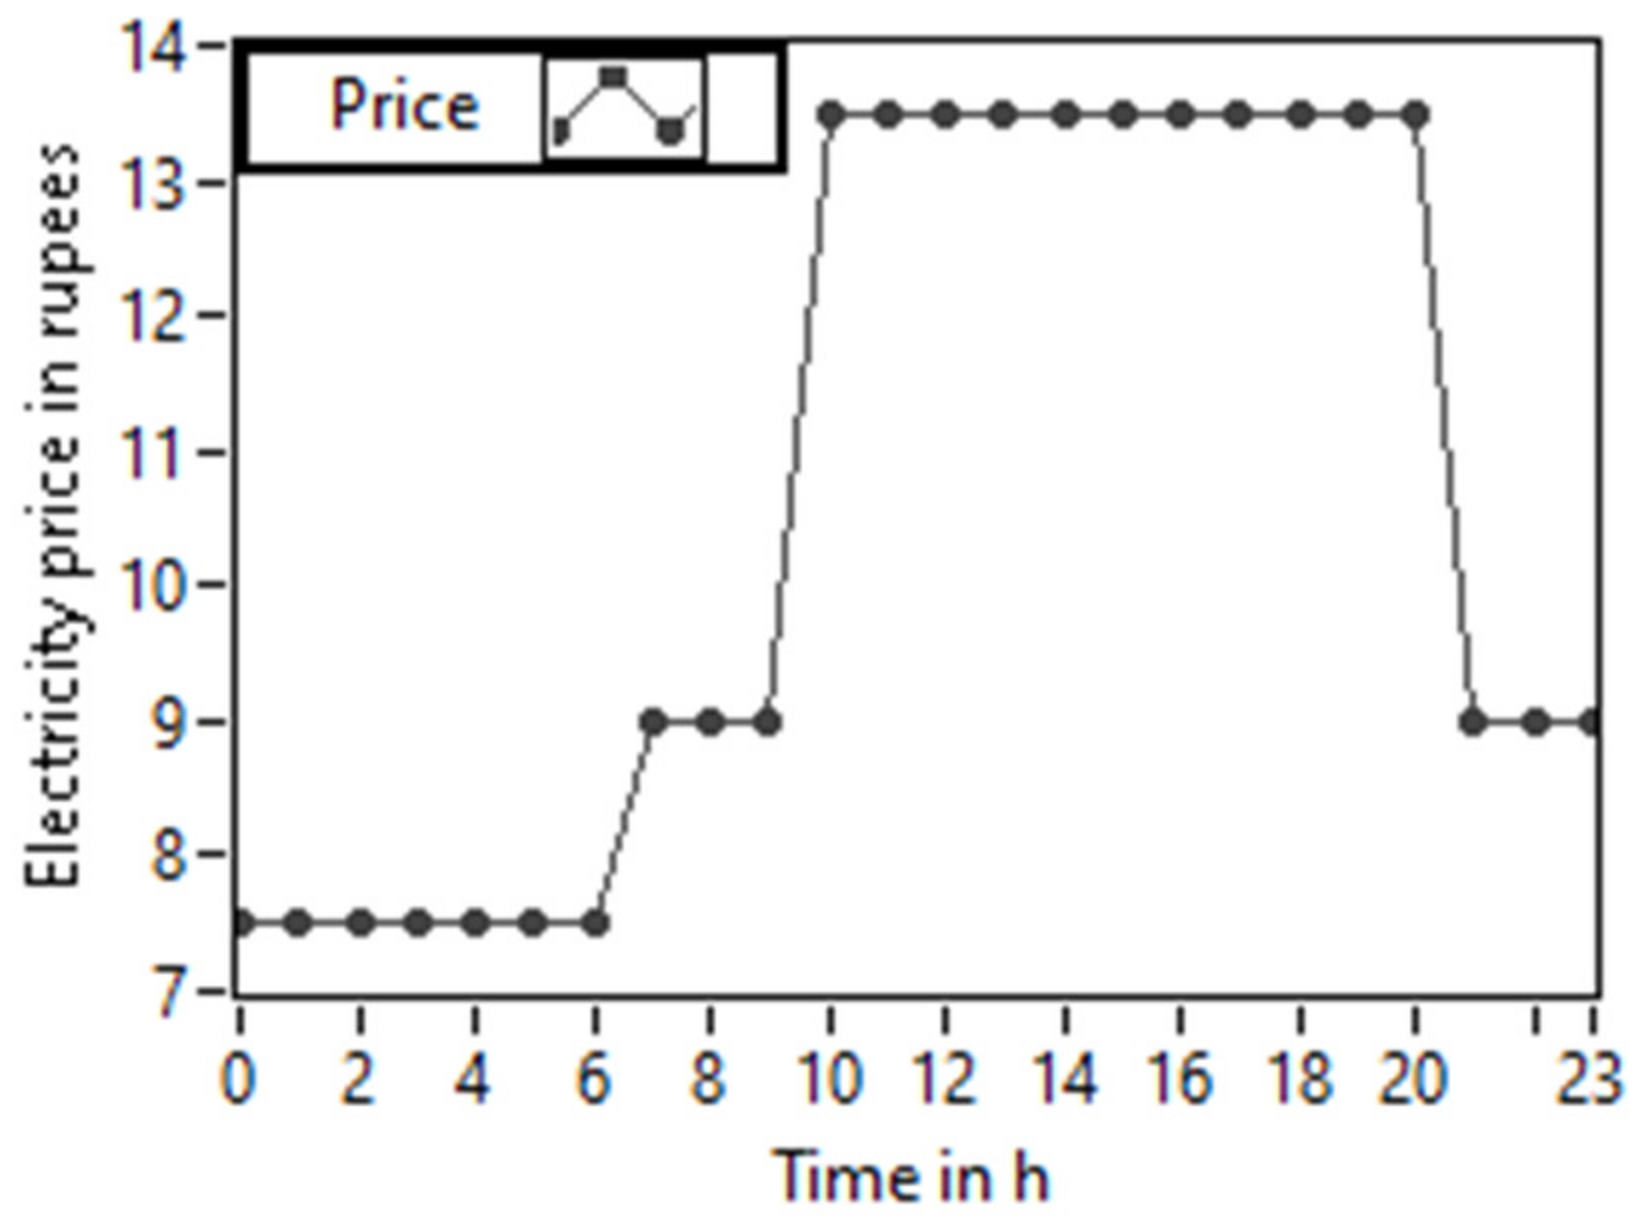
- Analyze the load profile and check whether the peak load is occurring at a high electricity price zone or not.
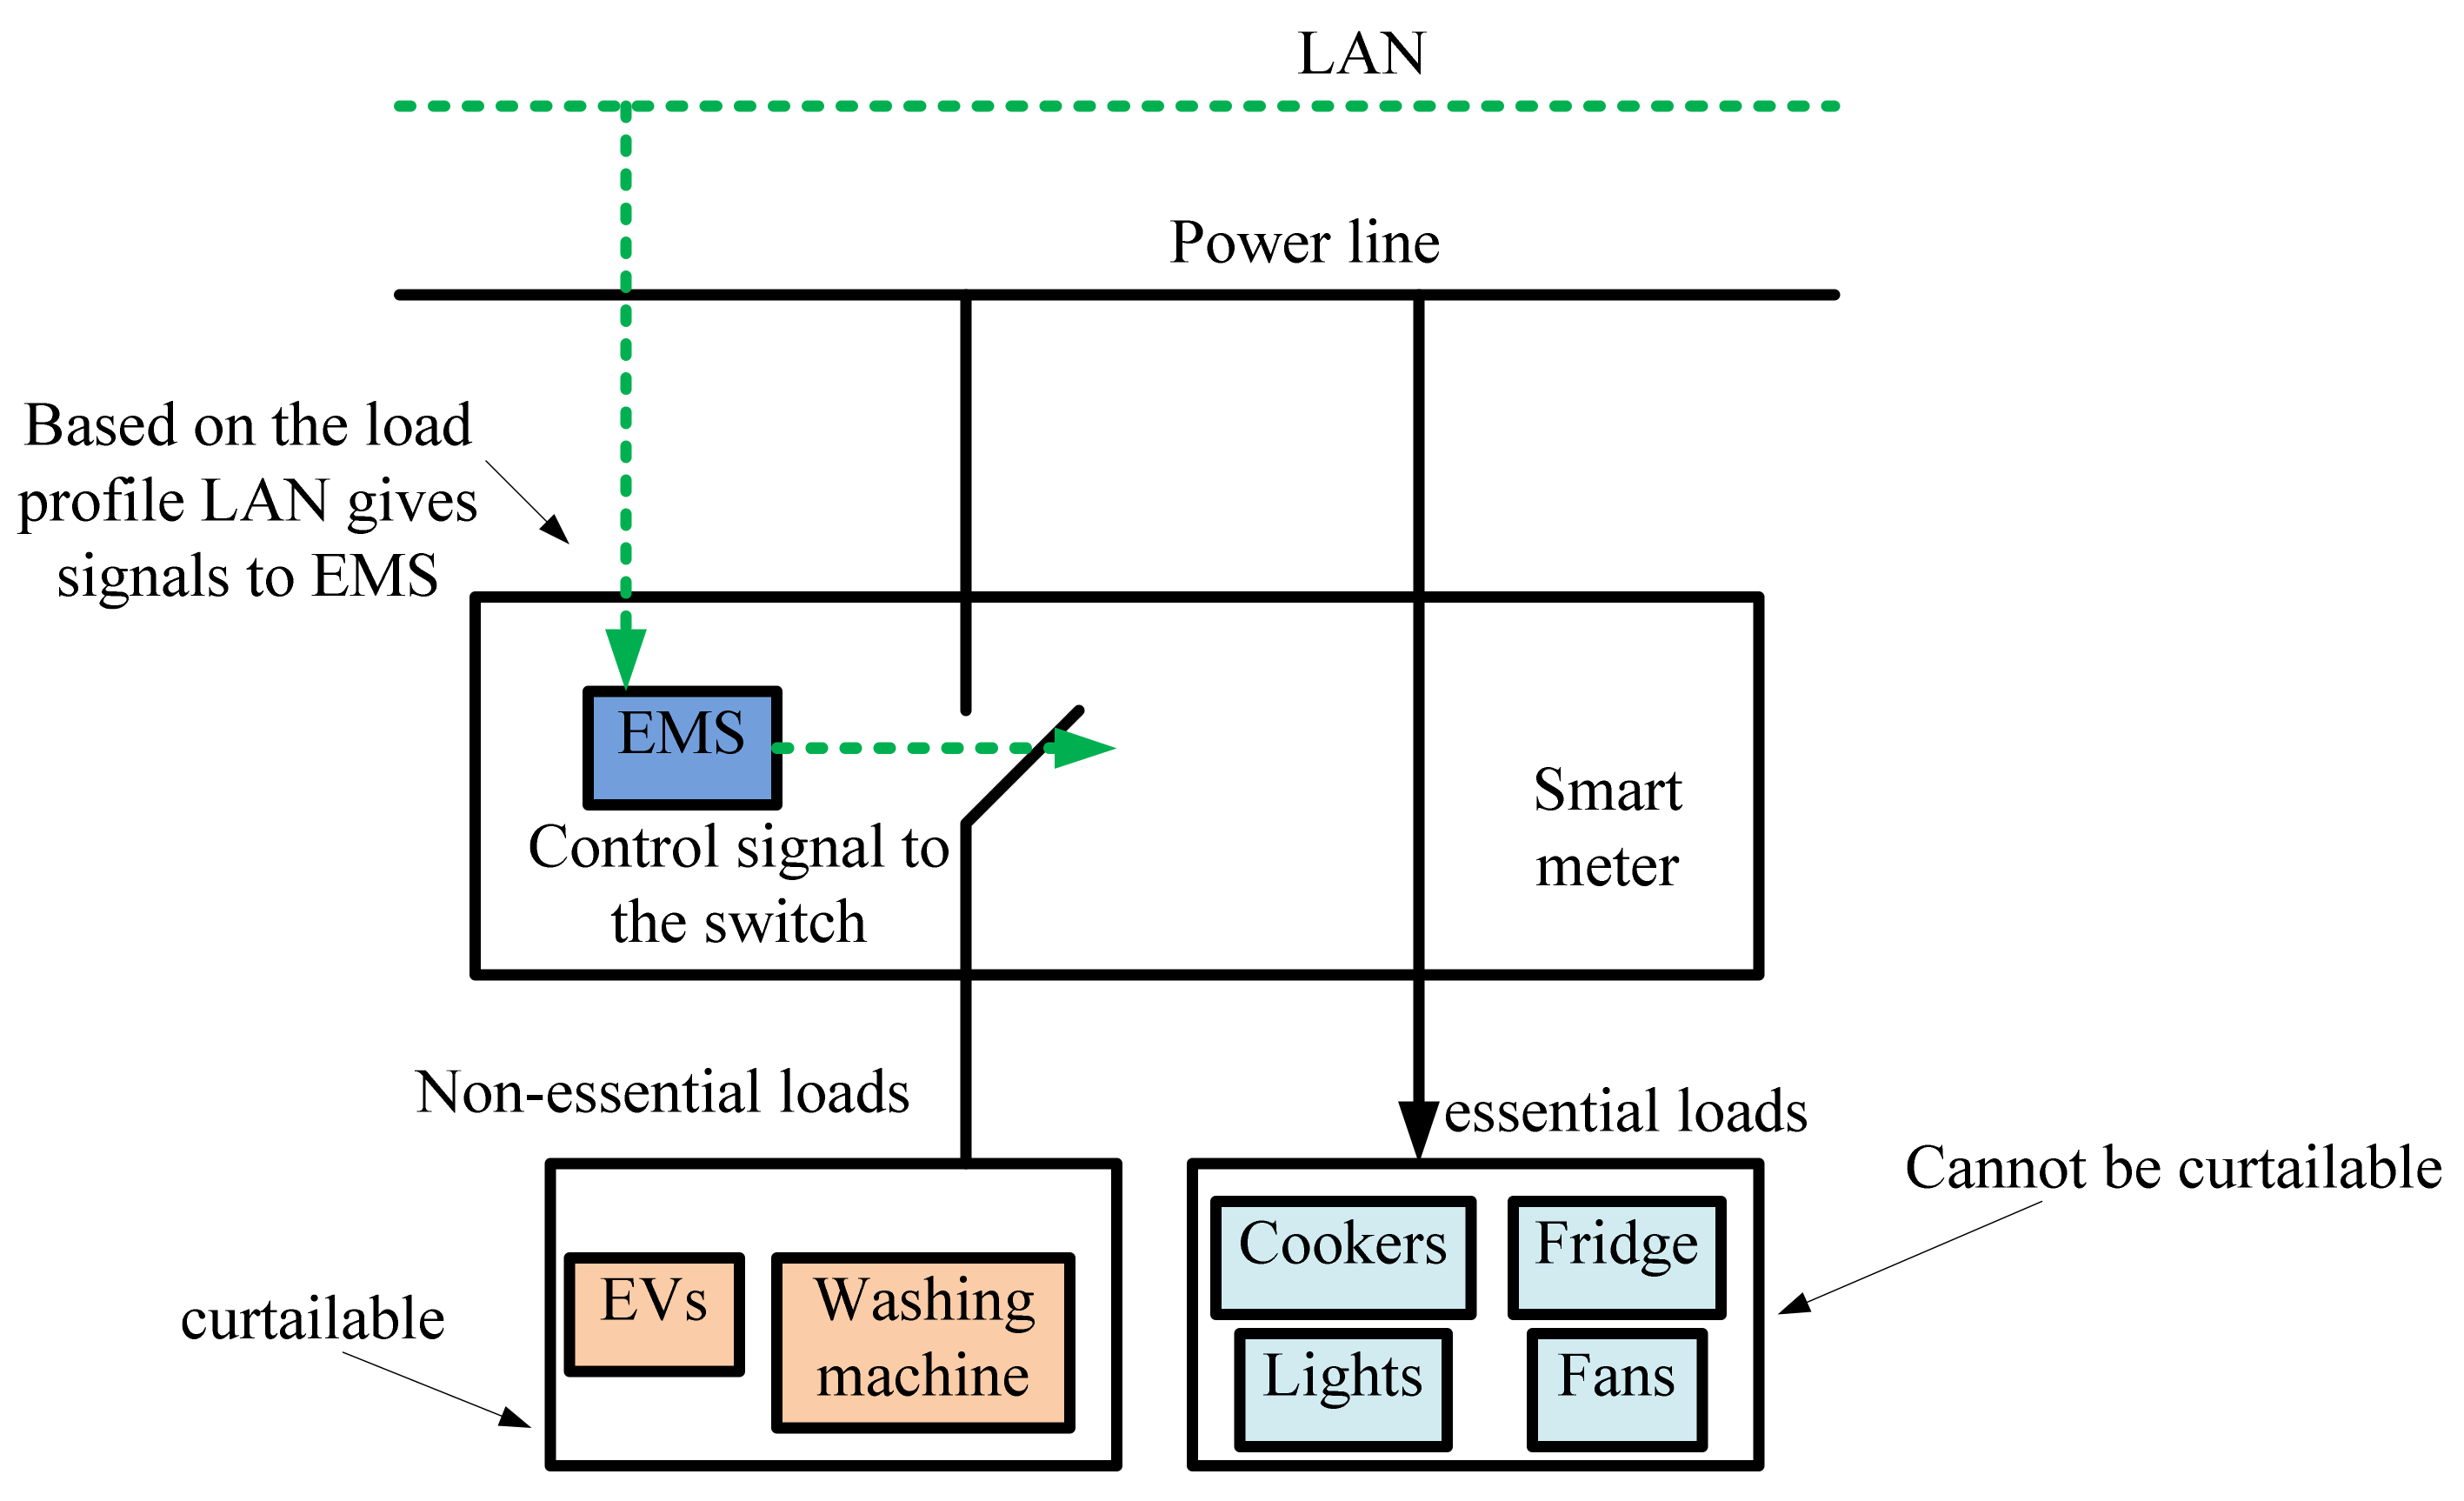
- As the total load on the system is considered as residential loads, cluster them as depicted in Equation (8), based on their priority without sacrificing the customer’s satisfaction and lifestyle.
- If yes, shift a part of non-essential loads from the peak-occurring instant to the non-peak zone. Therefore, cluster the loads on the basis of an order of priority and based on electricity price, the clustered loads are allocated or dispatched at a particular time instant where the electricity price is low. Priority is added by giving large weight to the highest priority load. If the load on the system is less than the average of the aggregated load, no need to cluster. Shift a part of the peak load to those intervals where the available load is less than the average aggregated load.
- There should be an upper limit imposed on the amount of load shift on the system to overcome the rebound effect, which is represented in Equation (12).
- If yes, shift the loads to another time horizon. If no, size the sources, i.e., the sizes of WT, PV, and diesel generators that have to be installed to supply the available load demand in the area without considering the impact of uncertainty based on the peak load demand. Moreover, a portion of generator capacity allocated for any further increment on load demand is represented in Equation (19). The total capacity of generators installed is the sum of all the DGs capacity.
- Calculate the capital cost, installation cost, and maintenance cost of each generator by using Table 8.
- , , and are the total costs including capital and installation costs of PV, WT, and diesel. , , and are the sizes of various sources yielded from the simulations.
- Dispatch or schedule the load on the available generators that are committed to supply and calculate the tariff of the consumer by using Equation (7).
- Calculate the load factor of the MG by using Equation (18). As the amount of load shift increases, the load curve becomes more uniform thereby improving the load factor.
5. Results and Discussions
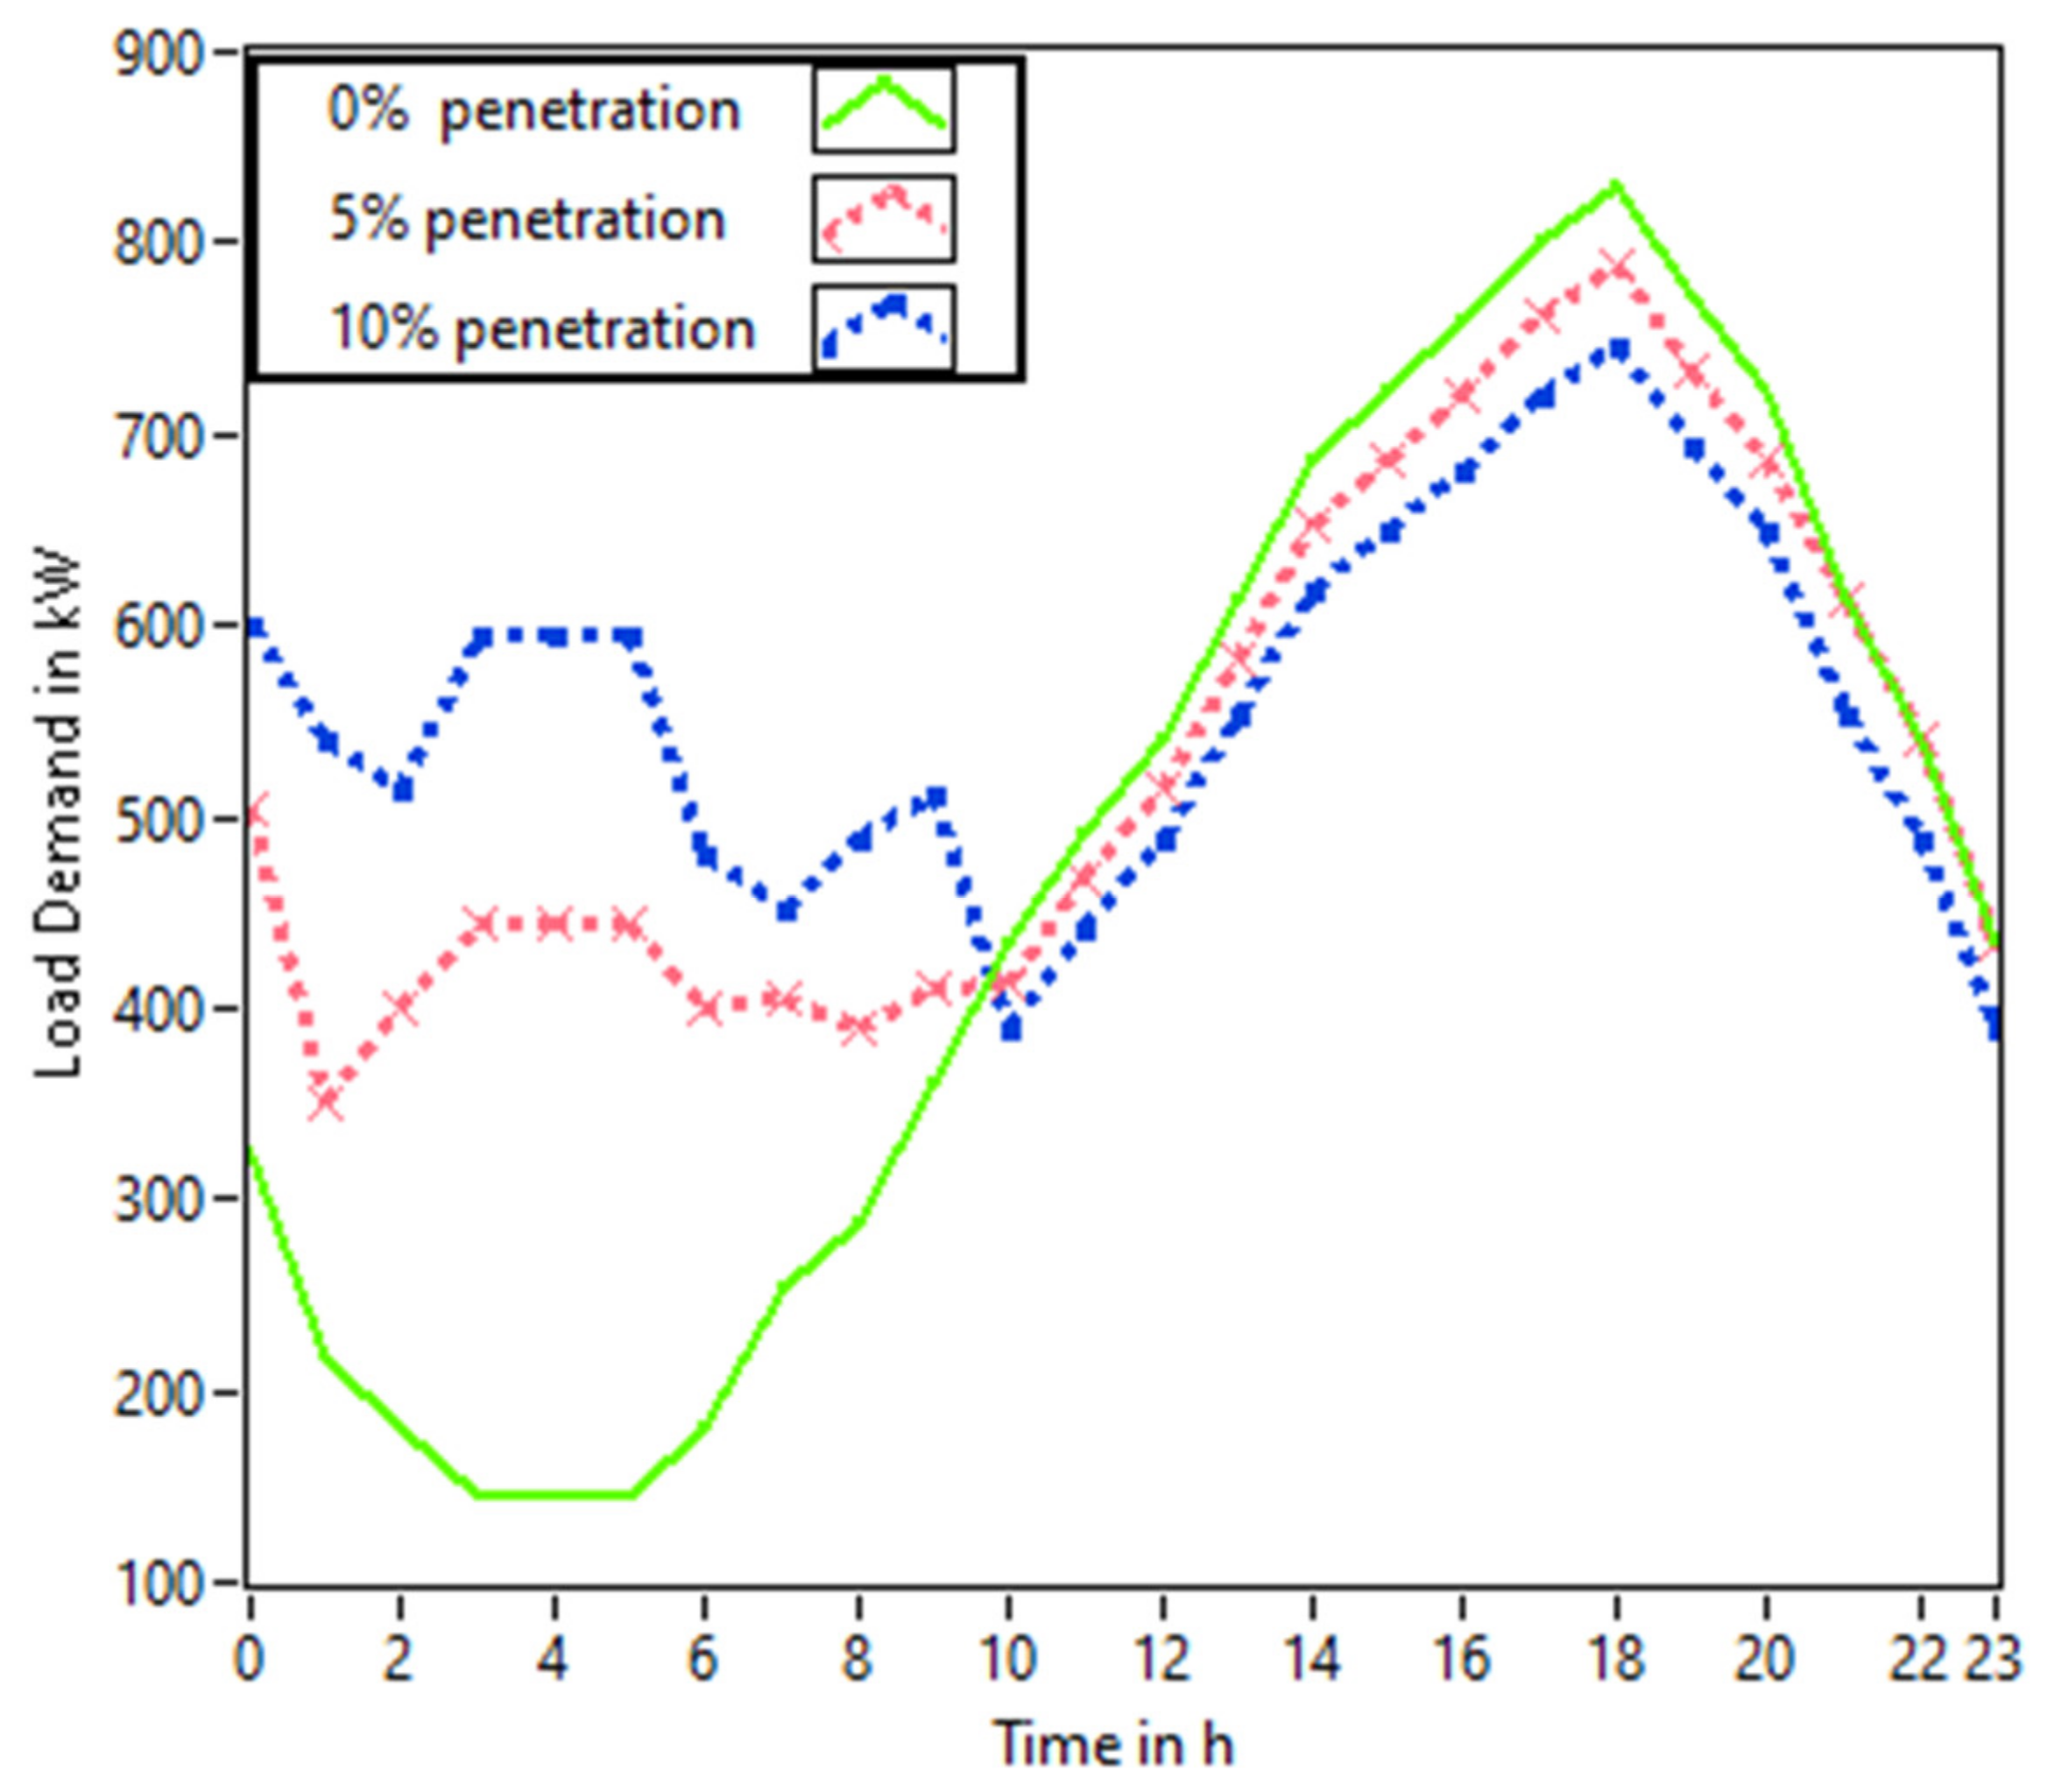
5.1. Influence of DR Strategy on Optimal Sizing of DGs
5.2. Effect of DR Strategy on Consumer Electricity Bill and on Load Factor
6. Conclusions
Author Contributions
Funding
Institutional Review Board Statement
Informed Consent Statement
Data Availability Statement
Acknowledgments
Conflicts of Interest
Abbreviations
| DR program | Demand response program | AMI | Advanced metering infrastructure |
| MG | Microgrid | DA scheduling | Day-ahead scheduling |
| TOU | Time of use pricing | HA scheduling | Hour ahead scheduling |
| RTP | Real-time pricing | RT scheduling | Real-time scheduling |
| CPP | Critical peak pricing | AI | Artificial intelligence |
| DG | Distributed generation | SOC | State of charge |
| BESS | Battery energy storage system | DLC | Direct load curtailment |
| HEMS | Home energy management system | BEMS | Building energy management system |
| RES | Renewable energy system | DNO | Distribution network operator |
| DR | Demand response | ISO | Independent system operator |
| DERs | Distributed energy resources | ICT | Information and communication technology |
| G | Grid-connected | MAS | Multi-agent system |
| I | Isolated | EMS | Energy management strategies |
| EM | Energy management | THD | Total harmonic distortion |
| ILs | Interruptible loads | IEDs | Intelligent electronic devices |
| HVAC | Heating, ventilating, and air conditioning | RL | Reinforcement learning techniques |
| GAMS | General algebraic modeling system | PSO | Particle swarm optimization |
| GWO | Grey wolf optimization | GA | Genetic algorithm |
| ACO | Ant colony optimization | BCO | Bee colony optimization |
| MBCO | Modified bee colony optimization | DISCOMS | Distribution companies |
| ANN | Artificial neural networks | LV-MG | Low voltage microgrid |
| MILP | Mixed integer linear programming | CCHP | Cold climate heat pump |
| DSMS | Demand side management system | CVAR | Conditional value at risk |
| SCA | Sine cosine algorithm | NILs | Non-interruptible loads |
| HAN | Home area network | MPPT | Maximum power point tracking |
| PV | Photovoltaic | WT | Wind turbine |
| MT | Micro turbine | FC | Fuel cell |
| AC-MG | Alternating current microgrid | DC-MG | Direct current microgrid |
| SOCP | Second order cone programming | ASFLA | Adaptive shuffled frog leaping algorithm |
| AI | Artificial intelligence | DLC | Direct load curtailment |
| SCADA | DR-BOB | Demand response blocks of buildings | |
| KKT | Karush Kuhn Tucker | SC | Super capacitor |
| DR-TRL | Demand response technology readiness level | MAS | Multi-agent system |
| NAN | Neighboring area network | FAN | Field area network |
| Wi-Fi | Wireless fidelity | SMP | System marginal price |
References
- Li, K.; Thompson, S.; Peng, J. Modelling and prediction of NOx emission in a coal-fired power generation plant. Control Eng. Pract. 2004, 12, 707–723. [Google Scholar] [CrossRef]
- Ahi, P.; Searcy, C. Assessing sustainability in the supply chain: A triple bottom line approach. Appl. Math. Model. 2015, 39, 2882–2896. [Google Scholar] [CrossRef]
- Kim, C.-Y.; Kim, C.-R.; Kim, D.-K.; Cho, S.-H. Analysis of Challenges Due to Changes in Net Load Curve in South Korea by Integrating DERs. Electronics 2020, 9, 1310. [Google Scholar] [CrossRef]
- Mellouk, L.; Ghazi, M.; Aaroud, A.; Boulmalf, M.; Benhaddou, D.; Zine-Dine, K. Design and energy management optimization for hybrid renewable energy system- case study: Laayoune region. Renew. Energy 2019, 139, 621–634. [Google Scholar] [CrossRef]
- Reddy, P.K.M.; Prakash, M. Optimal Dispatch of Energy Resources in an Isolated Micro-Grid with Battery Energy Storage System. In Proceedings of the 2020 4th International Conference on Intelligent Computing and Control Systems (ICICCS), Madurai, India, 13–15 May 2020; pp. 730–735. [Google Scholar] [CrossRef]
- Aziz, A.; Tajuddin, M.; Adzman, M.; Ramli, M.; Mekhilef, S. Energy Management and Optimization of a PV/Diesel/Battery Hybrid Energy System Using a Combined Dispatch Strategy. Sustainability 2019, 11, 683. [Google Scholar] [CrossRef] [Green Version]
- Shoeb, A.; Shafiullah, G. Renewable Energy Integrated Islanded Microgrid for Sustainable Irrigation—A Bangladesh Perspective. Energies 2018, 11, 1283. [Google Scholar] [CrossRef] [Green Version]
- Siritoglou, P.; Oriti, G.; Van Bossuyt, D. Distributed Energy-Resource Design Method to Improve Energy Security in Critical Facilities. Energies 2021, 14, 2773. [Google Scholar] [CrossRef]
- Sanjeevikumar, P.; Sarojini, R.K.; Palanisamy, K.; Sanjeevikumar, P. Large Scale Renewable Energy Integration: Issues and Solutions. Energies 2019, 12, 1996. [Google Scholar] [CrossRef] [Green Version]
- Kumar, N.; Chopra, S.; Chand, A.; Elavarasan, R.; Shafiullah, G. Hybrid Renewable Energy Microgrid for a Residential Community: A Techno-Economic and Environmental Perspective in the Context of the SDG7. Sustainability 2020, 12, 3944. [Google Scholar] [CrossRef]
- Vera, Y.E.G.; Dufo-López, R.; Bernal-Agustín, J.L. Energy Management in Microgrids with Renewable Energy Sources: A Literature Review. Appl. Sci. 2019, 9, 3854. [Google Scholar] [CrossRef] [Green Version]
- Bai, Y.; Li, J.; He, H.; Dos Santos, R.C.; Yang, Q. Optimal Design of a Hybrid Energy Storage System in a Plug-In Hybrid Electric Vehicle for Battery Lifetime Improvement. IEEE Access 2020, 8, 142148–142158. [Google Scholar] [CrossRef]
- Zsiborács, H.; Baranyai, N.H.; Vincze, A.; Zentkó, L.; Birkner, Z.; Máté, K.; Pintér, G. Intermittent Renewable Energy Sources: The Role of Energy Storage in the European Power System of 2040. Electronics 2019, 8, 729. [Google Scholar] [CrossRef] [Green Version]
- Arteconi, A.; Polonara, F. Assessing the Demand Side Management Potential and the Energy Flexibility of Heat Pumps in Buildings. Energies 2018, 11, 1846. [Google Scholar] [CrossRef] [Green Version]
- Shang, Y. Resilient Multiscale Coordination Control against Adversarial Nodes. Energies 2018, 11, 1844. [Google Scholar] [CrossRef] [Green Version]
- Amer, A.; Shaban, K.; Gaouda, A.; Massoud, A. Home Energy Management System Embedded with a Multi-Objective Demand Response Optimization Model to Benefit Customers and Operators. Energies 2021, 14, 257. [Google Scholar] [CrossRef]
- Hu, J.; Yang, G.; Ziras, C.; Kok, K. Aggregator operation in the balancing market through network-constrained transactive energy. IEEE Trans. Power Syst. 2019, 34, 4071–4080. [Google Scholar] [CrossRef] [Green Version]
- Durvasulu, V.; Hansen, T.M. Benefits of a Demand Response Exchange Participating in Existing Bulk-Power Markets. Energies 2018, 11, 3361. [Google Scholar] [CrossRef] [Green Version]
- Fan, S.; Ai, Q.; Piao, L. Hierarchical Energy Management of Microgrids including Storage and Demand Response. Energies 2018, 11, 1111. [Google Scholar] [CrossRef] [Green Version]
- Arias, L.A.; Rivas, E.; Santamaria, F.; Hernandez, V. A Review and Analysis of Trends Related to Demand Response. Energies 2018, 11, 1617. [Google Scholar] [CrossRef] [Green Version]
- Khan, A.A.; Razzaq, S.; Khan, A.; Khursheed, F.; Owais. HEMSs and enabled demand response in electricity market: An overview. Renew. Sustain. Energy Rev. 2015, 42, 773–785. [Google Scholar] [CrossRef]
- Jang, D.; Eom, J.; Park, M.J.; Rho, J.J. Variability of electricity load patterns and its effect on demand response: A critical peak pricing experiment on Korean commercial and industrial customers. Energy Policy 2016, 88, 11–26. [Google Scholar] [CrossRef]
- Hajibandeh, N.; Ehsan, M.; Soleymani, S.; Shafie-khah, M.; Catalão, J.P.S. The Mutual Impact of Demand Response Programs and Renewable Energies: A Survey. Energies 2017, 10, 1353. [Google Scholar] [CrossRef] [Green Version]
- Silva, B.N.; Khan, M.; Han, K. Futuristic Sustainable Energy Management in Smart Environments: A Review of Peak Load Shaving and Demand Response Strategies, Challenges, and Opportunities. Sustainability 2020, 12, 5561. [Google Scholar] [CrossRef]
- Salinas, S.; Li, M.; Li, P. Multi-Objective Optimal Energy Consumption Scheduling in Smart Grids. IEEE Trans. Smart Grid 2013, 4, 341–348. [Google Scholar] [CrossRef]
- Adika, C.O.; Wang, L. Autonomous Appliance Scheduling for Household Energy Management. IEEE Trans. Smart Grid 2014, 5, 673–682. [Google Scholar] [CrossRef]
- Vázquez-Canteli, J.R.; Nagy, Z. Reinforcement learning for demand response: A review of algorithms and modeling techniques. Appl. Energy 2019, 235, 1072–1089. [Google Scholar] [CrossRef]
- Mandal, R.; Chatterjee, K. Frequency control and sensitivity analysis of an isolated microgrid incorporating fuel cell and diverse distributed energy sources. Int. J. Hydrog. Energy 2020, 45, 13009–13024. [Google Scholar] [CrossRef]
- Golpîra, H. Bulk power system frequency stability assessment in presence of microgrids. Electr. Power Syst. Res. 2019, 174, 105863. [Google Scholar] [CrossRef]
- Sanjeev, P.; Padhy, N.P.; Agarwal, P. Peak Energy Management Using Renewable Integrated DC Microgrid. IEEE Trans. Smart Grid 2017, 9, 4906–4917. [Google Scholar] [CrossRef]
- Ahmed, E.M.; Rathinam, R.; Dayalan, S.; Fernandez, G.S.; Ali, Z.M.; Aleem, S.H.E.A.; Omar, A.I. A Comprehensive Analysis of Demand Response Pricing Strategies in a Smart Grid Environment Using Particle Swarm Optimization and the Strawberry Optimization Algorithm. Mathematics 2021, 9, 2338. [Google Scholar] [CrossRef]
- Sundt, S.; Rehdanz, K.; Meyerhoff, J. Consumers’ Willingness to Accept Time-of-Use Tariffs for Shifting Electricity Demand. Energies 2020, 13, 1895. [Google Scholar] [CrossRef]
- Song, H.Y.; Lee, G.S.; Yoon, Y.T. Optimal Operation of Critical Peak Pricing for an Energy Retailer Considering Balancing Costs. Energies 2019, 12, 4658. [Google Scholar] [CrossRef] [Green Version]
- Ma, T.; Wu, J.; Hao, L.; Yan, H.; Li, D. A Real-Time Pricing Scheme for Energy Management in Integrated Energy Systems: A Stackelberg Game Approach. Energies 2018, 11, 2858. [Google Scholar] [CrossRef] [Green Version]
- Jadhav, A.M.; Patne, N.R.; Guerrero, J.M. A Novel Approach to Neighborhood Fair Energy Trading in a Distribution Network of Multiple Microgrid Clusters. IEEE Trans. Ind. Electron. 2019, 66, 1520–1531. [Google Scholar] [CrossRef] [Green Version]
- Gazafroudi, A.S.S.; Prieto, J.; Corchado, J.M. Virtual Organization Structure for Agent-Based Local Electricity Trading. Energies 2019, 12, 1521. [Google Scholar] [CrossRef] [Green Version]
- Sheikhahmadi, P.; Mafakheri, R.; Bahramara, S.; Damavandi, M.Y.; Catalão, J.P.S. Risk-Based Two-Stage Stochastic Optimization Problem of Micro-Grid Operation with Renewables and Incentive-Based Demand Response Programs. Energies 2018, 11, 610. [Google Scholar] [CrossRef] [Green Version]
- Grisales-Noreña, L.F.; Montoya, D.G.; Ramos-Paja, C.A. Optimal Sizing and Location of Distributed Generators Based on PBIL and PSO Techniques. Energies 2018, 11, 1018. [Google Scholar] [CrossRef] [Green Version]
- El-Salam, M.F.A.; Beshr, E.; Eteiba, M.B. A New Hybrid Technique for Minimizing Power Losses in a Distribution System by Optimal Sizing and Siting of Distributed Generators with Network Reconfiguration. Energies 2018, 11, 3351. [Google Scholar] [CrossRef] [Green Version]
- Zhu, W.; Guo, J.; Zhao, G.; Zeng, B. Optimal Sizing of an Island Hybrid Microgrid Based on Improved Multi-Objective Grey Wolf Optimizer. Processes 2020, 8, 1581. [Google Scholar] [CrossRef]
- Jalili, A.; Taheri, B. Optimal Sizing and Sitting of Distributed Generations in Power Distribution Networks Using Firefly Algorithm. Technol. Econ. Smart Grids Sustain. Energy 2020, 5, 1–14. [Google Scholar] [CrossRef] [Green Version]
- Montoya, O.D.; Molina-Cabrera, A.; Chamorro, H.R.; Alvarado-Barrios, L.; Rivas-Trujillo, E. A Hybrid Approach Based on SOCP and the Discrete Version of the SCA for Optimal Placement and Sizing DGs in AC Distribution Networks. Electronics 2020, 10, 26. [Google Scholar] [CrossRef]
- Karunarathne, E.; Pasupuleti, J.; Ekanayake, J.; Almeida, D. Optimal Placement and Sizing of DGs in Distribution Networks Using MLPSO Algorithm. Energies 2020, 13, 6185. [Google Scholar] [CrossRef]
- Madahi, S.K.; Sarić, A. Multi-Criteria Optimal Sizing and Allocation of Renewable and Non-Renewable Distributed Generation Resources at 63 kV/20 kV Substations. Energies 2020, 13, 5364. [Google Scholar] [CrossRef]
- Onlam, A.; Yodphet, D.; Chatthaworn, R.; Surawanitkun, C.; Siritaratiwat, A.; Khunkitti, P. Power Loss Minimization and Voltage Stability Improvement in Electrical Distribution System via Network Reconfiguration and Distributed Generation Placement Using Novel Adaptive Shuffled Frogs Leaping Algorithm. Energies 2019, 12, 553. [Google Scholar] [CrossRef] [Green Version]
- Yuan, R.; Li, T.; Deng, X.; Ye, J. Optimal Day-Ahead Scheduling of a Smart Distribution Grid Considering Reactive Power Capability of Distributed Generation. Energies 2016, 9, 311. [Google Scholar] [CrossRef] [Green Version]
- Galván, L.; Navarro, J.M.; Galván, E.; Carrasco, J.M.; Alcántara, A. Optimal Scheduling of Energy Storage Using a New Priority-Based Smart Grid Control Method. Energies 2019, 12, 579. [Google Scholar] [CrossRef] [Green Version]
- Li, J.; Tan, Z.; Ren, Z.; Yang, J.; Yu, X. A Two-Stage Optimal Scheduling Model of Microgrid Based on Chance-Constrained Programming in Spot Markets. Processes 2020, 8, 107. [Google Scholar] [CrossRef] [Green Version]
- Wang, J.; Li, K.-J.; Javid, Z.; Sun, Y. Distributed Optimal Coordinated Operation for Distribution System with the Integration of Residential Microgrids. Appl. Sci. 2019, 9, 2136. [Google Scholar] [CrossRef] [Green Version]
- Lu, C.; Xu, H.; Pan, X.; Song, J. Optimal Sizing and Control of Battery Energy Storage System for Peak Load Shaving. Energies 2014, 7, 8396–8410. [Google Scholar] [CrossRef] [Green Version]
- Zhou, N.; Liu, N.; Zhang, J.; Lei, J. Multi-Objective Optimal Sizing for Battery Storage of PV-Based Microgrid with Demand Response. Energies 2016, 9, 591. [Google Scholar] [CrossRef]
- Carpinelli, G.; Di Fazio, A.R.; Khormali, S.; Mottola, F. Optimal Sizing of Battery Storage Systems for Industrial Applications when Uncertainties Exist. Energies 2014, 7, 130–149. [Google Scholar] [CrossRef]
- HassanzadehFard, H.; Jalilian, A. Optimal sizing and location of renewable energy based DG units in distribution systems considering load growth. Int. J. Electr. Power Energy Syst. 2018, 101, 356–370. [Google Scholar] [CrossRef]
- Sharma, S.; Bhattacharjee, S.; Bhattacharya, A. Operation cost minimization of a micro-grid using quasi-oppositional swine influenza model-based optimization with quarantine. Ain Shams Eng. J. 2018, 9, 45–63. [Google Scholar] [CrossRef] [Green Version]
- Moghaddam, A.A.; Seifi, A.; Niknam, T.; Pahlavani, M.R.A. Multi-objective operation management of a renewable MG (micro-grid) with back-up micro-turbine/fuel cell/battery hybrid power source. Energy 2011, 36, 6490–6507. [Google Scholar] [CrossRef]
- Ghaffarzadeh, N.; Zolfaghari, M.; Ardakani, F.J.; Jahanbani, A. Optimal sizing of Energy Storage System in a MG using the Mixed Integer Linear programming. Int. J. Renew. Energy Res. 2017, 7, 2004–2016. [Google Scholar]
- Sharma, S.; Bhattacharjee, S.; Bhattacharya, A. Grey wolf optimisation for optimal sizing of battery energy storage device to minimise operation cost of MG. IET Gener. Transm. Distrib. 2016, 10, 625–637. [Google Scholar] [CrossRef]
- Qiu, J.; Meng, K.; Zheng, Y.; Dong, Z.Y. Optimal scheduling of distributed energy resources as a virtual power plant in a transactive energy framework. IET Gener. Transm. Distrib. 2017, 12, 17–27. [Google Scholar] [CrossRef]
- Silva, C.; Faria, P.; Vale, Z. Rating the Participation in Demand Response Programs for a More Accurate Aggregated Schedule of Consumers after Enrolment Period. Electronics 2020, 9, 349. [Google Scholar] [CrossRef] [Green Version]
- Wang, N.; Xu, W.; Xu, Z.; Shao, W. Peer-to-Peer Energy Trading among Microgrids with Multidimensional Willingness. Energies 2018, 11, 3312. [Google Scholar] [CrossRef] [Green Version]
- Carpinelli, G.; Caramia, P.; Mottola, F.; Proto, D. Exponential weighted method and a compromise programming method for multi-objective operation of plug-in vehicle aggregators in microgrids. Int. J. Electr. Power Energy Syst. 2014, 56, 374–384. [Google Scholar] [CrossRef]
- Gu, W.; Lu, S.; Wu, Z.; Zhang, X.; Zhou, J.; Zhao, B.; Wang, J. Residential CCHP microgrid with load aggregator: Operation mode, pricing strategy, and optimal dispatch. Appl. Energy 2017, 205, 173–186. [Google Scholar] [CrossRef]
- Aluisio, B.; Conserva, A.; Dicorato, M.; Forte, G.; Trovato, M. Optimal operation planning of V2G-equipped Microgrid in the presence of EV aggregator. Electr. Power Syst. Res. 2017, 152, 295–305. [Google Scholar] [CrossRef]
- Nguyen, D.T.; Le, L.B. Risk-Constrained Profit Maximization for Microgrid Aggregators with Demand Response. IEEE Trans. Smart Grid 2015, 6, 135–146. [Google Scholar] [CrossRef]
- Goroohi, I.; Sardou; Khodayar, M.E.; Ameli, M.T. Coordinated Operation of Natural Gas and Electricity Networks with Microgrid Aggregators. IEEE Trans. Smart Grid 2018, 9, 199–210. [Google Scholar] [CrossRef]
- Pei, W.; Du, Y.; Deng, W.; Sheng, K.; Xiao, H.; Qu, H. Optimal Bidding Strategy and Intramarket Mechanism of Microgrid Aggregator in Real-Time Balancing Market. IEEE Trans. Ind. Inform. 2016, 12, 587–596. [Google Scholar] [CrossRef]
- Essiet, I.O.; Sun, Y. Maximizing Demand Response Aggregator Compensation through Optimal RES Utilization: Aggregation in Johannesburg, South Africa. Appl. Sci. 2020, 10, 594. [Google Scholar] [CrossRef] [Green Version]
- Gazijahani, F.S.; Salehi, J. Game Theory Based Profit Maximization Model for Microgrid Aggregators with Presence of EDRP Using Information Gap Decision Theory. IEEE Syst. J. 2019, 13, 1767–1775. [Google Scholar] [CrossRef]
- Zhu, X.; Xia, M.; Chiang, H. Coordinated sectional droop charging control for EV aggregator enhancing frequency stability of microgrid with high penetration of renewable energy sources. Appl. Energy 2018, 210, 936–943. [Google Scholar] [CrossRef]
- Olivella-Rosell, P.; Lloret-Gallego, P.; Munné-Collado, Í.; Villafafila-Robles, R.; Sumper, A.; Ottessen, S.Ø.; Rajasekharan, J.; Bremdal, B.A. Local Flexibility Market Design for Aggregators Providing Multiple Flexibility Services at Distribution Network Level. Energies 2018, 11, 822. [Google Scholar] [CrossRef] [Green Version]
- Song, Z.; Shi, J.; Li, S.; Chen, Z.; Yang, W.; Zhang, Z. Day Ahead Bidding of a Load Aggregator Considering Residential Consumers Demand Response Uncertainty Modeling. Appl. Sci. 2020, 10, 7310. [Google Scholar] [CrossRef]
- Chen, S.; Chen, Q.; Xu, Y. Strategic Bidding and Compensation Mechanism for a Load Aggregator with Direct Thermostat Control Capabilities. IEEE Trans. Smart Grid 2018, 9, 2327–2336. [Google Scholar] [CrossRef]
- Sisinni, M.; Noris, F.; Smit, S.; Messervey, T.B.; Crosbie, T.; Breukers, S.; Van Summeren, L. Identification of Value Proposition and Development of Innovative Business Models for Demand Response Products and Services Enabled by the DR-BOB Solution. Buildings 2017, 7, 93. [Google Scholar] [CrossRef] [Green Version]
- Karfopoulos, E.; Tena, L.; Torres, A.; Salas, P.; Jorda, J.G.; Dimeas, A.; Hatziargyriou, N. A multi-agent system providing demand response services from residential consumers. Electr. Power Syst. Res. 2015, 120, 163–176. [Google Scholar] [CrossRef]
- UNEP. Buildings and Climate Change, Summary for Decision-Makers. 2009. Available online: https://www.uncclearn.org/wp-content/uploads/library/unep207.pdf (accessed on 17 December 2021).
- Liu, Y.; Yang, X.; Wen, W.; Xia, M. Smarter Grid in the 5G Era: A Framework Integrating Power Internet of Things with a Cyber Physical System. Front. Commun. Netw. 2021, 2, 9590. [Google Scholar] [CrossRef]
- Jour, D.; Zhang, Y.; Qitong, Z.W. Application Status and Prospects of 5G Technology in Distribution Automation Systems. Wirel. Commun. Mob. Comput. 2021, 2021, 5553159. [Google Scholar] [CrossRef]
- Kampelis, N.; Tsekeri, E.; Kolokotsa, D.; Kalaitzakis, K.; Isidori, D.; Cristalli, C. Development of Demand Response Energy Management Optimization at Building and District Levels Using Genetic Algorithm and Artificial Neural Network Modelling Power Predictions. Energies 2018, 11, 3012. [Google Scholar] [CrossRef] [Green Version]
- Crosbie, T.; Broderick, J.; Short, M.; Charlesworth, R.; Dawood, M. Demand Response Technology Readiness Levels for Energy Management in Blocks of Buildings. Buildings 2018, 8, 13. [Google Scholar] [CrossRef] [Green Version]
- Hui, H.; Ding, Y.; Shi, Q.; Li, F.; Song, Y.; Yan, J. 5G network-based Internet of Things for demand response in smart grid: A survey on application potential. Appl. Energy 2020, 257, 113972. [Google Scholar] [CrossRef]
- Cruz, C.; Palomar, E.; Bravo, I.; Gardel, A. Cooperative Demand Response Framework for a Smart Community Targeting Renewables: Testbed Implementation and Performance Evaluation. Energies 2020, 13, 2910. [Google Scholar] [CrossRef]
- Shakeri, M.; Pasupuleti, J.; Amin, N.; Rokonuzzaman; Low, F.W.; Yaw, C.T.; Asim, N.; Samsudin, N.A.; Tiong, S.K.; Hen, C.K.; et al. An Overview of the Building Energy Management System Considering the Demand Response Programs, Smart Strategies and Smart Grid. Energies 2020, 13, 3299. [Google Scholar] [CrossRef]
- Basu, K.; Hawarah, L.; Arghira, N.; Joumaa, H.; Ploix, S. A prediction system for home appliance usage. Energy Build. 2013, 67, 668–679. [Google Scholar] [CrossRef]
- Bera, S.; Gupta, P.; Misra, S. D2S: Dynamic Demand Scheduling in Smart Grid Using Optimal Portfolio Selection Strategy. IEEE Trans. Smart Grid 2015, 6, 1434–1442. [Google Scholar] [CrossRef]
- Ko, H.; Praca, I. Design of a Secure Energy Trading Model Based on a Blockchain. Sustainability 2021, 13, 1634. [Google Scholar] [CrossRef]
- Mohammad, N.; Mishra, Y. The Role of Demand Response Aggregators and the Effect of GenCos Strategic Bidding on the Flexibility of Demand. Energies 2018, 11, 3296. [Google Scholar] [CrossRef] [Green Version]
- Yoo, Y.-S.; Jeon, S.H.; Newaz, S.H.S.; Lee, I.-W.; Choi, J.K. Energy Trading among Power Grid and Renewable Energy Sources: A Dynamic Pricing and Demand Scheme for Profit Maximization. Sensors 2021, 21, 5819. [Google Scholar] [CrossRef]
- Ko, W.; Vettikalladi, H.; Song, S.-H.; Choi, H.-J. Implementation of a Demand-Side Management Solution for South Korea’s Demand Response Program. Appl. Sci. 2020, 10, 1751. [Google Scholar] [CrossRef] [Green Version]
- Wang, B.; Liu, X.; Zhu, F.; Hu, X.; Ji, W.; Yang, S.; Wang, K.; Feng, S. Unit Commitment Model Considering Flexible Scheduling of Demand Response for High Wind Integration. Energies 2015, 8, 13688–13709. [Google Scholar] [CrossRef] [Green Version]
- Chae, J.; Joo, S.-K. Demand Response Resource Allocation Method Using Mean-Variance Portfolio Theory for Load Aggregators in the Korean Demand Response Market. Energies 2017, 10, 879. [Google Scholar] [CrossRef]
- Faria, P.; Spínola, J.; Vale, Z. Distributed Energy Resources Scheduling and Aggregation in the Context of Demand Response Programs. Energies 2018, 11, 1987. [Google Scholar] [CrossRef] [Green Version]
- Faria, P.; Spínola, J.; Vale, Z. Reschedule of Distributed Energy Resources by an Aggregator for Market Participation. Energies 2018, 11, 713. [Google Scholar] [CrossRef] [Green Version]
- Faria, P.; Vale, Z. A Demand Response Approach to Scheduling Constrained Load Shifting. Energies 2019, 12, 1752. [Google Scholar] [CrossRef] [Green Version]
- Haghifam, S.; Dadashi, M.; Zare, K.; Seyedi, H. Optimal operation of smart distribution networks in the presence of demand response aggregators and microgrid owners: A multi follower Bi-Level approach. Sustain. Cities Soc. 2020, 55, 102033. [Google Scholar] [CrossRef]
- Huq, M.Z.; Islam, S. Home Area Network technology assessment for demand response in smart grid environment. In Proceedings of the 2010 20th Australasian Universities Power Engineering Conference, Christchurch, New Zealand, 5–6 December 2010; pp. 1–6. [Google Scholar]
- Samadi, P.; Mohsenian-Rad, H.; Wong, V.W.S.; Schober, R. Tackling the Load Uncertainty Challenges for Energy Consumption Scheduling in Smart Grid. IEEE Trans. Smart Grid 2013, 4, 1007–1016. [Google Scholar] [CrossRef] [Green Version]
- Liu, X.; Gao, B.; Li, Y. Bayesian Game-Theoretic Bidding Optimization for Aggregators Considering the Breach of Demand Response Resource. Appl. Sci. 2019, 9, 576. [Google Scholar] [CrossRef] [Green Version]
- Posma, J.; Lampropoulos, I.; Schram, W.; Van Sark, W. Provision of Ancillary Services from an Aggregated Portfolio of Residential Heat Pumps on the Dutch Frequency Containment Reserve Market. Appl. Sci. 2019, 9, 590. [Google Scholar] [CrossRef] [Green Version]
- Ponds, K.T.; Arefi, A.; Sayigh, A.; Ledwich, G. Aggregator of Demand Response for Renewable Integration and Customer Engagement: Strengths, Weaknesses, Opportunities, and Threats. Energies 2018, 11, 2391. [Google Scholar] [CrossRef] [Green Version]
- Shang, Y. A combinatorial necessary and sufficient condition for cluster consensus. Neurocomputing 2016, 216, 611–616. [Google Scholar] [CrossRef]
- Alvarez, M.A.Z.; Agbossou, K.; Cardenas, A.; Kelouwani, S.; Boulon, L. Demand Response Strategy Applied to Residential Electric Water Heaters Using Dynamic Programming and K-Means Clustering. IEEE Trans. Sustain. Energy 2019, 11, 524–533. [Google Scholar] [CrossRef]
- Mancini, F.; Romano, S.; Lo Basso, G.; Cimaglia, J.; de Santoli, L. How the Italian Residential Sector Could Contribute to Load Flexibility in Demand Response Activities: A Methodology for Residential Clustering and Developing a Flexibility Strategy. Energies 2020, 13, 3359. [Google Scholar] [CrossRef]
- Chicco, G.; Ionel, O.; Porumb, R. Electrical Load Pattern Grouping Based on Centroid Model with Ant Colony Clustering. IEEE Trans. Power Syst. 2013, 28, 1706–1715. [Google Scholar] [CrossRef]
- Fu-Lin, M.; Hong-yang, L. Power load classification based on spectral clustering of dual-scale. In Proceedings of the 2014 IEEE International Conference on Control Science and Systems Engineering, Yantai, China, 29–30 December 2014; pp. 162–166. [Google Scholar] [CrossRef]
- Alonso, A.M.; Nogales, F.J.; Ruiz, C. Hierarchical Clustering for Smart Meter Electricity Loads Based on Quantile Autocovariances. IEEE Trans. Smart Grid 2020, 11, 4522–4530. [Google Scholar] [CrossRef]
- Binh, P.T.T.; Ha, N.H.; Tuan, T.C.; Khoa, L.D. Determination of representative load curve based on Fuzzy K-Means. In Proceedings of the 2010 4th International Power Engineering and Optimization Conference (PEOCO), Shah Alam, Malaysia, 23–24 June 2010; pp. 281–286. [Google Scholar] [CrossRef]
- Pereira, R.; Fagundes, A.; Melício, R.; Mendes, V.M.F.; Figueiredo, J.; Martins, J.; Quadrado, J.C. A fuzzy clustering approach to a demand response model. Int. J. Electr. Power Energy Syst. 2016, 81, 184–192. [Google Scholar] [CrossRef]
- Schwarz, P.; Mohajeryami, S.; Cecchi, V. Building a Better Baseline for Residential Demand Response Programs: Mitigating the Effects of Customer Heterogeneity and Random Variations. Electronics 2020, 9, 570. [Google Scholar] [CrossRef] [Green Version]
- Agnetis, A.; de Pascale, G.; Detti, P.; Vicino, A. Load Scheduling for Household Energy Consumption Optimization. IEEE Trans. Smart Grid 2013, 4, 2364–2373. [Google Scholar] [CrossRef]
- Siano, P. Demand response and smart grids—A survey. Renew. Sustain. Energy Rev. 2014, 30, 461–478. [Google Scholar] [CrossRef]


| S.No. | Parameter | Time of Use (TOU) Tariff [32] | Critical Peak Pricing (CPP) Tariff [33] | Real Time Pricing (RTP) [34] |
|---|---|---|---|---|
| 1 | Volatility in prices | Fixed prices during the same season. | High price during the event. | Dynamic prices. |
| 2 | Complexity | Easy to use. | Moderate and event-driven to ensure reliability. Imposed by the utility. | Complex and it needs a robust hardware setup. |
| 3 | Operation | There is no curtailment of load demand. Only shifting in time horizon takes place. | Either curtailment or shifting of load takes place. | Shifting of loads is difficult since consumers may not be able to see their incentives. |
| 4 | Frequency of imposition | Imposed on daily basis. | Not imposed on daily basis. | Imposed on hourly or minutes or seconds basis. |
| 5 | Efficiency | Highly efficient in reducing the energy cost and carbon emissions. | Less efficient in reducing the energy cost and carbon emissions. | Moderate efficient in reducing the energy cost. |
| Ref No. | Size of Distribution Network | Isolated (I) or Grid Connected (G) | Approach | Objective Function | Remarks |
|---|---|---|---|---|---|
| [35] | 33 bus and 69 bus radial networks | * | Population-based incremental learning method | To minimize the power losses, improve voltage profile | Optimal power flow analysis has been done for yielding power losses and voltage profiles. |
| [36] | 33-bus, 69-bus, and 78-bus radial networks | * | Hybridized meta-heuristic method | To optimize the active and reactive power losses | Hybridized gray wolf optimization (GWO) and particle swarm optimization (PSO) algorithms. The load power is considered as 3.715 MW and reactive power as 2.3 MVAR. |
| [37] | * | I | Improved multi-objective grey wolf optimization (IGWO) | To optimize the annualized cost of the system and deficiency of power supply probability | EM system is used to achieve the requirement. |
| [38] | IEEE 33 and 69 bus | G | Firefly algorithm | To minimize the power losses | Applied firefly algorithm for optimal sizing and siting the DGs in a radial network. |
| [39] | IEEE 33 and 69 bus | G | Sine cosine algorithm (SCA) + second-order cone programming (SOCP) | To minimize the real power losses | Effective placement and sizing of DGs. Placement by using sine cosine algorithm and sizing by using the second-order cone programming. |
| [40] | IEEE 33 bus | G | Multi-leader PSO | Active power loss reduction | To optimally site and size DGs. |
| [41] | IEEE 115 bus | G | Genetic algorithm (GA) has been used | Power loss reduction, improved voltage level, and short circuit level | Proper selection and placement of DGs certainly improve the EM system. |
| [42] | IEEE 33 and 69 bus | * | Adaptive shuffled frog leaping algorithm (ASFLA) | Power loss minimization and voltage stability index improvement | Novel adaptive technique is used for solving the problem. The performance of the algorithm is compared with the firefly, cuckoo search, and shuffled frog leaping algorithm. Results suggest that ASFLA outperforms other algorithms. |
| [43] | 33-bus radial distribution network | * | Modified differential evolution algorithm | To minimize DA composite economic cost, i.e., operation, economic, and transmission loss cost | The problem is modeled as a non-linear problem and scheduling has been done to optimize the fuel cost. |
| [44] | Loads, PV, and BESS | * | Time decision algorithm | To optimize the peak power cost | The model yields the per day load and generation capabilities further, a decision is made for BESS dispatch. |
| [45] | * | G | Improved particle swarm optimization (IPSO) | To achieve economic scheduling | Uncertainty in wind and solar generation and electricity prices has been considered and a two-stage stochastic model is solved to optimize the operating cost of the MG. |
| [46] | IEEE 33-bus system | G | Optimal power flow calculation is carried out and hierarchical distribution network integration method | To achieve optimal consumption of energy by effective economic scheduling | Effective coordination between prosumer and grid is required for the well operation of the power system. An increase in residential loads will make the power flow calculations complex. To overcome the above concern residential customers are clustered into a single residential MG. |
| Ref No. | Isolated (I) or Grid Connected (G) | Sources Considered | Objective Function | Approach | Problem Modelled as | Remarks |
|---|---|---|---|---|---|---|
| [47] | G | BESS alone | To improve the load factor by decreasing the peak value to valley point difference | The net energy in the BESS is considered as the initial value of the day | Mixed-integer programming | DR strategies improve the load profile which certainly improves the load factor. |
| [48] | G | PV and BESS | To increase the annual net profits, PV consumptive rate | Non-dominated sorting genetic algorithm 2 | Multi-objective problem | For optimal sizing of BESS, the constraints considered are reliability constraints, BESS performance constraints, and user purchasing electricity cost. |
| [49] | G | Solar, WT, and fuel cell (FC) | To reduce electricity costs. In this study, uncertainty in the cost of electricity and load uncertainty is considered for robust sizing | Decision theory approach is applied | BESS is considered as a cluster of loads. | In this study, decision-making is based on three issues, namely, minimization of expected cost, min-max regret, and stability. |
| [50] | G | Solar, WT, and FC | To reduce the total harmonic distortion (THD), active power losses, and to reduce the overall cost of DERs | Size is a function of the amount of operational cost decrement | BESS supplies the deficit power and maintains the balance | Sizing of DERs in an IEEE 31 bus distribution network was performed to reduce the total cost for installing DERs. |
| [51] | G | PV, grid, BESS, and WT | The aim is to optimize the overall operational cost of the MG | A quasi oppositional swine influenza model is applied | The load difference is supplied by the grid | Sizing of both rooftop PV and BESS has been done |
| [52] | G | PV, WT, grid, BESS | The objective is to minimize the net operational cost and installation of BESS | GWO algorithm is used | The load difference is supplied by the grid | The fuel cost is reduced so that the size of the BESS is reduced. |
| [53] | I | PV, WT, BESS, FC, and micro turbine (MT) are considered | The objective is to reduce the size of BESS | The problem is formulated as a mixed integer linear programming (MILP) | Grid is not present so BESS is essential | Sizing of BESS varies when the uncertainty of DERs is considered. Three cases have been considered: no BESS, BESS with no initial charge, and BESS with an initial stored charge equal to the total capacity of BESS. |
| Ref No. | Islanded (I) (or) Grid Connected Mode (G) | Loads Are Aggregated (A) (or) No Aggregation (N) | Users | Objectives | Outcome |
|---|---|---|---|---|---|
| [58] | G | Aggregated plug-in-electric vehicle (PEV) fleet | Low volatage MG (LV-MG) | Three objective functions have been considered: Reduction of power loss, reduction of voltage deviated. and current through the lines should be optimized | The problem is modeled as a multi-objective problem in which the results are not a single value but of sequence which is called Pareto solutions therefore, it is necessary to take trade-off points which are called as Pareto optimum. |
| [59] | G | Clustered loads aggregated | Residential cold climate heat pump (CCHP) MG | To optimize the operating cost of the MG | A two-stage optimal dispatch problem was proposed for obtaining low operating costs. |
| [60] | G | EVs | Residential and commercial | Aims to reduce the running cost of the MG | A non-linear optimization problem was solved by day-ahead scheduling. |
| [61] | G | Residential loads within the MG were aggregated | Residential loads | To maximize the aggregator’s profit | Day-ahead scheduling of DERs was considered and to mitigate the sporadic behavior a risk-constrained stochastic model was framed. |
| [62] | G | N | IEEE 24 bus | To achieve the economic profit, security, and stability of the MG | A multi-objective problem was solved to assess the dynamic stability. |
| [63] | * | A | * | To maximize the aggregator’s profit by balancing the real-time deficit of power | Optimal bidding strategy of aggregator and real-time balancing at the local level. |
| [64] | * | A | * | Profit maximization of all the market players within the power system | Bender’s decomposition is applied. |
| [65] | * | A | Smart distribution system | To maximize the operating cost of the agents (aggregators and prosumers) by optimally scheduling the resources and maximizing the profit of energy suppliers | Multi-follower bi-level programming is applied. The objective function is linearized and KKT is applied. |
| [66] | I | EVs aggregated | MG | To improve the frequency stability of the MG | In autonomous mode of operation of the MG, there is a need for the deployment of storage devices to support the frequency regulation. EVs are the active resources similar to BESS and they enhance the frequency regulation. |
| Ref No. | Size of Distribution Network | Energy Trading Model | Impact of Aggregator | Remarks |
|---|---|---|---|---|
| [84] | 33-bus radial network | Bottom-up approach | No | An iterative algorithm was proposed for energy trade. |
| [85] | * | Block-chain model | Yes | The objective is to improve the reliability and user security in trading a blockchain approach. |
| [86] | * | Block-chain model | Yes | Developing multi-directional trading is of significance. In this paper, the authors proposed a parallel trading model. |
| [87] | * | Energy broker model | Yes | This method is for maximizing the energy trading between the grid and the consumer. The energy broker decides the demand and the price of electricity by using dual optimization. The problem is modeled as a convex optimization problem. |
| Ref No. | Size of Distribution Network | Approach | Objective Function | Remarks |
|---|---|---|---|---|
| [88] | 118-bus radial network | Unit commitment method | To minimize the total expected cost | A two-stage stochastic model for achieving effective wind power integration. |
| [89] | Korean electricity market | Mean-variance portfolio method | To increase expected return and to increase the profitability of the aggregator | A mean-variance portfolio method is used to avoid the risk of the DRR portfolio. |
| [90] | 20,310 customers, 548 DGs | Resource scheduling, aggregation | To minimize the operating cost | K-means algorithm for clustering loads. |
| [91] | 180-bus | Economic dispatch problem is taken into account | To minimize the running cost | A two-stage scheduling problem is solved to optimize the fuel cost of the test system. |
| [92] | 218 consumers and load profile analyzed at 96-time slots. | Economic dispatch of DER | To minimize the operating cost | The allowable maximum load shift by using the DR program is less than or equal to the base load on the system. Optimization problem modeled as a linear problem. Figure 14 shows the problem associated with unjustified shifting of flexible loads. |
| [93] | DISCOMs | Optimal scheduling is done | To minimize the Expected cost of MG | Conditional value at risk (CVAR) index is used to analyze the uncertainty of WT. Objective function modeled as MILP. General algebraic modeling system (GAMS) and IBM ILOG CPLEX optimization studio named simply as CPLEX are used. |
| [94] | * | A Bayesian game model is proposed | To optimize the bidding strategy | To compensate for the power deficit/excess due to customer breach by placing auxiliary services like BESS. |
| [95] | 20,000 heat pumps with a capacity of 1 MW. | * | Techno-economic feasibility study | Two scenarios are considered always available and always reliable. |
| [96] | South Korea Capacity 10 MW | Demand-side management system (DSMS) | To minimize the electricity price, energy conservation | A strategy of DSMS is proposed for calculating the customer baseline load. |
| [97] | * | Improved elephant herd optimization | To optimize the fuel cost of operation | A multi-objective problem has been formulated. Three cases were considered, namely scheduling to reduce operational cost, scheduling to reduce operational cost and variance, and the impact of penetrating EVs on operational cost. |
| Ref. No. | Test System Considered | Clustering Method | Remarks |
|---|---|---|---|
| [99] | Residential electric water heaters | K-means clustering method is used for clustering the loads. To find the number of clusters, required Silhouette method is applied. | The goal is to reduce the impact on the availability of hot water when a DR strategy is applied. The success rate of such clustering methods is more dependent on the accuracy in load forecast. |
| [100] | 751 residential customers | Dwelling’s clustering | Based on the spot market price the decision-making algorithm shifts the load demand. |
| [101] | Non-residential customers | Ant colony clustering | The original electrical pattern is applied to the optimization algorithm named the ant colony clustering algorithm. |
| [102] | * | The spectral clustering method is applied. | By using the Euclidean function and load curve, the method performs a similarity check on all the load profiles considered. This algorithm is robust to data size. |
| [103] | Real-world smart meter data | Hierarchical clustering | Performs dissimilarity check. |
| [104] | * | Fuzzy K-means clustering | The global criterion method and Bellman–Zadeh’s maximization principle are used. |
| [105] | Domestic customers | Fuzzy subtractive clustering is applied. | With the proposed method of load shedding and valley, the filling can be accomplished. |
| Source Type | Capital Cost ($/kW) | Fixed Maintenance Cost ($/kW) | Life (Years) |
|---|---|---|---|
| WT | 1000 | 15 | 20 |
| PV | 1300 | 30.330 | 20 |
| DG | 800 | 0.012 | 15 |
| MT | 850 | 2.000 | 15 |
| Percentage of ILs Penetration | Capital Cost of PV $/Day | Capital Cost of WT $/Day | Capital Cost of DG $/Day | Total Cost of MG $/Day |
|---|---|---|---|---|
| 0% | 279,374.621 | 216,914.635 | 325,225.678 | 821,514.900 |
| 5% | 221,426.776 | 243,299.560 | 306,113.391 | 770,839.700 |
| 10% | 196,888.840 | 248,550.155 | 283,033.045 | 728,472.000 |
| S.No. | Penetration of ILs in % | Peak Value of Load, kW | Electricity Price, Rs/Day | Load Factor |
|---|---|---|---|---|
| 1 | 0% | 830.300 | 131,952.7 | 0.561957 |
| 2 | 5% | 788.785 | 128,243.5 | 0.591540 |
| 3 | 10% | 747.270 | 125,893.7 | 0.624397 |
Publisher’s Note: MDPI stays neutral with regard to jurisdictional claims in published maps and institutional affiliations. |
© 2021 by the authors. Licensee MDPI, Basel, Switzerland. This article is an open access article distributed under the terms and conditions of the Creative Commons Attribution (CC BY) license (https://creativecommons.org/licenses/by/4.0/).
Share and Cite
Pothireddy, K.M.R.; Vuddanti, S.; Salkuti, S.R. Impact of Demand Response on Optimal Sizing of Distributed Generation and Customer Tariff. Energies 2022, 15, 190. https://doi.org/10.3390/en15010190
Pothireddy KMR, Vuddanti S, Salkuti SR. Impact of Demand Response on Optimal Sizing of Distributed Generation and Customer Tariff. Energies. 2022; 15(1):190. https://doi.org/10.3390/en15010190
Chicago/Turabian StylePothireddy, Krishna Mohan Reddy, Sandeep Vuddanti, and Surender Reddy Salkuti. 2022. "Impact of Demand Response on Optimal Sizing of Distributed Generation and Customer Tariff" Energies 15, no. 1: 190. https://doi.org/10.3390/en15010190
APA StylePothireddy, K. M. R., Vuddanti, S., & Salkuti, S. R. (2022). Impact of Demand Response on Optimal Sizing of Distributed Generation and Customer Tariff. Energies, 15(1), 190. https://doi.org/10.3390/en15010190