Article

LCA-Based Regional Distribution and Transference of Carbon Emissions from Wind Farms in China

1
School of Economics and Management, China University of Geosciences, Beijing 100083, China
2
Beijing Institute of Metrology, Beijing 100012, China
*
Author to whom correspondence should be addressed.
Energies 2022, 15(1), 198; https://doi.org/10.3390/en15010198
Submission received: 22 November 2021 / Revised: 16 December 2021 / Accepted: 20 December 2021 / Published: 29 December 2021

Abstract

:
As a clean form of energy utilization, wind power is important for alleviating climate change. Although no direct carbon emissions occur in wind power generation, there exist upstream carbon emissions from manufacturing and installation, which have indirect effects on both the locations of wind farms and areas involved in upstream production and manufacturing. In this paper, based on Input–Output based Life Cycle Analysis (IO-LCA), we explored the lifetime carbon emissions of 378 wind farms in China that were still in operation in 2015. The regional distributions of carbon emissions from wind farms during the whole lifetime were depicted. The embodied carbon emission transfers from the location of the wind farm operation to upstream turbine manufacturing regions were traced. The net emission reduction benefits among regions were also calculated. Results show that carbon emissions mainly distribute in Liaoning, Inner Mongolia, and Tianjin in the turbine manufacturing stage, with a total amount of 3.36 MT. Inner Mongolia contributes the largest carbon emissions (5.94 MT) in the farm construction stage. Inner Mongolia has transferred about 0.99 MT carbon emissions to itself and has the largest net emission reduction. Recognizing the carbon emission transfer of wind farms and dividing the carbon emission reduction responsibilities among regions may shed light on supply chain carbon emission reduction and provincial carbon quota allocation.

1. Introduction

In recent years, climate change has attracted more and more attention from the international community. As a type of clean energy, wind power can avoid energy consumption and carbon emissions caused by the burning of fossil energy, and plays an important role in reducing carbon emission and alleviating climate change. According to the report of IRENA [1], the cumulative installed capacity of global onshore wind power would grow more than threefold by 2030 relative to 542 GW in 2018. Although no direct carbon emissions occur in the process of wind power generation, there exist upstream carbon emissions from manufacturing and installation, which has indirect effects on both the locations of wind farms and regions involved in upstream turbine manufacturing. The regional distribution of lifetime wind farm carbon emissions is a global issue worthy to be discussed.
To achieve the Paris climate targets, China also attaches great importance to carbon emissions reduction. At the 75th UN General Assembly held in 2020, China clearly put forward the goal of “achieving carbon neutrality by 2060”. Under China’s current energy structure, carbon emissions from the power sector account for more than 45% of the country’s total emissions, making it the key of national carbon emission abatement. To transiting to a clean and low carbon power generation structure, renewable power, especially wind power, is attracting more and more attention. The State Council proposed that the installed capacity of wind power was expected to reach more than 1.2 billion KW in Action Plan for Carbon Dioxide Peaking Before 2030 on 26 October 2021.
In addition to direct energy saving and emission reduction benefits, large-scale wind power substitution in China will bring large amounts of indirect carbon emissions due to upstream inputs such as turbine manufacturing and wind farm construction. Furthermore, it will bring about a carbon emission spillover effect among regions in China from a supply chain perspective. In April 2018, the State Council proposed to carry out quota distribution according to the basic data submitted by different regions and the characteristics of relevant industries. The carbon emission reduction responsibilities and initial carbon quota distribution in different provinces will become the focus of local governments. Recognizing the carbon emission transfer of wind power industry among different regions may contribute to exact carbon responsibility assignment. Therefore, it is necessary to calculate the indirect carbon emission of wind power, mapping the regional distribution of direct and indirect carbon emissions, and tracing the inter-regional transfer of emissions embodiment in a lifetime perspective, which may contribute to the establishment of fundamental database that serve carbon emission quota distribution.
Although many scholars have provided basic methodologies for wind power environmental impact accounting [2,3,4,5], a systematic framework should be established from a life cycle perspective to improve the accuracy. At present, life cycle analysis (LCA) of the environmental impact of wind farms in various regions have been widely discussed. Xu et al. [6] conducted a life cycle assessment of Saihan wind farm in Inner Mongolia and compared its environmental impact with the coal-fired and natural gas power plants with a similar megawattage in China. After assessing lifetime carbon emissions of the first wind farm installed in Libya, Al-Behadili and El-Osta [7] found that wind energy generated the lowest CO2 emissions per kilowatt-hour of power generation comparing with fossil fuel fired and other renewable power generation forms. Alsaleh and Sattler [8] conducted a life cycle analysis of large onshore wind turbines in the United States, including all stages of materials acquisition, manufacturing, transportation, installation, operation and maintenance, and end of life, and analyzed the impacts on the environment, human health, and resource consumption.
However, most of the current studies focus on a single wind farm at the micro scale, considering the actual material consumption, and applying bottom-up process-based life cycle assessment for environmental impact assessment. Although the results are specific and accurate, the bottom-up process-based life cycle assessment is not suitable for evaluating the environmental impact of large-scale wind power integration at the macro scale [9]. Many scholars have combined the input–output method with traditional life cycle assessment in order to overcome the shortcomings of process life cycle assessment [10,11,12]. Compared with process life cycle analysis (PLCA), input–output-based life cycle assessment (IO-LCA) provides methodological support for environmental impact analysis of the power sector from a macro perspective. This top-down research method has been widely used in global, urban, and sectoral carbon emission accounting [13,14,15,16,17,18,19,20]. Many scholars have quantitatively analyzed the environmental impact of the energy and power sectors using this method. For example, Wang et al. [21] combined process-based life cycle analysis with input–output analysis to assess the triple effect of bioethanol production on the society, economy, and environment. Combining the input–output analysis, Hertwich et al. [22] established a global life cycle assessment model for the environmental impact assessment of the global long-term and large-scale renewable energy power generation, based on which the environmental performances of different renewable energy power generation technologies were compared. Li et al. [23] quantitatively analyzed the water consumption and CO2 emissions caused by wind power in China by using the environmental input–output model. Nagashima et al. [24] disaggregated the input–output table and analyzed the impact of wind power on the environment, energy consumption, and the entire economic system. Xu et al. [25] assessed the carbon dioxide (CO2) emissions, water consumption, and water quality of pulverized coal, wind energy, and solar power generation in Inner Mongolia by applying the environmental input–output analysis and integrating PLCA with IO-LCA assessment. PLCA and IO-LCA have also been combinedly used to evaluate the life cycle CO2 emissions of a typical biodiesel supply chain, incorporating process-specific data of rape methyl ester (RME) production and inputs from higher upstream processes such as chemical inputs, mining, transportation, banking, equipment, etc. [26].
In summary, the environmental impact assessment of wind power has been extensively discussed in existing studies, especially carbon emission accounting. Although the lifetime accounting of carbon emissions of wind farms has been widely conducted, the following issues still need to be further explored: Most of the existing research mainly focuses on a single wind farm, using the process life cycle assessment to establish a detailed material list and calculates the carbon emissions during the life cycle of a wind farm. Macro studies on the impact of wind power penetration on carbon emission still need to be further investigated. In addition, as the whole life cycle of wind power generation occurs in different regions, wind turbine manufactory, wind farm construction and operation will generate carbon emissions at different places, i.e., wind power generation will inevitably foster both onsite and offsite emissions. Therefore, it is important to further clarify the spillover effects of carbon emissions among regions driven by wind power. The contributions of this paper include: (1) Carbon emissions based on LCA and reduction benefits are evaluated at the national level. (2) The transfer of carbon emissions from wind power generation among different provinces in China is depicted, which reflects the spillover effects on a provincial scale and helps assign clear responsibility for emission reductions in different regions. The methodological framework proposed in this study can be used to identify the key points of carbon emissions from wind power, and clarify the emission responsibilities of different regions at the both national and global level.

2. Methodology

2.1. Methodological Framework

The proposed methodological framework is shown in Figure 1. The first step is to define the system boundary. It generally includes the turbine manufacturing stage, wind farm construction stage, and operation stage. The second step is to compile the material input lists of different kinds of turbines. The third step is to classify material inputs into related sectors of IO or MRIO. The carbon footprint of wind farms over the life cycle is then calculated using Equations (1) and (2). In this paper, the IO-LCA model was employed. In particular, based on the basic model, we extended IO to MRIO to explore carbon emissions generated by construction and operation of wind farms in different regions. Based on the modified model, the actual carbon emissions at different regions and the transfer of carbon emissions from wind power generation among different provinces in China can be accurately depicted, which reflects the spillover effect on a provincial scale and helps assign clear responsibility for emission reductions in different regions. Furthermore, direct emissions reduction benefits and net emissions reduction benefits were calculated, which demonstrates the positive or negative impacts of wind power development on different regions.

2.2. IO-LCA

LCA is a bottom-up and process-based environmental impact assessment method. LCA can be classified into process life cycle analysis (PLCA), Input–Output based Life Cycle Analysis (IO-LCA), and Hybrid LCA [27,28,29]. PLCA is often used to analyze the indirect environmental effects associated with a production process. However, there will be obvious truncation errors in the calculation, when the system boundary is defined. Although hybrid analysis has more advantages than the other two methods, it is more complicated. Different from the above-mentioned methods, IO-LCA can avoid truncation errors caused by inaccurate system boundary settings, thereby analyzing a complete life cycle of a certain product.
According to existing studies, IO-LCA is often used to assess wind farms carbon emissions during entire lifetime. The calculation of the IO-LCA model is based on the IO table. Input–output analysis is a top-down method that represents the monetary flow among different economic sectors. It reflects the interrelationship among different economic sectors through the production and consumption of intermediate sectors [30]. Assuming that each industry consumes outputs of other industries in fixed ratios in order to produce its own unique and distinct output, the basic input–output model can be described as
X = ( I - A ) 1   ×   Y
where A is the direct consumption coefficient matrix of n × n. The element aij of A represents the direct input of products or services of sector i required by sector j to produce one unit of product or service; I is an n × n unit matrix; the vectors X and Y of n × 1 represent the total output and final demand of each sector, respectively.
Once the lifetime data for a product or service is captured, combining the environmental emission coefficient of each sector and the monetary interactions among economic sectors in the input–output table, the IO-LCA can capture all upstream emissions (such as carbon emissions) of the concerned material inputs within the system boundary, as shown in Equation (2). The details of IO-LCA can be referred to the work of Joshi [31].
CE = k   ×   ( I - A ) 1   ×   Y
where k is an environmental burden coefficient matrix, which shows the amount of carbon dioxide emission per unit of economic output for each industry.   ( I - A ) 1 is the Leontief inverse matrix, and Y is the diagonal matrix, which represents the final demands of different sectors. In this study, the Y matrix is constructed by classifying the material inputs (in monetary unit) of different turbines in different provinces into the corresponding sectors of the multi-regional input–output table, i.e., matrix Y represents the demand for meeting requirements of turbine manufacturing or wind farm construction. Then the economy-wide total (direct and indirect) environmental burden associated with an exogenous demand vector Y was calculated and represented as CE.

2.3. IO-LCA of Wind Farms in China

In this paper, assuming the lifetime of wind farms is 20 years, wind farms that were built and put into operation from 1995 to 2015 are focused on. The lifetime carbon emissions of 378 wind farms in China are explored, covering turbines with installed capacity of 1.5 MW, 2 MW, 3 MW, 0.85 MW, 0.66 MW, and 1.25 MW. The materials used in the manufacturing of different turbines and construction of wind farms are compiled, while the geographical locations of the wind farms are mapped, based on which the lifetime carbon emissions of wind farms in each region are calculated using the IO-LCA method (mainly considering turbine manufacturing, and construction and operation of the wind farm). Moreover, the upstream carbon emissions of wind farms in each region are located, and the transfers of carbon emission embodiment driven by wind power generation are traced. The carbon budget due to wind power penetration in each region is also assessed and compared, which may shed light on wind power deployment at regional and national scales.

2.3.1. System Boundary

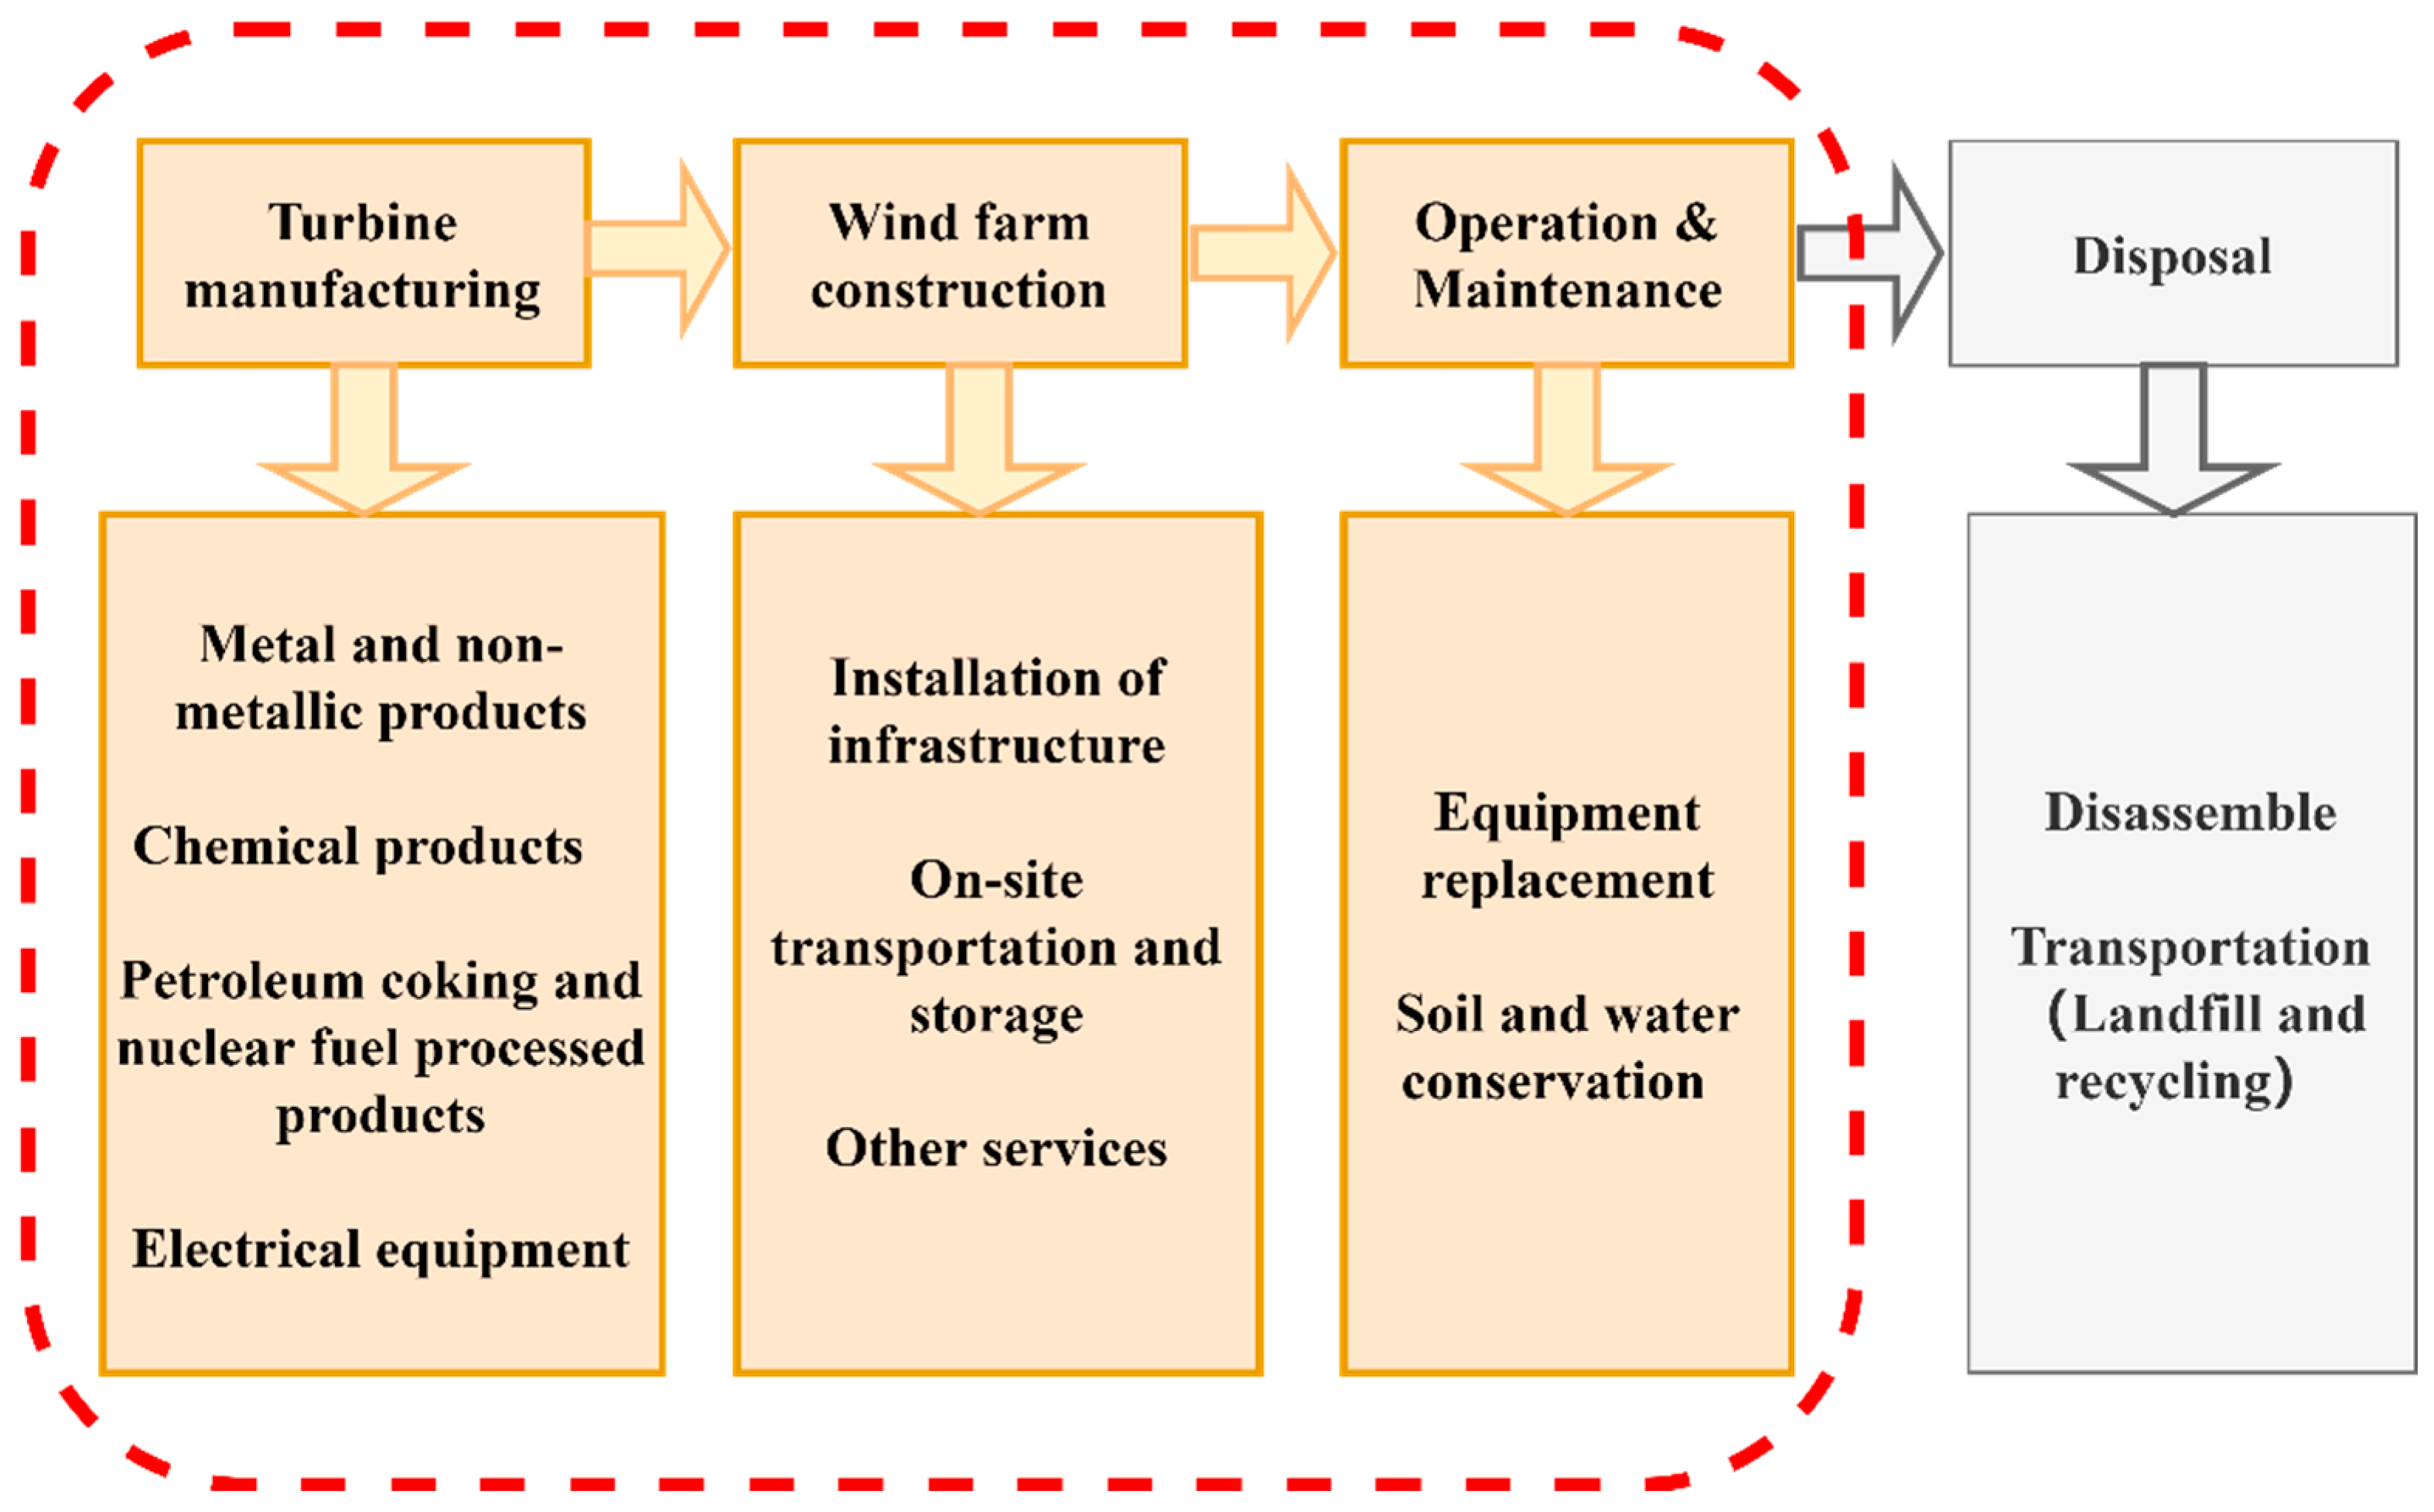
The system boundary of the concerned wind farms is shown in Figure 2, which mainly includes the construction of wind farms, the manufacturing of upstream wind turbines, and operation. Since the data of the routes of material and equipment transportation were not available, the transportation stage, which accounted for only 5.6% of total emissions, was not taken into consideration [32]. As all the concerned wind farms are still in operation, the disposal stage is not considered. The construction of a wind farm includes the installation of power equipment, on-site transportation and storage, metering and transportation equipment, and other manufacturing and technical services. The turbine manufacturing includes metal and non-metallic materials, chemical products, petroleum coking processing products, electrical machinery and equipment. Soil and water conservation and equipment replacement are mainly considered in the operation and maintenance stage.

2.3.2. Preparation of the Material List

The material inputs of wind turbines are collected from previous studies [8,33,34,35,36,37], based on which inventories for different wind turbines were compiled. As shown in Table 1, the inventory of six types of wind turbines with rated power of 1.5 MW, 2 MW, 3 MW, 0.85 MW, 0.66 MW, and 1.25 MW was listed. The materials inputs in the turbine manufacturing stage and the foundations used in the construction stage are displayed in physical unit, while other inputs in the construction stage and the operation stage are displayed in monetary unit.
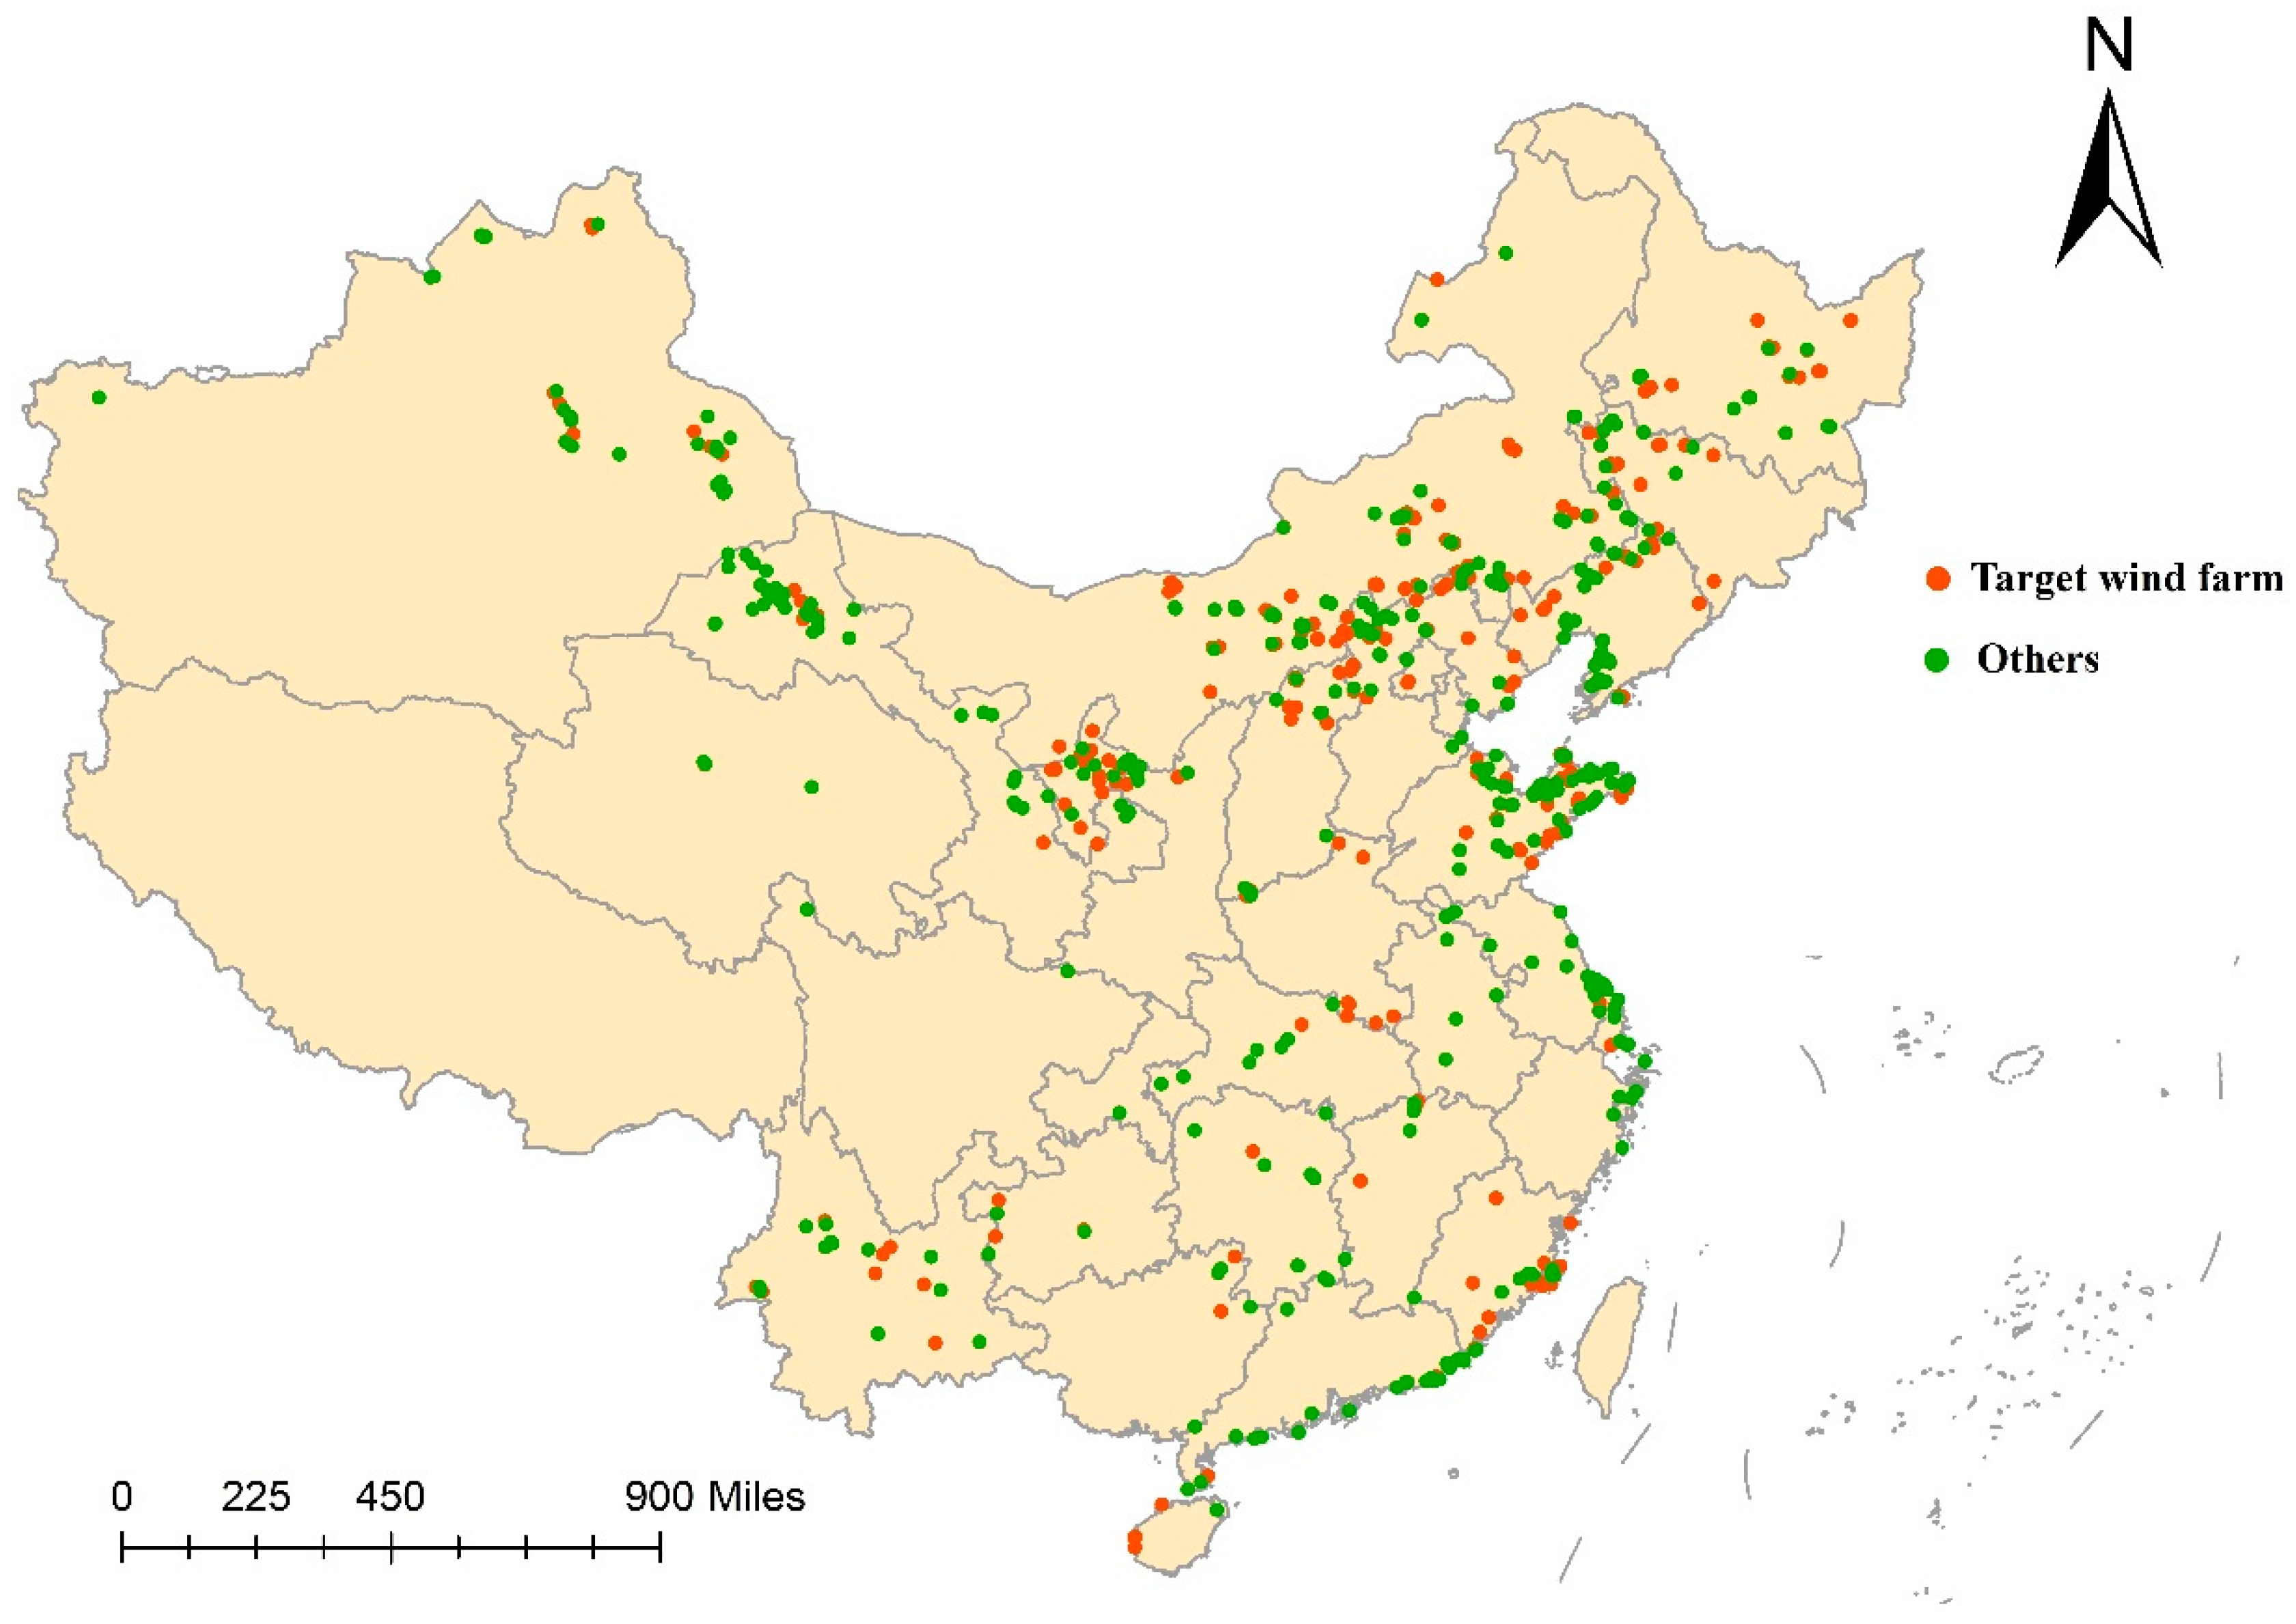
The geographical distributions of wind farms were located and mapped by ARCGIS. Figure 3 shows the distribution of 866 Chinese wind farms based on the global wind power data released by S&P Global Market Intelligence LLC. Due to data availability, only 378 wind farms (marked in red dots in Figure 3) are taken into consideration.
On the basis of turbine brands and types, we further found out the specific province where the wind turbine manufacturer of each wind farm was located, so that the province where each wind farm was located can be linked to the upstream province where the turbine was manufactured. The physical units of material inputs were then converted into monetary units according to price of the material. Based on the MRIO table of the year 2002, 2007, 2012 and 2015, the material inputs in monetary unit were further classified into the corresponding sector of the relevant MRIO table according to the national economic industry classification (GB/T4754-2017), as shown in Table 2.
In terms of matching material inputs with the MRIO table, given that most of materials are produced locally except for a few provinces that lack the enterprises producing certain materials, it is assumed that manufacturers of wind turbines only use locally produced materials, i.e., material inputs are classified into the final demand Y of provinces where wind turbine manufacturing and wind farm construction take place. If there are no relevant raw material production enterprises in a province, considering the minimization of transportation costs, it is assumed that materials from neighboring provinces will be imported. In this way, for example, if Jilin lacks copper manufactory enterprises, copper from neighboring provinces will be imported to Jilin for wind turbines manufactory. Table 3 shows the distributions of enterprises producing raw materials used for wind turbine manufactory by Tian Yan Cha (Enterprise information website: https://www.tianyancha.com/?jsid=SEM-BAIDU-PZ-SY-2021112-JRGW) (accessed on 29 June 2021).

2.3.3. Data Sources

The 2002, 2007, 2012, and 2015 China multi-regional input–output tables that used to calculate embodied carbon emission of wind farms come from China Emission Accounts and Datasets (CEADS) and Pan et al. [38]. The carbon emission factors of different sectors in different regions were compiled from the provincial carbon emission data published by CEADS. According to the “China Energy Statistical Yearbook 2015”, “China Electric Power Yearbook 2015”, and “2015 Electric Power Industry Statistics Collection”, the emission factors of the electric power sector in each region were calculated, which were used to calculate the direct emission reduction benefits of wind power penetration. The data of wind farms in China were collected from S&P Global Market Intelligence LLC, including the information of location, installed capacity, turbine size, construction year, etc. Compared with other studies, we have more comprehensive and accurate accounting of carbon emissions of wind farms by combining plant-by-plant wind farm data with macro input–output table.

3. Results and Discussion

Figure 4 shows carbon emissions per unit of electricity generation. Turbines with capacity larger than 1.5 MW show that the larger the installed capacity of the turbine is, the lower carbon emissions per unit of electricity generation are. This is consistent with the results of previous studies. However, for turbines with installed capacity less than 1.5 MW, as the amount of metal (such as iron and steel, etc.) consumption of 1.5 MW turbine is much larger than other turbines (1.25 MW, 0.85 MW, and 0.66 MW), carbon emissions of 1.5 MW are much higher than those of other turbines.
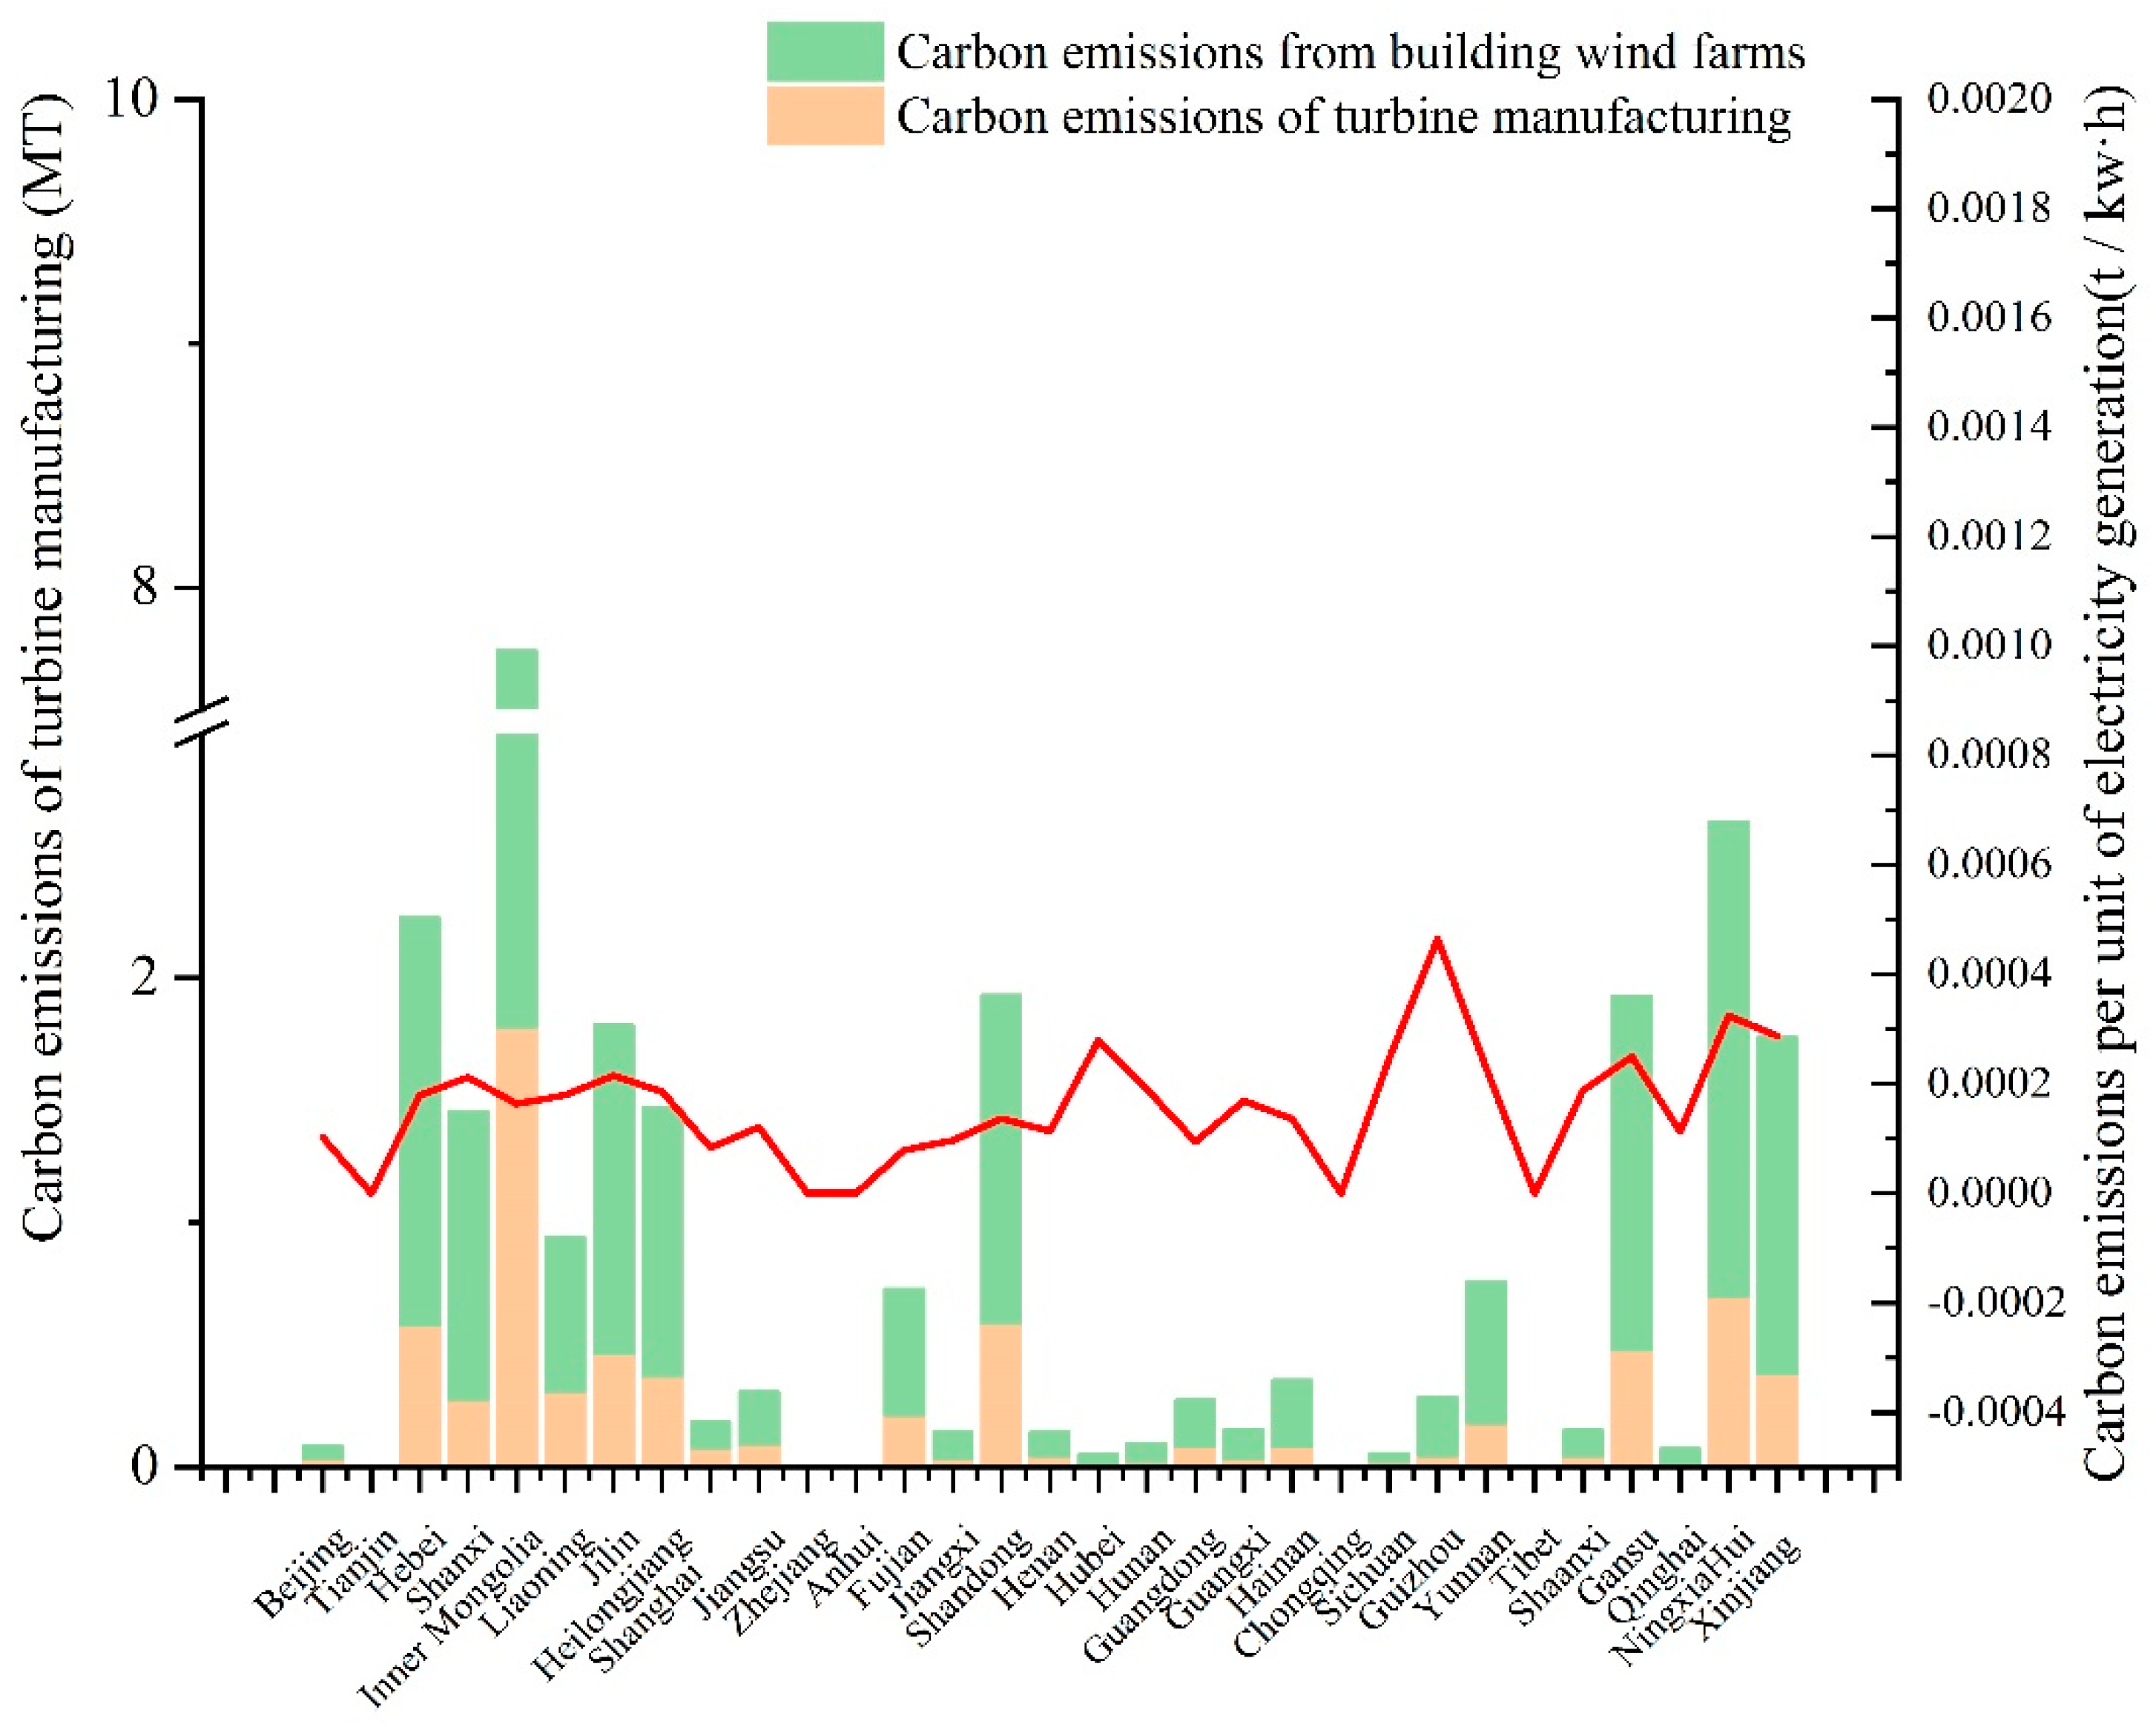
The bars in Figure 5 show the lifetime carbon emissions (MT) of wind farms in different provinces, including direct carbon emissions caused by the construction of wind farms and the upstream indirect carbon emissions driven by turbine manufacturing. The total carbon emissions of Inner Mongolia and Ningxia far exceed those of other regions, reaching 7.74 MT and 2.64 MT, respectively. Due to the rich wind resources in Inner Mongolia and Ningxia, large numbers of wind farms have been built, leading to the high-lifetime carbon emissions in these areas. Figure 5 also shows that the proportion of carbon emissions from wind farm construction exceeds those of turbine manufacturing in the whole lifetime. For example, the proportions of carbon emissions from wind farm construction of wind farms located in Inner Mongolia and Ningxia are 76.76% and 73.48% of total carbon emissions, while their carbon emissions from turbine manufacturing account for 23.24% and 26.52%, respectively. At the national level, carbon emissions from turbine manufacturing account for 25.15% of total emissions, and wind farm construction accounts for 74.85% of total emissions. The line in Figure 5 shows the carbon emissions per unit of wind power generation (t/kw·h); that is, the ratio of the total carbon emissions from wind farms to the wind power generation in a specific region. As shown in Figure 5, the carbon emission per kw·h of wind power generation fluctuates significantly among different provinces. Some provinces have relatively large carbon emissions per unit of power generation such as Guizhou, Ningxia, Xinjiang, Hubei, Gansu, Sichuan, etc. According to data up to 2015, provinces such as Guizhou and Sichuan have poor wind energy resources, resulting in less installed capacity. This factor may attribute to large carbon emissions per unit of power generation. As for Northwest China (Ningxia, Xinjiang, Gansu, etc.), the high wind curtailment rate leads to large carbon emissions per unit of power generation. For example, in 2015, the wind curtailment rate in Xinjiang and Gansu reached 32% and 39%, respectively.
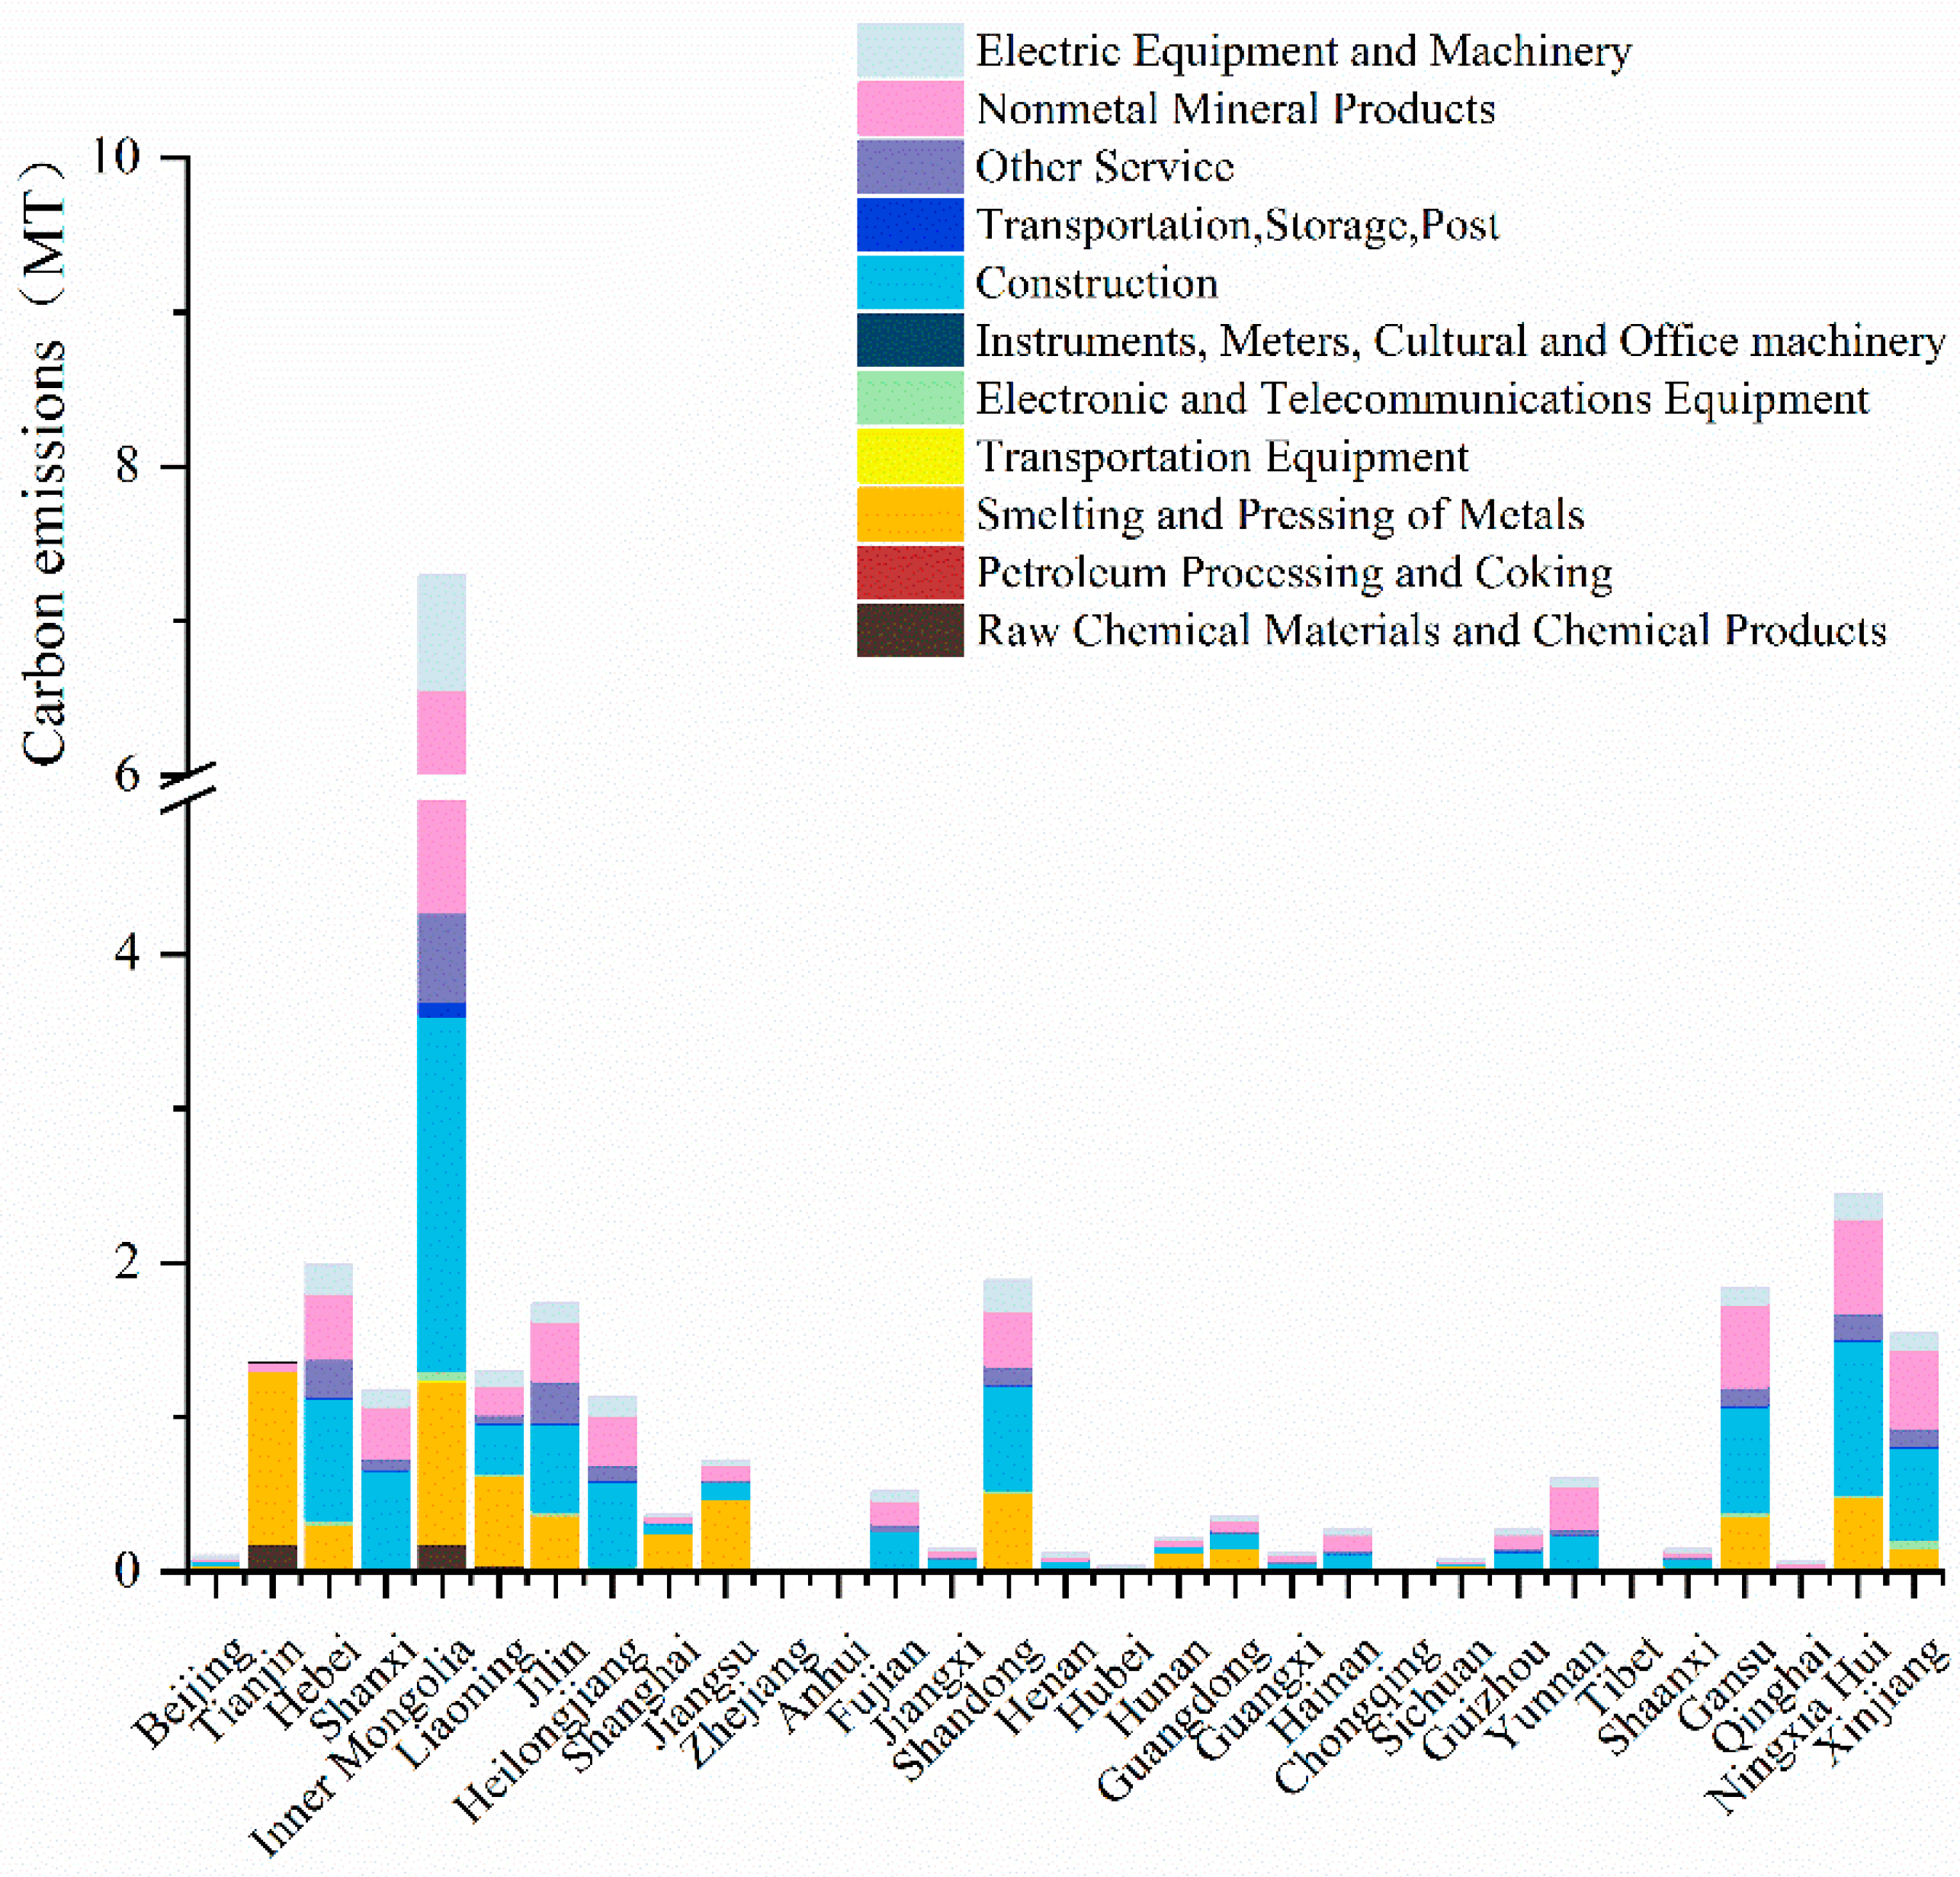
Figure 6 shows the sectoral distribution of CO2 emissions that generated from wind turbine production and wind farm construction. Among those economic sectors, the Smelting and Pressing of Metals sector, the Nonmetal Mineral Products sector, and the Construction sector, respectively, account for a large proportion of 21.45%, 25.53%, and 34.01% of total carbon emissions of all provinces. Taking Inner Mongolia as an example, turbine manufacturing requires a large number of both metal materials, such as steel, iron, copper, and chemical materials (e.g., epoxy resin), the Smelting and Pressing of Metals sector, and the Raw Chemical Materials and Chemical Products sector account for 77.69% and 13.49% of total emissions, respectively. The construction of wind farms requires not only building foundation and infrastructure, but also installing power generation equipment and laying cables. Therefore, the proportions of the Nonmetal Mineral Products sector and the Construction sector are 36.59% and 38.68% of total emissions, respectively. The situation of other provinces varies slightly due to different material costs.
Wind turbines are the main components and core power generation units of wind farms. It can be seen from Figure 6 that the construction of wind farms has stimulated the upstream turbine manufacturing and driven a large number of carbon emissions. However, the locations of many wind farms are different from that of turbine manufacturers, and the construction of wind farms in a certain region may drive carbon emissions in upstream turbine production regions. Based on the above analysis, if the turbine manufacturers’ upstream raw material production enterprise is located locally, the local raw materials will be used by turbine manufacturer according to the cost minimization principle, and carbon emissions of turbine manufacturing will take place in the local area. Then carbon emissions will be transferred from provinces where wind farms are built, to provinces where wind turbines are manufactured. If raw materials for wind turbine manufacturers cannot be satisfied locally, materials from both local and neighboring enterprises will be used, leading to the carbon emissions transfer from wind farms construction provinces to not only turbine manufacturing provinces, but also upstream raw materials supply provinces.
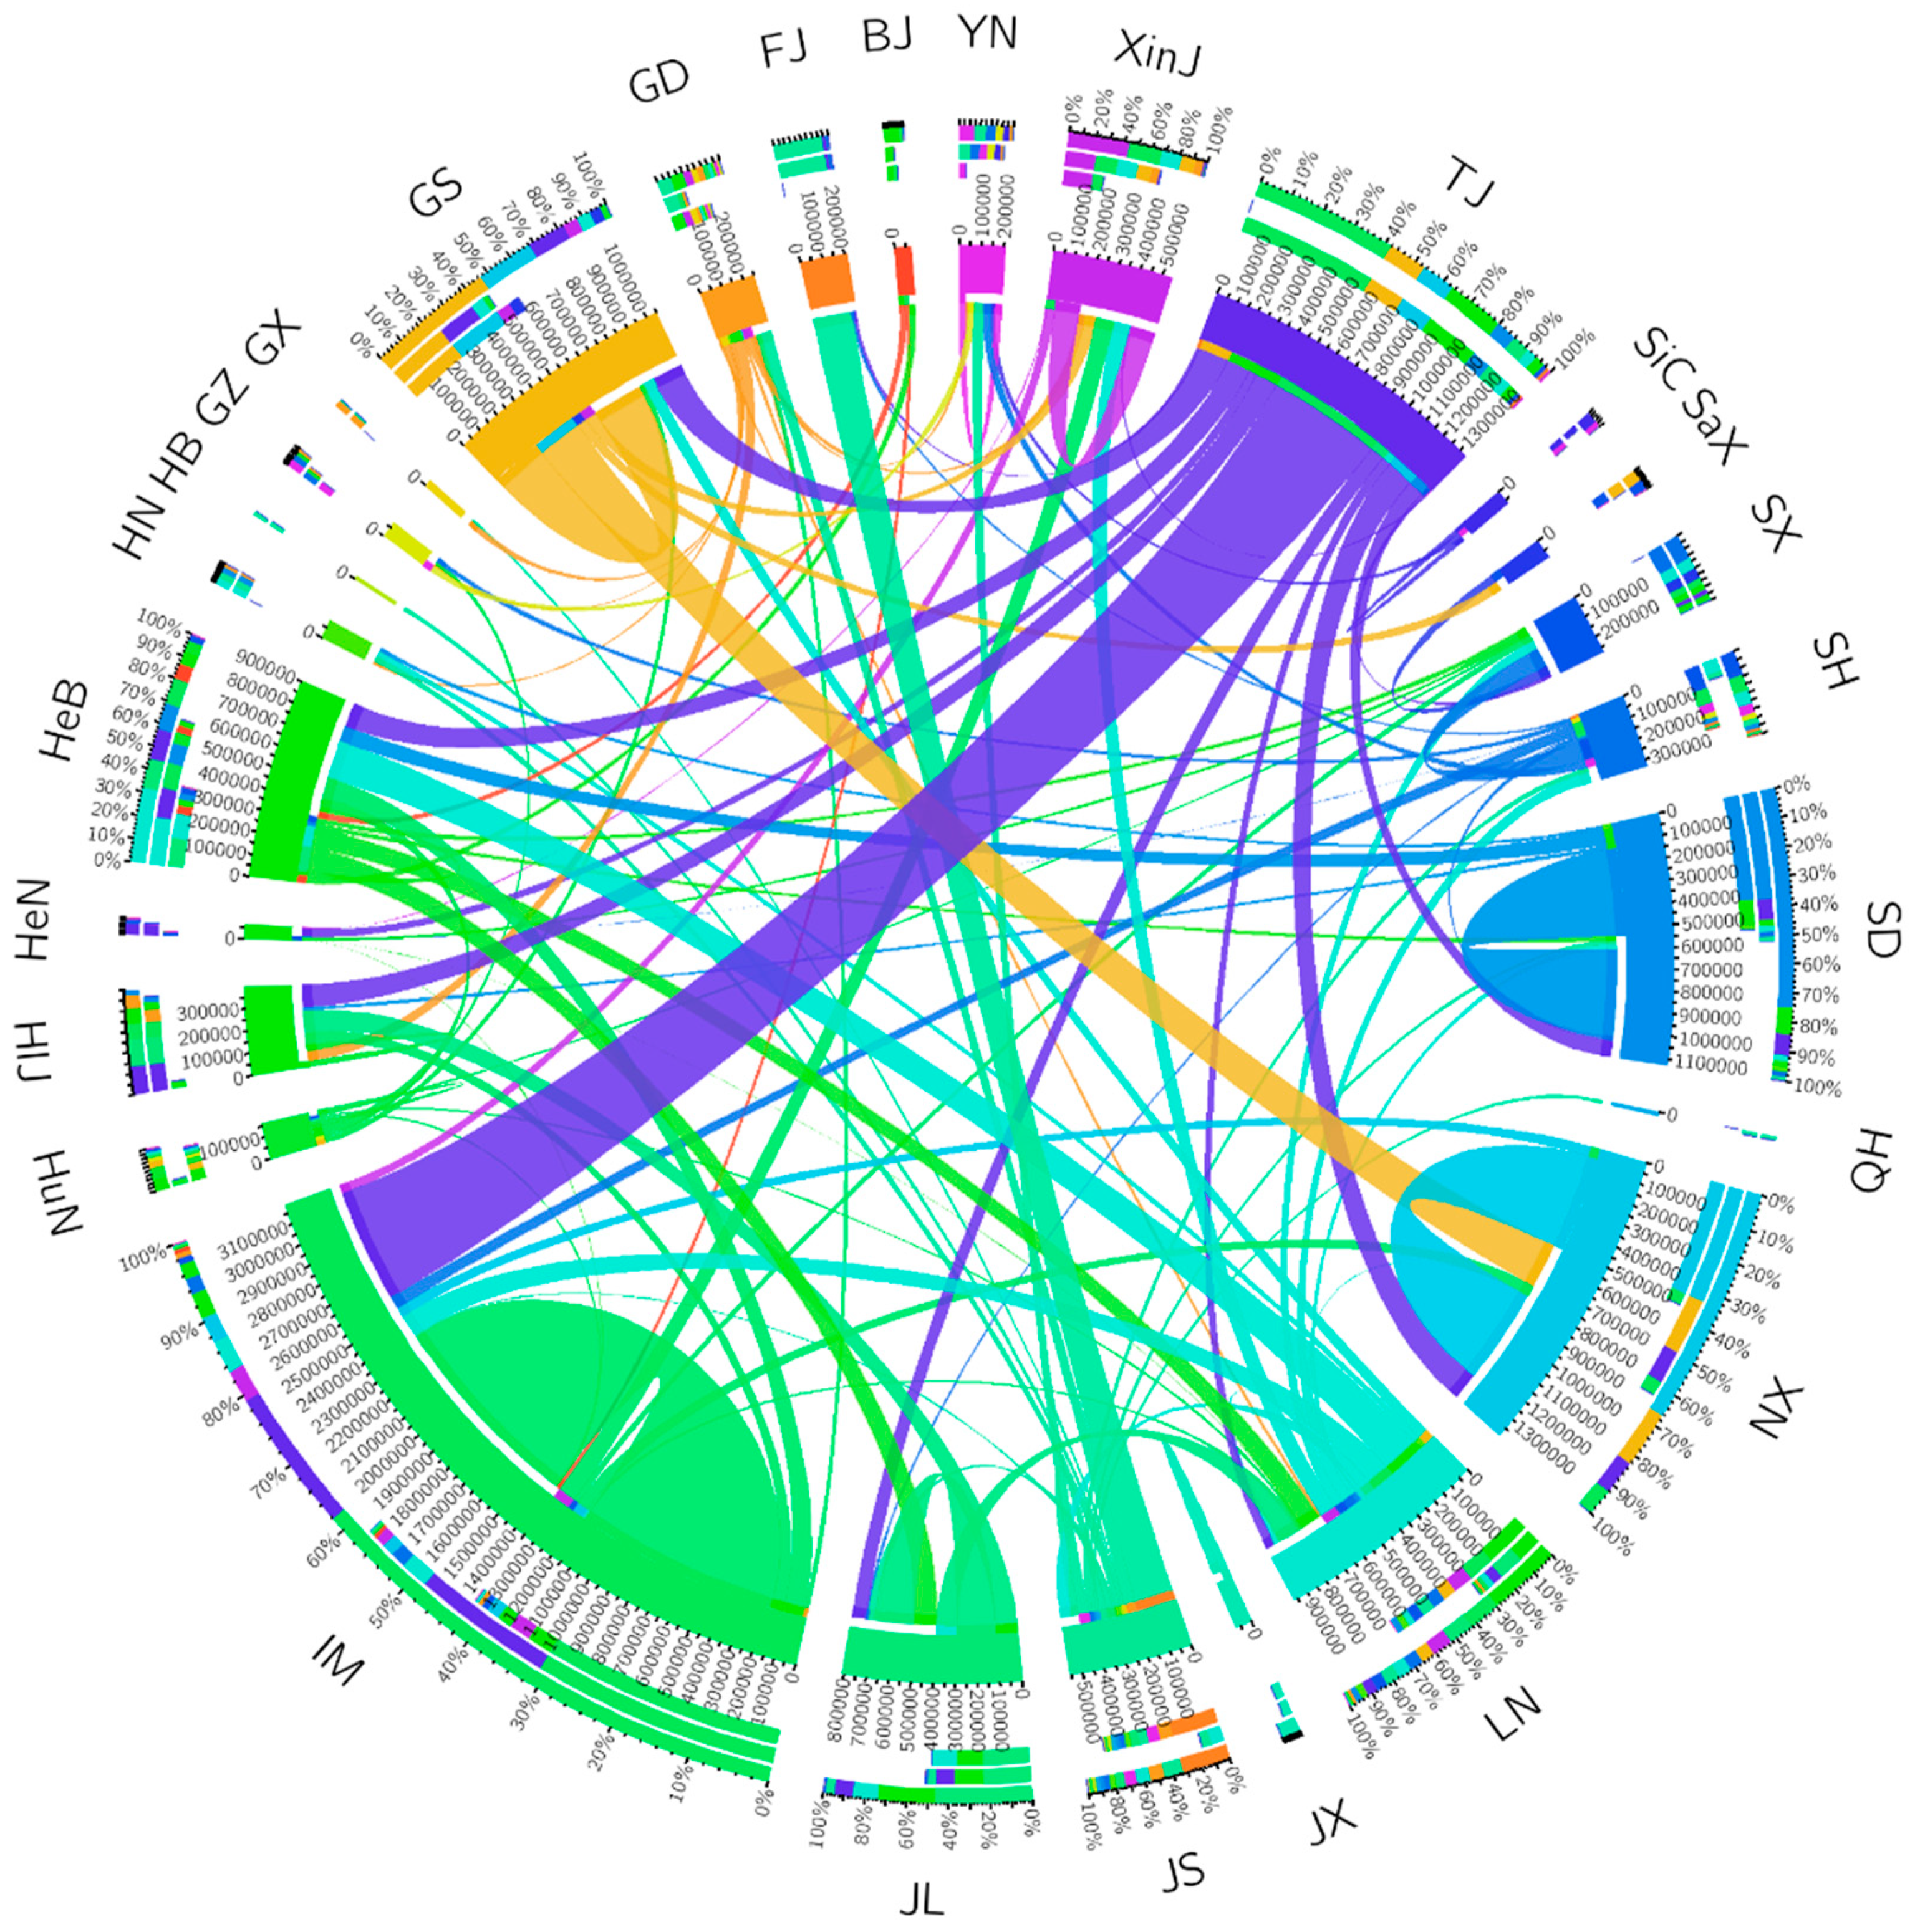
Figure 7 reflects the flows of embodied carbon emissions caused by the transfer of turbines among provinces. Different colors on the circle represent different provinces. The width of the arc connecting the circles represents the amount of embodied carbon transference. If an arc connects two different provinces in different colors, it indicates that carbon emissions are transferred from the province with same color as arc to another province with a different color from the arc (indicating the direction of flow). From the perspective of the turbine manufacturing provinces, it is obvious that Inner Mongolia is the biggest turbine manufacturing provinces. Most of the turbines manufactured in Inner Mongolia were used locally, which account for 73.18% of the total carbon emissions from turbines manufactory in Inner Mongolia. Except for local demand of wind turbines, other turbines in Inner Mongolia were delivered to nearby provinces such as Hebei, Xinjiang, and Heilongjiang. Therefore, the embodied carbon emissions from Hebei, Xinjiang, and Heilongjiang that are transferred to Inner Mongolia constitute 7.43%, 6.53%, and 4.39% of Inner Mongolia’s total carbon emissions, respectively. Moreover, it is shown that large numbers of turbines manufactured in Tianjin are used in Inner Mongolia. Therefore, Inner Mongolia transferred 0.56 MT carbon emissions to Tianjin, accounting for approximately 41.80% of the total carbon emissions from Tianjin’s turbine manufacturing. The third largest turbine manufacturing province is Liaoning. Turbines in Liaoning are mainly transferred to Hebei, Inner Mongolia, and Xinjiang, resulting in 28.21%, 16.71%, and 12.11% of Liaoning’s total embodied carbon emissions, respectively. From the perspective of the province where the turbines are used, Inner Mongolia mainly used the turbines from its local manufactory, Tianjin and Liaoning. Therefore, carbon emissions for meeting its own turbine demand account for 55.05% of total carbon emissions transferred from Inner Mongolia, and 31.13% and 6.15% of carbon emissions transferred from Inner Mongolia are delivered to Tianjin and Liaoning, respectively. For Ningxia, it is worth noting that turbines used in Ningxia are mainly supplied by itself, generating 52.82% total carbon emissions transferred from Ningxia. Moreover, large number of turbines were imported from neighboring provinces, such as Gansu, Tianjin, etc. The transference of carbon emissions to these provinces account for 25.36%, 15.23% of the total carbon emissions transferred by Ningxia. Based on the analysis above, provinces such as Liaoning, Inner Mongolia, and Tianjin have manufactured a large number of turbines for other provinces and generate a large number of carbon emissions due to turbine manufactory. Provinces such as Ningxia and Inner Mongolia have transferred a large number of carbon emissions to other provinces, and although the local carbon emission burden was alleviated, the environmental burden of upstream turbine manufacturing provinces was aggravated.
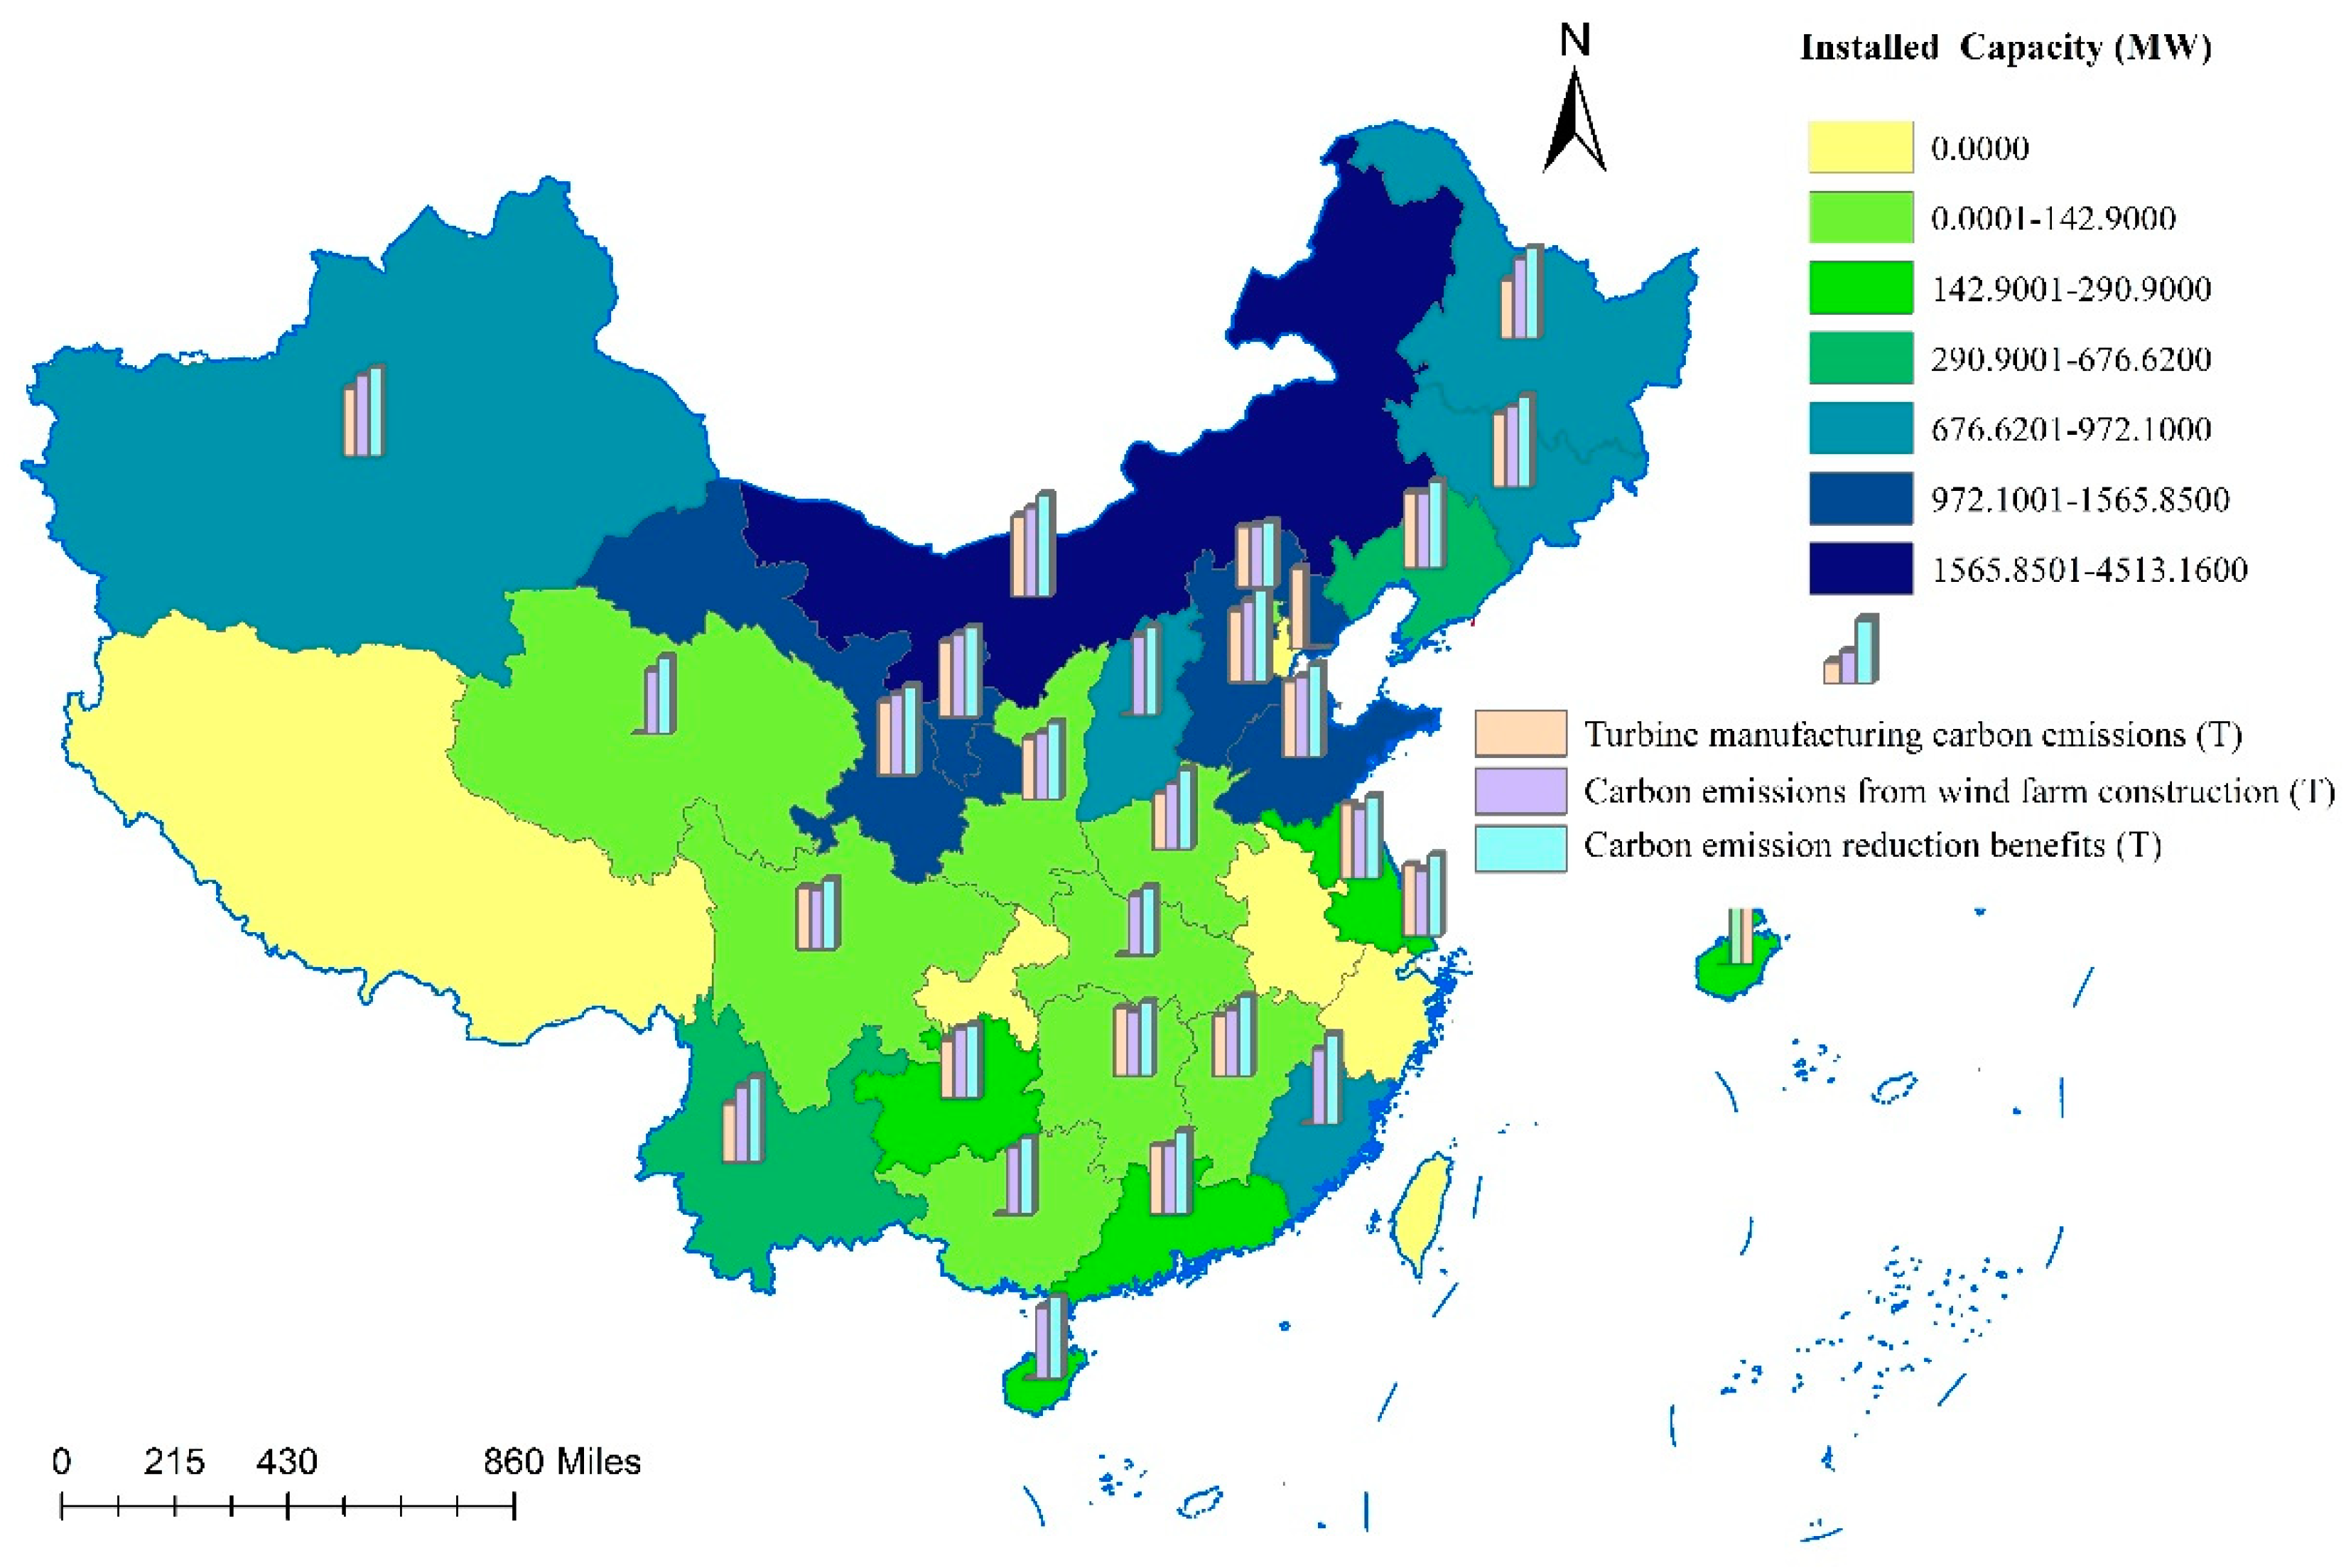
Figure 8 shows the distribution of carbon emissions from turbine manufacturing and wind farm construction, and the emission reduction benefits in different provinces. The direct emission reduction benefit refers to the reduction in carbon emissions due to wind penetration, which is calculated by multiplying the on-grid wind power and the baseline emission factors of each province. At the national level, the total emission reduction benefits are very significant and reach 1.47 × 10⁸ T. Moreover, it can be seen from Figure 8 that some provinces have significant wind power emission reduction benefits, such as Inner Mongolia (5.32 × 10⁷ T), Shandong (1.15 × 10⁷ T), Hebei (1.05 × 10⁷ T), Jilin (9.75 × 10⁶ T), Heilongjiang (7.85 × 10⁶ T), Fujian (7.16 × 10⁶ T), and Ningxia (7.04 × 10⁶ T). Due to rich wind energy resources, these provinces have large amounts of installed capacity and longer hours of operation for power generation, resulting in significant emission reduction benefits. Generally speaking, the more abundant the wind resources are, the more hours of operation for power generation are, the more carbon emission will be reduced.
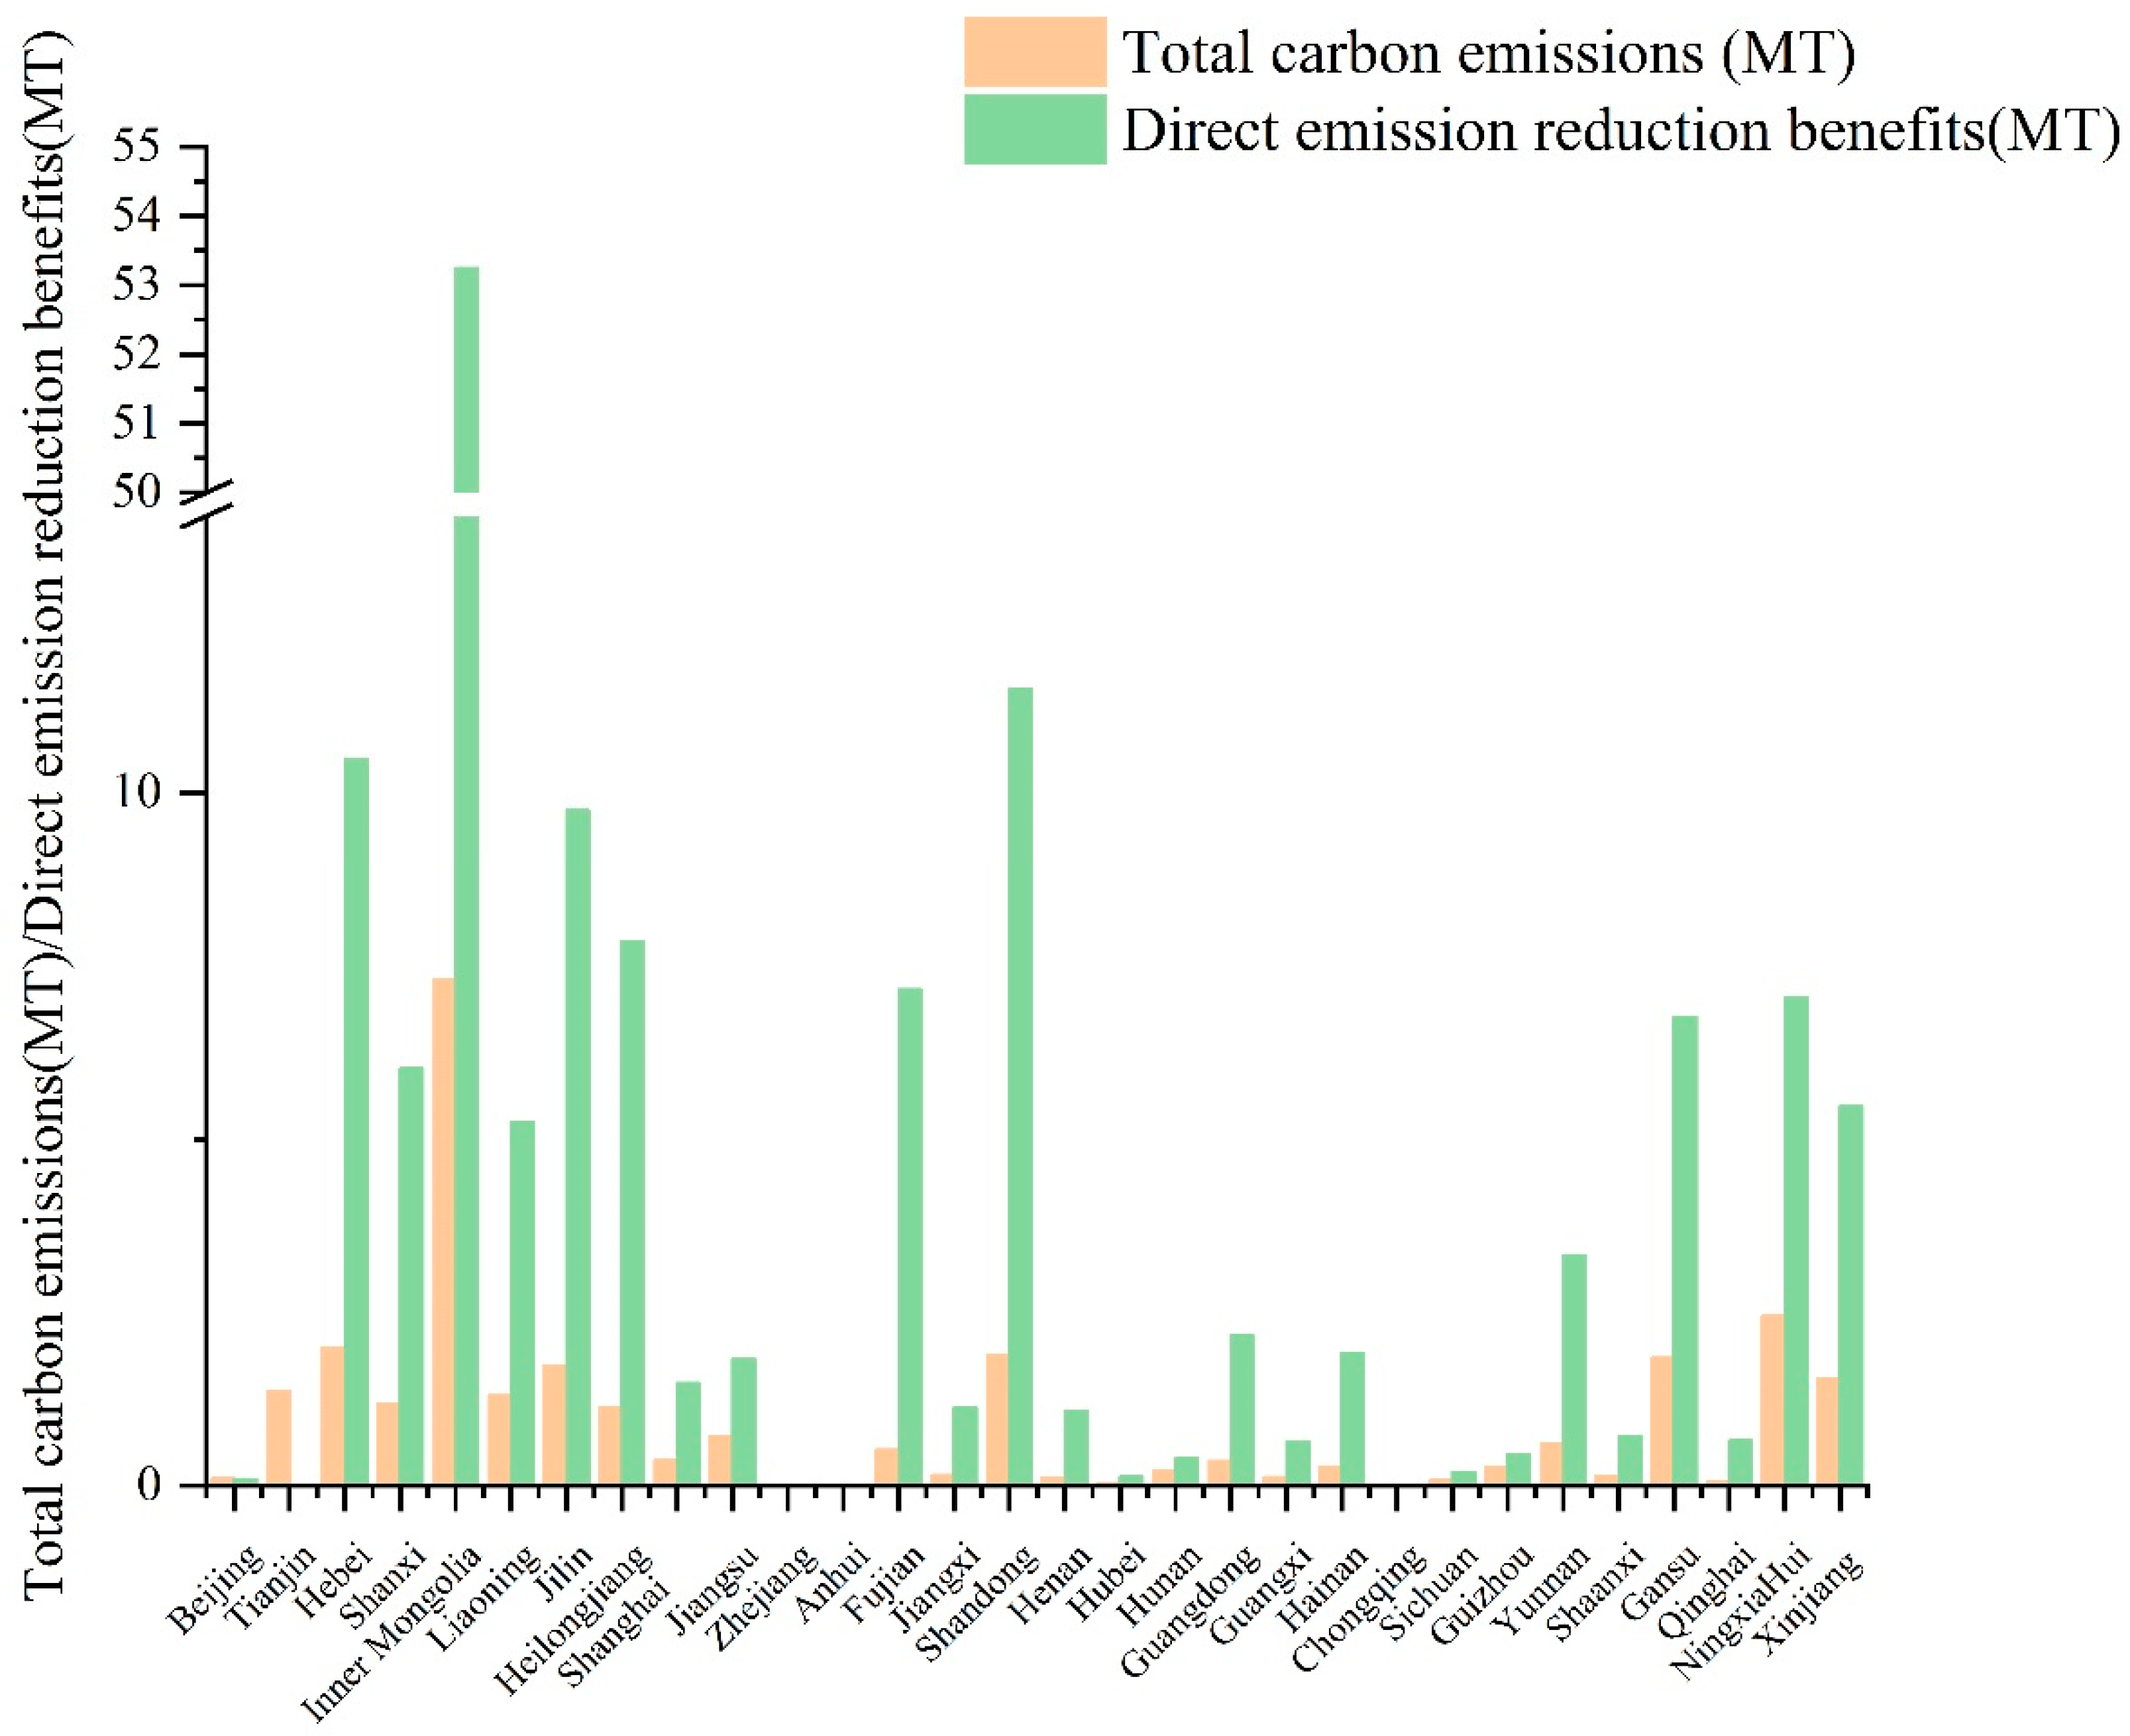
Figure 9 shows the comparison of total carbon emissions and direct emission reduction benefits in different provinces, as well as the net emission reduction effects. The overall net emission reduction benefits of wind power in China are positive, reaching 118.89 MT. As shown in Figure 9, regions with obvious net emission reduction benefits include Inner Mongolia (45.95 MT), Shandong (9.62 MT), Hebei (8.49 MT), Jilin (8.02 MT), Heilongjiang (6.73 MT), Gansu (4.92 MT), Shanxi (4.85 MT), Ningxia (4.59 MT), and Liaoning (3.95 MT). In these provinces, due to the abundant wind resources and stable wind speed, lots of wind farms are built, resulting in large installed capacity and large wind power generation. Therefore, there are prominent emission reduction benefits due to wind power penetration. Provinces with negative net emission reduction impacts are Tianjin (−2.799 MT), Beijing (−0.06.7 MT). In these provinces, the direct emission reduction benefits due to wind power generation are lower than the carbon emissions generated by turbine manufacturing or wind farm construction, i.e., extra carbon burden is exerted on these provinces to support the national wind power development.

4. Uncertainty Analysis

LCA may results in slightly different results when different methods are employed. To ensure the accuracy of our results, uncertainty analysis was conducted. In this assessment, the uncertain parameters include: A (direct consumption coefficient in IO table) and Y (material inputs). For A (direct consumption coefficient) in Equation. (2), the 2002–2015 MRIO tables were used to ensure that the changing characteristics of the industrial structure in the research period are reflected. In terms of Y, the uncertainty of material inputs in inventory analysis was reduced by investigating engineering details and choosing the most reliable data sources from different databases. In addition, the results of this paper are compared with the results of other studies, as shown in Table 4. The results from other studies show that turbine manufacturing carbon emissions account for 25.1–46.87% of total carbon emissions and construction and operation carbon emissions account for 36.64–76.74% of total carbon emissions. The results we get obtained in this study fall within this interval, reflecting its rationality and creditability.

5. Conclusions and Policy Implications

This paper established an IO-LCA framework to account for the lifetime carbon emissions of 378 wind farms. The carbon emissions from the turbine manufacturing, wind farm construction, and operation stages were considered under the LCA framework. The IO-LCA was used to calculate the regional and sectoral distributions of total carbon emissions. Moreover, the embodied carbon emission transfers from the location of wind farm operation to upstream wind turbine manufactory regions were traced. Compared with the baseline emission factors of each province, the net emissions reduction effect of each region was calculated due to the development of wind power. The main conclusions and policy recommendations are as follows:
Concerning different types of wind turbine, turbines with lower carbon emissions per unit of power generation should be promoted. As the materials used in manufacturing are mainly concentrated in the Smelting and Pressing of Metals sector and the Nonmetal Mineral Products sector, the key is to reduce carbon emission in material production. Investment in research and development (R&D) should be increased to reduce carbon emissions in equipment manufacturing. At the same time, as the operation stage also includes the replacement of turbine parts, green materials should be considered as a priority. For example, the blades can be made of carbon fiber as a substitution. Carbon emissions from wind farm construction are mainly concentrated in the Nonmetal Mineral Products sector. Therefore, in the construction stage of wind farm, green building materials should be used. Moreover, construction plans should be reasonably formulated and the utilization efficiency of construction machinery should be improved to reduce carbon emissions.
At the national level, the net emission reduction benefits brought about by the development of wind power are far greater than the lifetime carbon emissions. Considering the transfer of carbon emissions among provinces, for instance, 28.21% of the carbon emissions of turbines manufactory in Liaoning are driven by demands on wind turbines in Hebei, Xinjiang, and Inner Mongolia. Therefore, regions (such as Hebei, Xinjiang, and Inner Mongolia) that delivered carbon emissions to other regions should bear more emission reduction responsibility and should provide financial and technical support to other high emission regions (like Liaoning). For the regions (such as Liaoning) that bear more carbon emissions to support the wind power development of other regions, a higher initial carbon quota should be allocated. Meanwhile, the local government should give subsidies to guide the reasonable layout of wind turbine manufacturers in different provinces.

Author Contributions

Data curation, software and writing—original draft preparation, X.B.; conceptualization, methodology, and supervision, J.Y.; visualization and investigation, S.Y. All authors have read and agreed to the published version of the manuscript.

Funding

This research was funded by National Natural Science Foundation of China (No. 72174187, 71704164, 71904017) and was also funded by Fundamental Research Funds for the Central Universities] grant number (No. 2652018248).

Institutional Review Board Statement

Not applicable.

Informed Consent Statement

Not applicable.

Data Availability Statement

Not applicable.

Acknowledgments

This research was financially supported by the National Natural Science Foundation of China (No. 72174187, 71704164, 71904017) and the Fundamental Research Funds for the Central Universities (2652018248).

Conflicts of Interest

There is no conflict of interest.

References

  1. Future of Wind-Irena. Available online: https://irena.org/-/media/Files/IRENA/Agency/Publication/2019/Oct/IRENA_Future_of_wind_2019_summ_EN.PDF?la=en&hash=D07089441980EBABC7F4BED63B62C83820C18724 (accessed on 11 December 2021).
  2. Yang, J.; Chen, B. Integrated evaluation of embodied energy, greenhouse gas emission and economic performance of a typical wind farm in China. Renew. Sustain. Energy Rev. 2013, 27, 559–568. [Google Scholar] [CrossRef]
  3. Yang, D.; Liu, J.; Yang, J.; Ding, N. Carbon footprint of wind turbine by life cycle assessment. Acta Sci. Circumstantiae 2015, 35, 927–934. (In Chinese) [Google Scholar]
  4. Gomaa, M.R.; Rezk, H.; Mustafa, R.J.; Al-Dhaifallah, M. Evaluating the Environmental Impacts and Energy Performance of a Wind Farm System Utilizing the Life-Cycle Assessment Method: A Practical Case Study. Energies 2019, 12, 3263. [Google Scholar] [CrossRef] [Green Version]
  5. Li, H.; Jiang, H.; Dong, K.; Wei, Y.; Liao, H. A comparative analysis of the life cycle environmental emissions from wind and coal power: Evidence from China. J. Clean. Prod. 2020, 248, 119192. [Google Scholar] [CrossRef]
  6. Xu, L.; Pang, M.; Zhang, L.; Poganietz, W.R.; Marathe, S.D. Life cycle assessment of onshore wind power systems in China. Resour. Conserv.Recycl. 2018, 132, 361–368. [Google Scholar] [CrossRef]
  7. Al-Behadili, S.H.; El-Osta, W.B. Life Cycle Assessment of Dernah (Libya) wind farm. Renew. Energy 2015, 83, 1227–1233. [Google Scholar] [CrossRef]
  8. Alsaleh, A.; Sattler, M. Comprehensive life cycle assessment of large wind turbines in the US. Clean Technol. Environ. Policy 2019, 21, 887–903. [Google Scholar] [CrossRef]
  9. Arvesen, A.; Hertwich, E.G. Assessing the life cycle environmental impacts of wind power: A review of present knowledge and research needs. Renew. Sustain. Energy Rev. 2012, 16, 5994–6006. [Google Scholar] [CrossRef] [Green Version]
  10. Pairotti, M.B.; Cerutti, A.K.; Martini, F.; Vesce, E.; Padovan, D.; Beltramo, R. Energy consumption and GHG emission of the Mediterranean diet: A systemic assessment using a hybrid LCA-IO method. J. Clean. Prod. 2015, 103, 507–516. [Google Scholar] [CrossRef]
  11. Henriques, C.O.; Coelho, D.H.; Cassidy, N.L. Employment impact assessment of renewable energy targets for electricity generation by 2020—An IO LCA approach. Sustain. Cities Soc. 2016, 26, 519–530. [Google Scholar] [CrossRef]
  12. Beylot, A.; Corrado, S.; Sala, S. Environmental impacts of European trade: Interpreting results of process-based LCA and environmentally extended input–output analysis towards hotspot identification. Int. J. Life Cycle Assess. 2020, 25, 2432–2450. [Google Scholar] [CrossRef] [Green Version]
  13. Feng, K.; Davis, S.J.; Sun, L.; Li, X.; Guan, D.; Liu, W.; Liu, Z.; Hubacek, K. Outsourcing CO2 within China. Proc. Natl. Acad. Sci. USA 2013, 110, 11654–11659. [Google Scholar] [CrossRef] [PubMed] [Green Version]
  14. Su, Z.; Long, R. Embodied Carbon in China’s Exports Based on the Rationality Index. Resour. Sci. 2013, 35, 1220–1228. (In Chinese) [Google Scholar]
  15. Wang, Z.; Yang, L. An Analysis of Household Indirect Energy Consumption in China based on Ecological Footprint. Sci. Res. Manag. 2014, 35, 128–135. (In Chinese) [Google Scholar]
  16. Wang, Z.; Liu, W.; Yin, J. Driving forces of indirect carbon emissions from household consumption in China: An input–output decomposition analysis. Nat. Hazards 2015, 75, 257–272. [Google Scholar] [CrossRef]
  17. Liu, Z.; Davis, S.J.; Feng, K.; Hubacek, K.; Liang, S.; Anadon, L.D.; Chen, B.; Liu, J.; Yan, J.; Guan, D. Targeted opportunities to address the climate–trade dilemma in China. Nat. Clim. Chang. 2016, 6, 201–206. [Google Scholar] [CrossRef]
  18. Tian, C.; Zhang, S. Source Decomposition Analysis of Carbon Footprint in China’s Industry Supply Chain: Based on IO-LCA Model. J. Environ. Econ. 2019, 4, 58–75. (In Chinese) [Google Scholar]
  19. Wang, W.; Cui, W.; Wang, Q. Environmental Impact Analysis Based on Product Life Cycle Assessment. J. Technol. 2020, 20, 176–180, 188. (In Chinese) [Google Scholar] [CrossRef]
  20. Li, Q.; Duan, H.; Xie, M.; Kang, P.; Ma, Y.; Zhong, R.; Gao, T.; Zhong, W.; Wen, B.; Bai, F.; et al. Life cycle assessment and life cycle cost analysis of a 40 MW wind farm with consideration of the infrastructure. Renew. Sustain. Energy Rev. 2021, 138, 110499. [Google Scholar] [CrossRef]
  21. Wang, C.; Malik, A.; Wang, Y.; Chang, Y.; Lenzen, M.; Zhou, D.; Pang, M.; Huang, Q. The social, economic, and environmental implications of biomass ethanol production in China: A multi-regional input-output-based hybrid LCA model. J. Clean. Prod. 2020, 249, 119326. [Google Scholar] [CrossRef]
  22. Hertwich, E.G.; Gibon, T.; Bouman, E.A.; Arvesen, A.; Suh, S.; Heath, G.A.; Bergesen, J.D.; Ramirez, A.; Vega, M.I.; Shi, L. Integrated life-cycle assessment of electricity-supply scenarios confirms global environmental benefit of low-carbon technologies. Proc. Natl. Acad. Sci. USA 2015, 112, 6277–6282. [Google Scholar] [CrossRef] [PubMed] [Green Version]
  23. Li, X.; Feng, K.; Siu, Y.; Hubacek, K. Energy-water nexus of wind power in China: The balancing act between CO2 emissions and water consumption. Energy Policy 2012, 45, 440–448. [Google Scholar] [CrossRef]
  24. Nagashima, S.; Uchiyama, Y.; Okajima, K. Hybrid input–output table method for socioeconomic and environmental assessment of a wind power generation system. Appl. Energy 2017, 185, 1067–1075. [Google Scholar] [CrossRef] [Green Version]
  25. Xin, L.; Feng, K.; Siu, Y.; Hubacek, K. Challenges faced when energy meets water: CO2 and water implications of power generation in inner Mongolia of China. Renew. Sustain. Energy Rev. 2015, 45, 419–430. [Google Scholar] [CrossRef]
  26. Acquaye, A.A.; Wiedmann, T.; Feng, K.; Crawford, R.H.; Barrett, J.; Kuylenstierna, J.; Duffy, A.P.; Koh, S.C.L.; McQueen-Mason, S. Identification of ‘Carbon Hot-Spots’ and Quantification of GHG Intensities in the Biodiesel Supply Chain Using Hybrid LCA and Structural Path Analysis. Environ. Sci. Technol. 2011, 45, 2471–2478. [Google Scholar] [CrossRef] [Green Version]
  27. Suh, S.; Huppes, G. Methods for Life Cycle Inventory of a product. J. Clean. Prod. 2005, 13, 687–697. [Google Scholar] [CrossRef]
  28. Wiedmann, T.O.; Suh, S.; Feng, K.; Lenzen, M.; Acquaye, A.; Scott, K.; Barrett, J.R. Application of Hybrid Life Cycle Approaches to Emerging Energy Technologies—The Case of Wind Power in the UK. Environ. Sci. Technol. 2011, 45, 5900–5907. [Google Scholar] [CrossRef]
  29. Ewertowska, A.; Galán-Martín, A.; Guillén-Gosálbez, G.; Gavaldá, J.; Jiménez, L. Assessment of the environmental efficiency of the electricity mix of the top European economies via data envelopment analysis. J. Clean. Prod. 2016, 116, 13–22. [Google Scholar] [CrossRef]
  30. Ji, S.; Chen, B. Carbon footprint accounting of a typical wind farm in China. Appl. Energy 2016, 180, 416–423. [Google Scholar] [CrossRef]
  31. Joshi, S. Product Environmental Life-Cycle Assessment Using Input-Output Techniques. J. Ind. Ecol. 1999, 3, 95–120. [Google Scholar] [CrossRef]
  32. Chen, G.; Yang, Q.; Zhao, Y. Renewability of wind power in China: A case study of nonrenewable energy cost and greenhouse gas emission by a plant in Guangxi. Renew. Sustain. Energy Rev. 2011, 15, 2322–2329. [Google Scholar] [CrossRef]
  33. Crawford, R.H. Life cycle energy and greenhouse emissions analysis of wind turbines and the effect of size on energy yield. Renew. Sustain. Energy Rev. 2009, 13, 2653–2660. [Google Scholar] [CrossRef]
  34. Rashedi, A.; Sridhar, I.; Tseng, K.J. Life cycle assessment of 50 MW wind firms and strategies for impact reduction. Renew. Sustain. Energy Rev. 2013, 21, 89–101. [Google Scholar] [CrossRef]
  35. Ozoemena, M.; Hasan, R.; Cheung, W. Analysis of technology improvement opportunities for a 1.5 MW wind turbine using a hybrid stochastic approach in life cycle assessment. Renew. Energy 2016, 93, 369–382. [Google Scholar] [CrossRef]
  36. Noorollahi, Y.; Bina, S.M.; Rahmani, K. Life Cycle Energy and Greenhouse Gas Emission Assessment of a Wind Turbine Installed in Northeast of Iran. Int. J. Energy Policy Manag. 2018, 3, 8–15. [Google Scholar]
  37. Jensen, J.P. Evaluating the environmental impacts of recycling wind turbines. Wind. Energy 2019, 22, 316–326. [Google Scholar] [CrossRef]
  38. Pan, C.; Peters, G.P.; Andrew, R.M.; Korsbakken, J.I.; Li, S.; Zhou, P.; Zhou, D. Structural Changes in Provincial Emission Transfers within China. Environ. Sci. Technol. 2018, 52, 12958–12967. [Google Scholar] [CrossRef]
  39. Gao, C.; Dong, J.; Zhu, W.; Wang, W. Environmental load analysis of wind turbines based on life cycle assessment. J. Northeast. Univ. 2012, 33, 1034–1037. [Google Scholar]
  40. Yang, Q.; Chen, G.; Zhao, Y.; Chen, B.; Li, Z.; Zhang, B.; Chen, Z.; Chen, H. Energy cost and greenhouse gas emissions of a Chinese wind farm. Procedia Environ. Sci. 2011, 5, 25–28. [Google Scholar] [CrossRef] [Green Version]
Figure 1. Methodological framework.
Energies 15 00198 g001
Figure 2. System boundary.
Energies 15 00198 g002
Figure 3. Distributions of wind farms by province.
Energies 15 00198 g003
Figure 4. Comparison of carbon emissions of different types of wind turbines.
Energies 15 00198 g004
Figure 5. Total carbon emissions and emissions per unit of electricity generation in each province.
Energies 15 00198 g005
Figure 6. Proportion of carbon emissions from different sectors in each province.
Energies 15 00198 g006
Figure 7. The transfer of embodied carbon emissions among provinces.
Energies 15 00198 g007
Figure 8. Distribution of carbon emissions and emission reduction benefits in different provinces (Note: Figure 8 shows the logarithm of real value).
Energies 15 00198 g008
Figure 9. Emission reduction benefits of each province.
Energies 15 00198 g009
Table 1. Material inventory for six types of wind turbines.
StagesInputs0.66 MW0.85 MW1.25 MW1.5 MW2 MW3 MW
Turbine ManufacturingMaterials (t) TurbineMaterialMass (t) MaterialMass (t) MaterialMass (t) MaterialMass (t) MaterialMass (t) MaterialMass (t)
Steel66.43Steel90.86Steel101Steel193.31Steel237.21Steel222.34
Polyethene11.38R-F20.07Iron17.1Cast iron21.03Cast iron23.64R-F5.02
Al8.37Iron19.20Cast iron11.4Copper15.4Fiberglass11.24Iron4.80
Cast iron6.00Copper1.05R-F6.60Concrete12.00Casting9.49Copper3.99
Polybutadiene5.14Paint0.93Fiberglass4.40Fiberglass7.48Concrete7.20Al2.31
GRP4.95Al0.60Copper3.80Paint5.29Al4.07Paint1.24
Copper3.76PVC0.18Silica0.40Epoxy resin4.55Polymer3.83PVC0.70
Painting0.39 Polyester resin2.16Carbon fiber2.76
Polypropylene0.12 Iron1.55GRP1.89
Lubricant0.11 Electronics2.47Copper1.55
PVC0.07 PVC1.99Adhesive1.36
Bronze0.01 Gear oil0.94Lubricant1.28
Polyethene0.69Wires1.28
Al0.23Panting0.65
Polyamide0.23Paint0.63
Others3.85China0.01
Brass0.04
ConstructionFoundationConcrete4097.28Concrete480Concrete365Concrete575Concrete1116Concrete1140
Steel122.53Steel15Steel43.5Steel39.54Steel58.53Steel36
Amount (Ten thousand yuan)Electric equipment39.0150.2473.8988.67118.22177.33
Transport and storage4.095.267.749.2912.3818.57
Metering equipment0.170.210.320.380.510.76
Traffic equipment0.931.201.772.122.834.24
Other manufacturing123.01158.40232.98279.58372.77559.16
Technical Services48.9162.9992.64111.16148.22222.33
OperationEquipment replacement1.131.462.142.573.435.14
Soil and water conservation5.116.589.6811.6215.4923.24
Note: Al: aluminum, R-F: Resin fiber, GRP: Glass reinforced plastic.
Table 2. Correspondence of MRIO and materials inputs.
Sector CodeMRIO SectorsSector CodeSector of National Economy Industry Classification
14Smelting and Pressing of Metals31, 32Nonferrous metals, ferrous metals, rare metal smelting and calendering processing, alloy manufacturing
12Raw Chemical Materials and Chemical Products26Chemical raw materials and chemical products manufacturing
11Petroleum Processing and Coking25Crude oil and oil products manufacturing, synthetic crude oil production, processing of nuclear fuel
17Transportation Equipment36Automobile manufacturing and spare parts manufacturing
19Electronic and Telecommunications Equipment39Communication transmission equipment, electronic computers, electronic components manufacturing
20Instruments, Meters, Cultural and Office machinery40Manufacturing of industrial automatic control system, electrical instruments and meters, environmental testing equipment, etc.
24Construction49, 59Building engineering, construction services, building installation and decoration
25Transportation, Storage, Post54, 59Road cargo transport, cargo storage, loading, unloading, handling, and other transport services
30Other Service74, 76, 77, 78Scientific research and technology services, water conservancy, environment, and public facilities management
13Nonmetal Mineral Products30Cement, stone, brick and tile, and glass and glass fiber products
18Electric Equipment and Machinery38Manufacturing of electrical machinery, wire, cable and other power stations, electrical machinery, and equipment production equipment
Table 3. The number of enterprises producing main materials of turbines.
ProvinceIron and SteelCopperAluminumGlass FiberResin
Anhui339632937
Beijing30031
Fujian402421910
Gansu1026630
Guangdong7782414069
Guangxi1057741
Guizhou619101
Hainan40700
Hebei1143125269
Henan518135185
Heilongjiang1002130
Hubei461571112
Hunan3014140818
Jilin1502771
Jiangsu11863289550
Jiangxi192660148
Liaoning586122198
Inner Mongolia1274461
Ningxia62501
Shandong896837246
Shanxi2118040
Shaanxi2426947
Shanghai10152710
Sichuan1710831611
Tianjin77162514
Xinjiang1933190
Yunnan7116602
Zhejiang256804228
Chongqing1024575
Table 4. Comparison with other research results.
Manufacturing (%)Construction & Operation (%)Wind TurbineReference
*76.74%2 MW[30]
25.10%72.3%*[32]
30.01%66.90%850 KW[39]
30%70%1.5 MW[40]
46.87%36.64%1.5 MW[2]
25.15%74.85%Six types of turbinesIn this study
Note: * means that the section is not considered in the study.
Publisher’s Note: MDPI stays neutral with regard to jurisdictional claims in published maps and institutional affiliations.