1. Introduction
The building sector accounts for 40% of the total energy consumption and, despite significant efforts in increasing energy performance, this trend is rapidly and continuously growing [
1]. Nonetheless, this sector has a significant potential for energy-saving improvements with large-scale implications: improving building performance is key to tackling the challenges of climate change and curbing the depletion of resources [
2]. Sustainability labels and the Energy Performance Certificate (EPC) aim to address this issue by providing ranking systems and benchmarks for design and construction. However, EPCs usually certify the design and rely on simulations and assumptions regarding the buildings’ construction and operation [
3,
4,
5,
6,
7]. These previous studies highlighted the gap between expectations set by energy labels and reality, reflected in higher energy bills and environmental impacts, driven particularly by modelling uncertainty in indoor temperature and occupant behavior [
8,
9]. Indeed, energy simulations are usually performed assuming that occupancy patterns follow a fixed and repetitive daily schedule, which is a simplification of the real-time building occupancy [
10]. The same assumption is then traditionally employed to design the heating, ventilation and air conditioning (HVAC), coupled with a simplified thermal zoning model, usually divided only between perimeter and central zones by orientation. Ultimately, HVAC systems designed following these assumptions are then operated accordingly, managing the indoor thermal environment through the building automation system (BAS). Despite recent advancements in the field that allow the use of occupancy sensors for BAS optimization, reliance on overly simplified building thermal response models and the lack of dynamic analysis and prediction of the occupancy hinders the possibility to exploit these systems to their full potential [
11]. In fact, occupancy-based energy management informed by observations of occupants’ behavior and use of the space are recognized as key to optimizing both energy efficiency and thermal comfort within commercial buildings [
12,
13], as the lack of reliable occupancy information leads to improper conditioning strategies [
13,
14,
15]. HVAC systems designed accordingly to supply the needs of simplified models are incapable of offering the level of responsiveness necessary to adopt smarter management strategies based on a demand-supply approach at a finer scale that catheterizes ABW-supportive workplaces. For this reason, occupancy prediction in energy simulations is a fast-growing research field, supported by the available building-related data due to the fast uptake of ICT and IoT (Internet of Things) technologies within the built environment [
10]. Data analytics may unlock the full potential of the current technologies used to detect occupancy and lead to significant energy management improvements [
16], as accurate and realistic occupancy information is recognized to be the foundation of proper occupancy-based HVAC management strategies and energy consumption prediction [
17]. However, all the monitored data and available information are rarely implemented in the building management system BMS, making it difficult to quantify and assess their possible effect on the building energy performance over time [
10].
In this regard, occupancy models, built upon information of occupants’ presence and behavior in the building, are the missing link between real-time space use and energy modelling and management [
18,
19]. Nevertheless, most of the studies on predicted occupancy-based energy performance present low resolution and spatial characterization of these models [
20]. Indeed, most of these studies analyzed single-occupied offices or multi-occupied offices modelled as lumped thermal zones [
20]. Furthermore, the analysis of occupancy patterns is used to define an optimized HVAC schedule obtained by grouping occupants with similar patterns or preferences [
10,
21,
22]. Few studies have focused on the development of an algorithm that could control HVAC based on real-time occupancy [
19,
23,
24]. The necessity to overcome the simplified approach based on re-assignment of office space or desk position in open-plan offices becomes essential in the perspective of activity-based workplace (ABW) models, which is gaining importance in the commercial sector [
25]. ABW relies on the concept that different work tasks need to be supported by different typologies of the physical environment, thus offering a variety of different locations for concentration, collaboration, and interactions. Workers are free to choose their desk location based on their needs and preference and to change location as they wish during the day [
26,
27,
28]. ABW-supportive offices are characterized by high levels of flexibility and fluidity in their occupancy patterns, and the live monitoring of the occupants’ movements is essential for the HVAC optimization, as opposed to the grouping of occupants with similar patterns, which is, by definition, in contrast with the ABW fundamental assumption. Currently, none of the studies on occupancy-based HVAC management have attempted to understand and quantify the potential savings concerning ABW-supportive offices. One of the main reasons is the high level of resolution needed for the analysis, which is rarely available.
This paper explores the cooling energy performance of an ABW-supportive office based on real occupancy data at the individual desk level, built upon a one-year data collection campaign. The objective of this study is to analyze the cooling needs associated with different occupancy scenarios applied to the specific case of an ABW office located in Sydney (Australia). It investigates the existing energy gap between the predicted performance, used for the energy certification and assessed through the simplified model, and the real occupancy-based performance. The comparison is used as a proxy for the energy-saving potential to assess and estimate the benefits, if any, that can be found by deploying a smart HVAC management system to take full advantage of the sensor network and occupancy-detection strategies typically implemented in most ABWs. The analysis emphasizes the need for more data and monitoring campaigns for a more accurate and robust energy management strategy, and it opens the discussion about the possible implementation of occupancy-based energy management in flexible working environments, characterized by high fluidity of space utilization, indoor heat gains and thermal comfort requirements.
The novelty of this work lies in the high-resolution of the analysis, which is performed for the first time at the desk level. This fine grid assessment allows the potential impacts of more responsive HVAC systems to be determined, opening the discussion about the use of personal comfort systems as integrated comfort devices in ABW-supportive offices.
This study is an exploratory proof of concept, and it is performed in the framework of an innovative multidisciplinary research project that investigates occupancy patterns, motivation and implications within ABW-supportive offices. The overall objective of the present study is to determine benefits, challenges, and barriers of the adoption of ABW-supportive offices on a large scale, particularly looking at the three pillars: workers, buildings and cities. The aim is to determine whether innovative working precincts can support healthier and more sustainable built environments.
Structure of the Paper
This paper is organized into five main sections, besides the introduction.
Section 2, “Literature Review”, presents an overview of the current research progress and trends in the field, specifically looking at those studies that focus on occupancy and response-supply HVAC systems in offices. The scope of this section is to provide the framework and explain the novelty of this research.
Section 3, “Materials and Methods”, describes the procedure followed in this analysis. As this paper relies on building simulations, this section focuses on the assumptions used in the simulation software. Particularly, the sub-sections report simulation inputs regarding:
Section 4, “Results and Discussion”, analyses the simulation results and relates the findings with existing studies and knowledge.
Finally,
Section 5, “Conclusions”, summarizes the analysis and the main findings while discussing limitations and future studies.
2. Literature Review
The so-called energy performance gap identifies the discrepancy in energy consumption between the prediction and the actual use. De Wilde [
3] conducted a literature review and discerned three major typologies of gaps between (1) consumption predicted through building simulation models and actual metered energy used, (2) consumption predicted through machine learning techniques and actual metered energy used, and (3) consumption predicted at the design stage and consumption indicated in the energy certificate. Starting from the third definition, Cozza et al. [
8] conducted a thorough literature review on the energy performance certificates to reveal those parameters that contribute to generating the gap. In their studies, they introduced the concept of ‘optimal consumption’ as that value that sits between the theoretical consumption, predicted during the design stage, and the actual consumption, metered during the operational phase. They also indicated those parameters that can close the gap between these three values, identifying occupancy modelling during the prediction phase as a major player. Similarly, Van Dronkelaar et al. [
7] investigated 62 buildings and quantified the energy gap to be approximately 34% of the total energy used, with a standard deviation of 55%. A detailed analysis of the dominant factors indicated that the uncertainties in modelling occupant behavior can impact the gap in the range of 10% to 80%. The relevance of the internal heat gains due to occupancy as a source of prediction error is reiterated by Molin et al. [
29], who compared the annual energy use obtained through building simulations and measured different Swedish low-energy buildings. Their results indicated that the simulated energy was 7% lower than the measured values, mainly due to the internal heat gains, which was identified as the most important factor for the energy performance. Further, the difference between prediction and actual performance can be found in indoor thermal quality as well. Gaceo et al. [
30] monitored 700 houses in Spain for 7 years and compared their performance with the predicted performance, revealing that the temperature difference varied up to 5 °C, which can be translated into energy consumption, considering that 1 °C can lead to a 7% increase in energy.
Despite all major building energy certificates and building standards still relying on a fixed occupancy schedule, the benefits of using occupancy patterns derived from observations and actual trends are significant. For example, Menezes et al. [
5] suggested using post-occupancy evaluation (POE) to gather the relevant knowledge to increase the accuracy of the models usually employed for the energy prediction, further indicating that POE-based assumptions in prediction modelling can lead to results within 3% of the actual energy consumption.
Real occupancy patterns can not only increase the accuracy of energy prediction, hence closing the performance gap, but can also be employed in the heating, ventilation and air conditioning (HVAC) system management and operation. Earlier studies investigated demand-driven control strategies clustering occupants with similar thermal requirements. Yang et al. [
22] demonstrated that HVAC operation schedules based on personalized demand can save up to 9% of the total energy. Following this idea, Capezzoli et al. [
10] grouped occupants based on their occupancy patterns, finding that an occupancy-based HVAC system reduces energy consumption by 14% compared to occupancy-independent systems.
However, with the advent of new sensing technologies and prediction algorithms, these clustering strategies have been superseded in favor of real-time control strategies, which appear to better suit open-plan offices without assigned workstations. Model predictive control (MPC) uses real-time occupancy sensing coupled with energy prediction to optimize both energy and comfort [
31].
Dong and Lam [
32] tested an MPC system on two bays of an open plan office, obtaining an average energy saving of almost 19% for both bays when compared to a standard HVAC schedule-based operation. Similarly, Corbin et al. [
33] coupled real-time optimization and MPC, connecting EnergyPlus to the building automation system, obtaining up to 54% energy savings. This percentage has been exceeded by Zaho et al. [
34], who found that the same system was able to reduce energy consumption by almost 62%.
The majority of the studies were performed in open-plan offices; however, Aftab et al. [
11] demonstrated the feasibility of the system in public indoor spaces where people are free to circulate. In their study, a highly accurate detecting system allowed 30% energy savings to be achieved using low-cost software (Raspberry Pi), indicating that MPC can be highly feasible in real settings.
MPC can be further refined by feeding the predicting algorithms with both occupancy and weather forecast data [
35]. Širokỳ et al. [
36] investigated these systems for heating, discovering a potential for energy reduction in the range of 15% to 28%, while Ascione et al. [
37] aimed at optimizing set point temperatures with a day-ahead planning horizon, demonstrating that this strategy can save operating costs up to 56%. However, all these studies account for either a very simple geometry, with only a few thermal zones or low-resolution occupancy detection. For example, Wang et al. [
22] used a detailed spatial occupancy detection, but a two-zone architectural model; Zhou et al. [
38] divided the space into four thermal zones; Dong and Lam [
32] studies was proved for a maximum of four occupants; and Goyal et al. [
39] undertook a theoretical study on a single thermal zone.
This study responds to the need for accurate occupancy detection coupled with a fine-grained architectural geometry while, for the first time, assessing the energy-saving potential associated with an ABW-supportive office.
3. Materials and Methods
The whole-building simulation uses a real case study to integrate a real-time occupancy scenario. The analysis is performed following a standard simulation approach using DesignBuilder, one of the most diffused whole building thermal simulation software. The model was built starting from the architectural drawings and, when no information was available, the assumptions have been based on the Australian National Construction Code (NCC) [
40]. The climate data has been retrieved from the 2021 TMY (typical meteorological year) database [
41], published by the Scientific and Industrial Research Organisation (CSIRO), an Australian Government agency responsible for scientific research.
The following sections describe the simulation inputs used in this analysis.
3.1. Building and Envelope
The case study used for this analysis is a commercial building located in Sydney Centre, Australia, which accommodates one large financial organization as sole tenancy. The whole building is approximately 26,000 m
2, and it is distributed over 12 floors, all connected through a central atrium. This building was designed as a 6-star Green Star Office and a 5-star NABERS energy rating, which is the National Australian Built Environment Rating System [
42], which certifies the energy efficiency of a commercial building based on the actual energy bills.
The exploratory nature of the study limits the analysis to one floor, floor eight. This floor is considered to be a good proxy for the whole building concerning layout and fit outs. The office is designed to offer the maximum flexibility of spaces, with several different typologies of furniture used to encourage different working environments. Individual cockpits and small meeting rooms are also provided to offer spaces for concentrated working and small team-based collaborative working. These features are essential to support the fluidity of spatial use typical of ABWs, which, ultimately, results in varying occupancy patterns. To account for the atrium, the thermal model includes the entire building, whereas all floors are modelled with standard internal gains. The eighth floor is modelled in detail to accommodate the desk-level occupancy scenario.
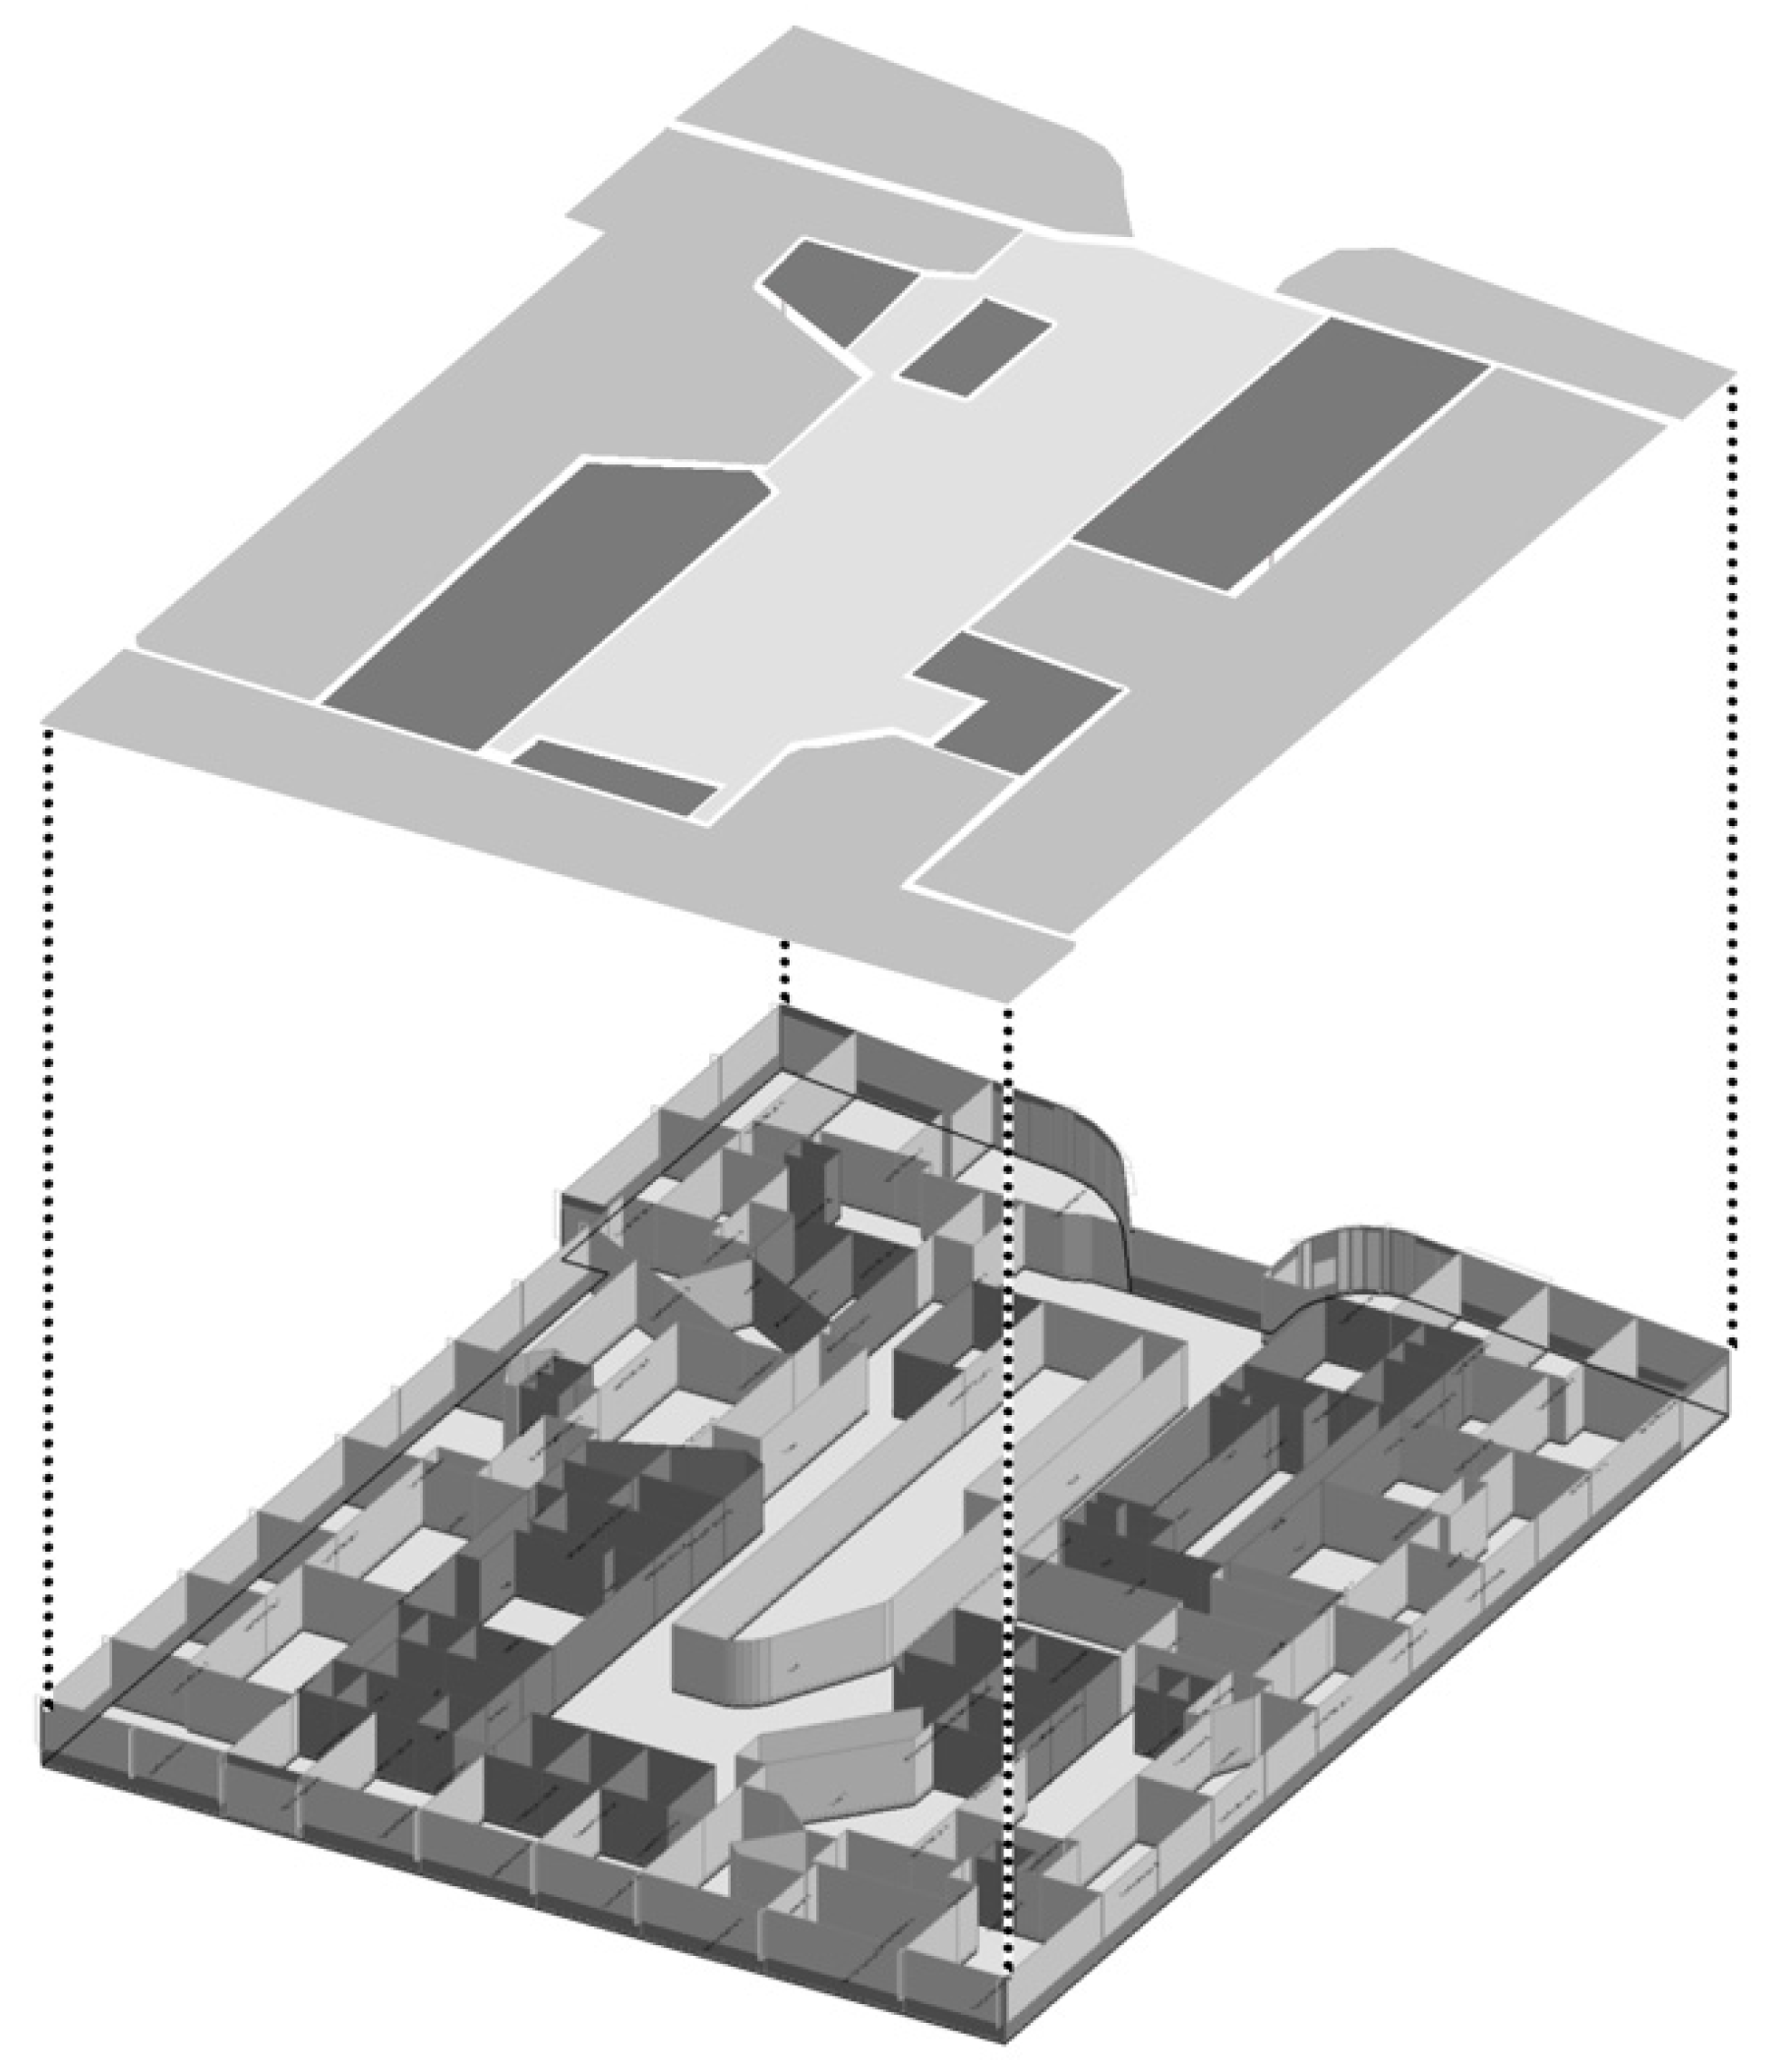
Simplified geometry: The simplified geometry model is designed according to the standard practice usually employed for energy certification and HVAC design. The floorplate is divided into zones according to orientation and proximity to the façade, resulting in four perimeter zones and four internal zones. In this case study, the internal areas are mainly dedicated to meeting rooms or services; hence, the floorplan is divided into 12 zones, as represented in
Figure 1. Of these zones, five are open-plan offices, six are meeting rooms and one is the corridor and atrium. The actual HVAC control strategy is highly similar to the proposed division, with four perimeters and two central zones, and meeting rooms equipped with occupancy sensors for temperature setback control during unoccupied hours.
Fine-grained geometry: The second geometrical model accounts for a finer resolution of the control strategy. In total, 95 different thermal zones are modelled, as represented in
Figure 1. Although the current HVAC system is not able to provide a conditioning strategy at this level of resolution, such fine granularity allows understanding of the potential benefits of a tailored HVAC management strategy based on customized conditioning load and a flexible design approach.
Facades: The façades are standard curtain walls which are completely glazed with spandrel panels to hide the slab edges, horizontal shading fins toward the east and vertical and horizontal fins toward the north. The thermal resistance of all the components is modelled based on the NCC assumptions [
40] and is reported in
Table 1 and
Table 2. According to the NCC, the thermal performance of opaque elements is expressed as an R-value, while for windows and opaque elements the U-value is used. It must be noted that the results are analyzed not as absolute values but as differences between the scenarios, minimizing the possible errors introduced by the modelling phase and the assumptions made.
3.2. Occupancy Patterns and HVAC Settings
Two different occupancy patterns have been tested to assess and quantify the impacts of the occupants’ movements and desk preferences. The first scenario is modelled based on the NABERS Handbook requirements [
43]. NABERS certifies the energy efficiency of a commercial building based on the actual energy bills. However, the Handbook is used during the design stage as a decision-making tool to guide the design toward the best outcome possible; hence, the impact on the final energy efficiency is undeniable. NABERS gives the assumptions that must be used to define the occupancy patterns and the indoor heat gains. Occupancy is expressed as a fixed daily schedule repeated weekly over a year, as shown in
Figure 2. The occupancy is expressed as a rate of the maximum capacity of each zone, with a maximum value of 0.7 from 09:00 to 17:00 on weekdays. Hence, this scenario presents not only a repetitive schedule but also stable occupancy conditions homogenous across all thermal zones.
The second scenario is built upon real-time occupancy data at the desk level for 12 continuous months. Occupants’ presence has been registered through computer logs, providing information about location and duration of time spent on each machine. A thorough analysis of the occupancy patterns and trends were focused on other separate publications by the same team. Occupancy data collection and analysis revealed that this floor was underutilized during the whole year of monitoring, due to organizational reasons and allocation of spaces. The underutilization is seen, in this study, as an unpredicted event that reinforces the discussion about the need for a more resilient HVAC design.
The data at the desk level is averaged per hour and grouped by thermal zone so that each thermal zone is characterized by a different occupancy pattern generated by the monitored data. The first iteration of simulations assumes that the HVAC system is active from 07:00 to 19:00 on weekdays, from 9:00 to 12:00 and 17:00 to 18:00 on Saturdays, and from 17:00 to 18:00 during Sunday and public holidays. The temperature is set at 24 °C during winter and 21 °C during summer. These temperatures follow the recommendation of the AS 1837-1976 [
44] to keep setpoint temperature for offices in the range of 21 °C to 24 °C. It must be noted that the common practice currently adopted in Australia often differs from this standard, and tenancy agreements often prescribe a stable 22 °C indoor temperature all year round [
45]. Although the exact reasons for this are unclear, a probable reason is the tendency to design, build and manage commercial buildings at their peaks, significantly boosting the capacity to handle possible tenant loads [
45]. In this paper, the HVAC control algorithm has not been modelled as dependent on the occupancy patterns, but it rather represents the standard case where the cooling system reacts to the internal gains deriving from occupants. This analysis allows the actual cooling loads of a commercial building characterized by fluid internal gains to be benchmarked and compared to the homogenous scenario adopted for energy certification and HVAC design.
3.3. Scenarios
Finally,
Table 3 provides a comparison of the assumptions used in the three scenarios. The only parameters that are varied are the geometrical model, the occupancy schedule and the HVAC operation settings. Although some of the parameters, such as equipment and lighting loads, are influenced by the occupancy patterns, in this study they are kept constant to isolate the effects of the HVAC design and management strategies on the cooling energy savings. Cleary, if accounted for, the final difference between the two scenarios would be even more pronounced.
4. Results and Discussion
The analysis revealed that the fine-grained real occupancy scenario allows the energy consumed by the building for cooling purposes to be reduced by up to 9.5% when compared to the fine-grained NABERS occupancy scenario and when 5% of the simplified scenario is considered, as shown in
Figure 3. Although this saving can be considered small, it is worth noting that this analysis was performed on only one floor of a 12-storey height building; hence, the total reduction may be even more significant. This result indicates that the fine-grained geometry is, alone, able to generate savings, which are further increased by a flexible demand-supply HVAC management. In ABW-supportive offices, ideally, workers can use the space freely, thus making the possible trends of occupation difficult to predict. Hence, space use, cooling loads, and energy consumption are overestimated at peaks. However, when the real occupancy is considered, it becomes clear that the responsiveness of the system is the key to reducing the overall energy consumption.
This suggests that current modelling approaches are unable to correctly estimate the cooling needs of large spaces, while the HVAC design does not provide the flexibility required by supply-demand control.
Figure 4 reports the cooling reduction percentage by thermal zone; only open-plan offices are analyzed. The bottom layer represents the thermal zoning of the fine-grained geometry, while the middle layer reports the savings introduced by the real-time occupancy scenario (fine-grained geometry and real occupancy). Finally, the top layer represents the savings introduced by the simplified scenario (simplified geometry and NABERS occupancy). All savings are calculated regarding the NABERS reference scenario, meant as the combination of fine-grained geometry and NABERS occupancy (description of the scenarios in
Table 3).
When the fine-grained scenario is considered, interestingly, the top-left corner is the only part where the real-time occupancy pattern brings higher cooling loads and, thus, may result in increased energy consumption in this specific thermal zone. This anomaly is due to the high occupancy rate of this zone, which is generally always occupied by non-nomad workers who consistently sit every day at the same location and desk throughout the year. This behavior persists despite it being against the assumed way of working the organization has adopted. Hence, the general occupancy rate results are higher than 0.7, generating higher cooling loads than expected, which is coupled with the low ability of this small thermal zone to deal with overheating. Although the overall impact of this zone does not change the general trend of cooling load reduction, this zone also highlights the unpredictability of the occupancy patterns, as well as the high fluidity in space utilization found in ABW-supportive offices from one zone to the other. The same trend is observed in the simplified geometry, where the whole thermal zone is negatively impacted, showing higher cooling loads. Considered from the HVAC management viewpoint, this finding calls for an update of the way the systems are designed and operated, to increase their adaptability to spatially and temporally variable cooling needs. Additionally, it also underlines the compelling need to expand the current knowledge about occupancy patterns and trends in ABW-supportive offices to better define HVAC management strategies that must be considered at the design stage to account for such variability.
Figure 5 shows the total cooling needs per month in all scenarios. It is evident that the real-time occupancy leads to a slight but consistent reduction of the total cooling loads. It is worth noticing that May to September corresponds to the winter period in the Southern hemisphere; hence, the cooling loads are naturally lower.
The mid-seasons register a higher potential for energy reduction, ranging from 9% to 12%. This value is the result of the mix of lower occupancy rates and variable climatic stimuli, which reduce the internal heat load. This may result in exceeding the setpoint temperature and lower temperature that minimizes the pressure on the HVAC systems.
Figure 5 suggests that the standard approach usually overestimates the cooling needs during the winter and mid-seasons, which ultimately may lead to an incorrect HVAC and definition of inappropriate maintenance strategies. It must be noted that different occupancy patterns may also result in lower energy consumption for both lighting and appliances. In this case, the total energy saving that can be expected is even higher, as is also demonstrated in precedent studies [
46,
47].
Practically, these results indicate that the adoption of PMC in the whole building may optimize the overall indoor thermal quality while reducing the energy needed to maintain comfort.
Figure 6 shows the monthly cooling load reduction achieved in the real-time occupancy scenario compared to standard occupancy per thermal zone of the open plan area. The darker color represents the savings range where most of the thermal zones of the analyzed category sit, while lighter shades represent that fewer thermal zone fit into these percentage ranges.
The thermal zones belonging to the open-plan office show a higher seasonality of the savings potential, with the peak reached during winter when the cooling loads are naturally lower. The summer savings vary between 1% and 17%, toward the lower band of the range, while in winter they vary between 7% and 66%, with the majority between 10% and 20%.
Figure 6 also shows the lowest average percentage of savings for the open-plan zones, which is achieved during early autumn, from March to May (Southern Hemisphere). However,
Table 4 indicates that the temperature may not be the driver for this tendency. Especially in the first two months, the mean minimum temperatures are still lenient and not critical enough to determine this behavior. Accordingly, the main reason can be attributed to the occupancy patterns, which determine higher indoor heating loads, and, thus, cooling needs are closer to the ones calculated with the standard-based approach. Therefore, this can indicate the presence of a seasonal variation of the benefits that can be generated with a real-time occupancy management system.
Figure 7 reports the same information related to the cockpits: the monthly cooling load reduction achieved in the real-time occupancy scenario compared to standard occupancy, per thermal zone of the open plan area. The darker color represents the savings range where most of the thermal zones of the analyzed category sit, while lighter shades represent that fewer thermal zone fit into these percentage ranges.
The trend that can be observed in this typology of space is completely different from the one observed for open-plan spaces: cockpits don’t have a seasonal prevalence, nor a major saving band. Cockpits are generally used more often than meeting rooms, as they offer an individual working environment, suitable for focused work. As such, the occupancy pattern is highly variable with a relatively quick turn-over of workers; hence, the provision of a stable comfortable thermal environment throughout the day is opted for. For this reason, strategies to optimize the temperature setpoint and the HVAC schedule are difficult to predict, and the potential energy savings are difficult to exploit. These spaces have quite stable savings throughout the year, with completely different values. The space associated with the lowest savings sits between 0.5% and 4.5%, while the one associated with the highest allows for savings between 21% and 35%. One cockpit presents a completely inverse tendency compared to the one usually found in this analysis, with the lowest savings during winter, due to its less intense use during these months. Cockpits are informal spaces designed to accommodate the frequent change of occupants during the day, and different trends highlight a strong preference for few cockpits compared to others. Despite the high energy savings achievable, it must be noted that such flexible spaces with unpredictable use call for more flexible HVAC management strategies which can adapt to the fluid occupancy patterns and assure comfortable environments.
Table 5 shows a simple calculation of the total number of hours within different temperature thresholds.
The real-time occupancy scenario presents 14% more hours within the range 21 °C to 25 °C, indicating that it is more comfortable throughout the year when compared to the scenario with a standard occupancy schedule. On the other hand, the latter scenario seems to present 20% fewer hours with the temperature above 28 °C, suggesting a possible overheating issue for the real-time occupancy scenario. However, higher temperatures are mainly registered when space is not occupied. This analysis highlights that a real-time occupancy-based HVAC management strategy may not only reduce the total energy consumption, but also lead to an improved thermal environment while offering to cool only when, and where, it is needed.
5. Conclusions
This paper investigated the energy savings derived from an occupancy-based cooling system when compared to standard occupancy schedules, which are currently applied for the energy certification system and HVAC design in Australia. It presents the case study of a large activity-based-working-supportive office, designed to offer different working environments and encourage the high fluidity of spatial use. Transient building thermal simulations have been used to quantify these savings and to analyze the different energy patterns associated with the different working environments. Results show that it is possible to identify a 9% yearly reduction of the general cooling loads for floor 8. This is suggestive of the potential for even higher benefits when the same analysis is performed at the entire building scale.
This investigation suggests that the use of over-conservative schedules and assumptions of uniform variation in loads across zones when designing HVAC systems are not capturing the opportunities for savings within activity-based workplaces, and could lead to overdesign of the systems, as well as overestimation of the energy consumption. The application of standardized occupancy schedules applied homogenously across floor plates during the energy prediction and simulation phase, as recommended in codes, does not reveal opportunities and challenges for appropriate HVAC systems, and it leads to the risk that systems could be under- or oversized without the flexibility to respond quickly to changing needs, hindering the possibility to apply a fine-grained demand-response HVAC strategy based on real occupancy profiles. Indeed, the current system is unable to provide the agility and responsiveness to scale down when necessary.
This paper highlights the opportunities for energy savings arising from variable loads coupled with the need to respond effectively when these loads are ramped up in key areas or zones. For the savings to be realized, designed HVAC systems need to be dynamically responsive (the results show high variability in occupancy at zone and desk level) to the changing heat loads. It emphasizes the need for a heightened level of collaboration between HVAC systems’ design and control strategies, including feedback loops for intelligent environmental control, to take the clear opportunity for reductions in operational cooling energy offered.
This study has potential practical implications for HVAC management and design. In particular, it indicates that employing a model predicting control strategy can reduce the energy consumption of the building, suggesting that organizations may profit from both economic and social benefits based on the energy savings and increased comfort conditions.
This study is based on a case study, and it uses a one-year occupancy dataset. Hence, the results depend on the occupancy management approach that the organization undertook during the observation period. Clearly, different approaches may lead to different quantitative results. The floor analyzed in this paper was under-occupied during the year of data collection, due to organizational management strategies that occurred in that period. Therefore, the final results may differ if a year with the standard occupation would be considered. However, during the lifetime of a building, the management approach will undoubtedly vary over time; this may also be due to unpredictable events such as lockdowns and increased work-from-home practices. This study calls for more resilient and flexible HVAC systems, able to react to different situations and provide high comfort levels, as well as energy-efficient solutions. This paper opens a discussion about activity-based workplace design, energy efficiency and indoor environments.
The limitations of this study include the use of one floor only, which prevents quantifying the overall energy savings that can be generated when a flexible demand-supply HVAC control is employed. Further, this analysis relies on energy simulation only, without validation on a real building. However, on the other hand, it employs, for the first time, one-year of real occupancy patterns monitored at a fine-grid resolution. The novelty of this work lies in the application of the principles of occupancy-based HVAC management to activity-based workplaces at the single desk resolution. This allows us to look at the savings in a very high resolution, identifying the areas and the working environments with the highest potential of reduction. Additionally, the research questions the suitability of current HVAC design strategies to fully capture the high variability of occupancy patterns in such office buildings, while paving the way for future studies on HVAC control strategies based on occupancy detection and prediction.
Future research will build upon these results to investigate and identify the cost-optimum solution that will enable the potential savings highlighted in this study to be achieved. Further, this analysis will be expanded to the whole building to understand the feasibility of demand-supply HVAC on a large scale. The economic feasibility of highly flexible HVAC systems is still an open discussion in the field, and more research may lead towards the identification of market needs and requirements to enable more sustainable, cost-beneficial and efficient solutions.


 ,
, 


