Article

A Study the Effect of Biodiesel Blends and the Injection Timing on Performance and Emissions of Common Rail Diesel Engines

1
Faculty of Automobile Technology, HaNoi University of Industry, No. 298, Cau Dien Street, Bac Tu Liem District, Hanoi 100000, Vietnam
2
BIO FRIENDS Inc., HQ 514, 199, Techno 2 Street, Yuseong District, Deajeon 34025, Korea
3
School of Mechanical Engineering, University of Ulsan, San 29, Mugeo 2-dong, Nam-gu, Ulsan 44610, Korea
*
Author to whom correspondence should be addressed.
Energies 2022, 15(1), 242; https://doi.org/10.3390/en15010242
Submission received: 23 November 2021 / Revised: 21 December 2021 / Accepted: 22 December 2021 / Published: 30 December 2021

Abstract

:
This paper presents a study on the effect of the ratio of biodiesel and injection timing on the performance of diesel engines and their emissions. The research engine is a cylinder engine AVL-5402, simulated by software AVL-Boost. The simulated fuel includes fossil diesel and biodiesel blended with a replacement rate from 0% to 50%, with a simulation mode of 2200 (rev/min), at a rate of a 25%, 50% and 75% load. In this speed range, the engine has the lowest fuel consumption. The parameters to be evaluated are power, fuel consumption and emissions, based on the proportions of blended biodiesel. The results show that there is a relationship between the proportion of blended biodiesel, injection timing and the parameters of the engine. Specifically, the ratio of the biodiesel blend increases, injection timing tends to move closer to the top dead center (TDC), the tendency reduce engine power, fuel consumption increases, the emissions of CO and soot reduces, while NOx increases.

1. Introduction

Many methods are used in internal combustion engines to reduce NOx emissions and improve engine power, including changing piston bowl [1], using injector strategy [2] and using alternative fuels. Biofuel is one of the solutions offered to partially reduce fossil energy consumption and to reduce carbon intensity in the transportation sector, one of the main causes of environmental pollution through greenhouse gases (GHG) [3,4]. Among the different biofuels, bio-ethanol and bio-diesel have become prominent as alternatives to fossil fuels used in the industrial sector, including transportation, gasoline and diesel. In particular, biodiesel is currently considered as the most promising alternative to fossil diesel used in diesel engines due to its physicochemical properties being close to those of fossil diesel [5,6]. Bio-diesel is produced from vegetable oils, animal fats, and microorganisms, which makes it a promising fuel from a sustainability point of view. Bio-diesel is considered to be a fuel that has less effect on global warming than regular diesel [7].
The oxygen percent in the chemical formula of biodiesel is considered an important property [8]. Some benefits resulting from biodiesel over diesel fuel include higher efficiency, lower sulfur and aromatics content, higher cetane number, and biodegradability. Whereas biodiesel and diesel have similar fuel properties, which favors biodiesel use in the transportation sector [9,10]. All these factors lead to better combustion, thereby reducing the PM component but at the same time increasing the NOx component due to the increase in the maximum temperature in the combustion chamber [11,12]. Generally, biodiesel is blended in a volume with a portion of commercial fossil diesel oil of up to 20%, and is used in existing internal combustion engines (ICE) without modification, subject to the manufacturer’s instructions for engine production. In addition, blends that include 5–20% biodiesel are popular choices as they exhibit a good balance between fuel efficiency and cost, and are regulated by standards such as ASTM D7467 [13,14].
From the above analysis, it can be seen that the higher the mixing ratio, the lower the dependence on fossil fuels. On the other hand, due to limitations in practical use, a study with a high percentage of biodiesel will help to guide manufacturers in understanding problems that need to be modified accordingly. However, the experimental study is relatively difficult in terms of technique and cost, so a study by simulation is performed to solve the abovementioned problems.

2. Researching Method

The main research method is simulation. Based on the actual engine, we proceeded to build a simulation model. The actual engine was experimented with using B0 fuel to build an external characteristic curve of power and fuel consumption. This data were used for calibration during model building, so as to ensure accuracy within allowable limits. Then, the model was used to investigate other characteristics of the engine in different modes for each type of diesel fuel and biodiesel blend. AVL-boost software is effective and useful software that is used to simulate most types of engine [15,16,17,18]; in this research, a common rail single cylinder engine is simulated based on the AVL-boost software. Table 1 presents the test engine’s specifications; the simulation model is shown in Figure 1.

Simulation Model of Heat Tranfer

Equation (1) is used to calculate the heat transfer [19].
Q wi = A i · α w · ( T c T wi )
With: Qwi: wall heat flow; Ai: surface area; αw: heat transfer coefficient; Tc: gas temperature in the cylinder; Twi: wall temperature.
The coefficient of heat transfer (αw) [19]:
α w = 130 · D 0.2 · P c   0.8 · T c 0.53 [ C 1 · C m + C 2 · V D · T c , 1 P c , 1 · V c , 1 · ( P c P c , 0 ) ] 0.8
The test fuels properties is presented in Table 2.
Table 2 presents the test-fuel properties (B0–B100), using the methods of the American Society for Testing and Materials (ASTM). This biodiesel fuel is made from fish fat and was used in this research. Based on this table, the differences in heating value, cetane value, density, kinematic, flash point, sulfur content, and water content of biodiesel blends are investigated.
Table 3 shows the fuel mass is injected per cycle under the operating modes corresponding to part loads
At an engine speed of 2200 (rpm) the most advantageous injection timing was found to be 18 deg CA and the injection pressure was 600 bar. Due to the different viscosity and density of diesel and biodiesel, to ensure the same injection volume in each mode, it was necessary to change the injection time for each type of fuel accordingly. At a 25% load, the spray volume of B0, B10, B20, B30, B40, and B50 is 372 (ms), 376 (ms), 387 (ms), and 394 (ms), respectively; at z 50% load, the spray volume is 581 (ms), 607 (ms), 636 (ms), 639 (ms), and 648 (ms).
In this research, the experimental objective for B0 fuel is to build an external characteristic curve of power and fuel consumption. The experimental data serve as the basis to calibrate the simulation model to achieve the required accuracy. After validation, the simulation can be used for further studies.

3. Results and Discussion

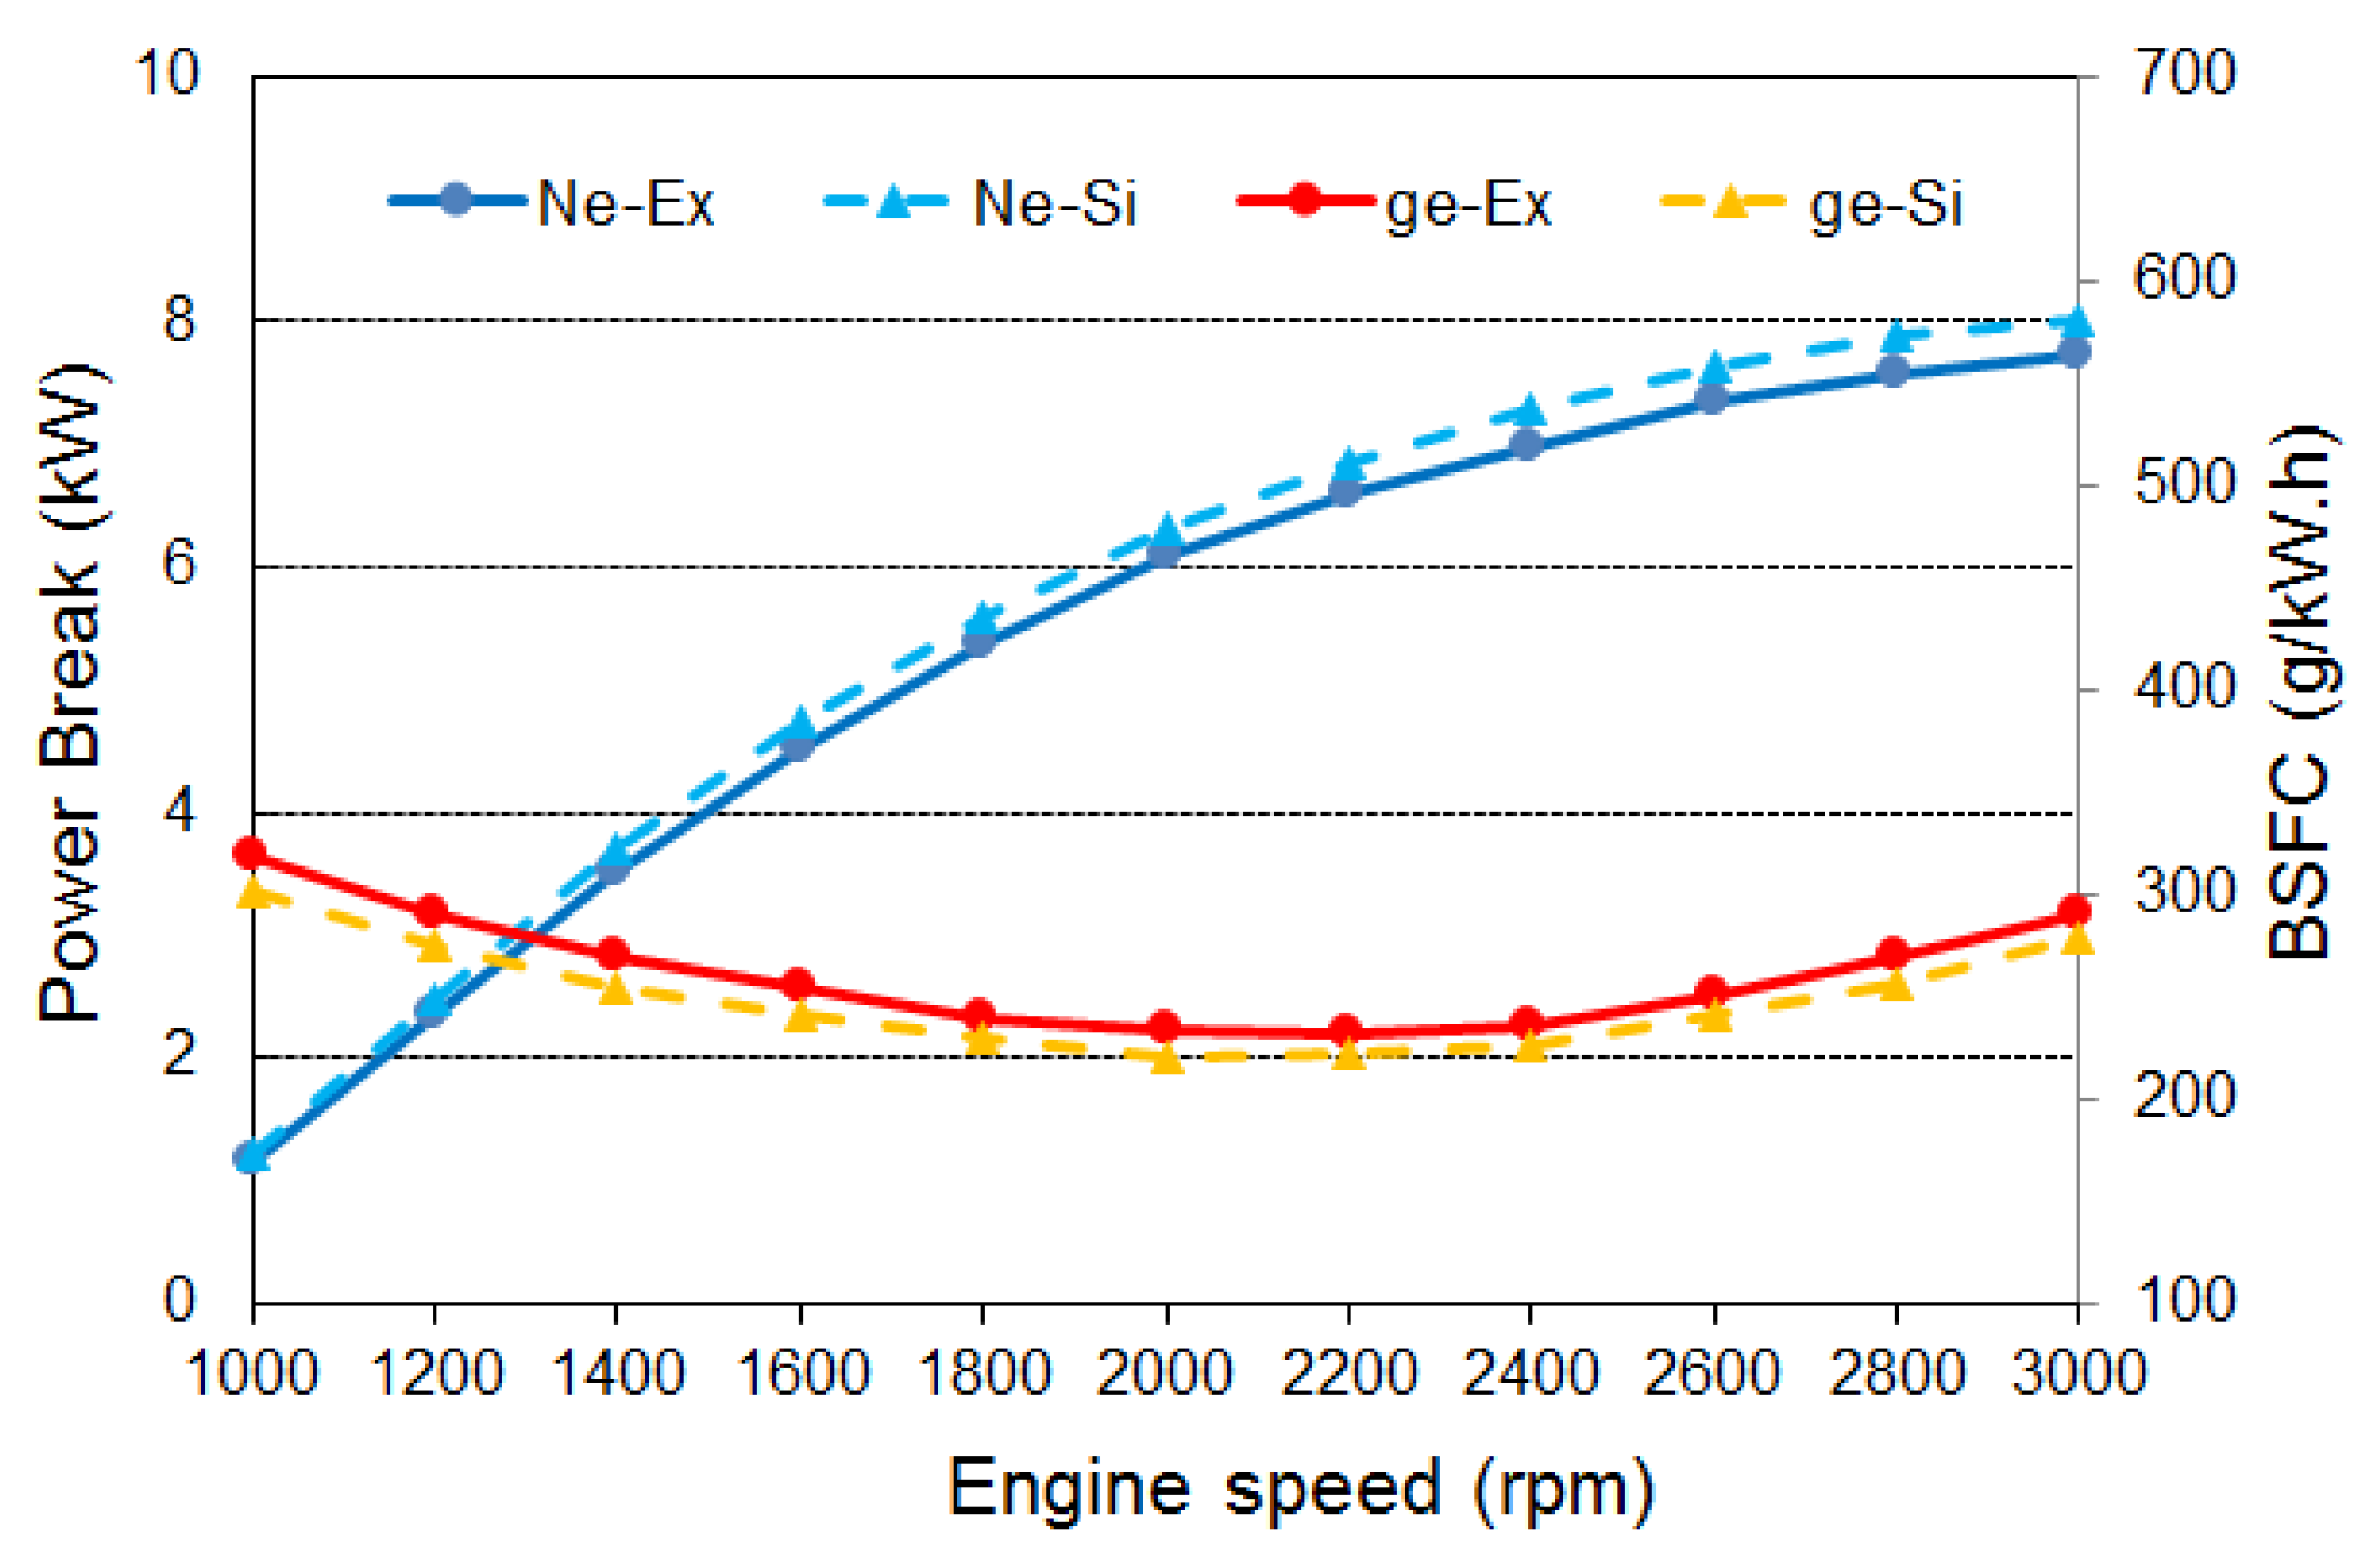
3.1. Model Validation

Figure 2 shows the results of the external characteristics of the engine in terms of power and fuel consumption (BSFC) using the simulation (Si) and experiment (Ex). Over the whole speed range, we did not observe a considerable difference between the simulation and experiment. Specifically, in terms of power characteristics, the maximum deviation was 5.7% at 1400 (rpm) and the smallest was 3.4% at 2000 (rpm). The average above the speed range was 4.5%. The fuel consumption results show that the maximum deviation was 5.8% at 1200 (rpm) and the smallest was 3.7% at 2600 (rpm), averaged over the entire speed range.
The average difference between the simulation and experiment results was less than 5%, so the model was confirmed to be reliable and can be used to conduct surveys for working modes, as well as for input control parameters on the other side of the engine.

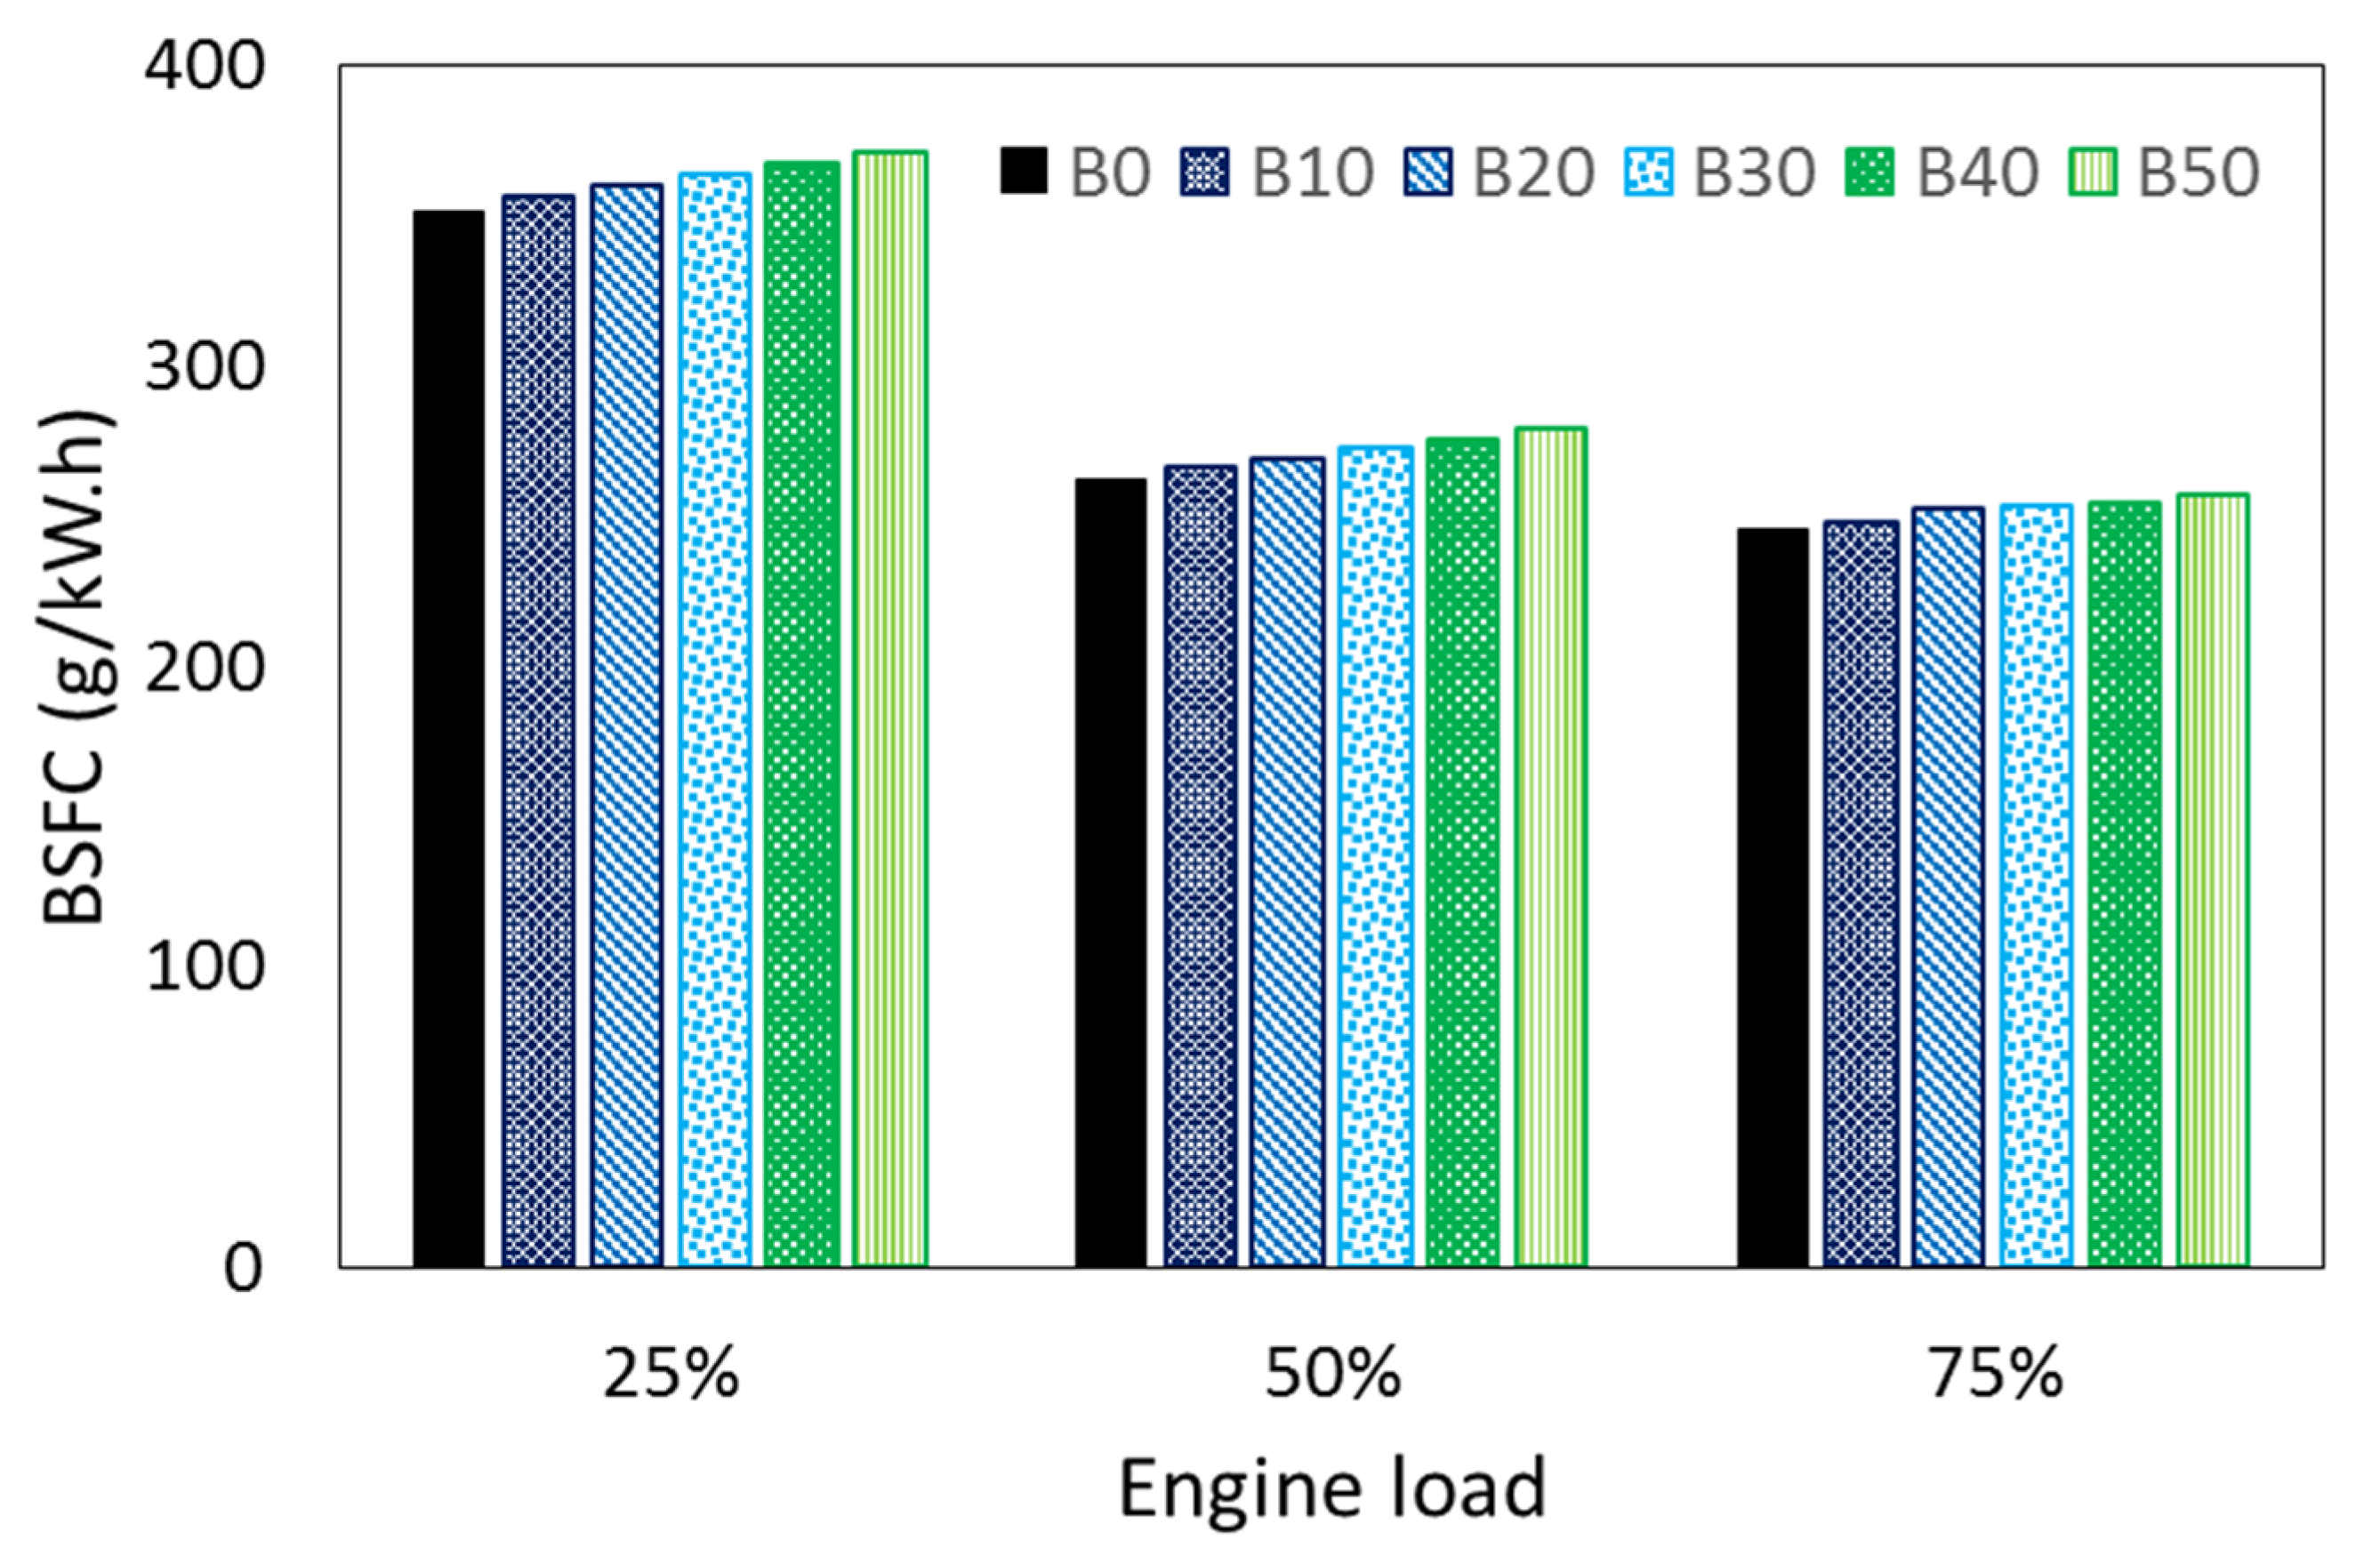
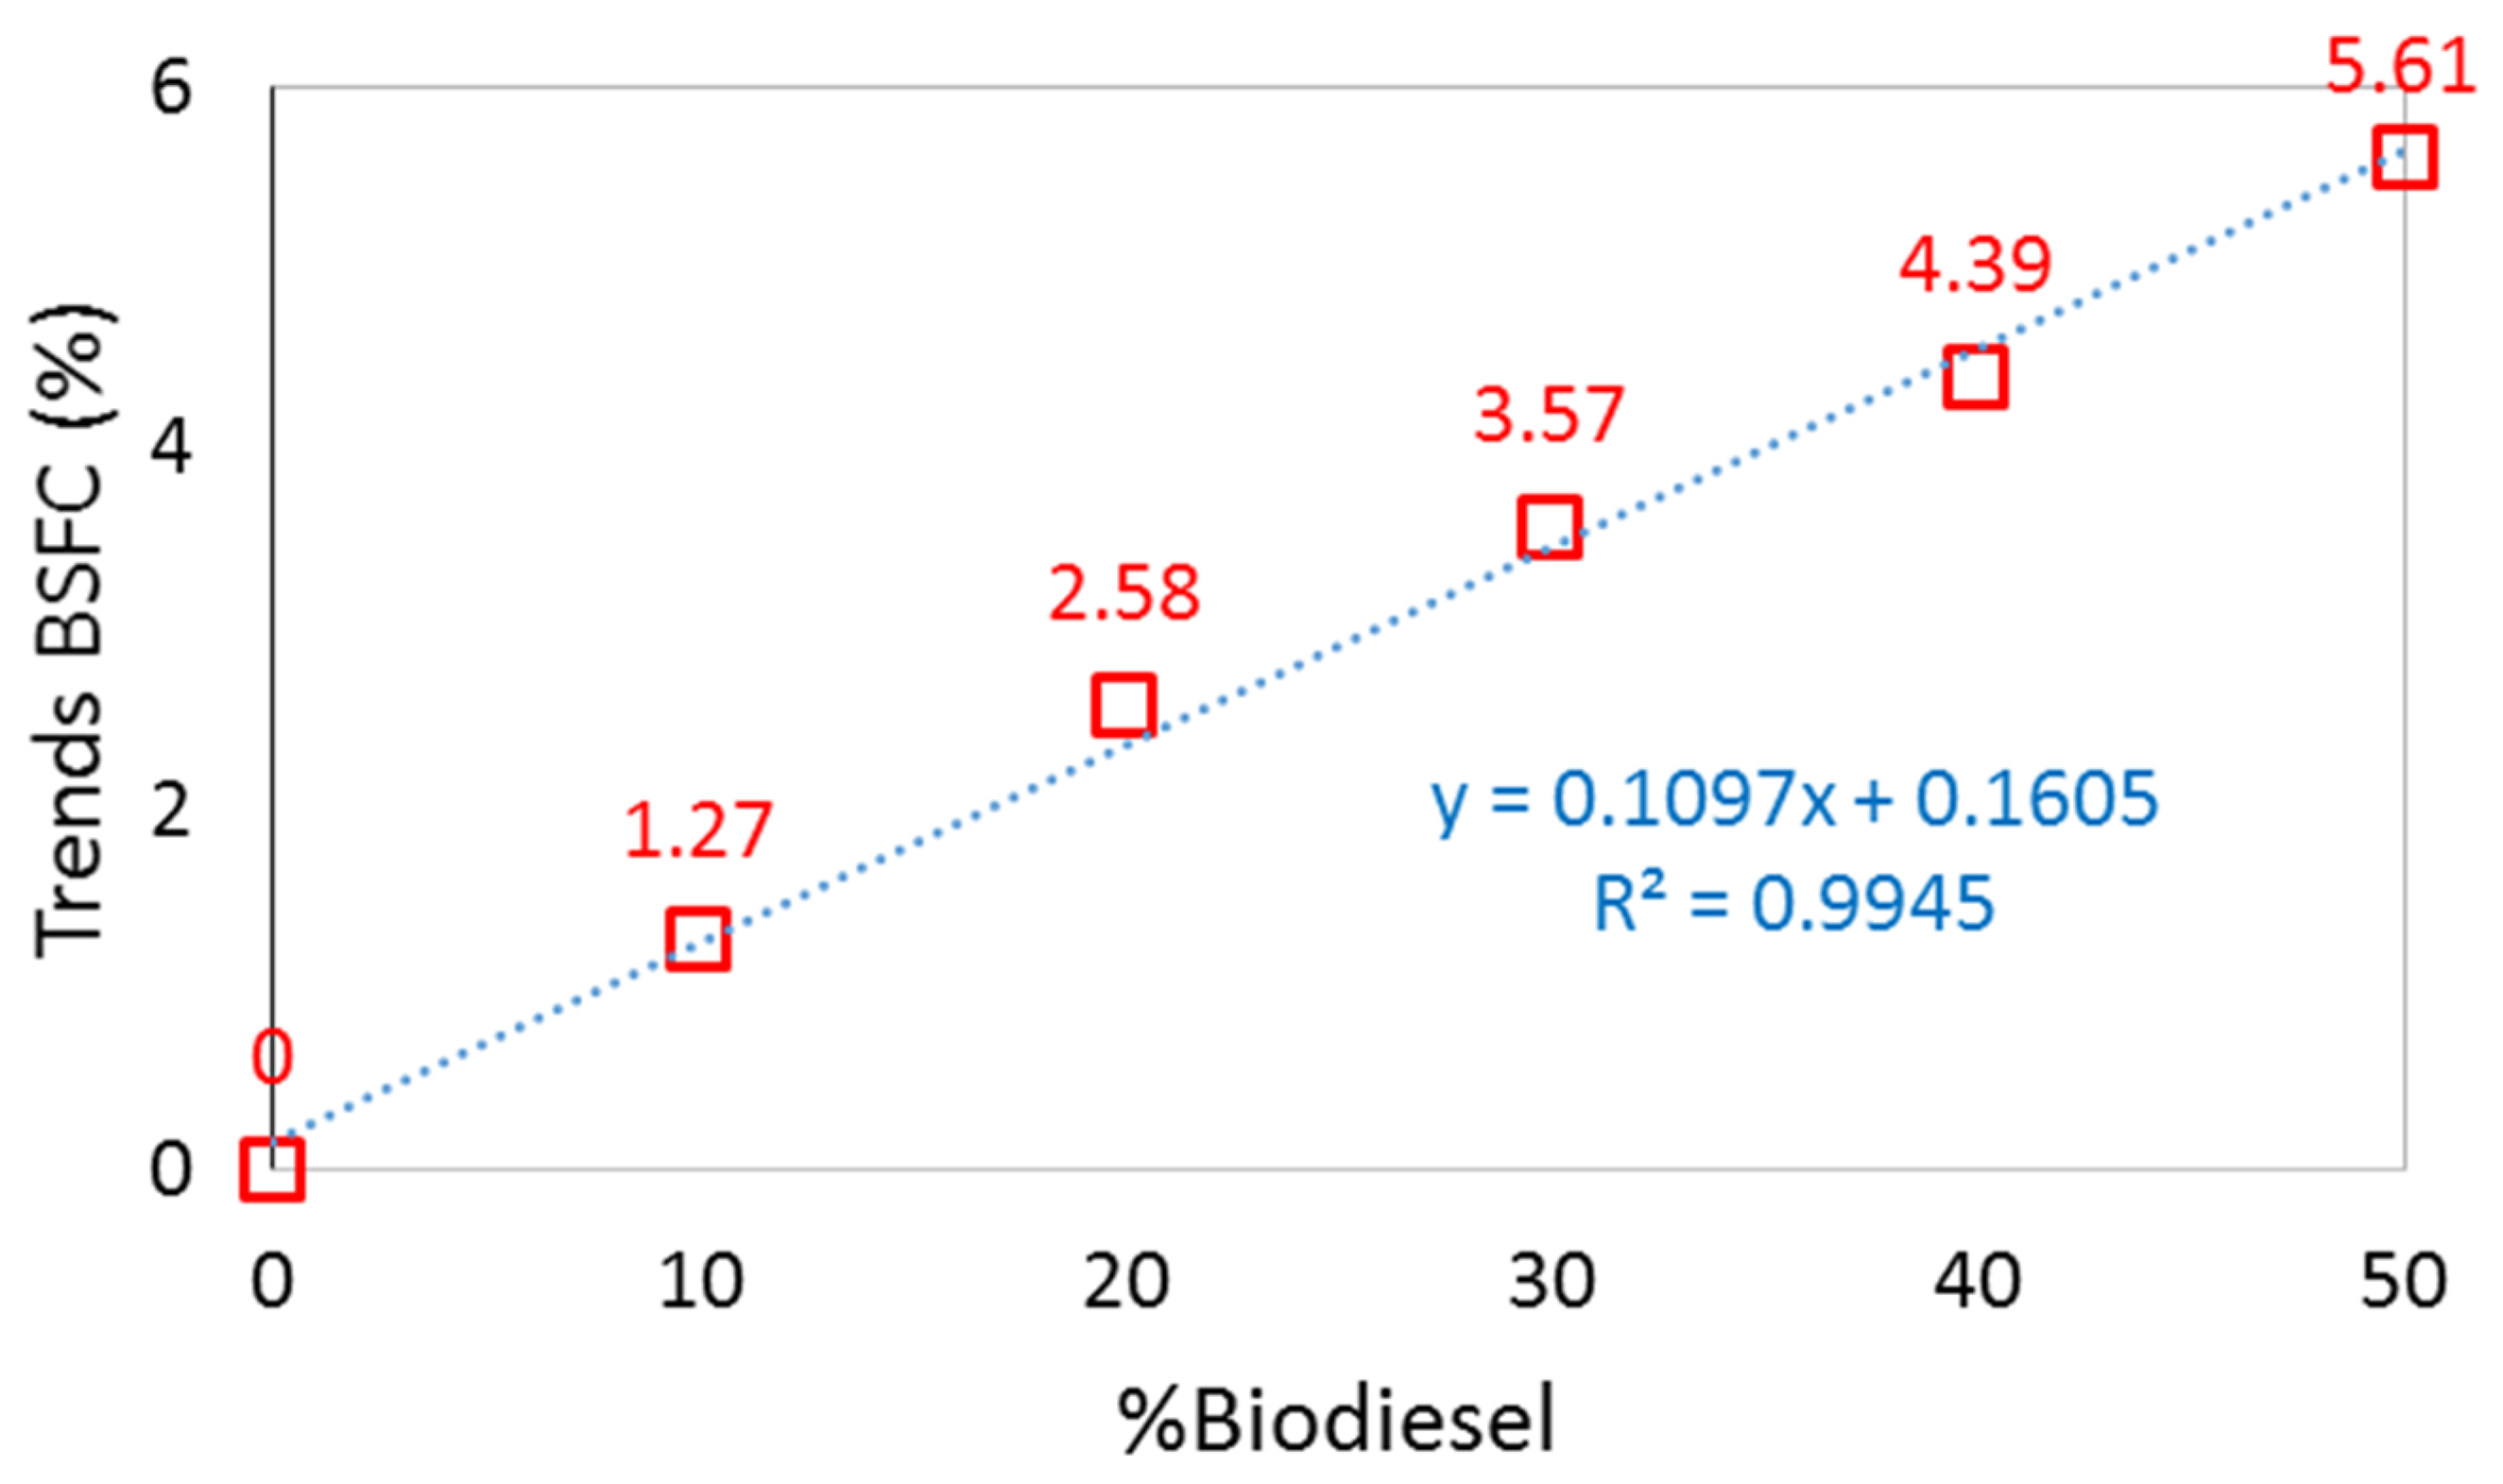
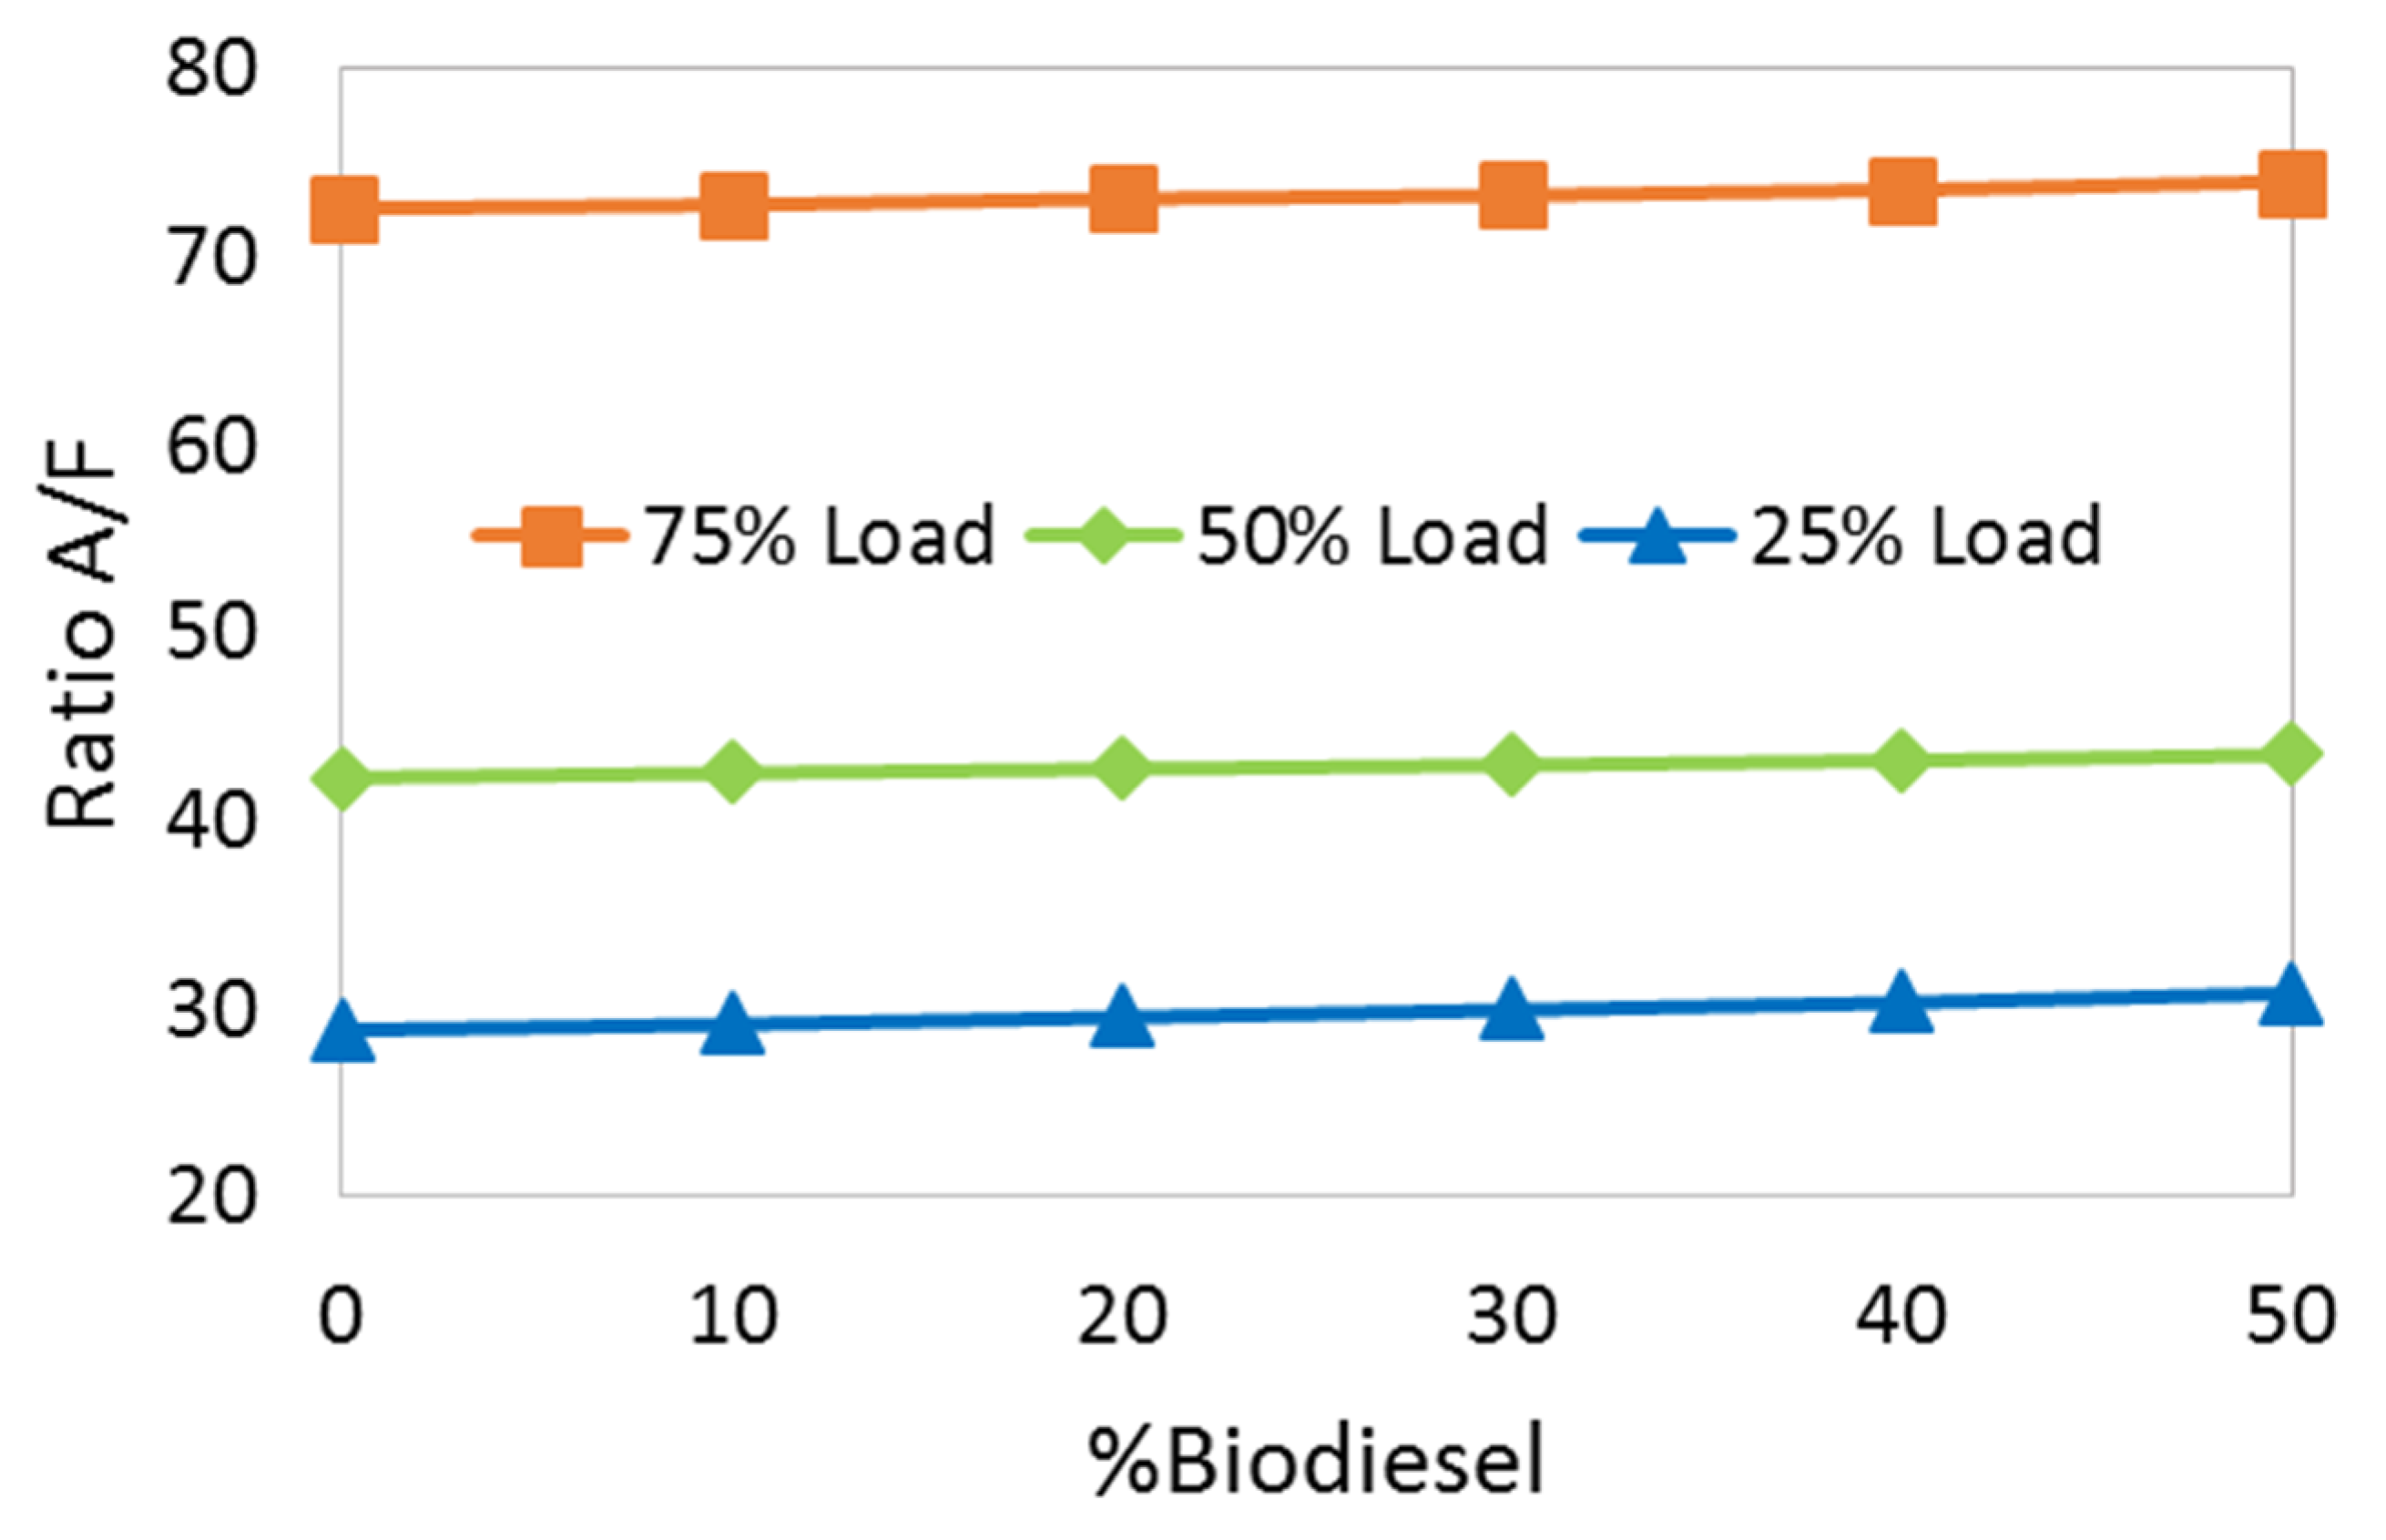
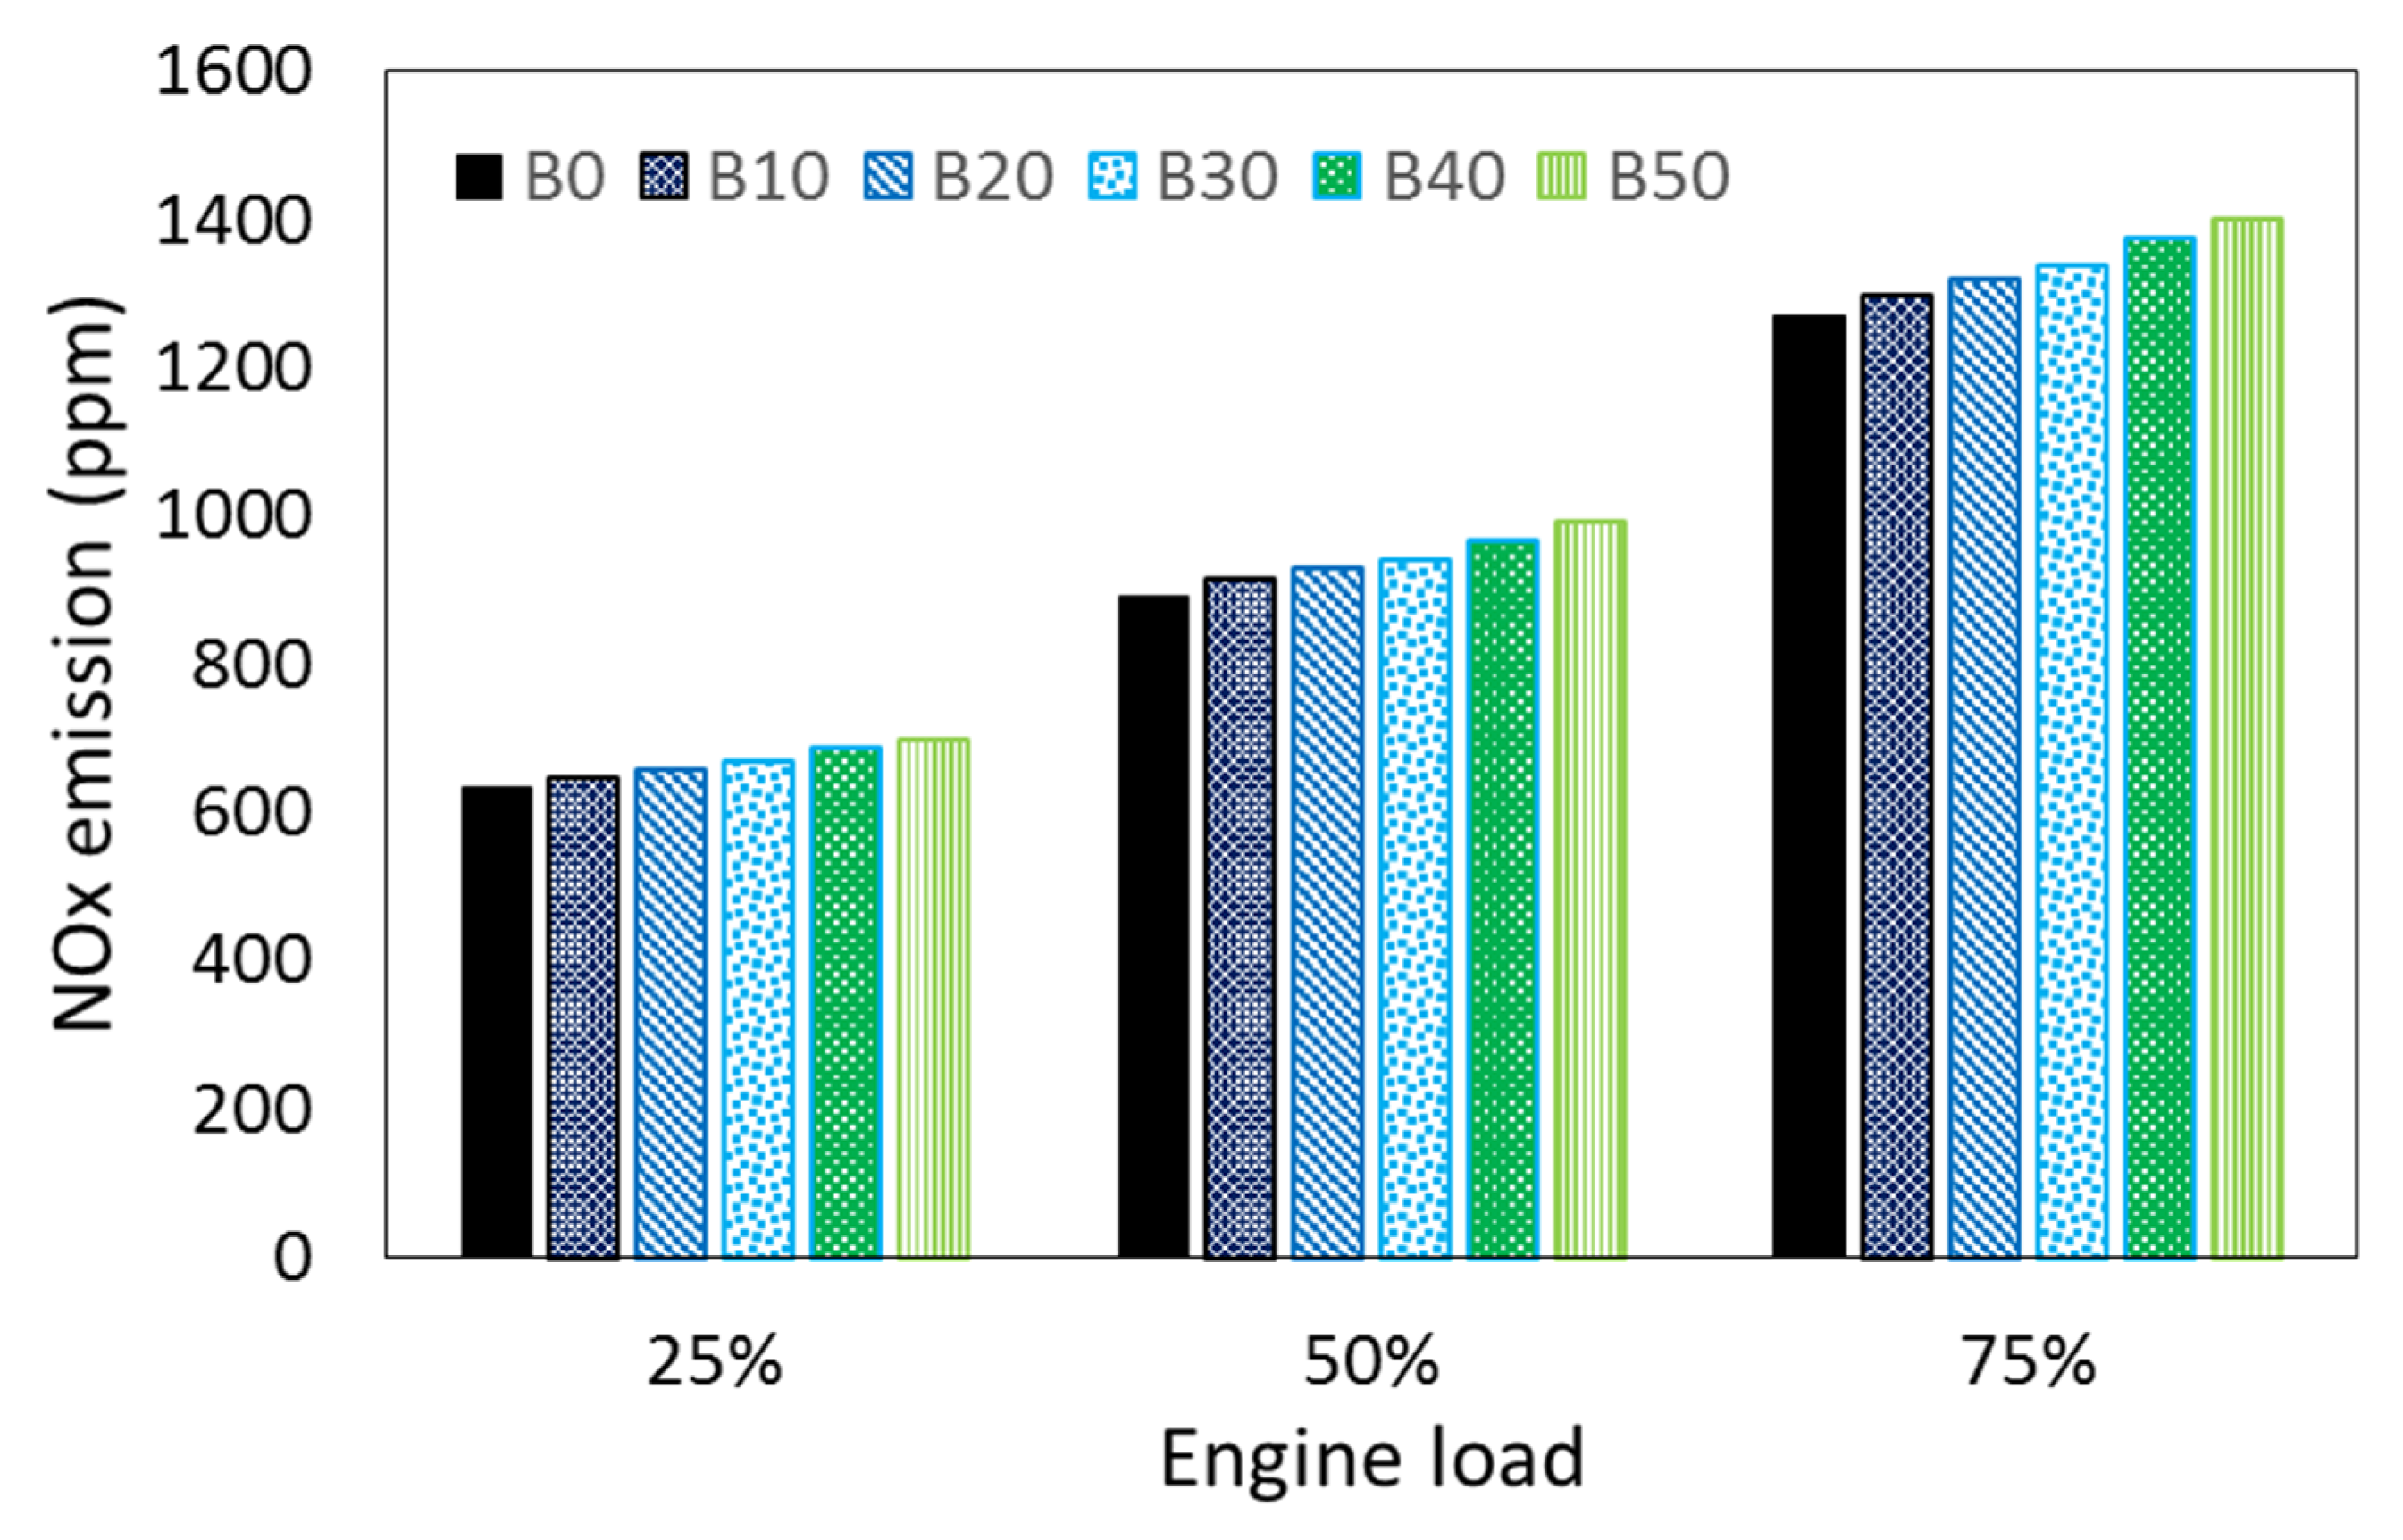
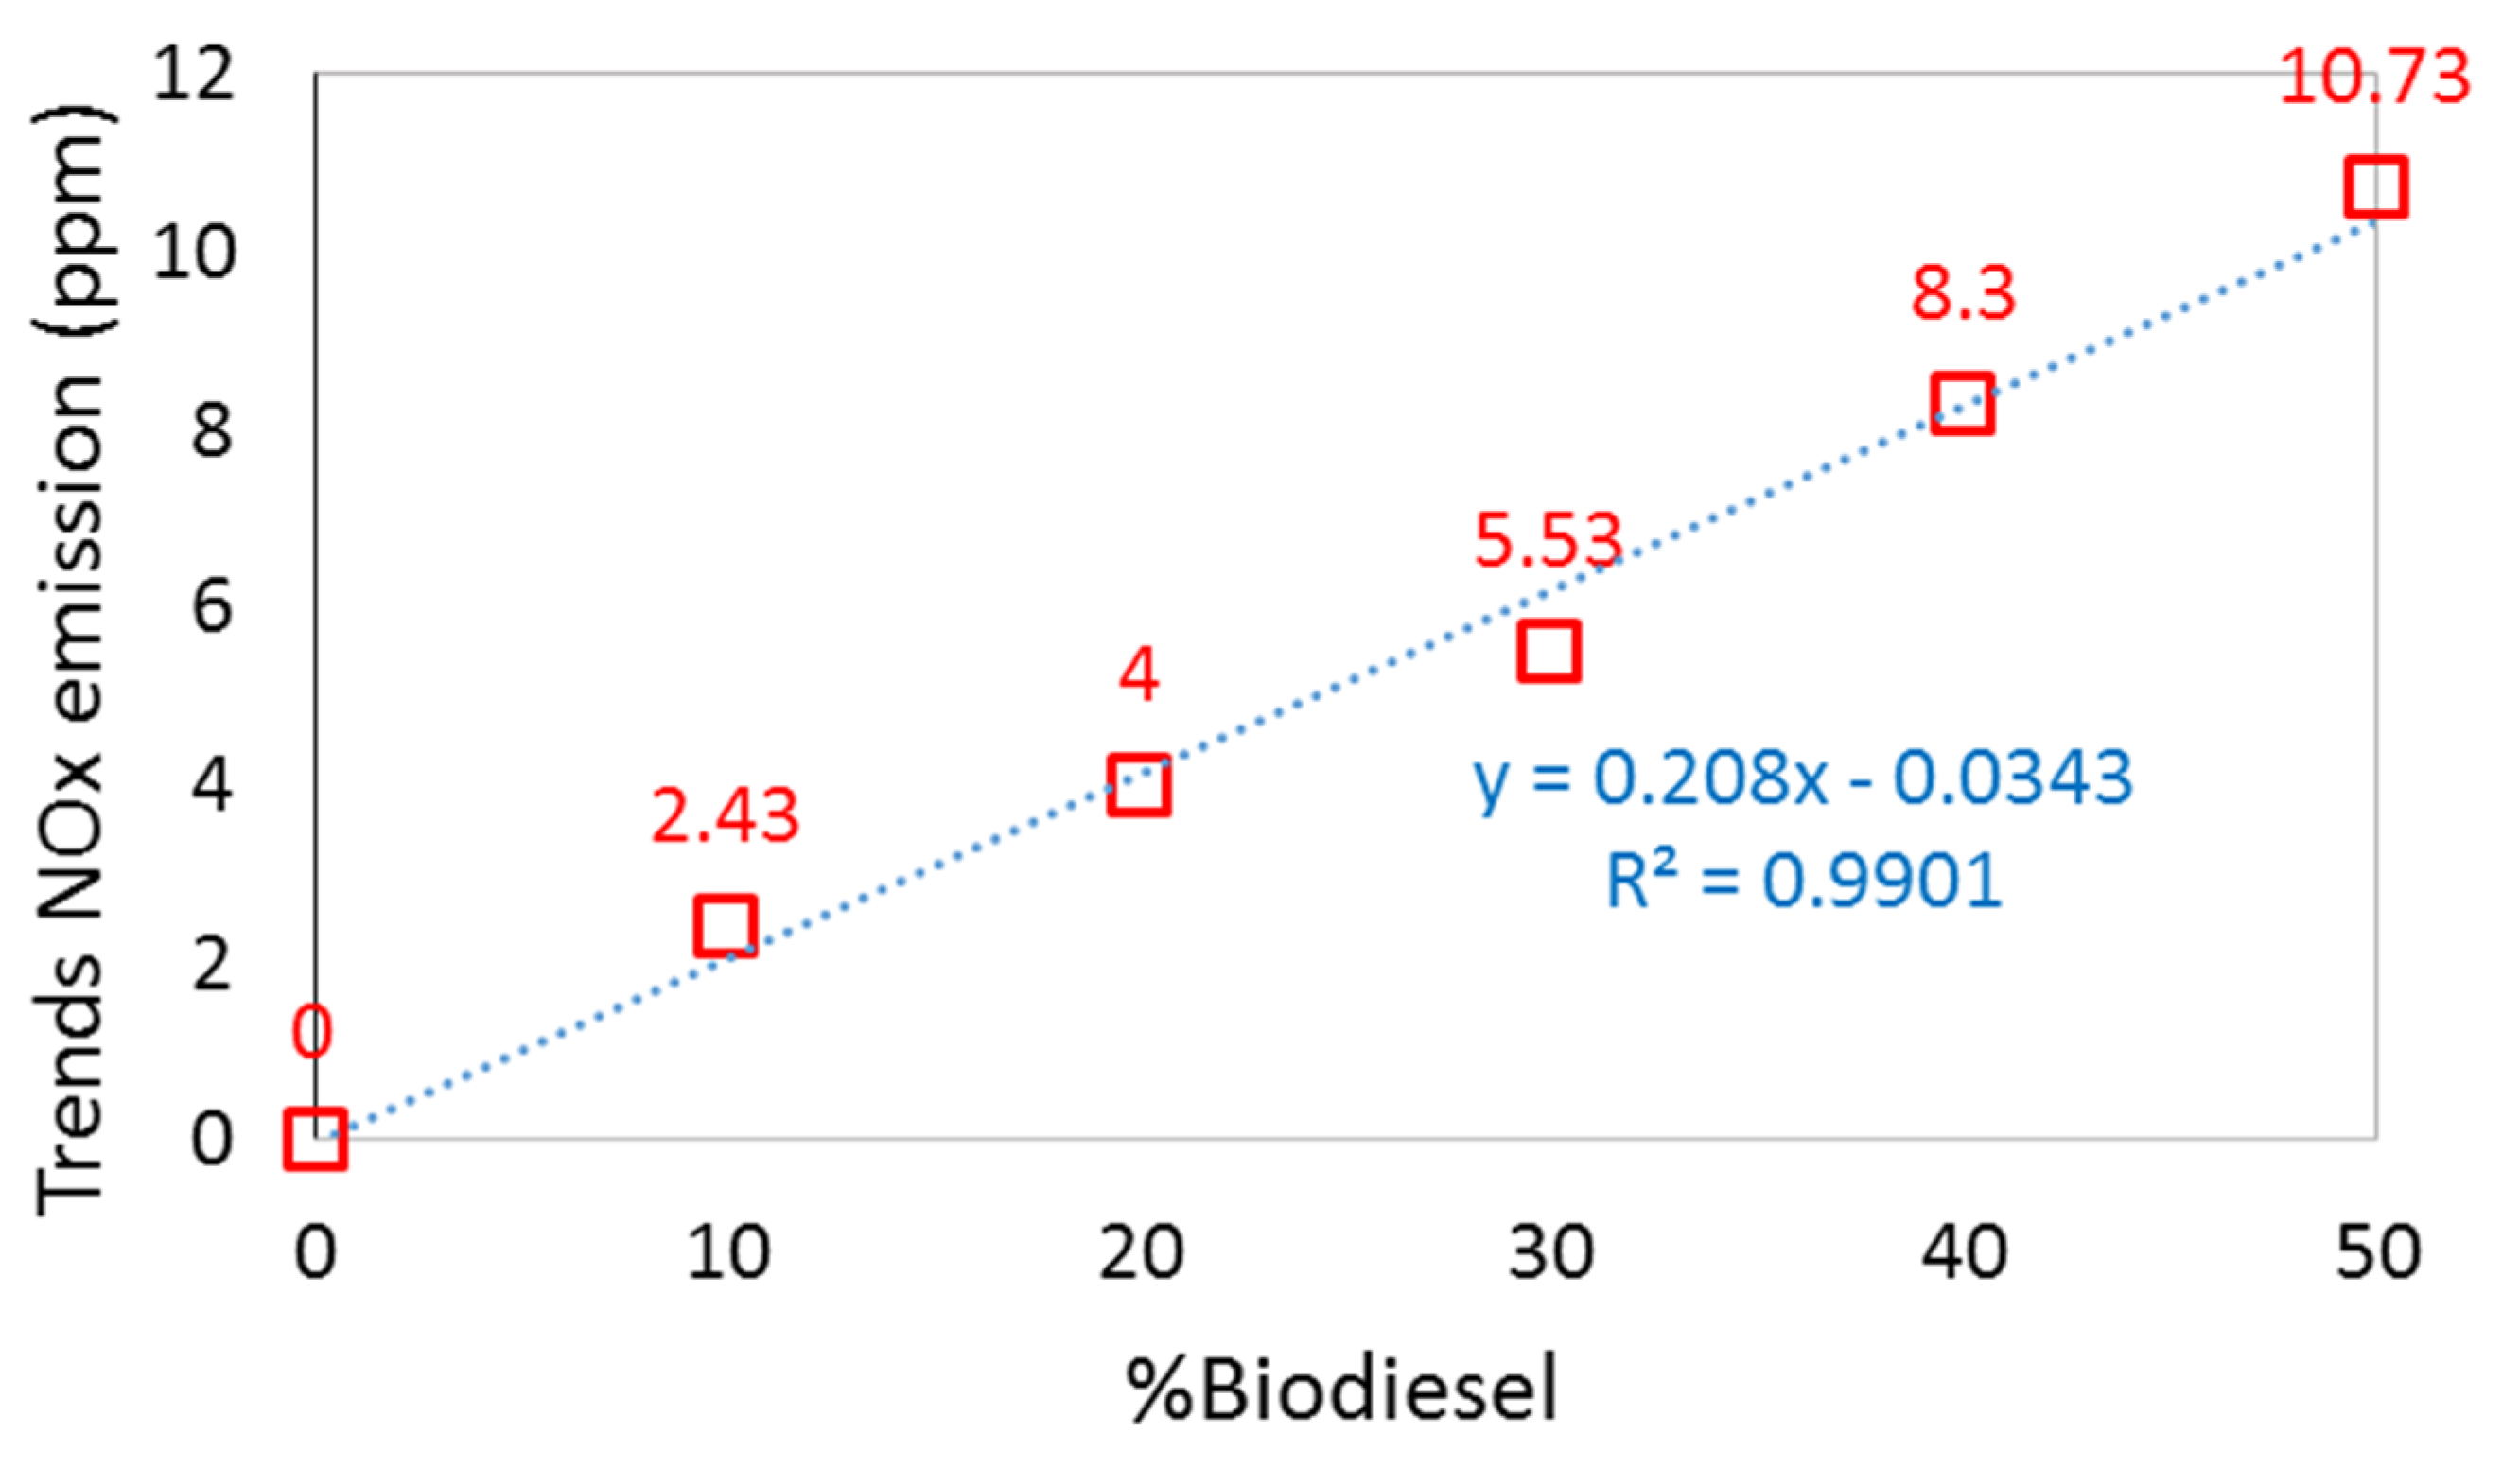
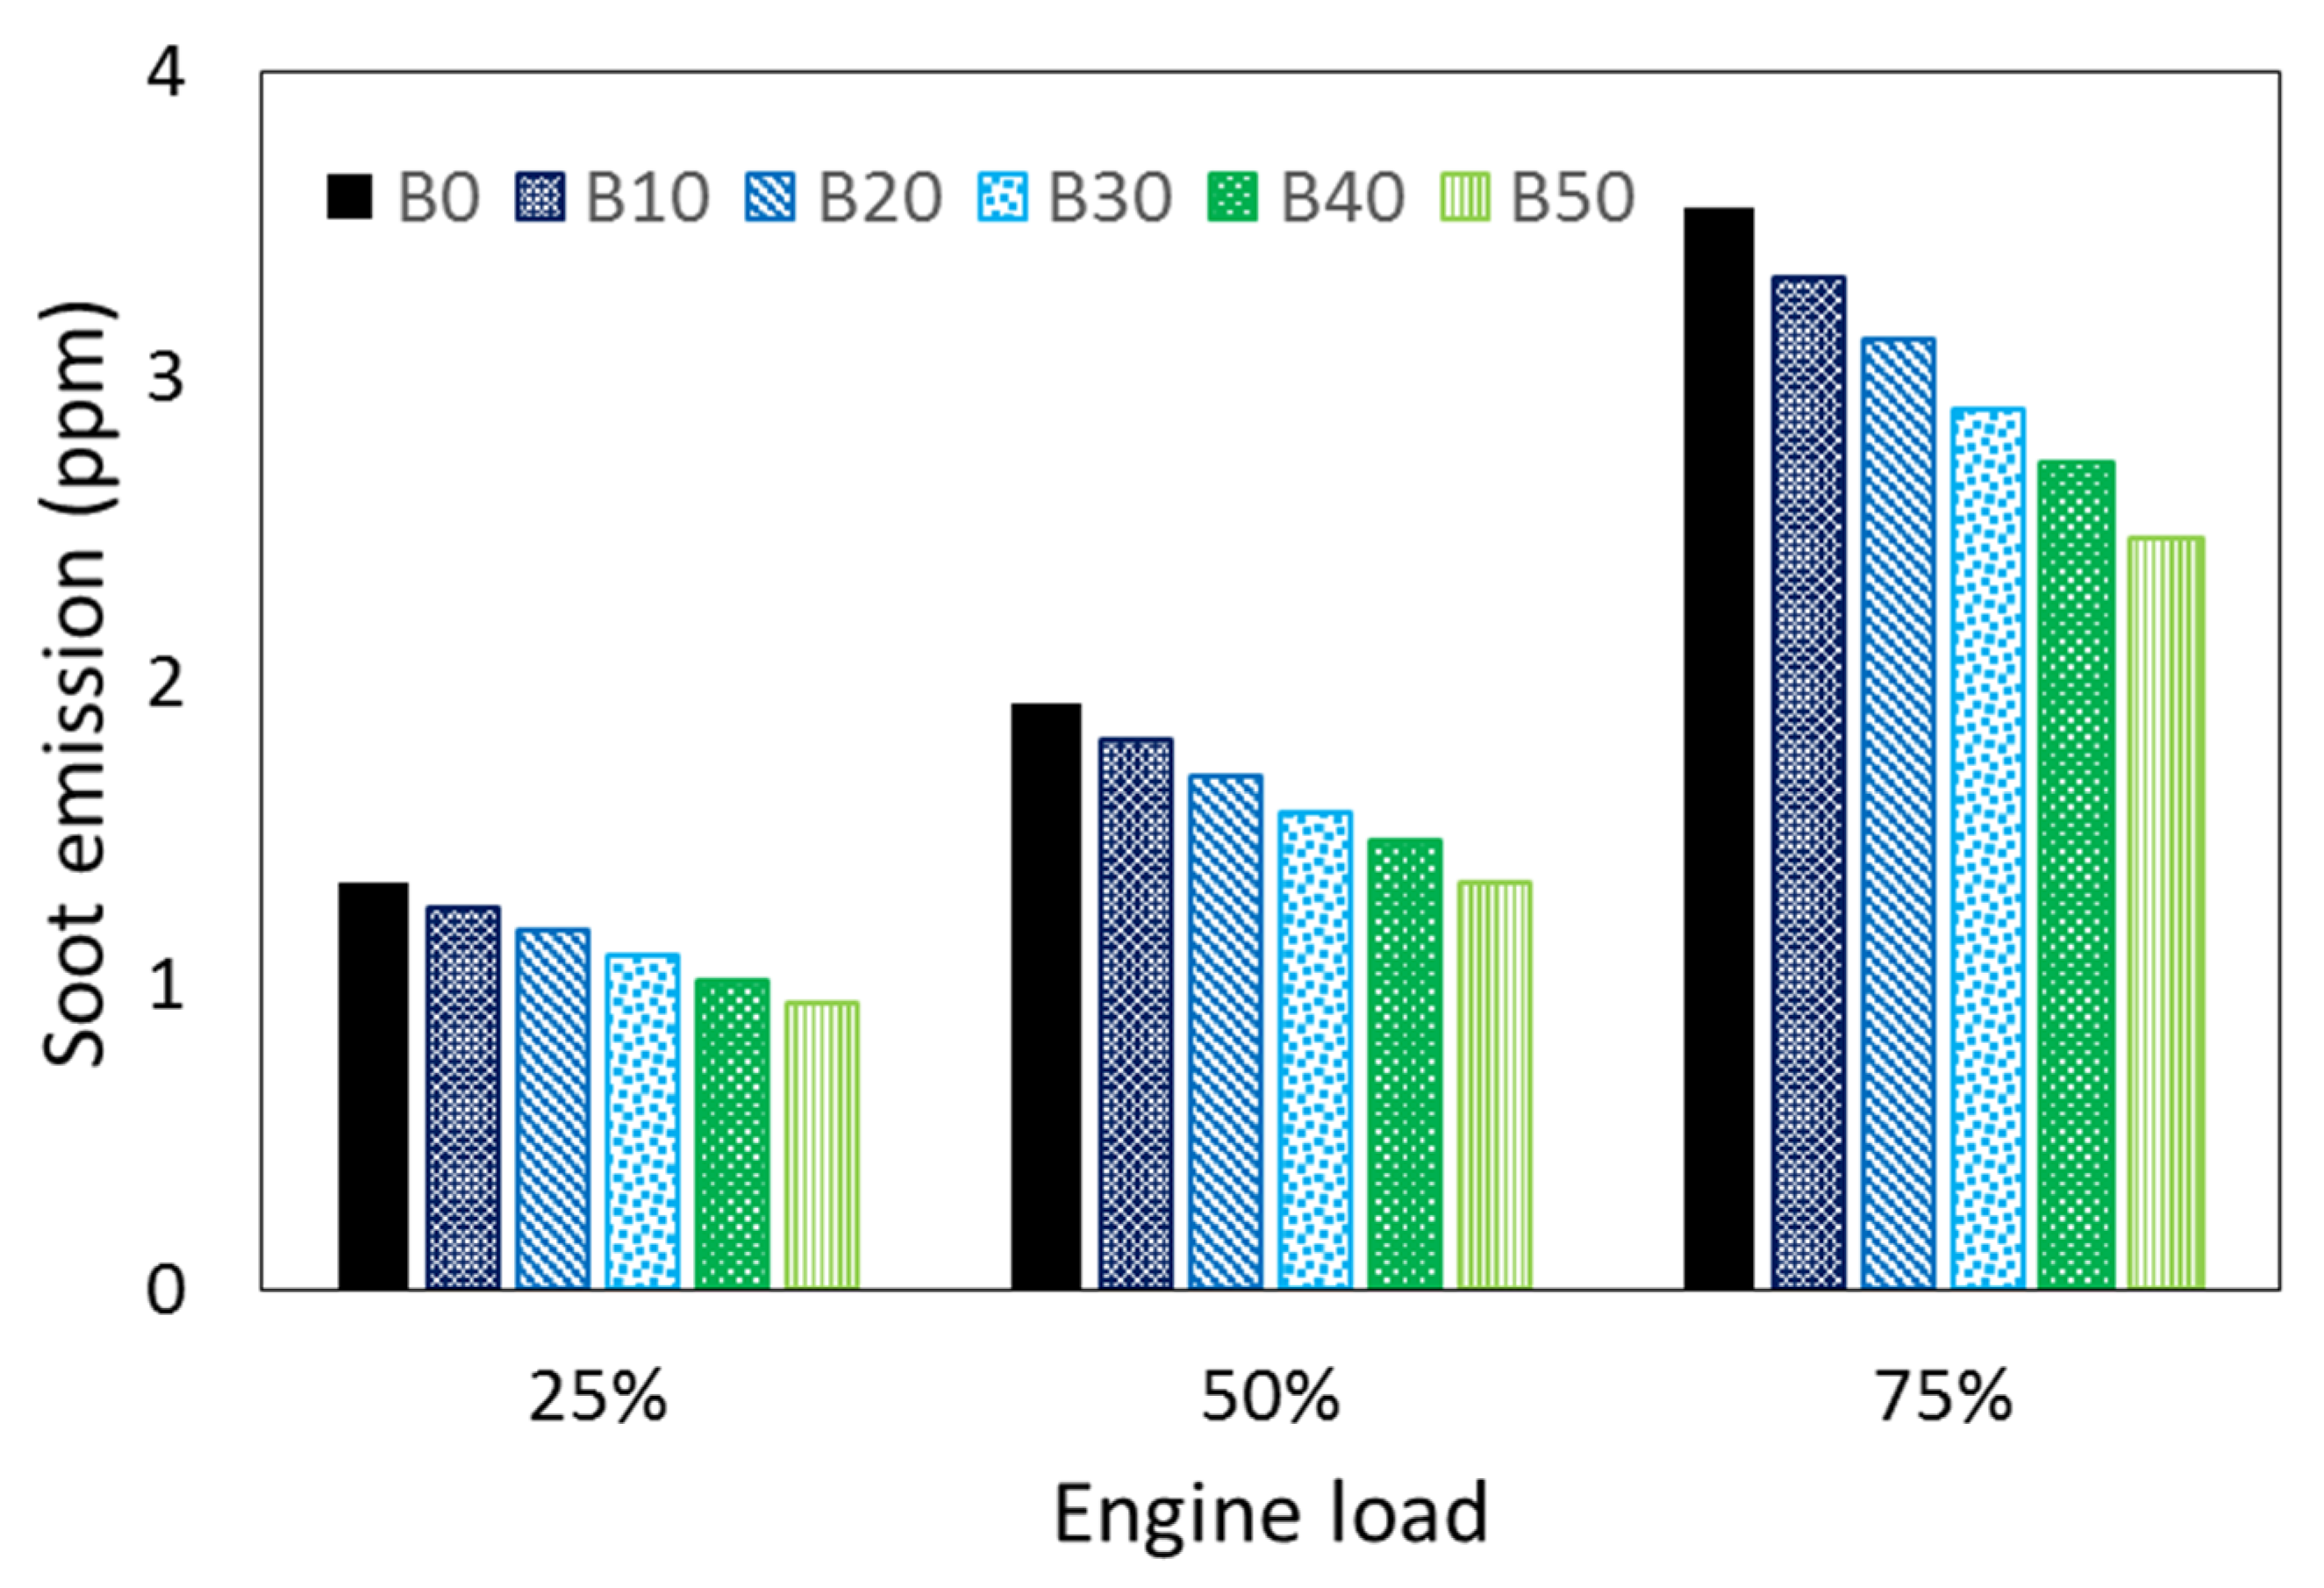
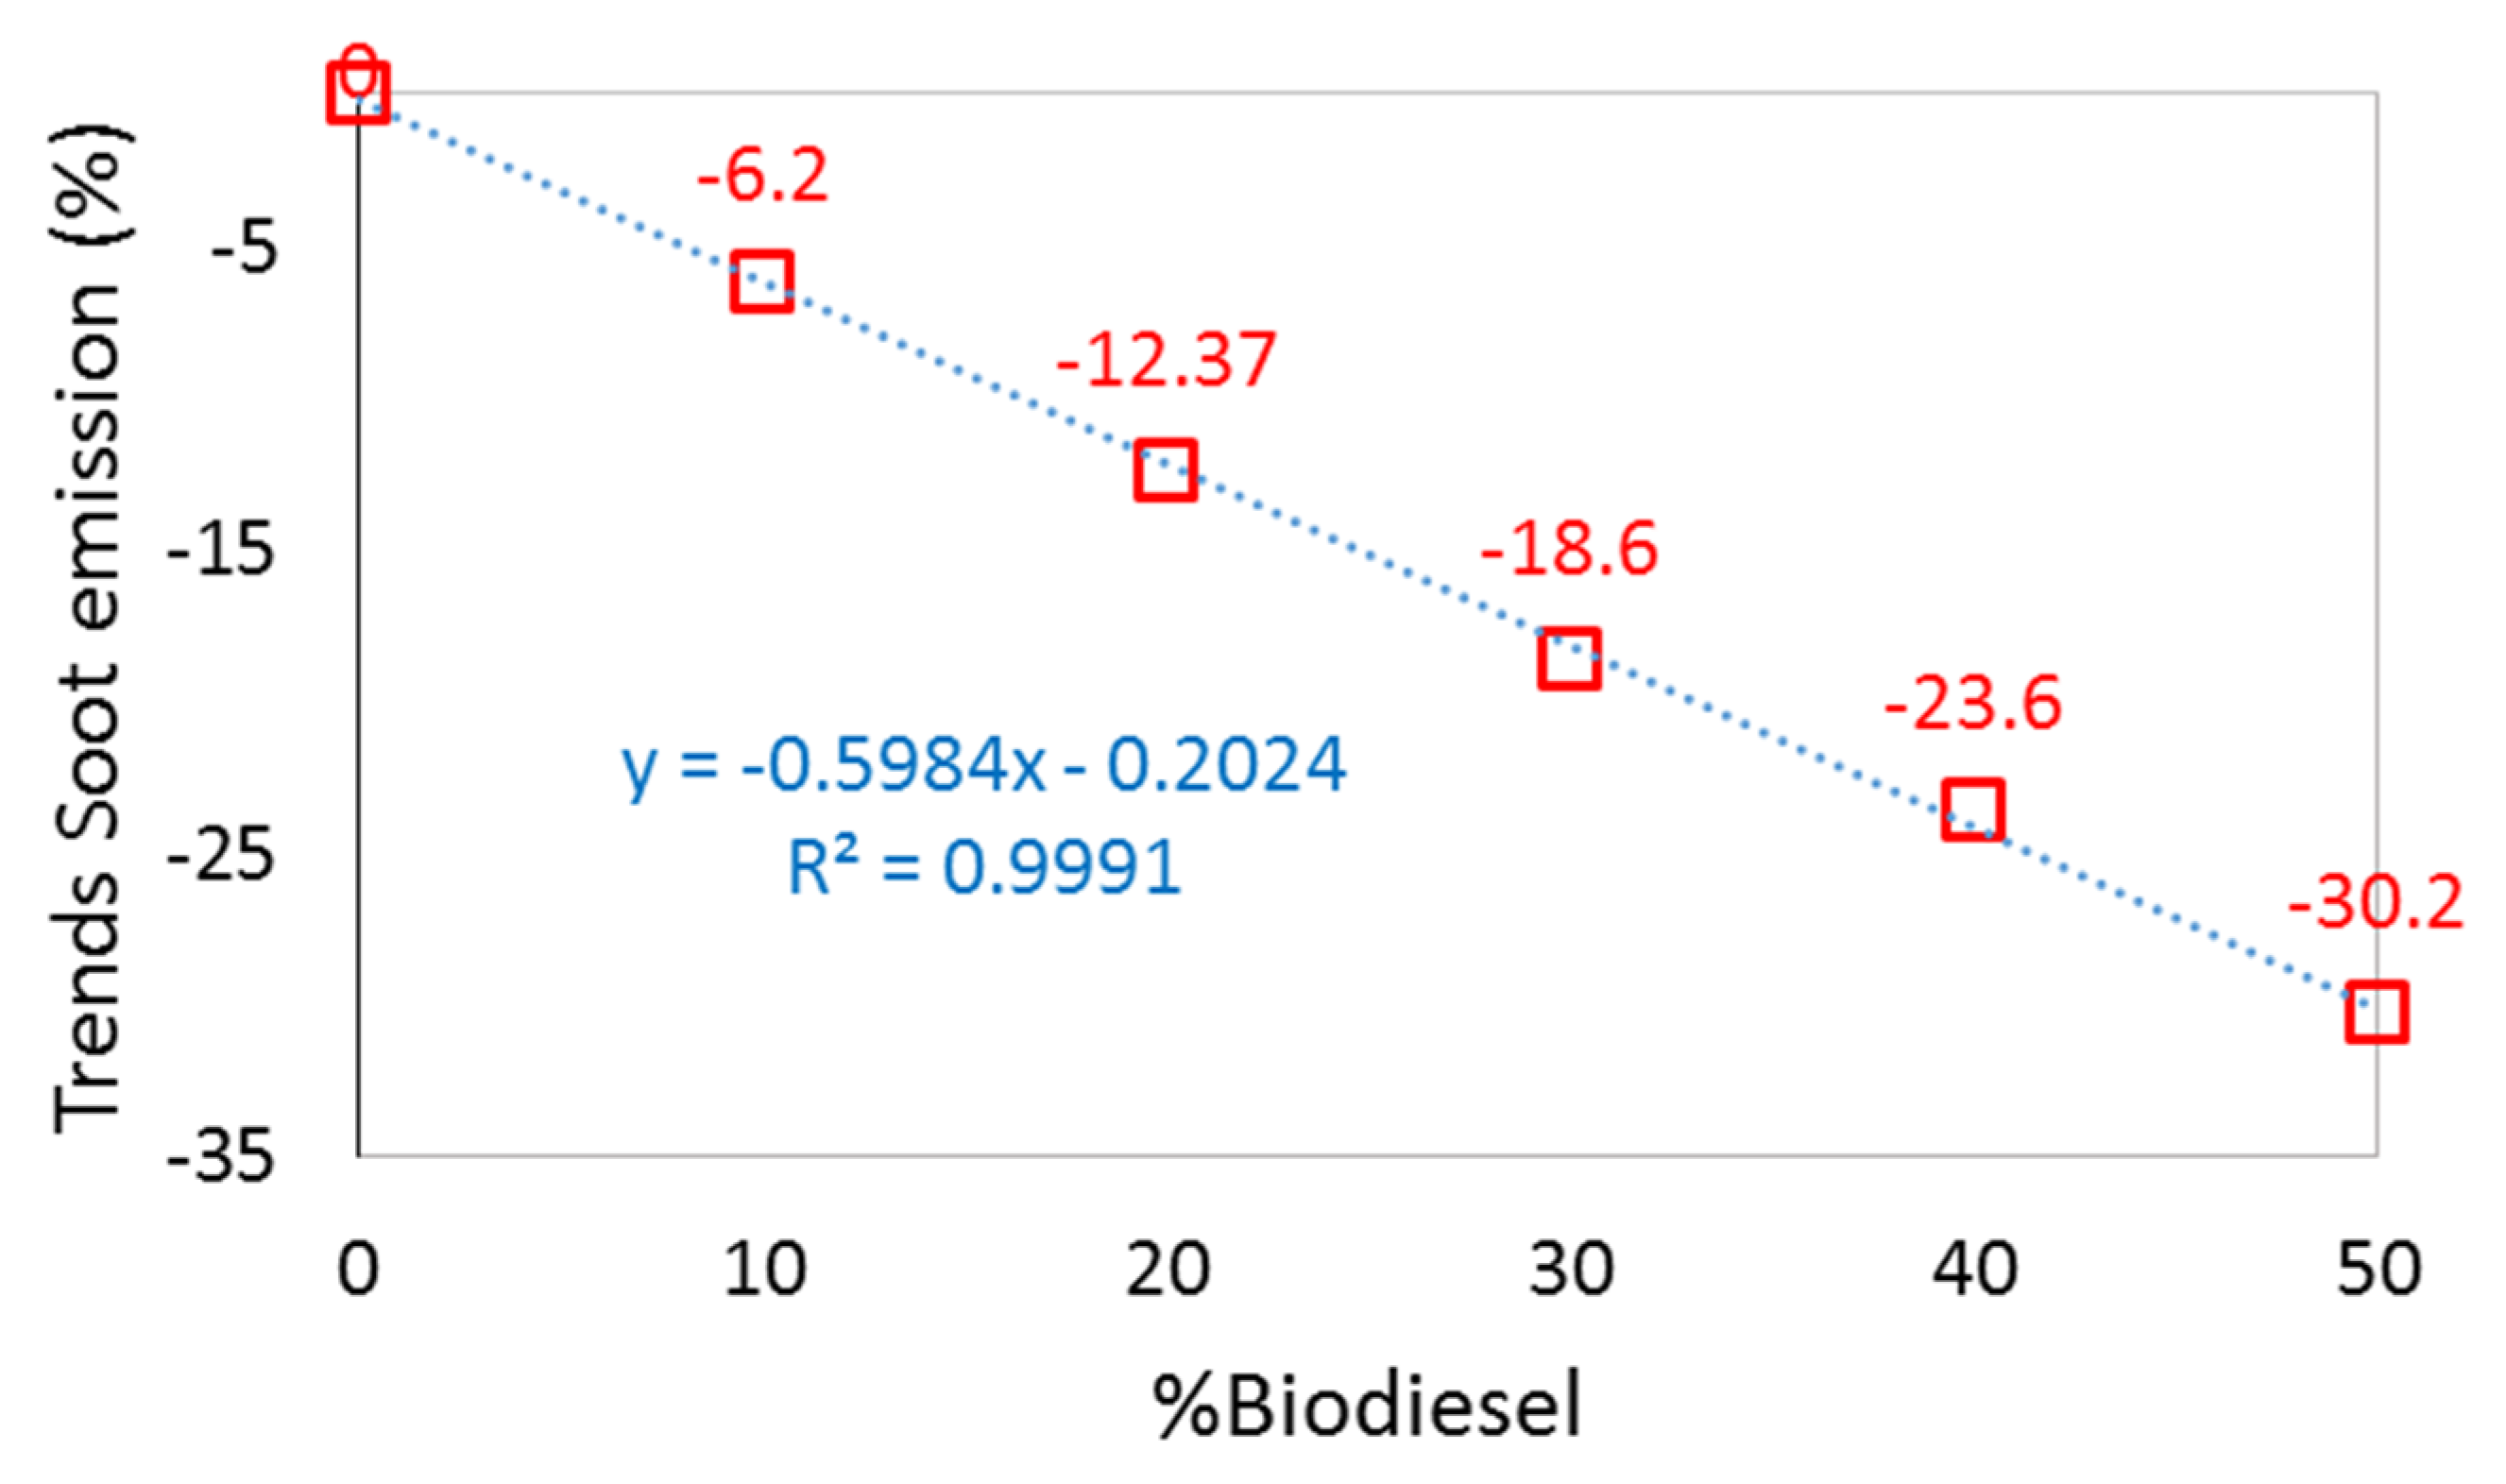
3.2. The Effect of Biodiesel Blends

The power of the engine when using fuels B0, B10, B20, B30, B40, and B50 at load modes (25%, 50%, and 75%) is shown in Figure 3. At all load modes, the power of the engine decreased in accordance with a higher biodiesel blending ratio.
The equation showing the relationship between the engine power and biodiesel blending ratio can be examined through Figure 4. The decrease in the engine’s power was a result of the lower calorific value of bio-fuel. As the calorific value was lower, the total amount of heat gained during combustion was reduced, and thus the amount of successfully converted heat was reduced. Because of the decrease in combustion delay, due to the higher cetane number of the biodiesel fuel, the mixture ignited faster, and the phenomena of both combustion and compression occurred when using bio-fuel, resulting in reduced power [20,21,22].
The results show that, at all load modes, the capacity of B0 was the highest, gradually decreased when the biodiesel mixing ratio increased, and reached its lowest capacity with B50 fuel. At a 25% load, B0 reached 1.92 (kW), B10 reached 1.9 (kW) decreased by 1.04%, B30 reached 1.86 (kW) decreased by 3.12%, B40 reached 1.84 (kW) decreased by 4.17%, and B50 reached 3.68 (kW) decreased by 5.15%; at 50% load, B0 reached 5.66 (kW), B10 reached 5.62 (kW) decreased by 0.71%, B20 reached 5.52 (kW) decreased by 2.47%, B30 reached 5.5. Specifically, the average capacity decreased compared to B0 by 0.92% and 2.2%, respectively 3.01%, 3.82%, and 4.98%, respectively, for 10%, 20%, 30%, 40% and 50% of biodiesel blend.
The relationship between power change and biodiesel mixing ratio according to a function is as follows:
y = 0.0983 x 0.0305
where:
y: % power change;
x: % biodiesel blend.
Meanwhile, the fuel consumption rate gradually increased as the biodiesel blending ratio increased. This can be explained by the fact that the injected fuel mass per cycle is constant for the fuel types and for the decrease in engine brake power. The results for a lower BSFC of the fuels can be observed in Figure 5 and Figure 6. The trend of BSFC can be seen to be opposite to the trend of capacity.
The results showed that the average increase in BSFC, compared to when using B0 was 1.27%, 2.58%, 3.57%, 4.39%, and 5.61%, respectively, with B10, B20, B30, B40, and B50.
The relationship between the BSFC change and biodiesel blending ratio according to function is as follows:
y = 0.1097 x + 0.1605
where:
y: % BSFC change;
x: % biodiesel blend.
When maintaining the fuel supply, the A/F ratio of the engine for biodiesel fuel is always higher than that of conventional diesel fuel. This difference is because the biodiesel fuel itself already has O2 molecules [23,24]. Meanwhile, with the same working mode of the engine, the amount of air entering the engine is the same for all fuels. The result is a larger A/F ratio (air residue factor) of the biodiesel fuel. The results of calculating the A/F ratio, according to the simulation of the engine at different working modes for the investigated fuels, are shown in Figure 7.
The results showed that, at all loading modes, the A/F ratio increased slightly compared to B0 and increased as the biodiesel mixing ratio increased.
CO emissions are the products of combustion in the absence of oxygen, which is caused by the formation of heterogeneous mixtures, creating regions rich in fuel and lower in oxygen. When the engine uses biodiesel fuel, due to the presence of O2 molecules in biodiesel fuel, a reduction in the dark mixture areas occurs, and results in a strong reduction of CO emissions [25]. According to this model, by keeping the fuel supply unchanged, the air residue coefficient when using biodiesel fuel is higher and increases the ability to oxidize CO to CO2 [26]. The results on CO emissions at the loading modes as well as the trend of CO change, according to the biodiesel mixing ratio, are shown in Figure 8 and Figure 9.
The average CO emissions decreased by 4.67% for B10 and dropped by up to 27.43% for B50. The relationship between CO change and biodiesel mixing ratio according to a function is as follows:
y = 0.5402 x + 0.621
where:
y: % CO emission change;
x: % biodiesel blend.
NOx is produced through nitrogen oxidation in the air under high temperature conditions. Because nitrogen has many valences, nitrous oxide exists in many different forms, collectively known as NOx. In engine exhausts, NOx exists in two main forms, NO2 and NO. The results of NOx emissions are shown in Figure 10 and Figure 11.
The results show that, when increasing the biodiesel blending ratio, NOx emissions also increase accordingly, because the biodiesel fuel mixture burns faster, resulting in a higher production of heat. The combustion chamber temperature is also higher [27,28]. On average, for all loading modes, NOx emissions increased by 2.43%, 4.00%, 5.53%, 8.3%, 10.73%, respectively, when using B10, B20, B30, B40, B50. Accordingly, it is possible to provide a function showing the relationship between the increase in NOx emissions and the biodiesel mixing ratio, as follows:
y = 0.208 x 0.0343
where:
y: % NOx emission change;
x: % biodiesel blend.
Soot is a particularly important pollutant in diesel-engine exhaust. The results of soot emissions from the engine when using different types of fuels in different load modes are shown in Figure 12. The trend of soot is shown in Figure 13.
Soot emissions were significantly reduced because oxygen contained in the fuel composition helps to oxidize the soot more thoroughly [29,30]. Accordingly, soot emissions are greatly reduced when using biodiesel fuel. Specifically, a 6.2% reduction occurs when using B10 and a reduction of up to 30.2% was observed when using B50. The effect of the biodiesel blending ratio on soot-emission reduction is presented in the following equation:
y = 0.5984 x 0.2024
where:
y: % Soot emission change;
x: % biodiesel blend.

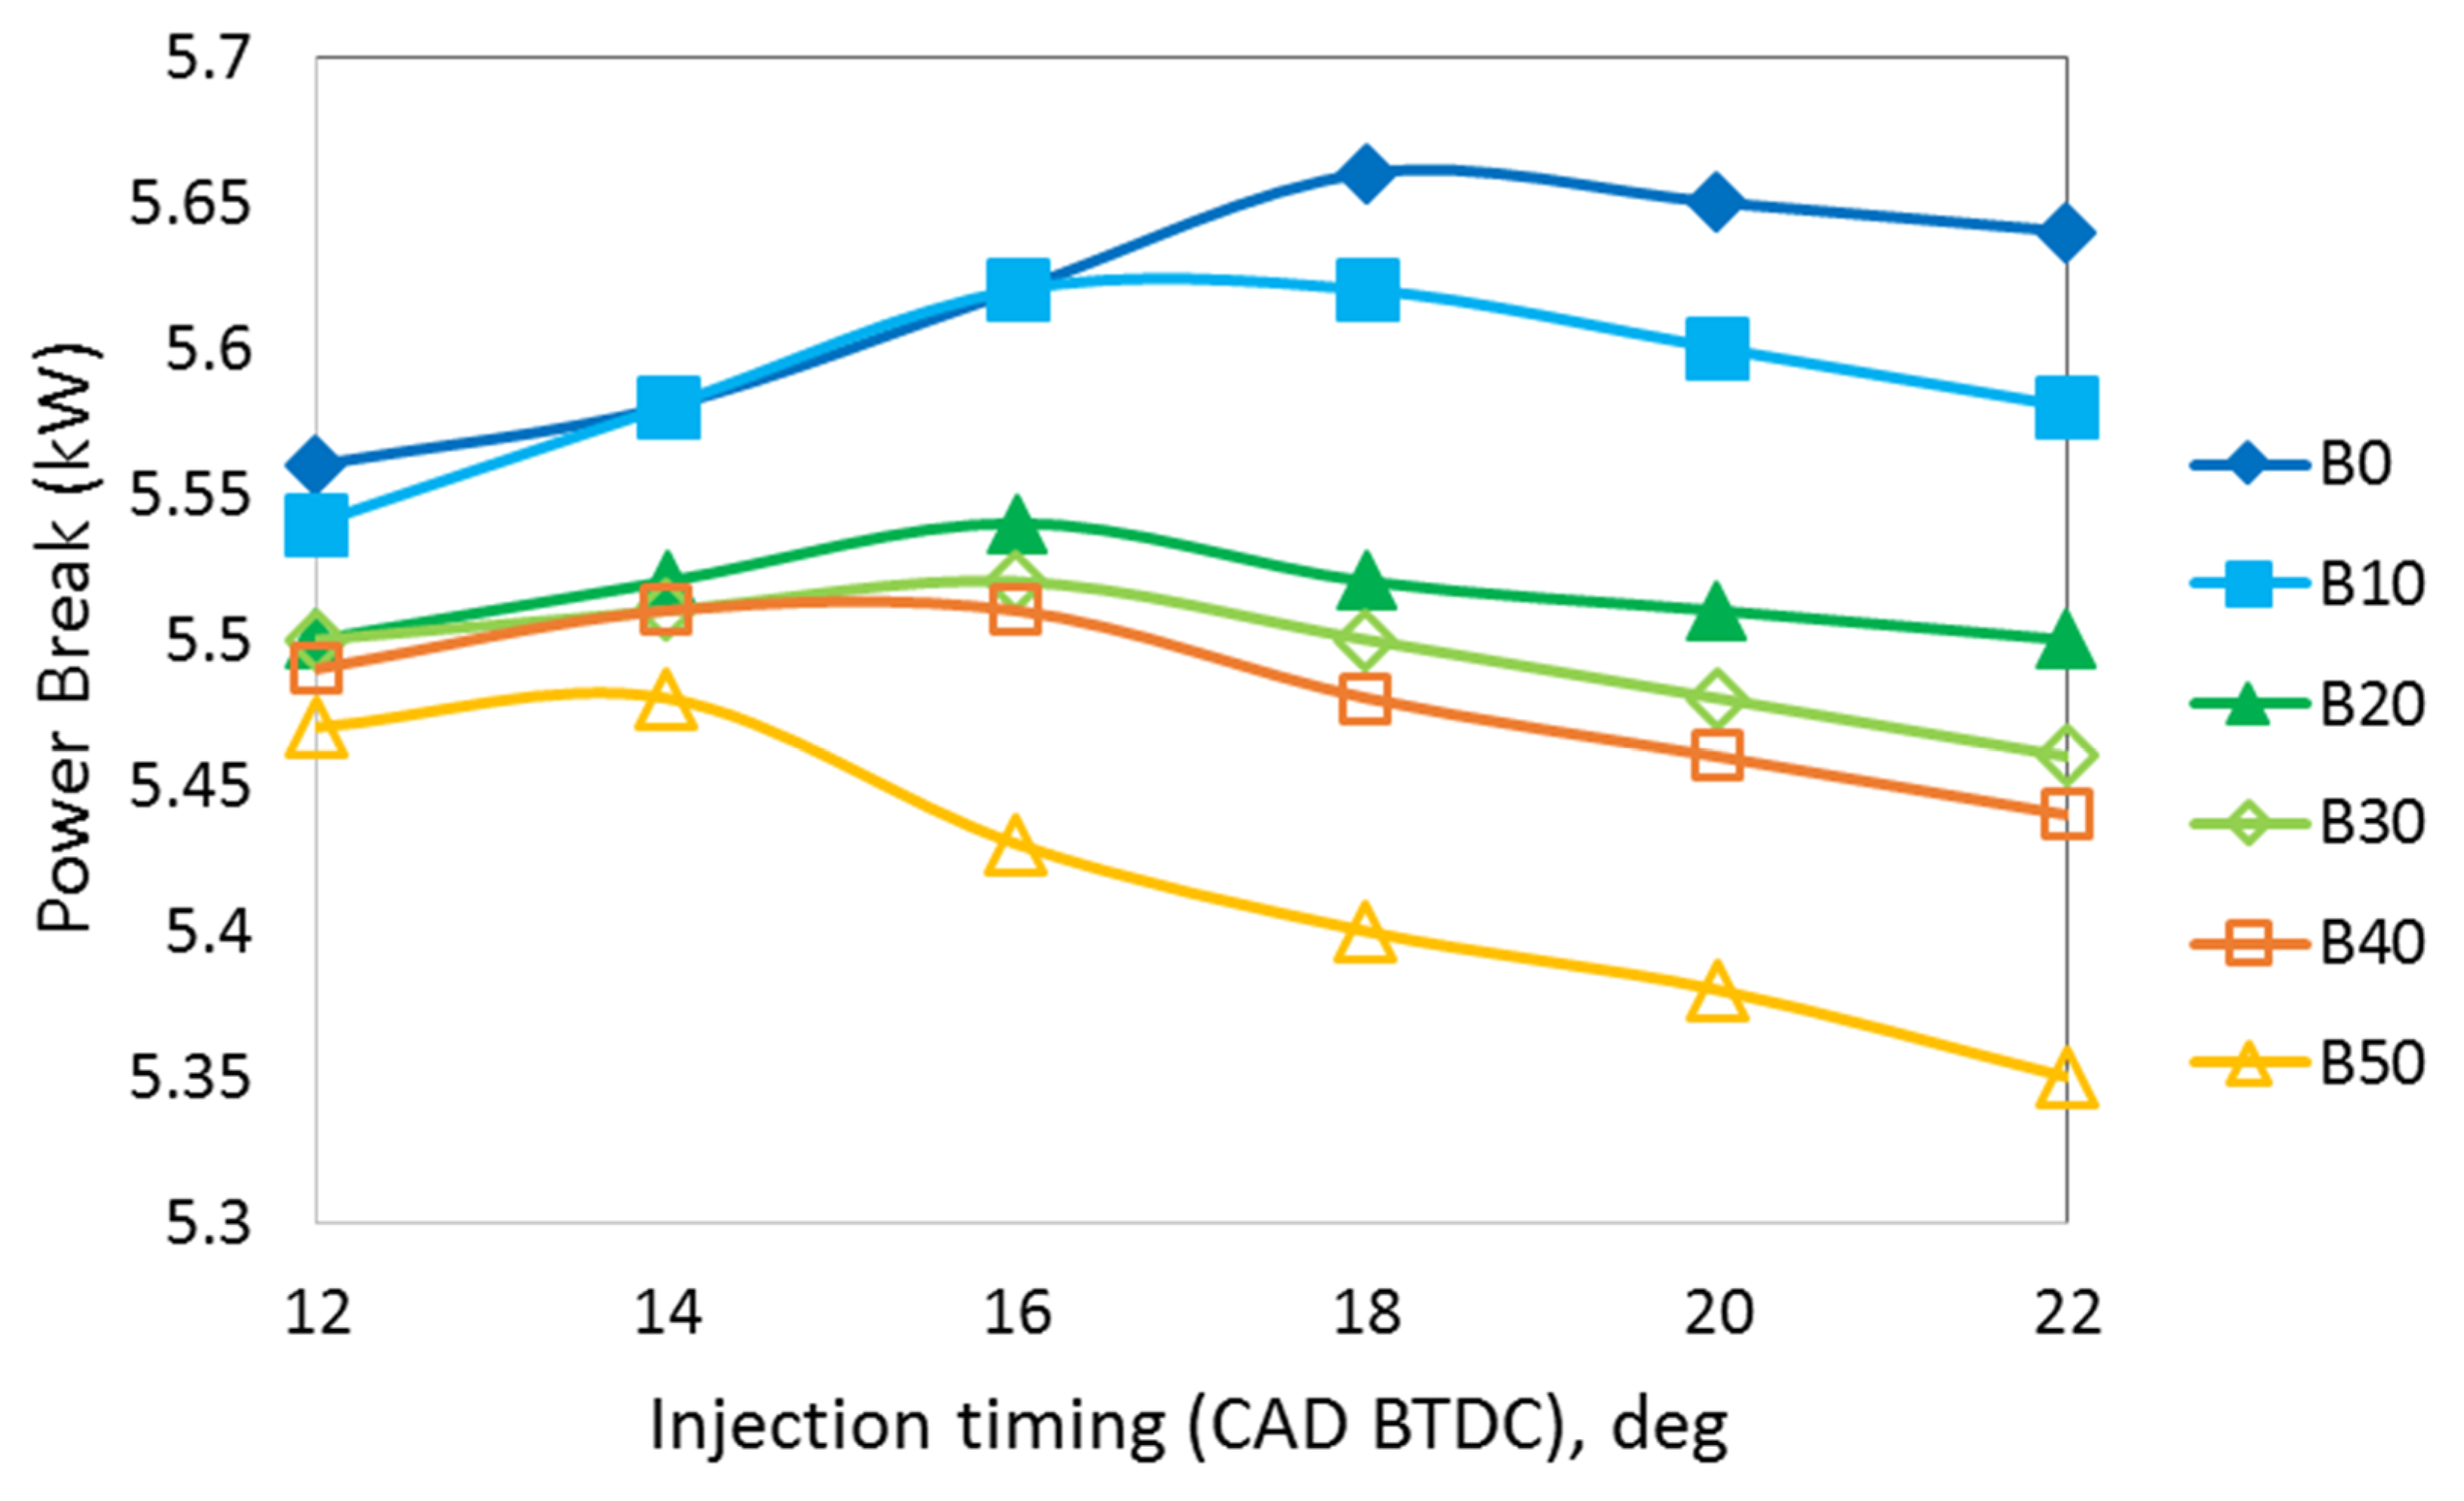
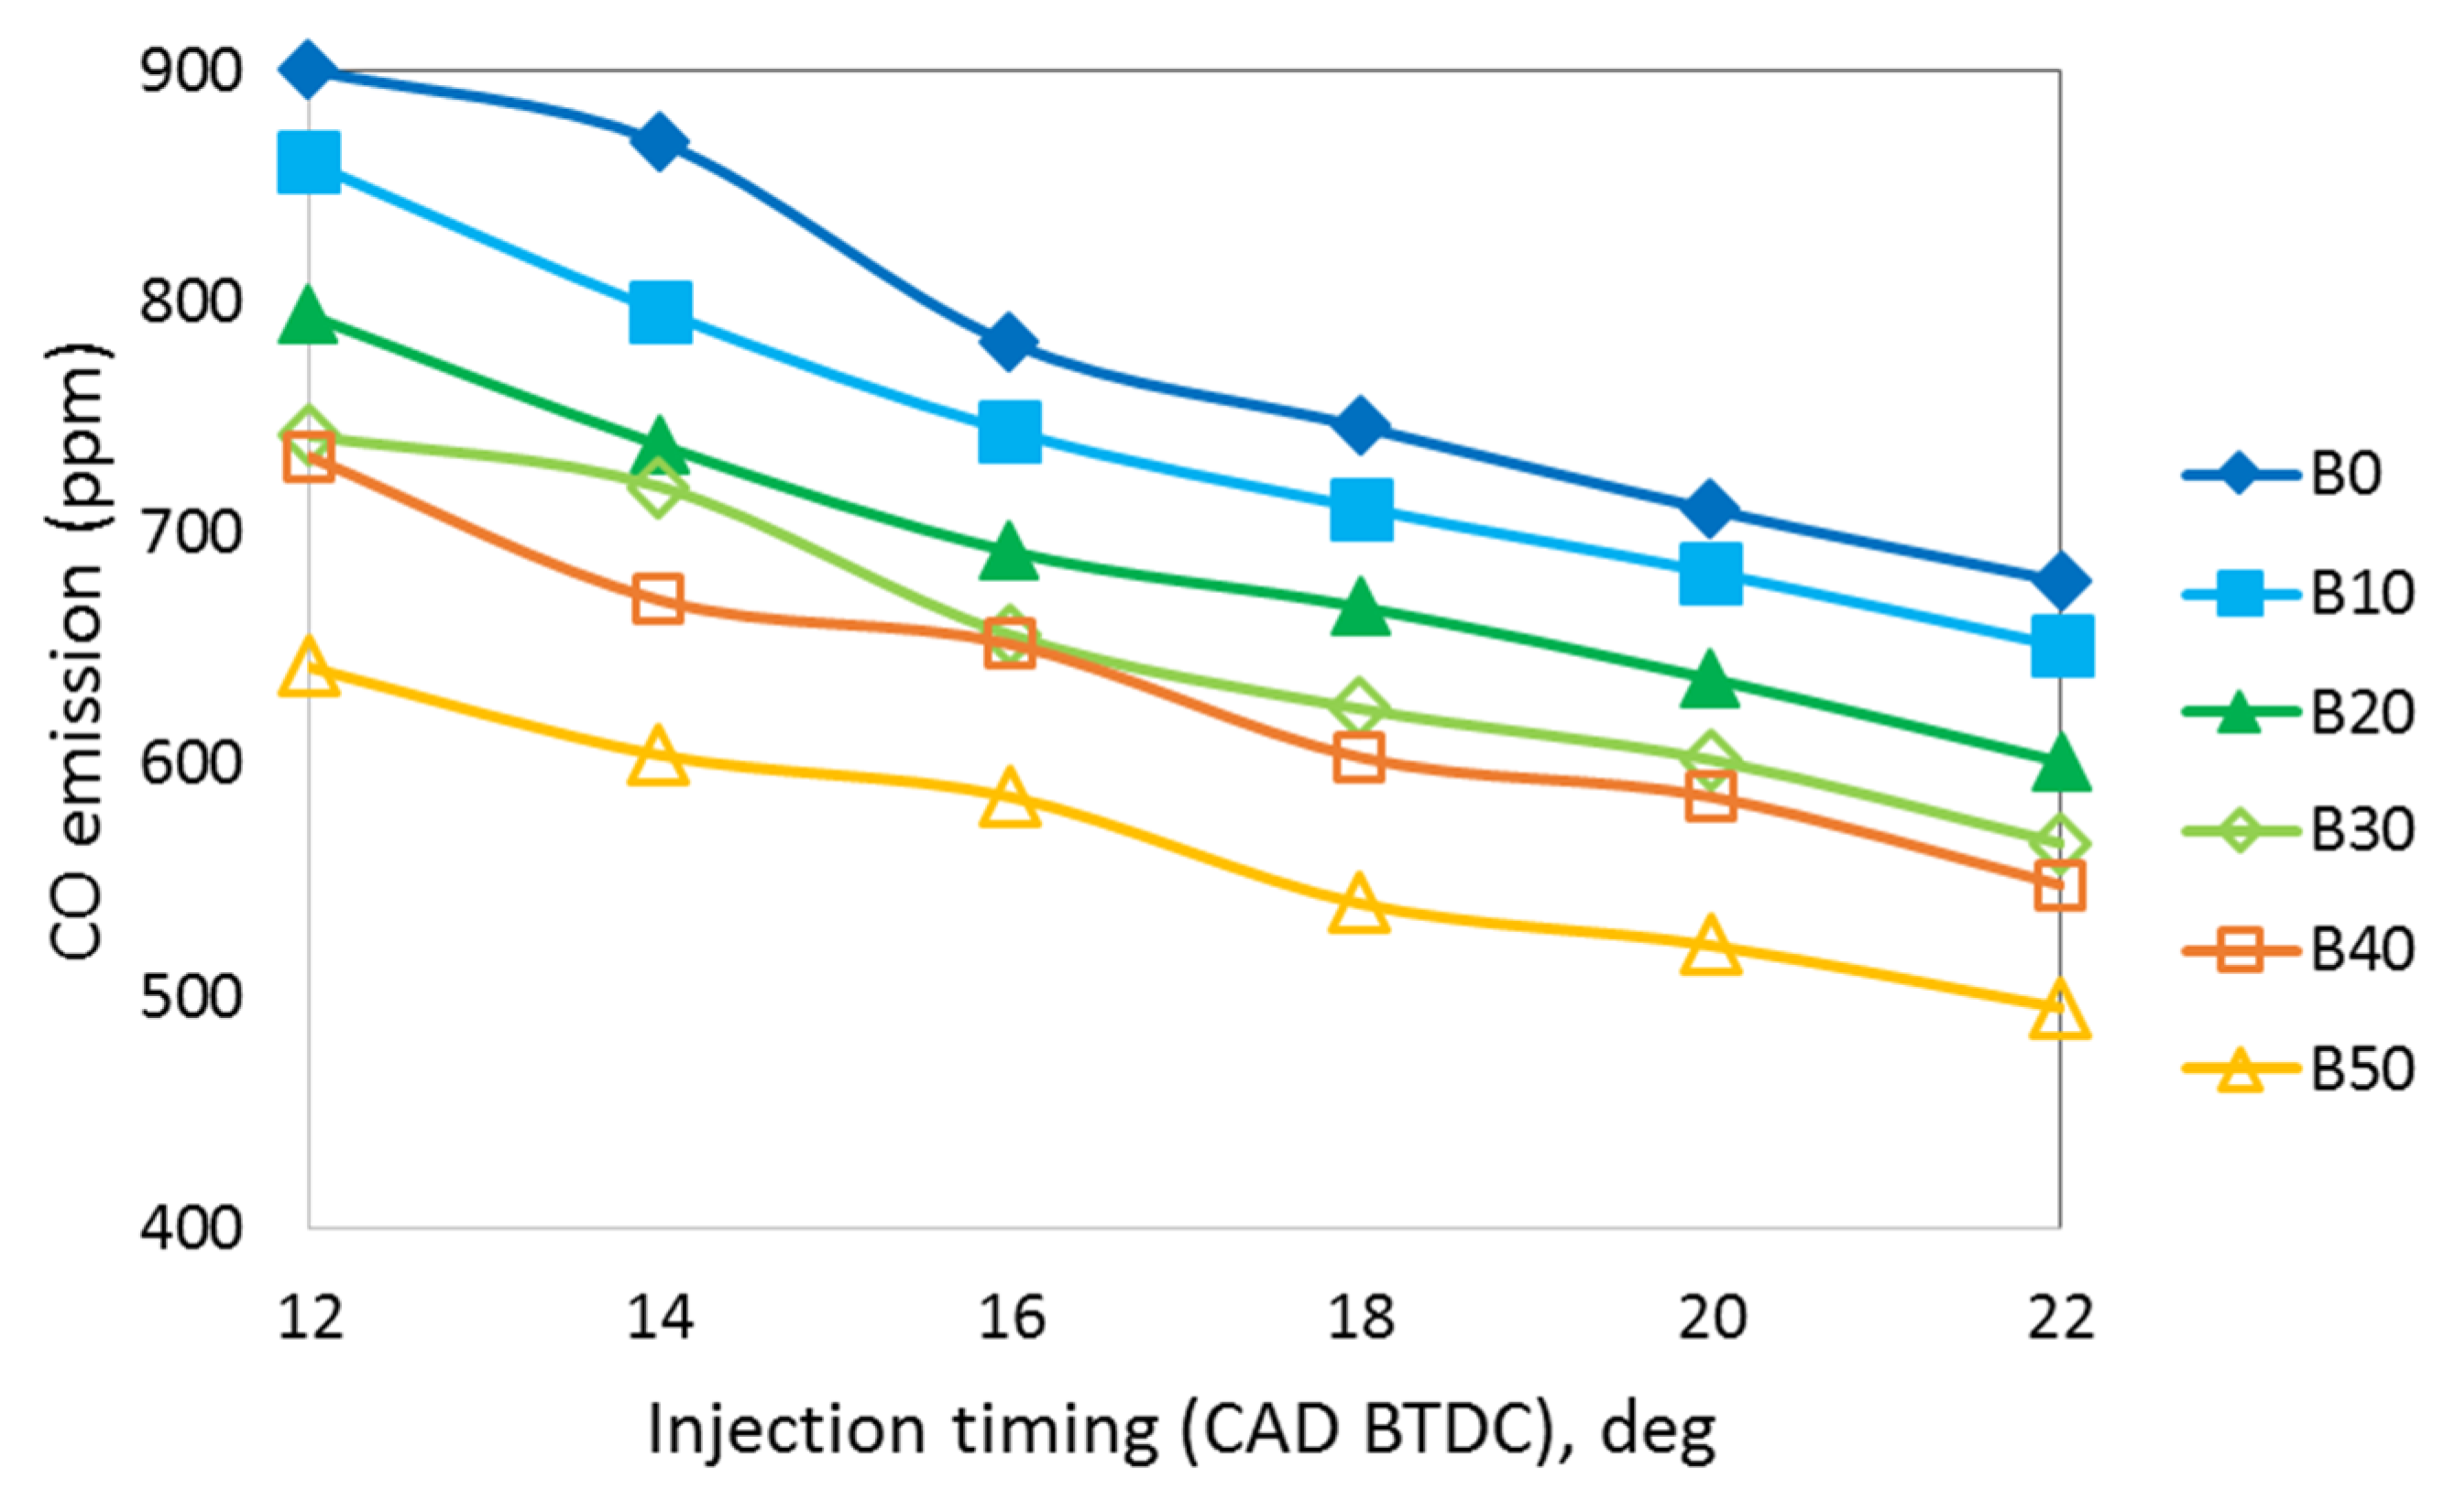
3.3. The Effect Injection Timing

The influence of an early injection angle on engine performance can be calculated at a 75% load mode, with a speed of 2200 vg/min, corresponding to the fuel-cycle supply gct = 0.0175 (g), which a change in the early injection angle from 12 to 22 degrees CA. The results of the capacity for each fuel injection are presented in Figure 14.
As the results in Figure 14 show, with an earlier injection angle in the survey region, the initial engine power also gradually increases and reaches its maximum value at a certain early injection angle (the optimal early injection angle), then the capacity gradually decreases. This can be explained by the influence of fuel properties on the optimal combustion to generate maximum power. At a small early injection angle, a delayed injection can cause the combustion process to move backwards, reducing the efficiency of work. In contrast, a larger early injection angle (spraying too early) causes the combustion process to move forward and the phenomenon of both combustion and compression occur. All of the above cases reduce the power of the engine. As the biodiesel mixing ratio increases, the optimal early injection angle tends to decrease. That is, the injection time is later. The biodiesel has a higher cetane number, which reduces ignition delay, resulting in earlier combustion [31,32,33]. Specifically, maximum power is achieved with B0 at 18 deg, B10 at 17 deg, B20 at 16 deg, B30 at 16 deg, B40 at 15 deg, and B50 at 14 deg. These are the optimal injection times for the maximum power that can be provided by all types of fuels.
The value of the fuel consumption rate corresponding to each value of the early injection angle is shown in Figure 15. The results show that the law of the changing fuel consumption rate when changing the early injection angle is similar to the law of changing work capacity. The amount of fuel supplied does not change, so at the optimal injection angle value, the maximum power results in the lowest level of fuel consumption.
The CO, NOx, Soot emissions of the engine when using different types of fuel, according to different injection angle values are shown in Figure 16, Figure 17 and Figure 18.
In general, the evolution of emissions from fuels tends to be similar when changing the early injection angle. At each early injection angle, CO and soot emissions are always smaller than B0, while NOx emissions are greater. The evolution of CO and soot emissions when changing the injection time is similar; that is, when the early injection angle is increased, the emissions decrease. For CO emissions, this can be explained by the fact that combustion begins earlier, so the time spent on the combustion increases gradually, which facilitates the oxidation of CO to CO2 as well as the resulting emission of carbon dioxide, with reduced CO emissions. Soot emissions are the additional burning time of unburnt fuel components as well as soot oxidation.
Initially, the evolution of NOx emissions rapidly increased and then gradually decreased, but with small changes. Initially, at a small injection angle (late injection), the combustion process moves backwards, making the power and temperature of the combustion chamber small, which means that the amount of NOx is small. When gradually increasing the early injection angle, the capacity and temperature of the combustion chamber increase, so NOx production rapidly increases. At a large injection angle (injecting too early), the combustion process moves forward. A phenomenon of both combustion and compression occurs, which leads to a slow increase the combustion temperature and reduced NOx.
Thus, at each injection angle, the value for maximum power and minimum BSFC will be different in terms of emission values. However, compared with the emissions at the optimal injection angle for B0 fuel, the emissions at the optimal injection angle with biodiesel fuel are still lower, and only NOx emissions are higher, which is acceptable. From there, it is possible to provide the rule of changing the optimal injection angle when changing the biodiesel mixing ratio, according to a relational function, which is shown in Figure 19.

4. Conclusions

In this research, a simulation model was successfully setup to simulate a common-rail engine using biodiesel fuel. The results of the research show that the biodiesel blending ratio and injection timing have a significant effect on engine performance. With the higher biodiesel blend ratio, the engine power, CO, and soot emissions tend to decrease, while the BSFC and NOX emissions tend to increase. The equations that present the relationships between biodiesel blend ratios and engine power, BSFC, NOx, CO, and soot emissions, were determined and discussed in detail. The economic, technical, emission and early injection parameters are all related to the biodiesel mixing ratio, which are expressed through a certain function. In future work, the effect of this biodiesel fuel on auto ignition delay and lift-off length under the low-temperature stage will be studied.

Author Contributions

Conceptualization, N.T.N. and N.X.K.; methodology, N.T.N. and W.C.; software, N.T.N. and W.C.; validation, N.T.N., N.X.K. and O.L.; formal analysis, N.T.N. and W.C.; resources, N.T.N.; data curation, N.X.K.; writing—original draft preparation, N.T.N.; writing—review and editing, N.X.K. and O.L.; supervision. All authors have read and agreed to the published version of the manuscript.

Funding

This work was supported by the Industrial Strategic Technology Development Program- Development of low flash point fuel injection system for hazardous emission reduction from small and meddle class ships (Project No.: 20013146) funded By the Ministry of Trade, Industry & Energy (MOTIE), Korea. “This work was supported by Korea Institute of Planning and Evaluation for Technology in Food, Agriculture and Forestry (IPET) and Korea Smart Farm R&D Foundation (KosFarm) through Smart Farm Innovation Technology Development Program, funded by Ministry of Agriculture, Food and Rural Affairs (MAFRA) and Ministry of Science and ICT (MSIT), Rural Development Administration (RDA) (1545024470)”. “This research is financially supported by the individual basic research project by the National Research Foundation of Korea (NRF-2021R1F1A1048238, Reliability Improvement of Ammonia- Diesel Dual-Fuel Combustion Model regarding Optimized Combustion Strategy for Improved Combustion Efficiency and Emission Characteristics)”. This results was supported by “Regional Innovation Strategy (RIS)” through the National Research Foundation of Korea (NRF) funded by the Ministry of Education (MOE) (2021RIS-003).

Institutional Review Board Statement

Not applicable.

Informed Consent Statement

Not applicable.

Data Availability Statement

Not applicable.

Conflicts of Interest

The authors declare no conflict of interest.

References

  1. Nizetic, S.; Djilali, N.; Papadopoulos, A.; Rodrigues, J.J.P.C. Smart technologies for promotion of energy effciency, utilization of sustainable resources and waste management. J. Clean Prod. 2019, 231, 565–591. [Google Scholar] [CrossRef]
  2. Watts, N.; Amann, M.; Ayeb-Karlsson, S.; Belesova, K.; Bouley, T.; Boykoff, M.; Bypass, P.P.; Cai, W.; Campbell-Lendrum, D.; Cambers, J.; et al. The Lancet Countdown on health and climate change: From 25 years of inaction to a global transformation for public health. Lancet 2018, 391, 581–630. [Google Scholar] [CrossRef]
  3. Rajaeifar, M.A.; Tabatabaei, M.; Aghbashlo, M.; Nizami, A.-S.; Heidrich, O. Emissions from urban bus fleets running on biodiesel blends under real-world operating conditions: Implications for designing future case studies. Renew. Sustain. Energy Rev. 2019, 111, 276–292. [Google Scholar] [CrossRef]
  4. Aghbashlo, M.; Tabatabaei, M.; Mohammadi, P.; Mirzajanzadeh, M.; Ardjmand, M.; Rashidi, A. Effect of an emission-reducing soluble hybrid nanocatalyst in diesel/biodiesel blends on exergetic performance of a DI diesel engine. Renew. Energy 2016, 93, 353–368. [Google Scholar] [CrossRef]
  5. Aghbashlo, M.; Hosseinpour, S.; Tabatabaei, M.; Mojarab Soufyan, M. Multi-objective exergetic and technical optimization of a piezoelectric ultrasonic reactor applied to synthesize biodiesel from waste cooking oil (WCO) using soft computing techniques. Fuel 2019, 235, 100–112. [Google Scholar] [CrossRef]
  6. Aghbashlo, M.; Tabatabaei, M.; Khalife, E.; Roodbar Shojaei, T.; Dadak, A. Exergoeconomic analysis of a DI diesel engine fueled with diesel/biodiesel (B5) emulsions containing aqueous nano cerium oxide. Energy 2018, 149, 967–978. [Google Scholar] [CrossRef]
  7. Van Gerpen, J. Biodiesel processing and production. Fuel Process Technol. 2005, 86, 1097–1107. [Google Scholar] [CrossRef]
  8. Aghbashlo, M.; Shamshirband, S.; Tabatabaei, M.; Yee, L.; Larimi, Y.N. The use of ELMWT (extreme learning machine with wavelet transform algorithm) to predict exergetic performance of a DI diesel engine running on diesel/biodiesel blends containing polymer waste. Energy 2016, 94, 443–456. [Google Scholar] [CrossRef]
  9. Demirbas, A. Importance of biodiesel as transportation fuel. Energy Policy 2007, 35, 4661–4670. [Google Scholar] [CrossRef]
  10. Aghbashlo, M.; Tabatabaei, M.; Hosseinpour, S. On the exergoeconomic and exergoenvironmental evaluation and optimization of biodiesel synthesis from waste cooking oil (WCO) using a low power, high frequency ultrasonic reactor. Energy Convers Manag. 2018, 164, 385–398. [Google Scholar] [CrossRef]
  11. Krahl, J.; Munack, A.; Schröder, O.; Stein, H.; Bunger, J. Influence of biodiesel and different designed diesel fuels on the exhaust gas emissions and health effects. SAE Pap. 2003, 112, 2447–2455. [Google Scholar]
  12. Lin, B.-F.; Huang, J.-H.; Huang, D.-Y. Experimental study of the effects of vegetable oil methyl ester on DI diesel engine performance characteristics and pollutant emissions. Fuel 2009, 88, 1779–1785. [Google Scholar] [CrossRef]
  13. Jeon, J.; Park, S. Effect of injection pressure on soot formation/oxidation characteristics using a two-color photometric method in a compression-ignition engine fueled with biodiesel blend (B20). Appl. Therm. Eng. 2018, 131, 284–294. [Google Scholar] [CrossRef]
  14. ASTM D7467-18b. Standard Specification for Diesel Fuel Oil, Biodiesel Blend (B6 to B20). ASTM International (ASTM): West Conshohocken, PA, USA, 2018.
  15. Khoa, N.X.; Lim, O. Comparative Study of the Effective Release Energy, Residual Gas Fraction, and Emission Characteristics with Various Valve Port Diameter-Bore Ratios (VPD/B) of a Four-Stroke Spark Ignition Engine. Energies 2020, 13, 1330. [Google Scholar] [CrossRef] [Green Version]
  16. Khoa, N.X.; Lim, O.T. Effective release energy, residual gas, and engine emission characteristics of a V-twin engine with various exhaust valve closing timings. J. Mech. Sci. Technol. 2020, 34, 477–488. [Google Scholar] [CrossRef]
  17. Khoa, N.X.; Lim, O. The Internal Residual Gas and Effective Release Energy of a Spark-Ignition Engine with Various Inlet Port–Bore Ratios and Full Load Condition. Energies 2021, 14, 3773. [Google Scholar] [CrossRef]
  18. Khoa, N.X.; Lim, O.T. The effects of bore-stroke ratio on effective release energy, residual gas, peak pressure rise and combustion duration of a V-twin engine. J. Mech. Sci. Technol. 2020, 34, 2657–2666. [Google Scholar] [CrossRef]
  19. Theory-AVL Boost Version 2011.1. Available online: https://www.avl.com/boost (accessed on 20 March 2020).
  20. Sridharan, G.; Chandramouli, R.; Mohamed, M.M.; Ashok, K.T. Performance, Combustion and Emission Characteristics of a Single Cylinder CI Engine Running on Diesel-Biodiesel-Water Emulsion with Additive. Available online: https://www.tandfonline.com/doi/full/10.1080/15567036.2019.1704948 (accessed on 20 March 2020).
  21. Mohammad, S.; Tarahom, M.G.; Ahmad, J.; Aram, H.-M. Performance and emission characteristics of a diesel engine fueled with functionalized multi-wall carbon nanotubes (MWCNTs-OH) and diesel–biodiesel–bioethanol blends. Energy Rep. 2020, 6, 1438–1447. [Google Scholar]
  22. Nguyen, T.N.; Khoa, N.X.; Tuan, L.A. The Correlation of Biodiesel Blends with the Common Rail Diesel Engine’s Performance and Emission Characteristics. Energies 2021, 14, 2986. [Google Scholar] [CrossRef]
  23. Yesilyurt, M.K.; Aydin, M. Experimental investigation on the performance, combustion and exhaust emission characteristics of a compression-ignition engine fueled with cottonseed oil biodiesel/diethyl ether/diesel fuel blends. Energy Convers. Manag. 2020, 205, 112355. [Google Scholar] [CrossRef]
  24. Mendecka, B.; Lombardi, L.; Kozioł, J. Probabilistic multi-criteria analysis for evaluation of biodiesel production technologies from used cooking oil. Renew. Energy 2020, 147, 2542–2553. [Google Scholar] [CrossRef]
  25. Gharehghani, A.; Mirsalim, M.; Hosseini, R. Effects of waste fish oil biodiesel on diesel engine combustion characteristics and emission. Renew. Energy 2017, 101, 930–936. [Google Scholar] [CrossRef]
  26. Sanli, H.; Canakci, M.; Alptekin, E.; Turkcan, A.; Ozsezen, A.N. Effects of waste frying oil based methyl and ethyl ester biodiesel fuels on the performance, combustion and emission characteristics of a DI diesel engine. Fuel 2015, 159, 179–187. [Google Scholar] [CrossRef]
  27. Rajesh Kumar, B.; Saravanan, S.; Rana, D.; Nagendran, A. Use of some advanced biofuels for overcoming smoke/NOx trade-off in a light-duty DI diesel engine. Renew. Energy 2016, 96, 687–699. [Google Scholar] [CrossRef]
  28. Nguyen, T.N.; Pham, P.M.; Tuan, L.A. Spray, combustion, performance and emission characteristics of a common rail diesel engine fueled by fish-oil biodiesel blends. Fuel 2020, 269, 117108. [Google Scholar] [CrossRef]
  29. Can, Ö.; Öztürk, E.; Yücesu, H.S. Combustion and exhaust emissions of canola biodiesel blends in a single cylinder DI diesel engine. Renew. Energy 2017, 109, 73–82. [Google Scholar] [CrossRef]
  30. Suresh, M.; Jawahar, C.P.; Richard, A. A review on biodiesel production, combustion, performance, and emission characteristics of non-edible oils in variable compression ratio diesel engine using biodiesel and its blends. Renew. Sustain. Energy Rev. 2018, 92, 38–49. [Google Scholar] [CrossRef]
  31. Jiaqiang, E.; Minh-Hieu, P.; Yuanwang, D.; Tuannghia, N.; Vinh-Nguyen, D.; Duc-Hieu, L.; Wei, Z.; Qingguo, P.; Zhiqing, Z. Effects of injection timing and injection pressure on performance and exhaust emissions of a common rail diesel engine fueled by various concentrations of fish-oil biodiesel blends. Energy 2018, 149, 979–989. [Google Scholar]
  32. Agarwal, A.K.; Dhar, A.; Gupta, J.G.; Kim, W.I.; Choi, K.; Lee, C.S.; Park, S. Effect of fuel injection pressure and injection timing of Karanja biodiesel blends on fuel spray, engine performance, emissions and combustion characteristics. Energy Convers. Manag. 2015, 91, 302–314. [Google Scholar] [CrossRef]
  33. Zuo, Q.; Xie, Y.; Jiaqiang, E.; Zhu, X.; Zhang, B.; Tang, Y.; Zhu, G.; Wang, Z.; Zhang, J. Effect of different exhaust parameters on NO conversion efficiency enhancement of a dual-carrier catalytic converter in the gasoline engine. Energy 2020, 191, 116521. [Google Scholar] [CrossRef]
Figure 1. Engine simulation model. SBi: system boundary; CL1: air cleaner; Ri: restriction, PLi: plenum; C1: Cylinder; CAT1: Catalyst; Mi: measuring points.
Energies 15 00242 g001
Figure 2. Model validation.
Energies 15 00242 g002
Figure 3. Effect of biodiesel on engine power.
Energies 15 00242 g003
Figure 4. Trending Engine power follows biodiesel blends.
Energies 15 00242 g004
Figure 5. Effect of biodiesel on engine BSFC.
Energies 15 00242 g005
Figure 6. Trending Engine BSFC follows biodiesel blends.
Energies 15 00242 g006
Figure 7. A/F ratio with biodiesel blends.
Energies 15 00242 g007
Figure 8. Effect of biodiesel on CO emission.
Energies 15 00242 g008
Figure 9. Trending CO emission follows biodiesel blends.
Energies 15 00242 g009
Figure 10. Effect of biodiesel on NOx emission.
Energies 15 00242 g010
Figure 11. Trending NOx emission follows biodiesel blends.
Energies 15 00242 g011
Figure 12. Effect of biodiesel on NOx emission.
Energies 15 00242 g012
Figure 13. Trending Soot emission follows biodiesel blends.
Energies 15 00242 g013
Figure 14. Effect of injection timing on engine power.
Energies 15 00242 g014
Figure 15. Effect of injection timing on engine BSFC.
Energies 15 00242 g015
Figure 16. Effect of injection timing on engine CO emission.
Energies 15 00242 g016
Figure 17. Effect of injection timing on engine NOx emission.
Energies 15 00242 g017
Figure 18. Effect of injection timing on engine Soot emission.
Energies 15 00242 g018
Figure 19. Trending injection timing follows biodiesel blends.
Energies 15 00242 g019
Table 1. Specifications of the engine.
ParameterValue
1Bore85 mm
2Stroke (S)90 mm
3Volume of Displacement 510.7 cm3
4Compression ratio 17:1
5Rate power/speed9/3200 kW/rpm
Table 2. Properties of test fuel.
PropertyUnitMethodB0B10B20B30B40B50B100
Heating value MJ/kgASTM
D240
42.7642.2641.8441.2941.0341.2937.58
Cetane value ASTM
D613
49505152535456
Density at 15 °C kg/m3ASTM
D1298
838840845848852857866
Kinematic viscosity at 40 °C ASTM
D445
3.223.313.473.563.673.764.40
Flash point cStASTM
D93
677175808489142
Sulfur content ppmASTM
D5453
42843043343643944126
Water content ppmASTM
D6304
628496110122136215
Table 3. Injected fuel mass at part loads.
Speed
(rpm)
Fuel Supplied to the Cycle, gct (g) at Part Loads
75%50%25%
22000.01750.012250.00715
Publisher’s Note: MDPI stays neutral with regard to jurisdictional claims in published maps and institutional affiliations.

