Abstract
The need to reduce global carbon dioxide (CO2) emissions is driving the conversion of coal-fired power plants to use methane, which can reduce CO2 emissions by >40%. However, conducting gas firing in coal boilers changes the heat transfer profile; therefore, preliminary evaluations using computational fluid dynamics are required prior to conversion. Here, methane was used as a heat input source in the simulation of an existing coal boiler, and combustion, nitrogen oxides (NOx) emission characteristics, and heat transfer profile changes inside the boiler were analyzed. Furthermore, changes in the burner zone stoichiometric ratio (BZSR) were simulated to restore the decreased heat absorption of the furnace waterwall, revealing that air distribution could change the heat absorption of the waterwall and tube bundles. However, this change was smaller than that caused by conversion from coal to methane. Therefore, to implement gas firing in coal boilers, alternatives such as output derating, using an attemperator, or modifying heat transfer surfaces are necessary. Despite these limitations, a 70% reduction in NOx emissions was achieved at a BZSR of 0.76, compared with coal. As the BZSR contributes significantly to NOx emissions, conducting gas firing in existing coal boilers could significantly reduce NOx and CO2 emissions.
1. Introduction
Globally, electricity generation sources are being converted to renewable energy to reduce carbon dioxide (CO2) emissions. To this end, it is important to determine the operational flexibility of existing power plants [1,2]. Transitioning from coal to natural gas can mitigate CO2 emissions, and gas-fired power plants can serve as a buffer to respond to the intermittency and variability of renewable energy sources [3,4,5,6]. Thus, the use of natural gas in energy generation is increasing, in addition to increases in renewable energy sources [7,8,9]. Simultaneously, coal power generation is rapidly declining, although many coal-fired facilities remain in operation.
The use of methane in existing coal boilers could help solve this issue by improving their operational flexibility while reducing CO2 emissions [10]. Replacing bituminous coal with methane can reduce CO2 emissions by approximately 43%, while almost completely eliminating emissions of particulate matter, sulfur oxides, and mercury. This approach could also reduce emissions of nitrogen oxides (NOx) [11,12,13]. The effects of methane co-firing on NOx emissions and combustibility have been investigated previously using computational fluid dynamics (CFD) [14]. In this previous study, CFD modelling was performed to explore the process of completely converting the fuel source from coal to methane in existing coal-fired boiler facilities. Injecting methane gas from nozzles inside start-up oil burners can further reduce CO2 emissions as the methane can replace the oil fuel required for boiler start-up [15]. In addition, converting existing coal boilers to fire methane requires significantly lower construction costs than building gas-fired combined-cycle plants [16]. Han et al. [17] evaluated the economic feasibility of fuel conversion options for coal-fired boilers. Natural gas represents a promising cost-effective alternative to coal-fired boilers. However, fluctuations in fuel prices can play an important role in determining economic feasibility. In this regard, using oil burners without replacing the coal burner enables the utilization of both coal and methane gas as fuel; this avoids total reliance on a single fuel source, thereby increasing flexibility [18].
One consideration during the conversion of coal-fired plants is whether there will be an accompanying change in performance [19]. In general, firing natural gas in a coal boiler decreases the boiler’s efficiency. However, this practice also reduces auxiliary power requirements, meaning that the plant efficiency does not necessarily decrease significantly. A further consideration is that gas firing usually increases the furnace exit gas temperature (FEGT) in the boiler and changes the heat transfer profile [20,21]. These changes typically require modifications to heat transfer surfaces or plant operations. Thus, it is necessary to evaluate the heat transfer profile prior to converting the fuel source of a coal boiler; CFD is a useful tool for such an evaluation.
This study investigated the effect of converting an existing coal boiler to run on methane on the boiler’s thermal characteristics. In addition, changes in the heat transfer profile under different stoichiometric ratios (SRs) in the burner zone were evaluated to explore whether adjusting the air distribution could suppress heat transfer changes. As certain operations can cause excessive NOx emissions, NOx formation characteristics were also simultaneously investigated. This study evaluated the heat absorption of steam tubes and boiler outlet NOx emissions for the cases investigated, with the aim of obtaining data that can guide the conversion of existing coal boilers to run on methane.
2. Computational Methods
2.1. Boiler Geometry and Mesh
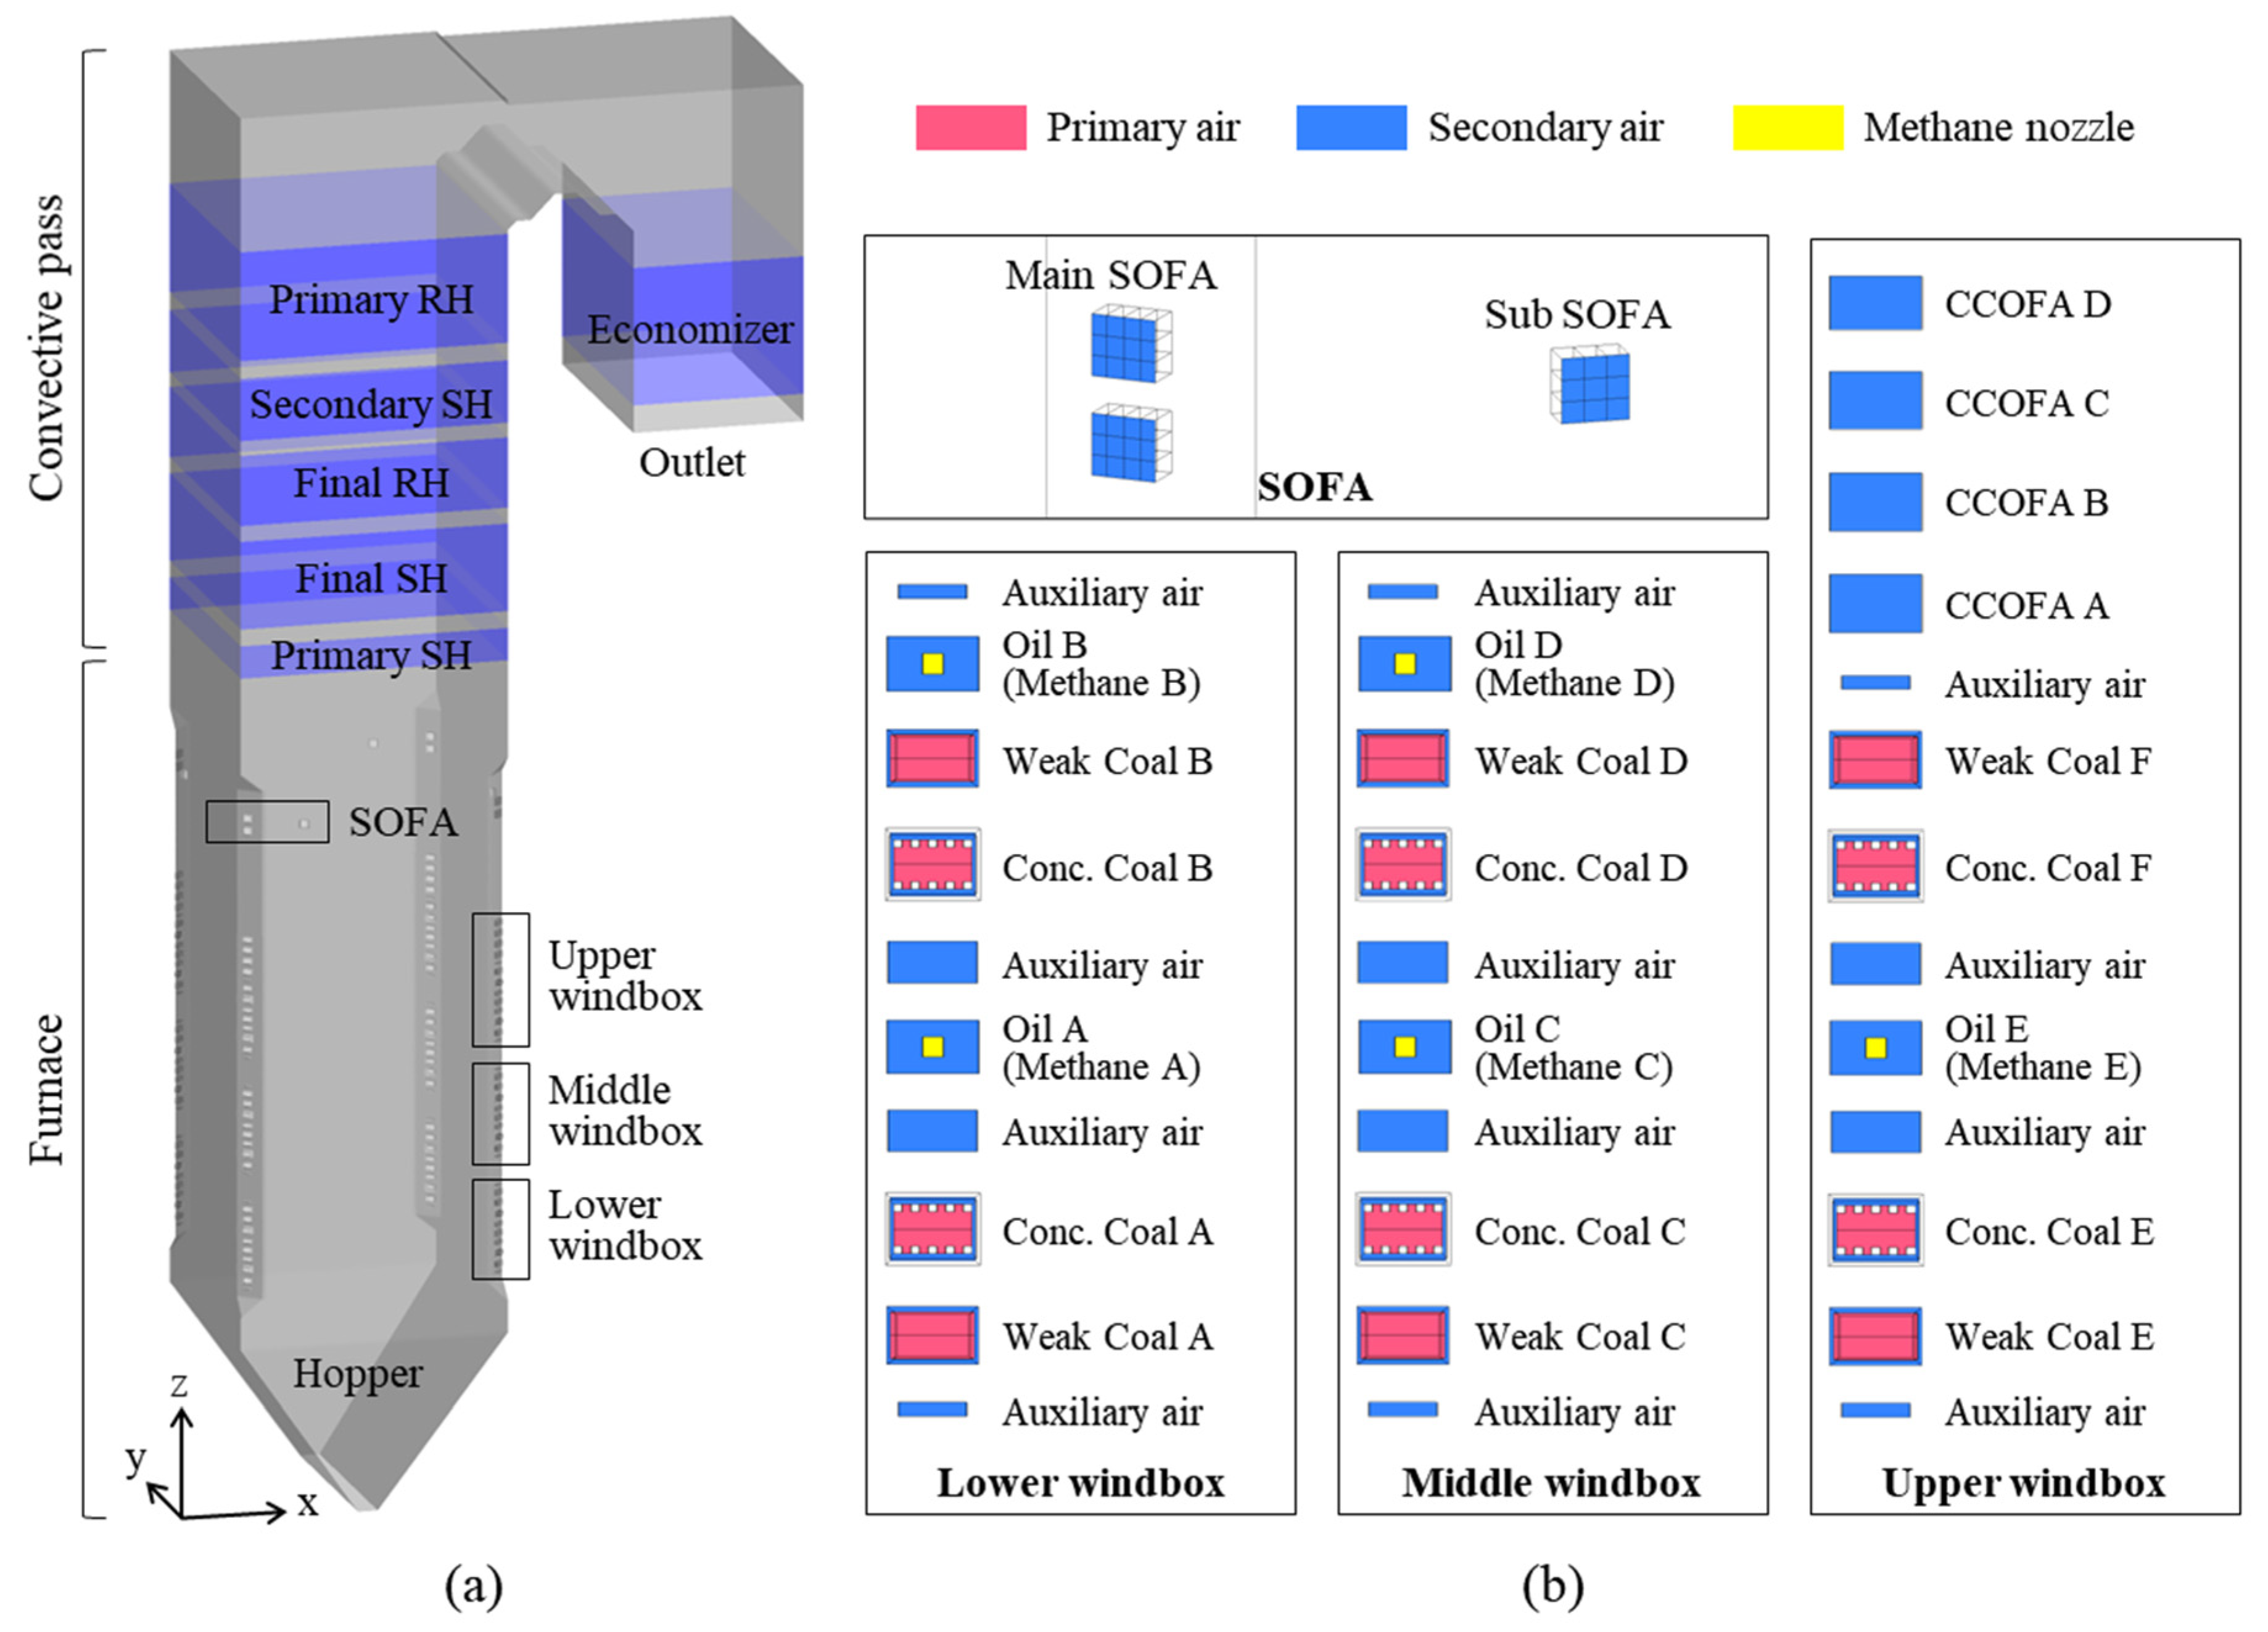
The boiler studied was the Boryeong Power Plant Unit 3, which is a 550 MW, tangentially fired, pulverized coal boiler; it was upgraded to an ultra-supercritical boiler at the end of 2019 (Figure 1). The coal burner tip and pressure part were replaced, and a separated overfire air (SOFA) system was installed with the aim of improving its operational flexibility and further reducing its NOx emissions. The boiler is 87 m high, and the furnace has a rectangular cross-section of 16.5 × 16.5 m. At the four corners of the furnace, coal burners and air ports are stacked in multiple layers. During operation, coal particles and air jets are injected at a direction 6° away from the center of the furnace. The streams from each corner collide with each other to form a strong vortex, which rises in a spiral and forms a fireball. Within the furnace, most of the coal particles burn out, releasing heat to the surrounding gas. This hot flue gas then heats steam by transferring heat to the furnace waterwall and tube bundles in the convective pass. The cooled flue gas exits the boiler outlet with fly ash, which contains unburned carbon.
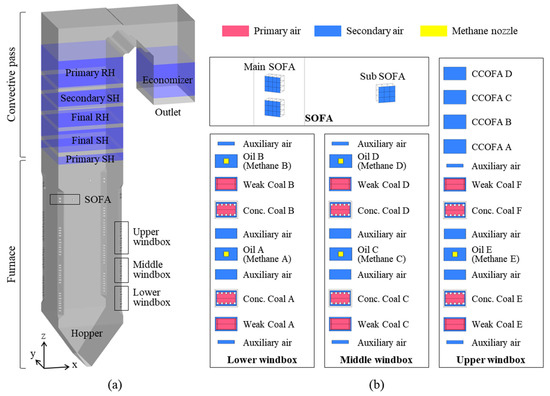
Figure 1.
(a) Boiler geometry and (b) burner arrangement with methane nozzles. Conc.: concentrated; CCOFA: close-coupled overfire air; SOFA: separated overfire air; SH: superheater; RH: reheater.
The furnace contains three windboxes, each of which comprises two levels of coal burners and secondary air (SA) ports. The lower and middle windboxes are identical, whereas the upper windbox has close-coupled overfire air (CCOFA). The uppermost air ports, which use SOFA, reduce NOx emissions through air staging. They contain a level of concentrated and weak coal burners, with the coal feed rate for each burner having a ratio of 7:3. Separated fuel-lean and fuel-rich substreams help reduce NOx formation. However, under methane gas firing conditions, the coal burners only serve as air ports, with methane gas being injected from nozzles installed inside oil burners A-E. The diameter of each nozzle is 6 inches; here, each was assumed to have a rectangular cross-section with the same cross-sectional area, to facilitate meshing.
The tube bundles in the convective pass, superheaters (SHs), reheaters (RHs), and economizer all consist of large numbers of tubes with small diameters. Modeling their actual shape would have significantly increased the computational cost; therefore, tube bundles were expressed as source terms in the governing equations by applying a user-defined function code.
The mesh used here consisted of 7.1 million cells, most of which were used to represent the complex flow and chemical reactions in the burner zone. A mesh test performed in a previous study showed that a grid of 7.1 million cells achieves the optimal computational efficiency [14].
2.2. Calculation Models
2.2.1. General Models
CFD analysis was carried out using ANSYS Fluent 19.2. The pulverized coal combustion process was modelled using the Euler–Lagrangian approach. The continuous gas phase was treated as a continuum by solving the Navier–Stokes equations in the Eulerian frame, whereas the dispersed phase was solved by tracking a large number of particles through the flow field [22]. Dispersed phase particles can exchange momentum, mass, and energy with the gas phase. Here, these particle–particle interactions were neglected, and turbulence was represented by a realizable k–ε model that included an alternative formulation for the turbulent viscosity and a modified transport equation for the dissipation rate. This realizable k–ε model provides improvements over the standard k–ε model, where the flow includes a strong streamline curvature, vortices, and rotation [23]. Here, the particle/gas wall and particle–gas radiative transport were represented by the discrete ordinates model, and the absorption coefficient of the gas phase was calculated using the weighted-sum-of-gray-gases model. The combustion process consisted of inert heating, drying, devolatilization, and char combustion, with each step being performed sequentially for a coal particle. The mass reductions of particles during devolatilization and char combustion were calculated using single kinetic rate and kinetic/diffusion-limited models [24,25], respectively. Homogeneous reactions, including volatile and methane gas oxidation, were calculated using the eddy dissipation concept model [26]; the reactions are shown in Table 1. The oxidation of the pseudo-volatile gas was expressed using a refined Jones-Lindstedt 4-step mechanism [27], similar to that of methane gas. Char oxidation was modeled as a two-step mechanism.

Table 1.
Homogeneous reactions with the kinetic rate.
2.2.2. Convective Heat Transfer for Tube Bundles
Convective heat transfer is the governing heat transfer mechanism in the cross-flow through tube bundles; it was determined as being equivalent to the computation of the Nusselt number, . When calculating the average Nusselt number, the streamed length was used as the characteristic length. The streamed length is the length of the entire path traversed by a particle flowing over the surface presented to it by the body concerned. It is defined as the total surface area, , divided by the maximum perimeter, . For a single tube, the streamed length is defined as follows [29]:
where is the tube outer diameter and is the tube length.
The average Nusselt number of a single tube in a cross-flow can be expressed as a combination of the laminar and turbulent Nusselt numbers, as suggested by Gnielinski [30]:
where is the Reynolds number, and is the Prandtl number.
The average Nusselt number of a tube bundle can be calculated from the aforementioned equation of a single tube, if the characteristic velocity in the Reynolds number is defined as the average velocity in the void between the tubes in the row, (see Figure 2):
and
where is the fluid velocity in the cross section of the empty channel, is the void fraction, is the dynamic viscosity, and is the thermal diffusivity.
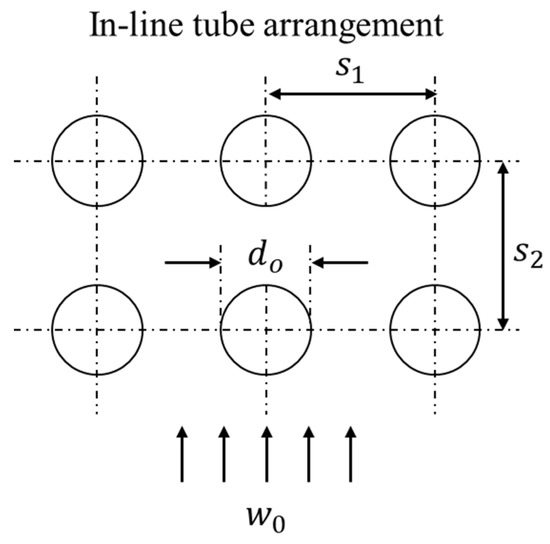
Figure 2.
Lateral and longitudinal spacing in in-line tube bundle.
In addition, the Nusselt number of the tube bundle must consider the influence of the tube arrangement; here, this was applied as follows:
For the in-line tube arrangement, factor can be calculated as follows [31]:
where the transverse pitch ratio, ; the longitudinal pitch ratio, ; and the void fraction, .
If the number of rows, , is fewer than 10, the Nusselt number can be approximately determined as follows [31]:
The convective heat transfer coefficient on the tube bundle can be calculated as follows:
2.2.3. Radiative Heat Transfer on Tube Bundles
The radiative heat calculation was only applied to the primary SH, final SH, and final RH because radiation is not the dominant heat transfer mechanism for the other convection heat exchangers [32]. The emissivity and absorptance of each phase need to be determined to model the radiation between the gas-dispersed-particle mixture and the tube surface. The equations for the gas phase are as follows [33]:
where
The emissivity constants of the pure gas phase, , , and , are represented in Table 2. These values are valid at a total pressure of bar for , a temperature between 1100 K < < 1800 K, and a mean beam length between 0.2 m < < 6 m.
Table 2.
Emissivity constants of the pure gas phase.
The absorptance was approximated in a similar way, using a sum of exponential functions:
To further simplify the calculations, the absorptance of the gas layer was considered to be equal to the emission of the layer at the temperature of the radiation source, :
For example, if particles, which in coal burners typically comprise fly ash and some unburned char, were to be entrained in the flue gas stream through the tube bundles, this could increase the radiant energy emitted from hot gases.
Regarding the emissivity of dispersed particles, their concentration in the gas (i.e., the load) is the most important parameter. In the case of a pulverized combustion chamber, the load is low. Therefore, a good level of accuracy could be obtained using a simple model [34]:
where is the mean relative absorption efficiency of a particle, is the specific projection area of the dispersed particles, and is the particle load under the operating conditions. This model only considers the absorption and emission of the particles; it neglects any type of radiation scattering by those solids.
The total emissivity and absorptance of the gas-particle mixture can be described by the following equations [35]:
The radiative heat transfer coefficient between the gas and particle mixture and wall can be described as follows:
The total heat transfer coefficient for the tube bundles is calculated as follows:
2.2.4. NOx Formation and Reduction
NOx formation and reduction reactions were calculated after determining the flow, temperature, and species concentration fields. Thermal NOx was predicted using the extended Zeldovich mechanism [36]. Thermal NOx is relatively unimportant in a coal-fired boiler but is dominant in a gas-fired boiler due to the high flame temperature of methane. Methane is a nitrogen-free fuel. When burning fuel, NOx is generated by nitrogen contained in the coal. N in char is converted directly to NO, whereas N present in volatiles is oxidized to NO or reduced to N2 via HCN or NH3 [37]. As most of the N is converted to HCN in high-rank fuels such as bituminous coal, the split ratio between HCN and NH3 was set here to be 9:1.
NO can be reduced by adsorption reactions with char particles [38]; this process is proportional to the specific surface area of the pores present on the particle surface. In addition, NO is destroyed by hydrocarbon radicals. Here, the reduction rate was predicted using a partial equilibrium model [39]. The NOx-relevant reactions are shown in Table 3.
Table 3.
NOx reactions with the kinetic rate.
2.3. Operating Conditions during Simulation
A coal-fired boiler simulation was first performed based on the actual operating conditions of Boryeong Unit 3. The validity of the model was verified by comparing the simulation results with the actual boiler data. We then performed simulations in which coal was replaced with methane gas. One consideration when setting the operating conditions of the gas-fired boiler was the change in boiler performance. In this study, the FEGT and heat transfer characteristics of waterwall and tube bundles were analyzed; these factors are important as they affect many aspects of boiler performance. Conversion from coal to methane gas usually results in an increase in FEGT as the flame emissivity from methane gas combustion is lower than that of coal [20,21]. Thus, when conducting gas firing in a coal boiler, the heat absorption of the furnace waterwall decreases, whereas the FEGT and heat absorption of the tube bundles in the convective pass increase. Thus, the effect of the burner zone stoichiometric ratio (BZSR) on heat transfer was investigated. Under a constant overall SR, increasing the air flow rate in the burner zone can enhance methane combustion. Therefore, it was necessary to investigate whether a high BZSR increased the heat absorption of the furnace waterwall. However, this could lead to the BZSR approaching unity, while also increasing NOx emissions. Thus, the NOx emissions and heat transfer characteristics were evaluated under different BZSRs (0.76 to 0.91).
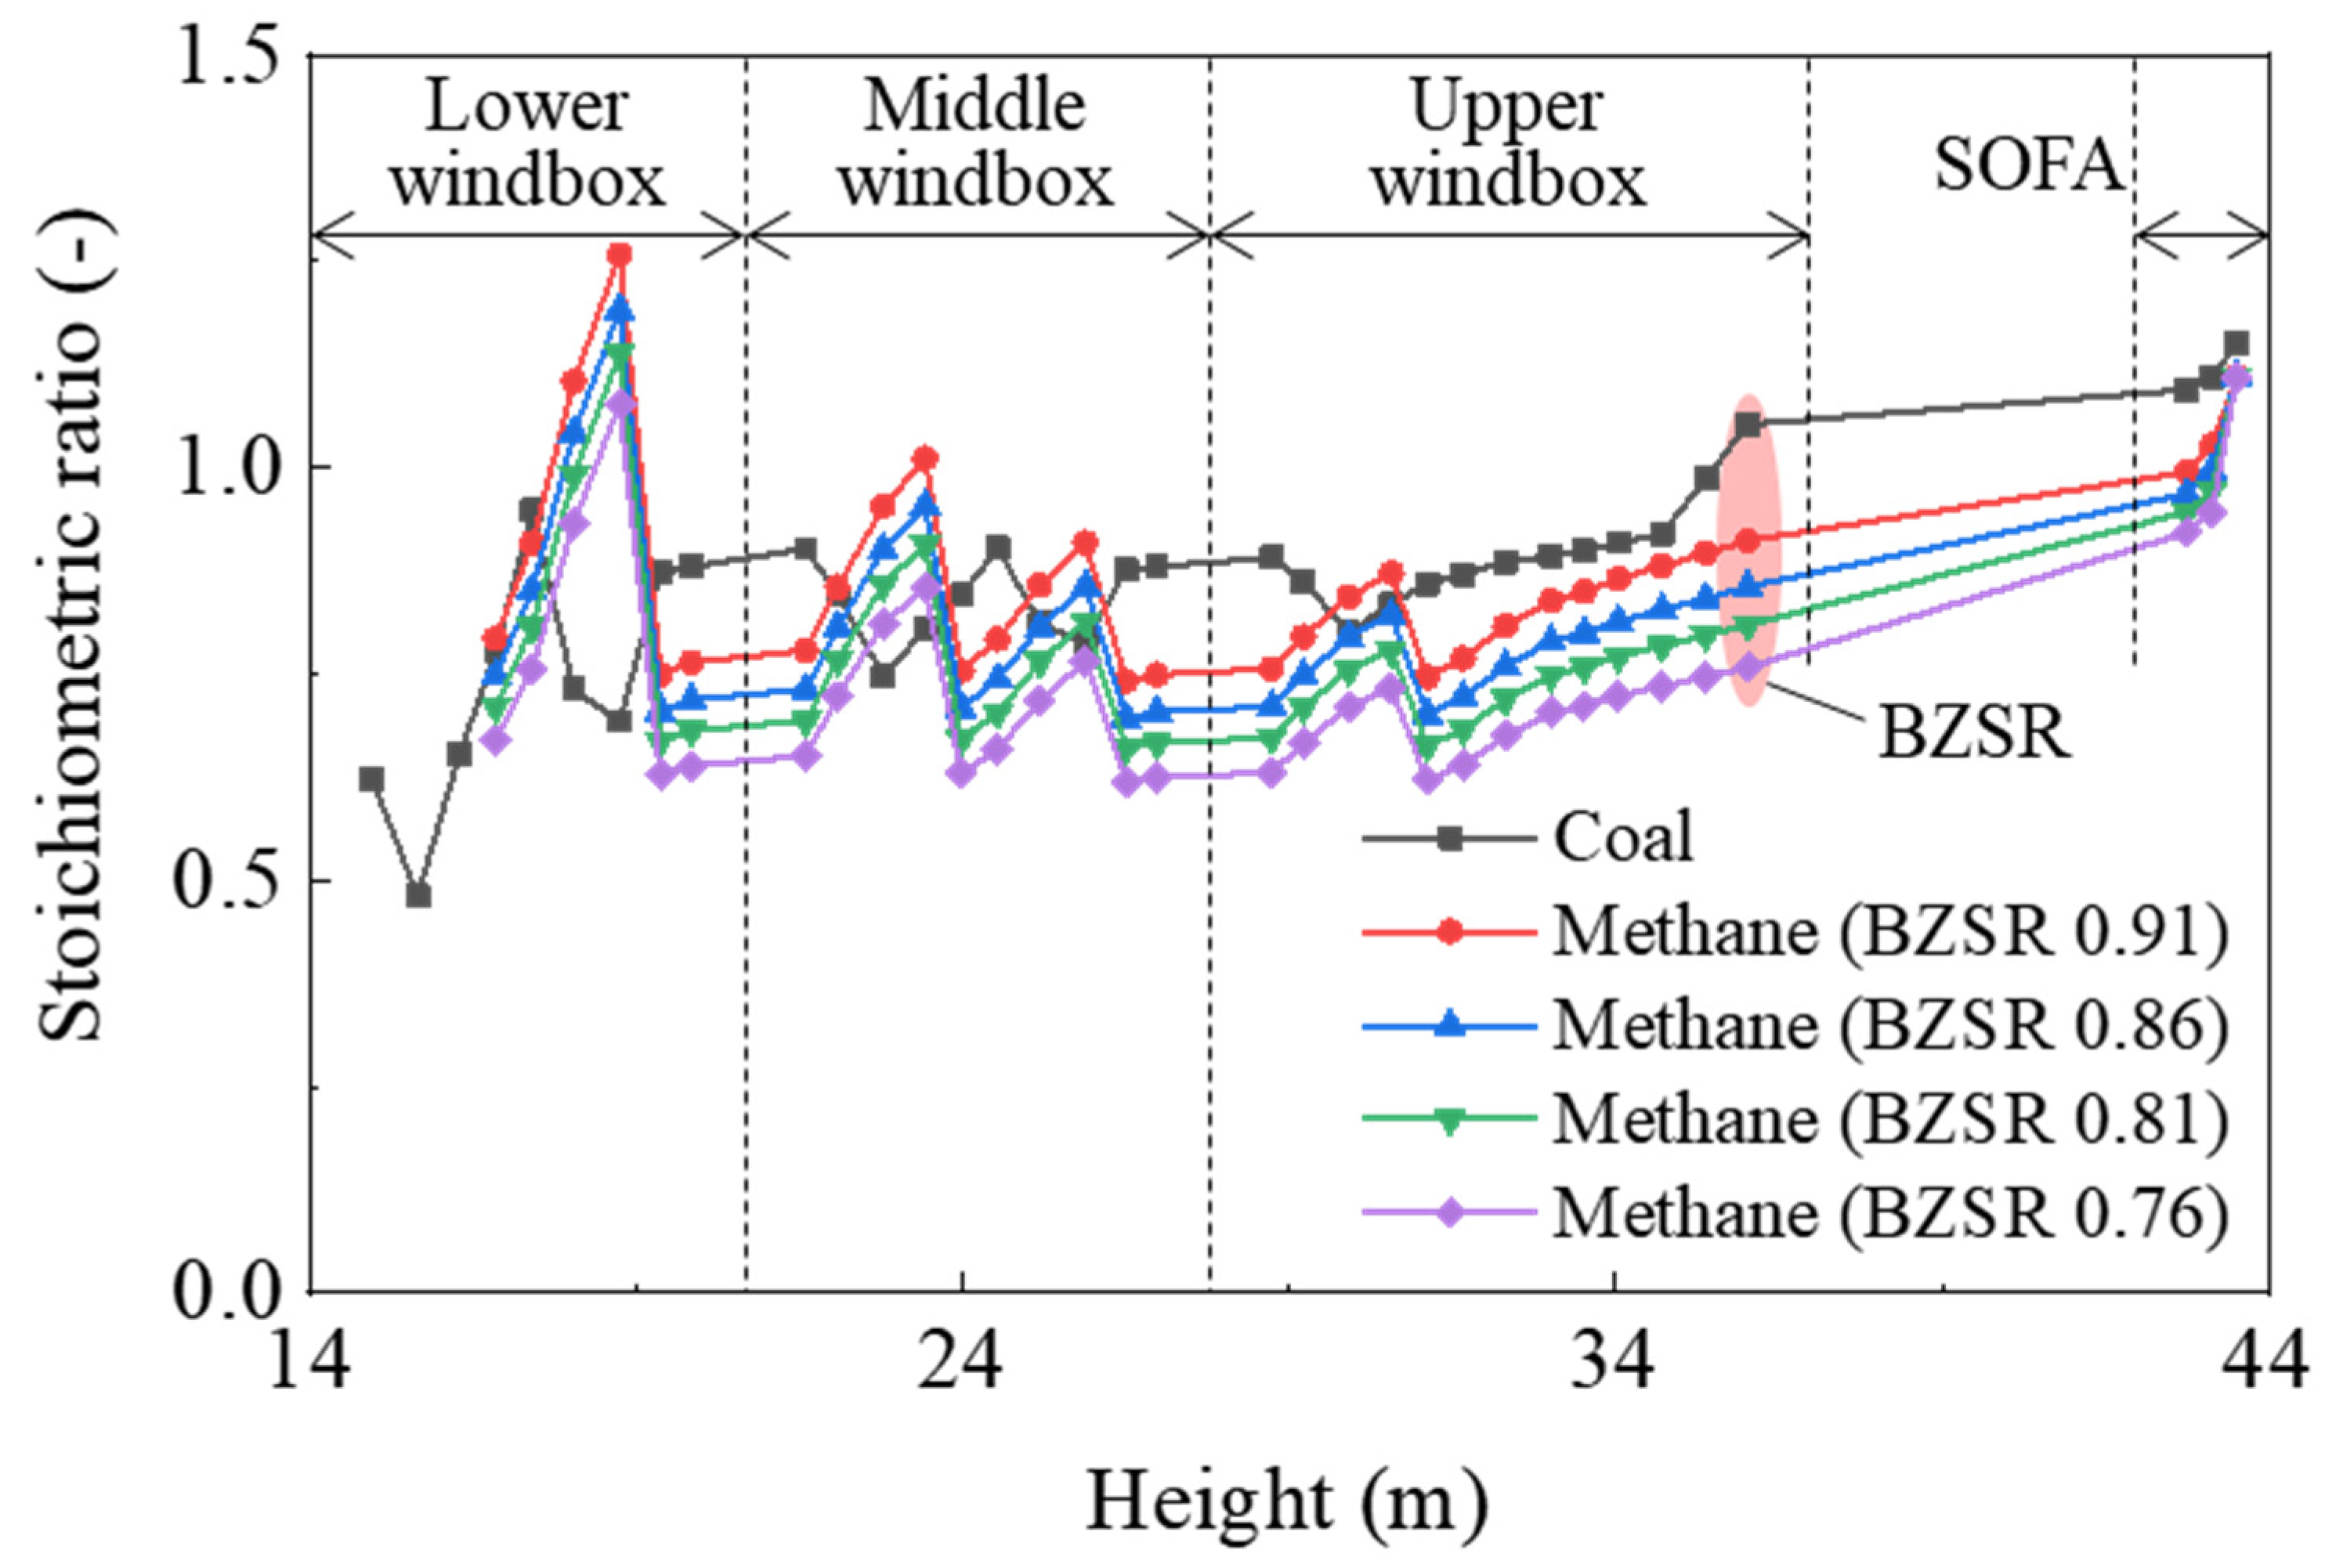
In the gas-firing cases, the total flow rate of methane was determined from the boiler heat input under 100% normal rating conditions; the methane nozzles of each of the five levels were set to have the same flow rate. The overall SR for coal-firing was 1.15, whereas for gas combustion, it was fixed at 1.11. The boiler was operated at an overall SR of 1.11, which was slightly lower than that of a coal boiler (1.15). As all SA dampers were set identically, the air flow rate depended on their cross-sectional area. The BZSR was controlled by adjusting the damper of the SOFA. Thus, the air distribution remained constant, with only the total amount of supplied air in the burner zone being varied. For each case, the relationship between the SR and the furnace height is shown in Figure 3.
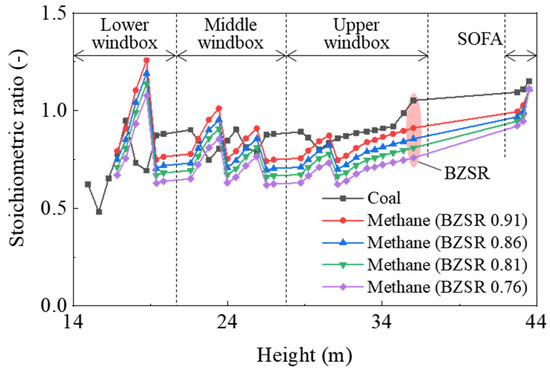
Figure 3.
Stoichiometric ratio as a function of furnace height in each case investigated. BZSR: burner zone stoichiometric ratio.
3. Results and Discussion
3.1. Simulation and Validation of the Coal-Fired Boiler
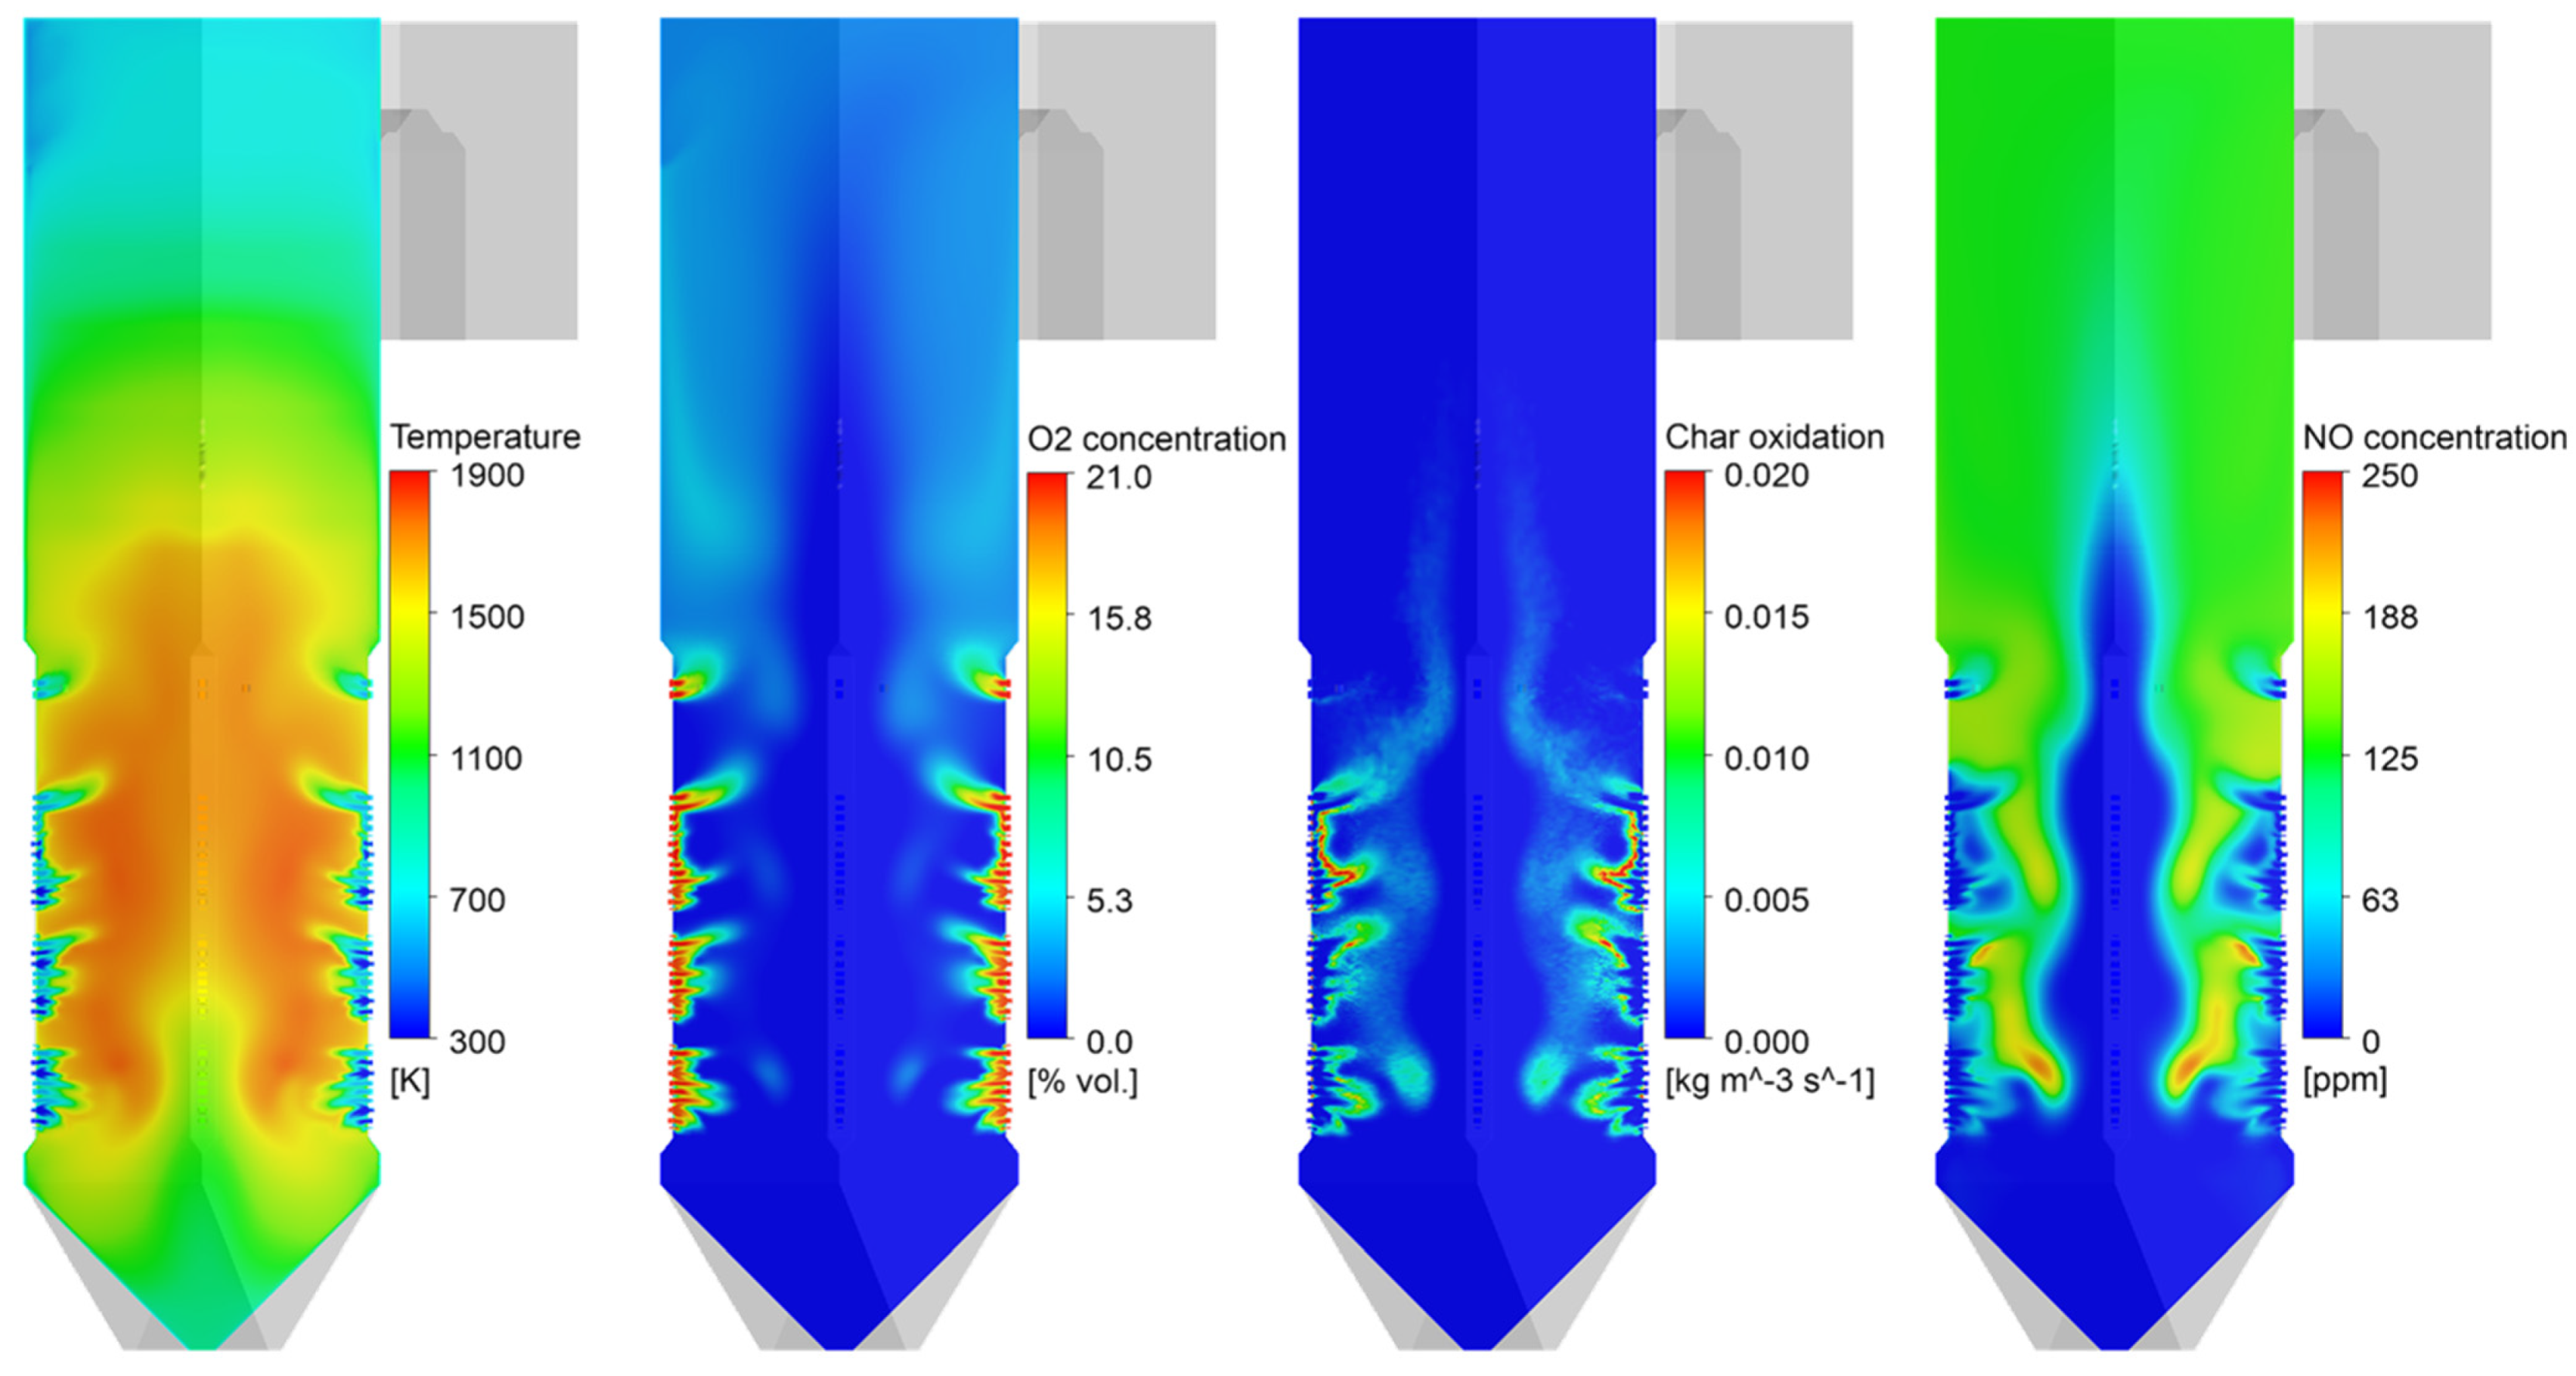
Figure 4 shows the gas temperature, oxygen, char oxidation, and NO distributions inside the coal-fired boiler. The coal particles transported into the furnace were heated at a high heating rate. After releasing the volatile gas near the burner, the particles immediately entered the char burnout stage. The sub-stoichiometric conditions cause oxygen deficiency from the outer surface to the center of the fireball. They also cause a portion of the char to rise upward without being completely burned out. The NO formation rate was observed to be high near the burners, where coal was actively combusted. A region of high NO mole fraction coincided with the high-temperature region in the fireball. This NO could be reduced to N2 in oxygen-lean regions, such as the inside of the fireball. The char combustion was completed by overfire air (OFA). The high velocity of the OFA promoted the mixing of particles and air to complete combustion. In this region, fuel NO formed, and this was not outstripped by the volume that was reduced in the burner zone. Therefore, air staging reduced the final NOx emissions.
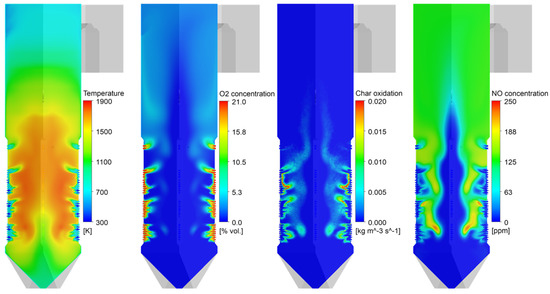
Figure 4.
Contours of gas temperature, O2 mole fraction, char burnout, and NO mole fraction in the boiler.
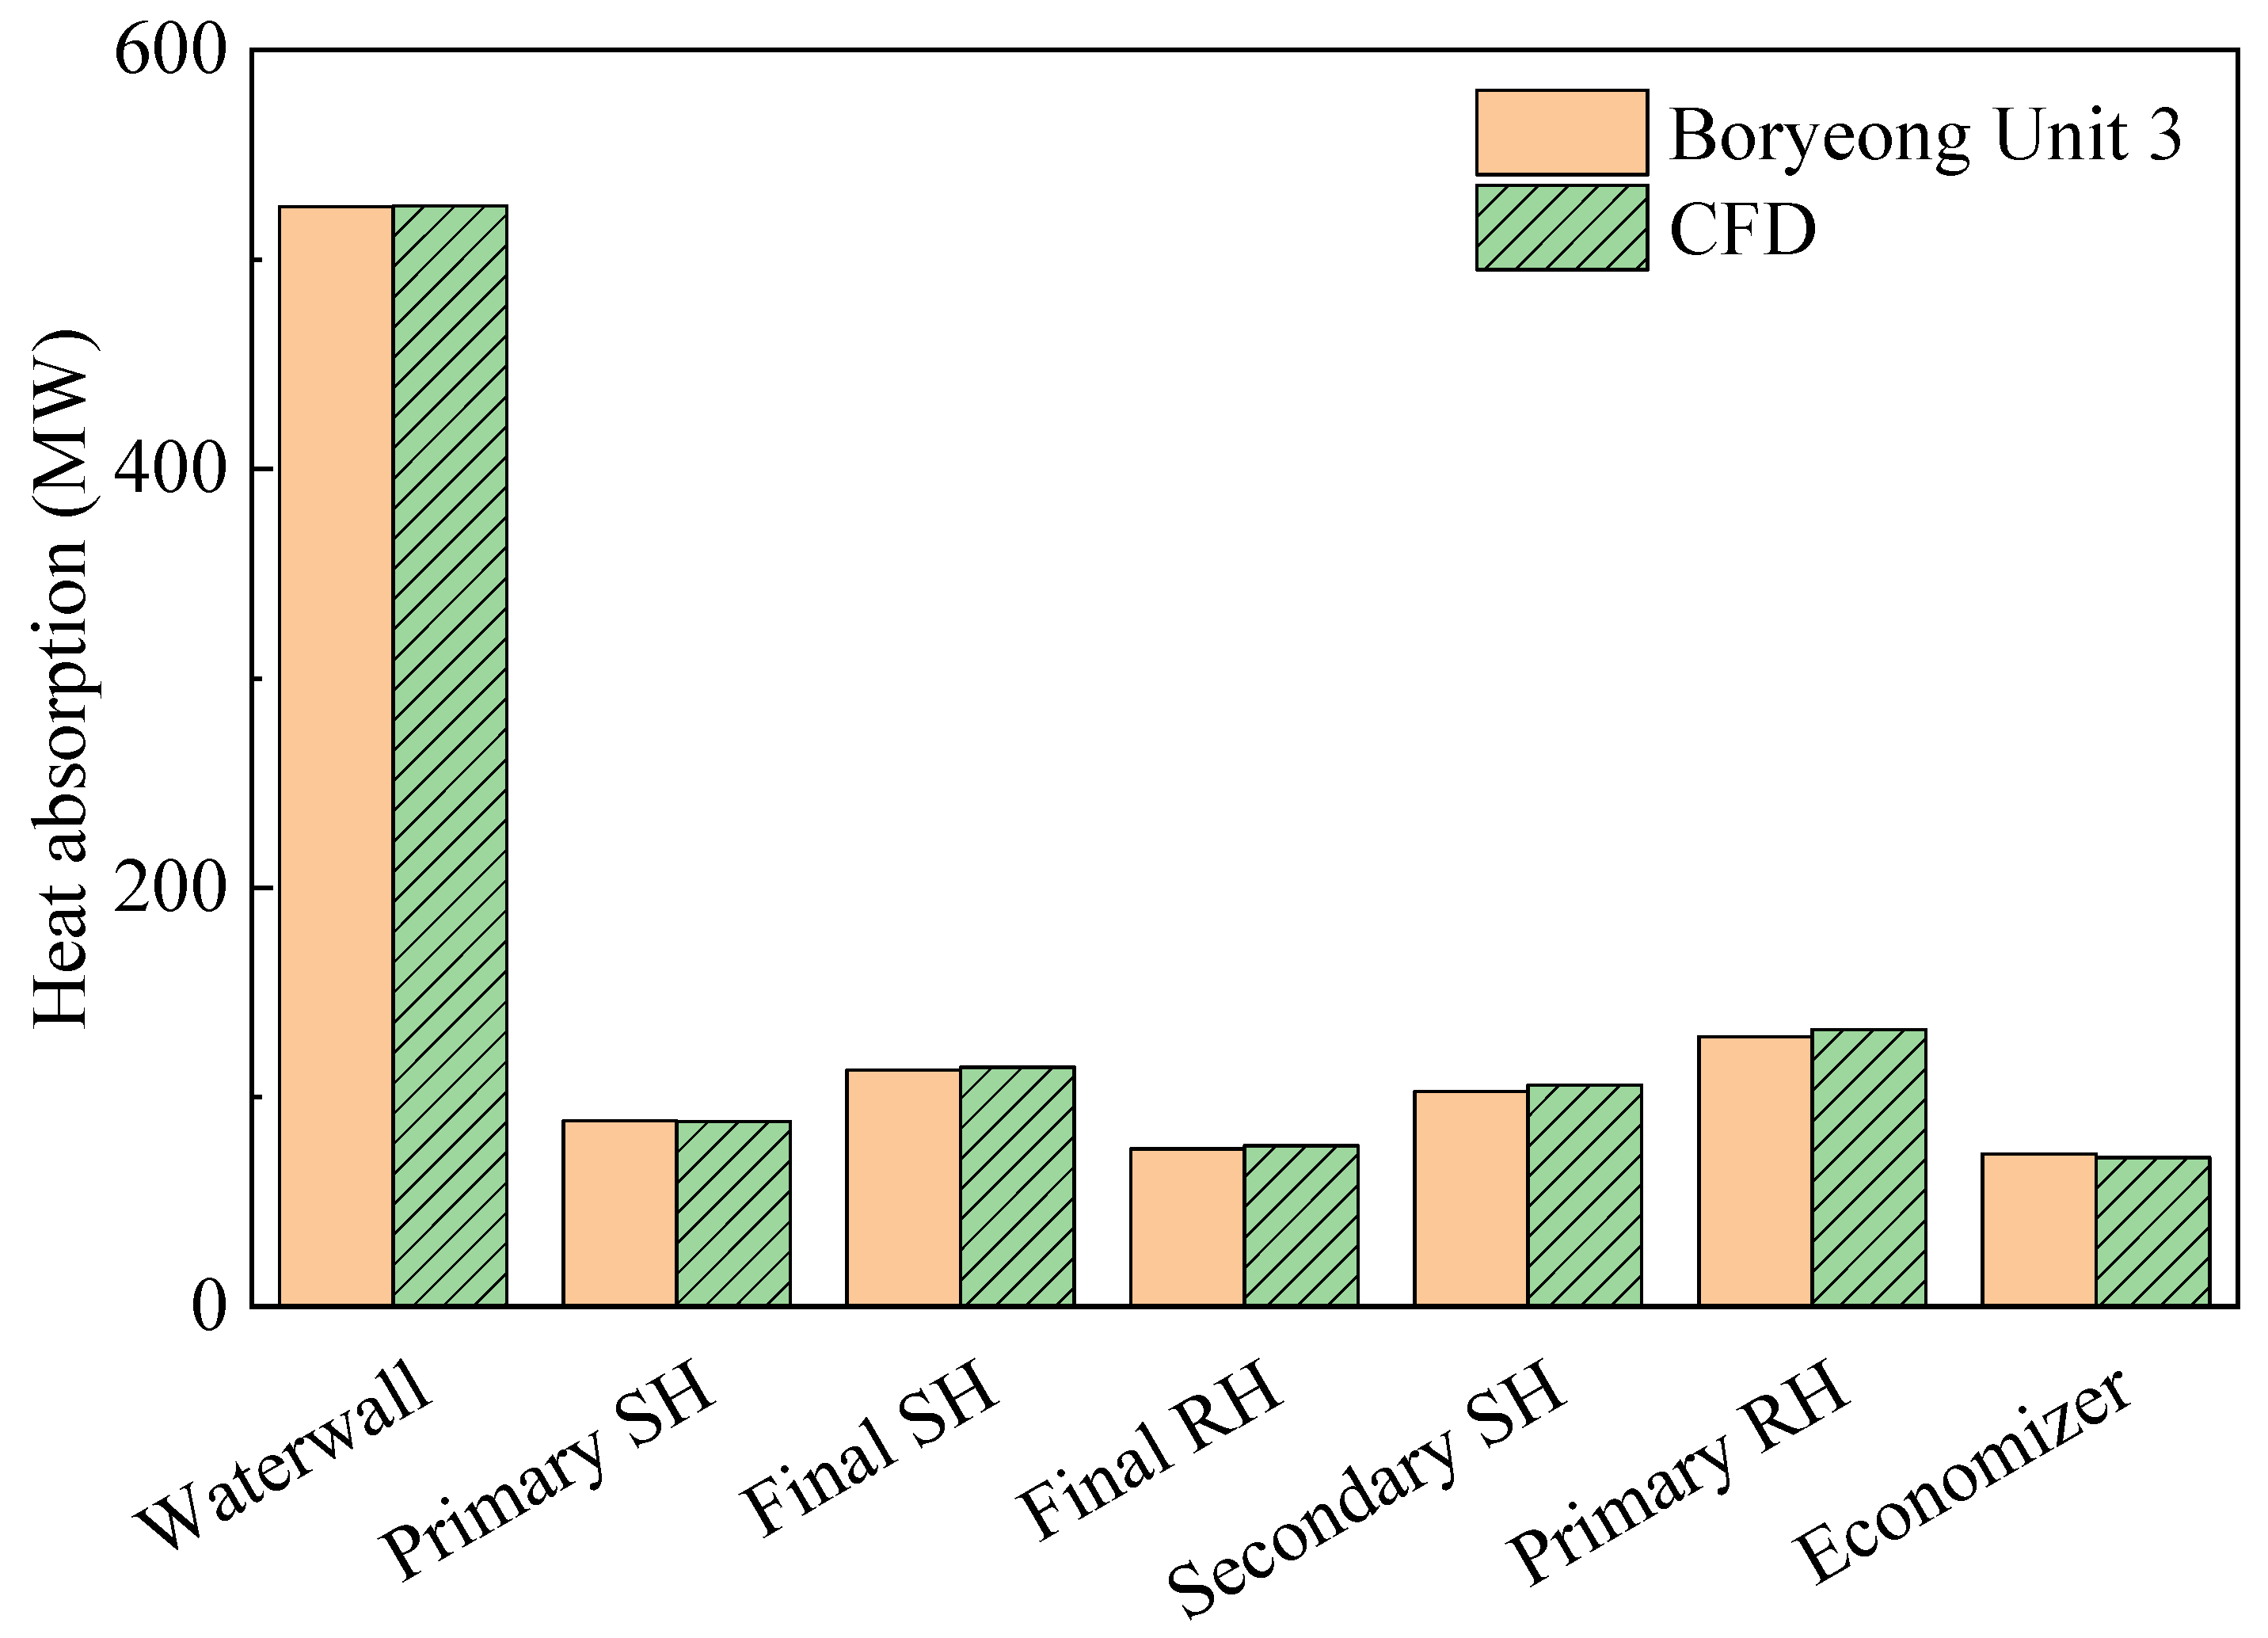
Table 4 compares the actual and predicted values at the boiler outlet, which validate the coal-fired boiler simulation. There was a difference of 1.45% in unburnt fuel, corresponding to a 0.2% difference in heat input. Thus, the amount of combustion heat in the furnace was almost the same as the experimental data. In addition, the errors of the gas temperature and NOx emissions were both <3%. Figure 5 shows a comparison of the heat absorption in each part of the boiler. Again, the trends of the actual data and CFD simulations were very similar, with a maximum error of <3%. Therefore, it was determined that gas burning could be simulated using this model. It was not possible to compare simulated gas burning in the furnace with actual data owing to the absence of on-site measurements. However, comparisons were made with respect to the NOx emissions and heat transfer, both of which were of interest in this study. Therefore, simulations for the conversion to methane gas were performed based on the coal-fired boiler model.
Table 4.
Comparison of actual and predicted values at the boiler outlet.

Figure 5.
Validation for heat absorption of each heat exchanger component. CFD: computational fluid dynamics; SH: superheater; RH: reheater.
3.2. Comparison of Coal and Gas Firing in the Boiler
A simulation was performed for gas firing in the coal boiler, and the results were compared with those of conventional coal firing. Figure 6 shows the gas temperature and NO mole fraction for gas firing, with a BZSR of 0.86. The coal flame (Figure 4) had a relatively even temperature distribution, whereas methane showed a distinct flame front near the burner and furnace center. The average gas temperature in and around the hopper (<15 m) was lower than that of the coal boiler. This can be explained by the coal particle trajectory. Some coal particles from burners A and B may have first descended toward the hopper, before rising again. However, the methane stream was always directed upwards in the furnace; thus, it was not combusted in the hopper. Above 15 m, the average temperature was higher than that of the coal boiler because of the lower heat absorption of the waterwall. In particular, the maximum gas temperature increased by 200–400 K in the burner zone, which increased the thermal NOx. The methane flame had the potential to significantly increase the generation of thermal NOx owing to its exponential temperature dependence. Although methane itself is nitrogen-free, 77.5 ppm of NOx was simulated to be emitted at the boiler outlet.
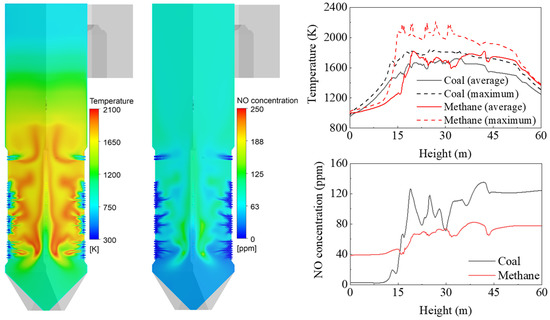
Figure 6.
Contours and profiles of gas temperature and NOx mole fraction during gas firing.
Switching the fuel from coal to methane gas changed the heat transfer characteristics of the furnace waterwall (Figure 7a); the overall and peak heat fluxes both decreased noticeably owing to the lower flame emissivity methane. However, the heat flux above the CCOFA was higher than that in the burner zone; this may have been partially affected by the lower BZSR. However, this significant reduction was caused by the changing flame characteristics. The heat flux also decreased in the hopper because the methane stream did not pass through this area, unlike for coal; this was visible from the gas temperature profile. The combustion heat that was not absorbed in the burner zone or hopper increased the FEGT and the heat flux of the upper waterwall.
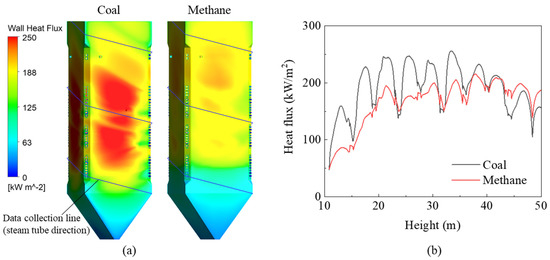
Figure 7.
(a) Heat flux contours and (b) profiles on the data collection line.
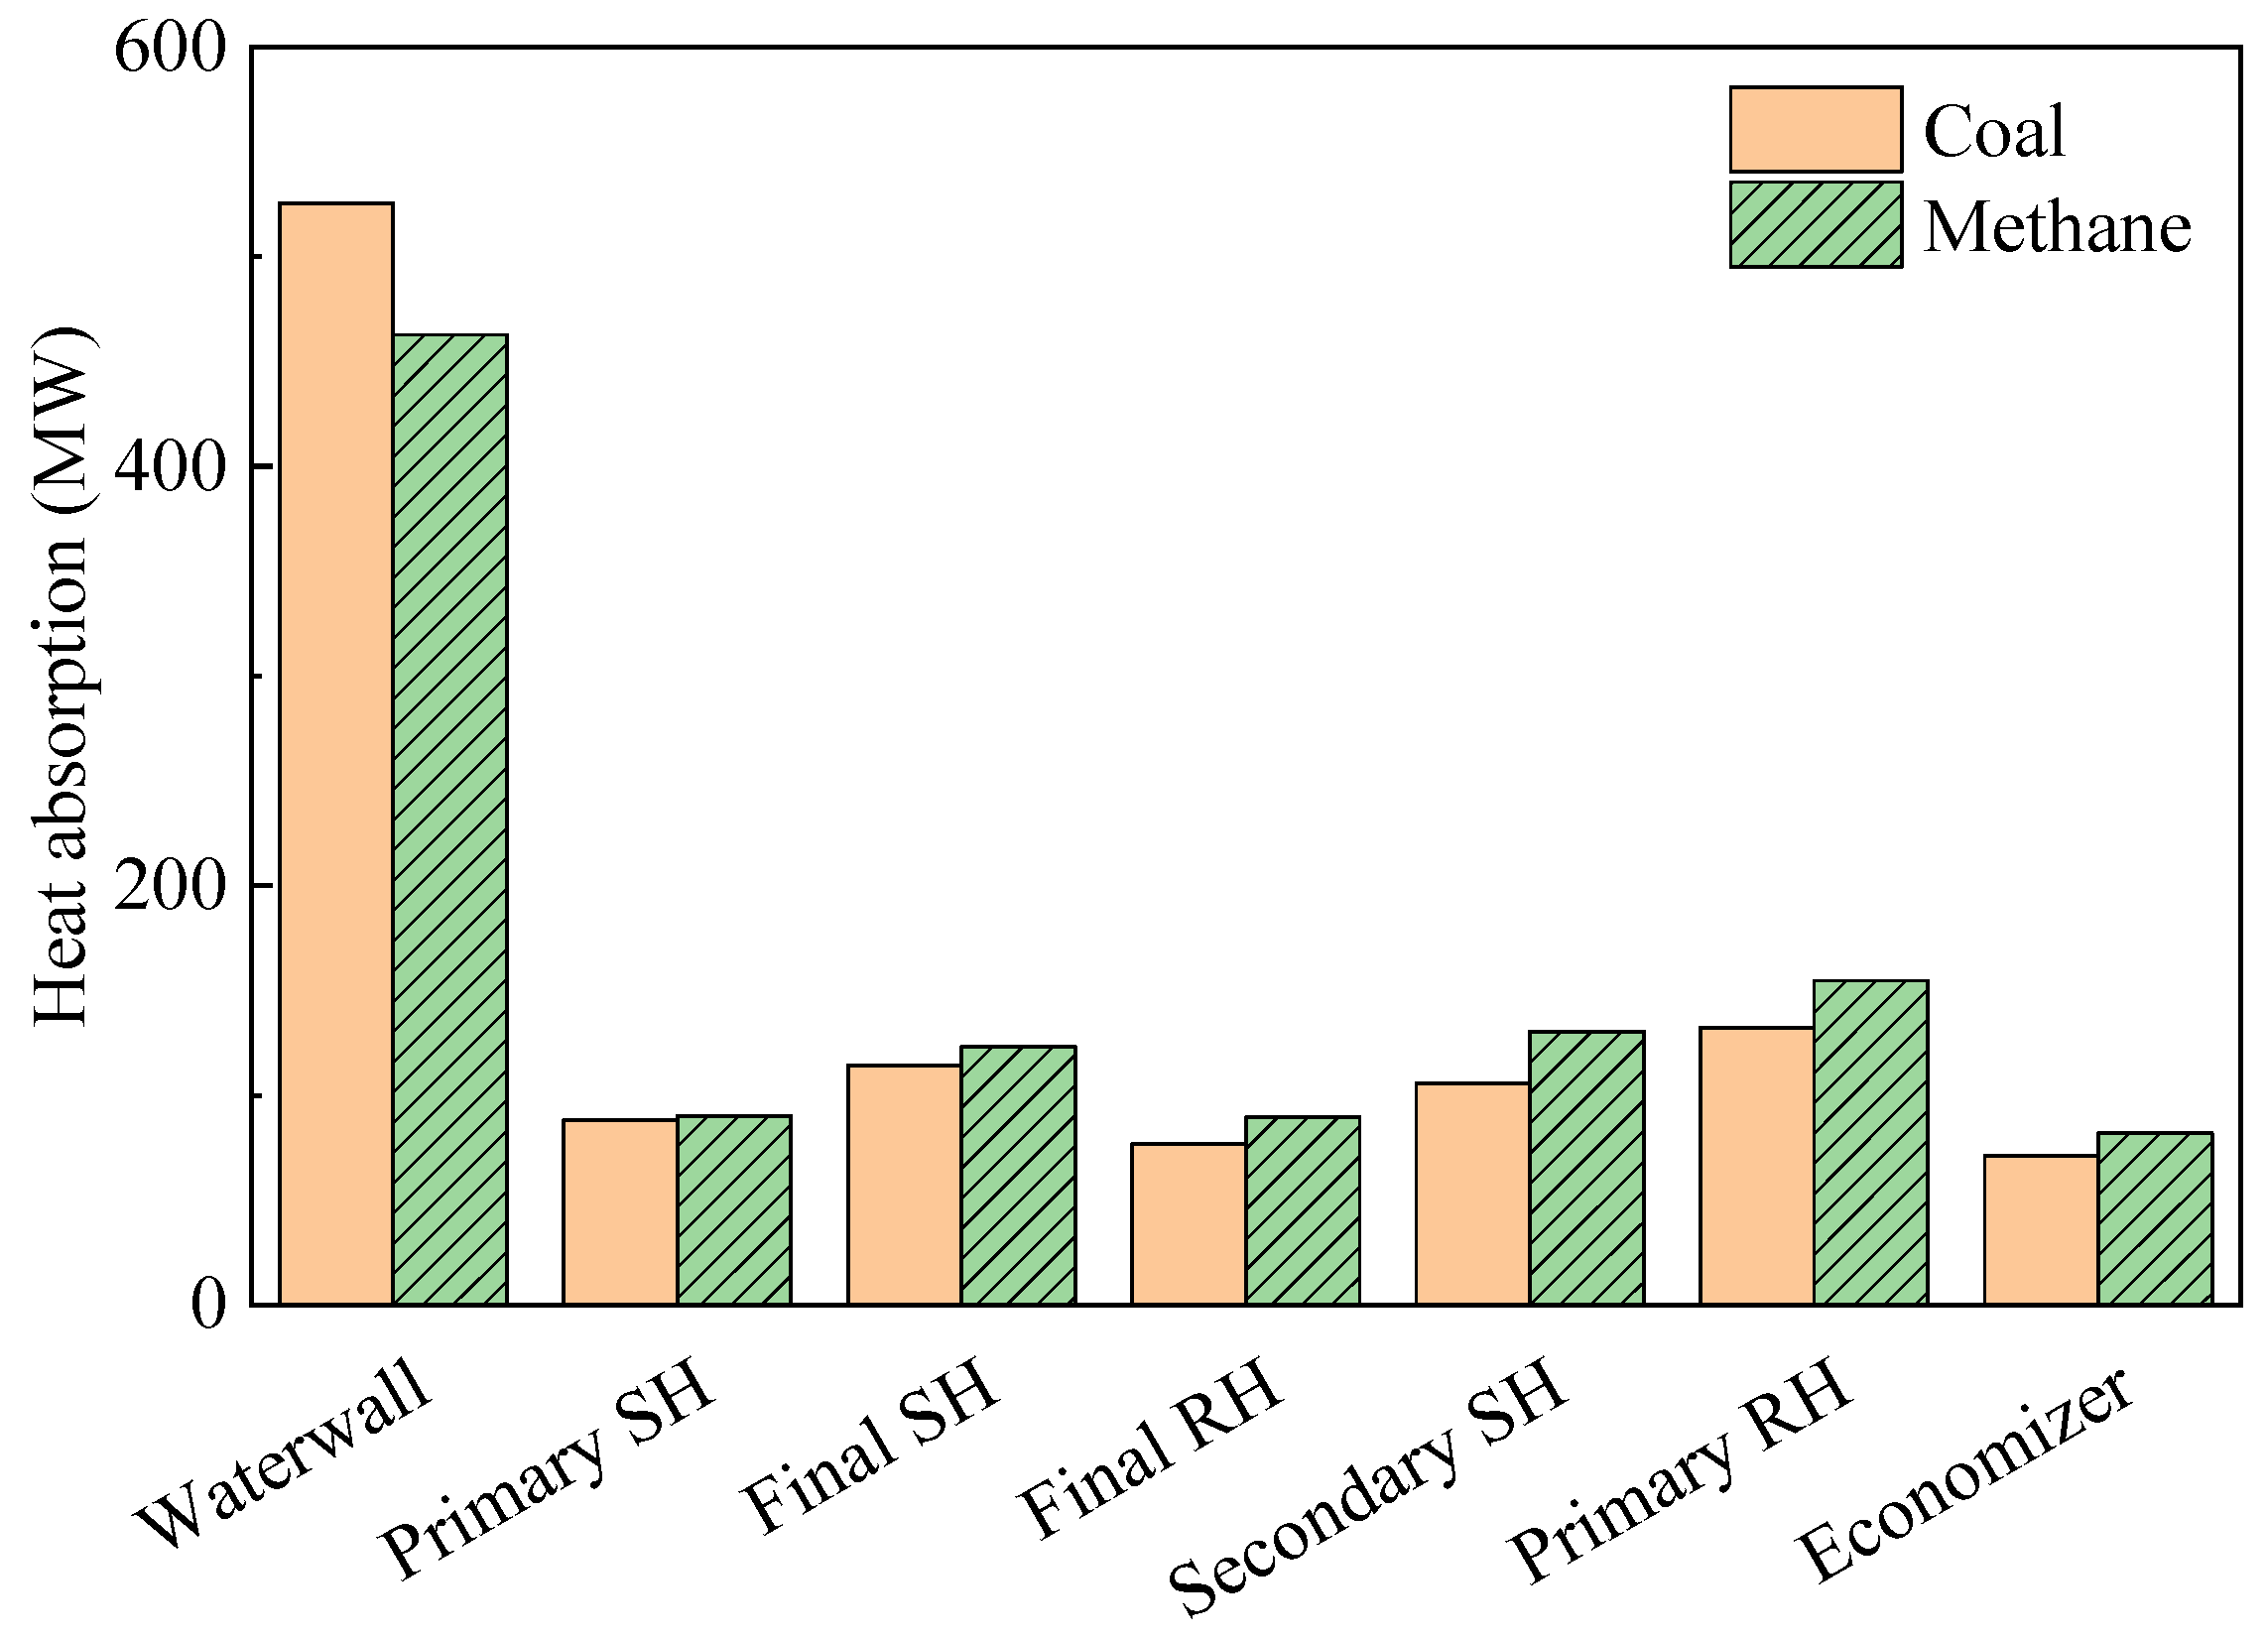
When evaluating the heat flux profile in a furnace, it may be useful to evaluate the heat flux along the tube direction of the spiral waterwall; here, this had a sloped angle of 14.2°. The data collection line and corresponding heat flux profile are shown in Figure 7a and b, respectively. During coal firing, the heat flux profile along this line exhibited several peaks. However, during gas firing, these peaks became less distinct, and the peak heat flux value in the burner zone decreased significantly. As a result, converting the coal boiler to run on methane reduced the heat absorption of the furnace waterwall by 12% (Figure 8). However, heat absorption in the tube bundles in the convective pass increased by 2–23% owing to the 194 K increase in FEGT. The low-hanging tube, which is the primary SH, showed a relatively small increase in heat absorption as radiation played an important role in this component. The conversion to methane also reduced radiative heat transfer in the waterwall. In particular, as the Boryeong Unit 3 has a short distance between the SOFA and primary SH, the primary SH was more affected by flame radiation than other tube bundles. However, in the upper tube bundles, heat transfer was dominated by convection. These bundles have many more columns than the primary SH, and they also exhibit a higher flue gas velocity. Therefore, the increased gas temperature in these bundles immediately led to an increase in heat absorption. High flue gas temperatures in the convective pass could damage the tube material; thus, this component may need to be cooled using an attemperator when burning methane gas.
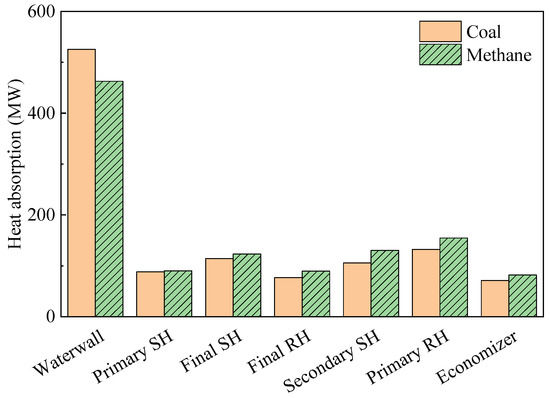
Figure 8.
Changes in heat absorption by conversion to methane.
3.3. Effect of BZSR on NOx Emissions and Heat Transfer
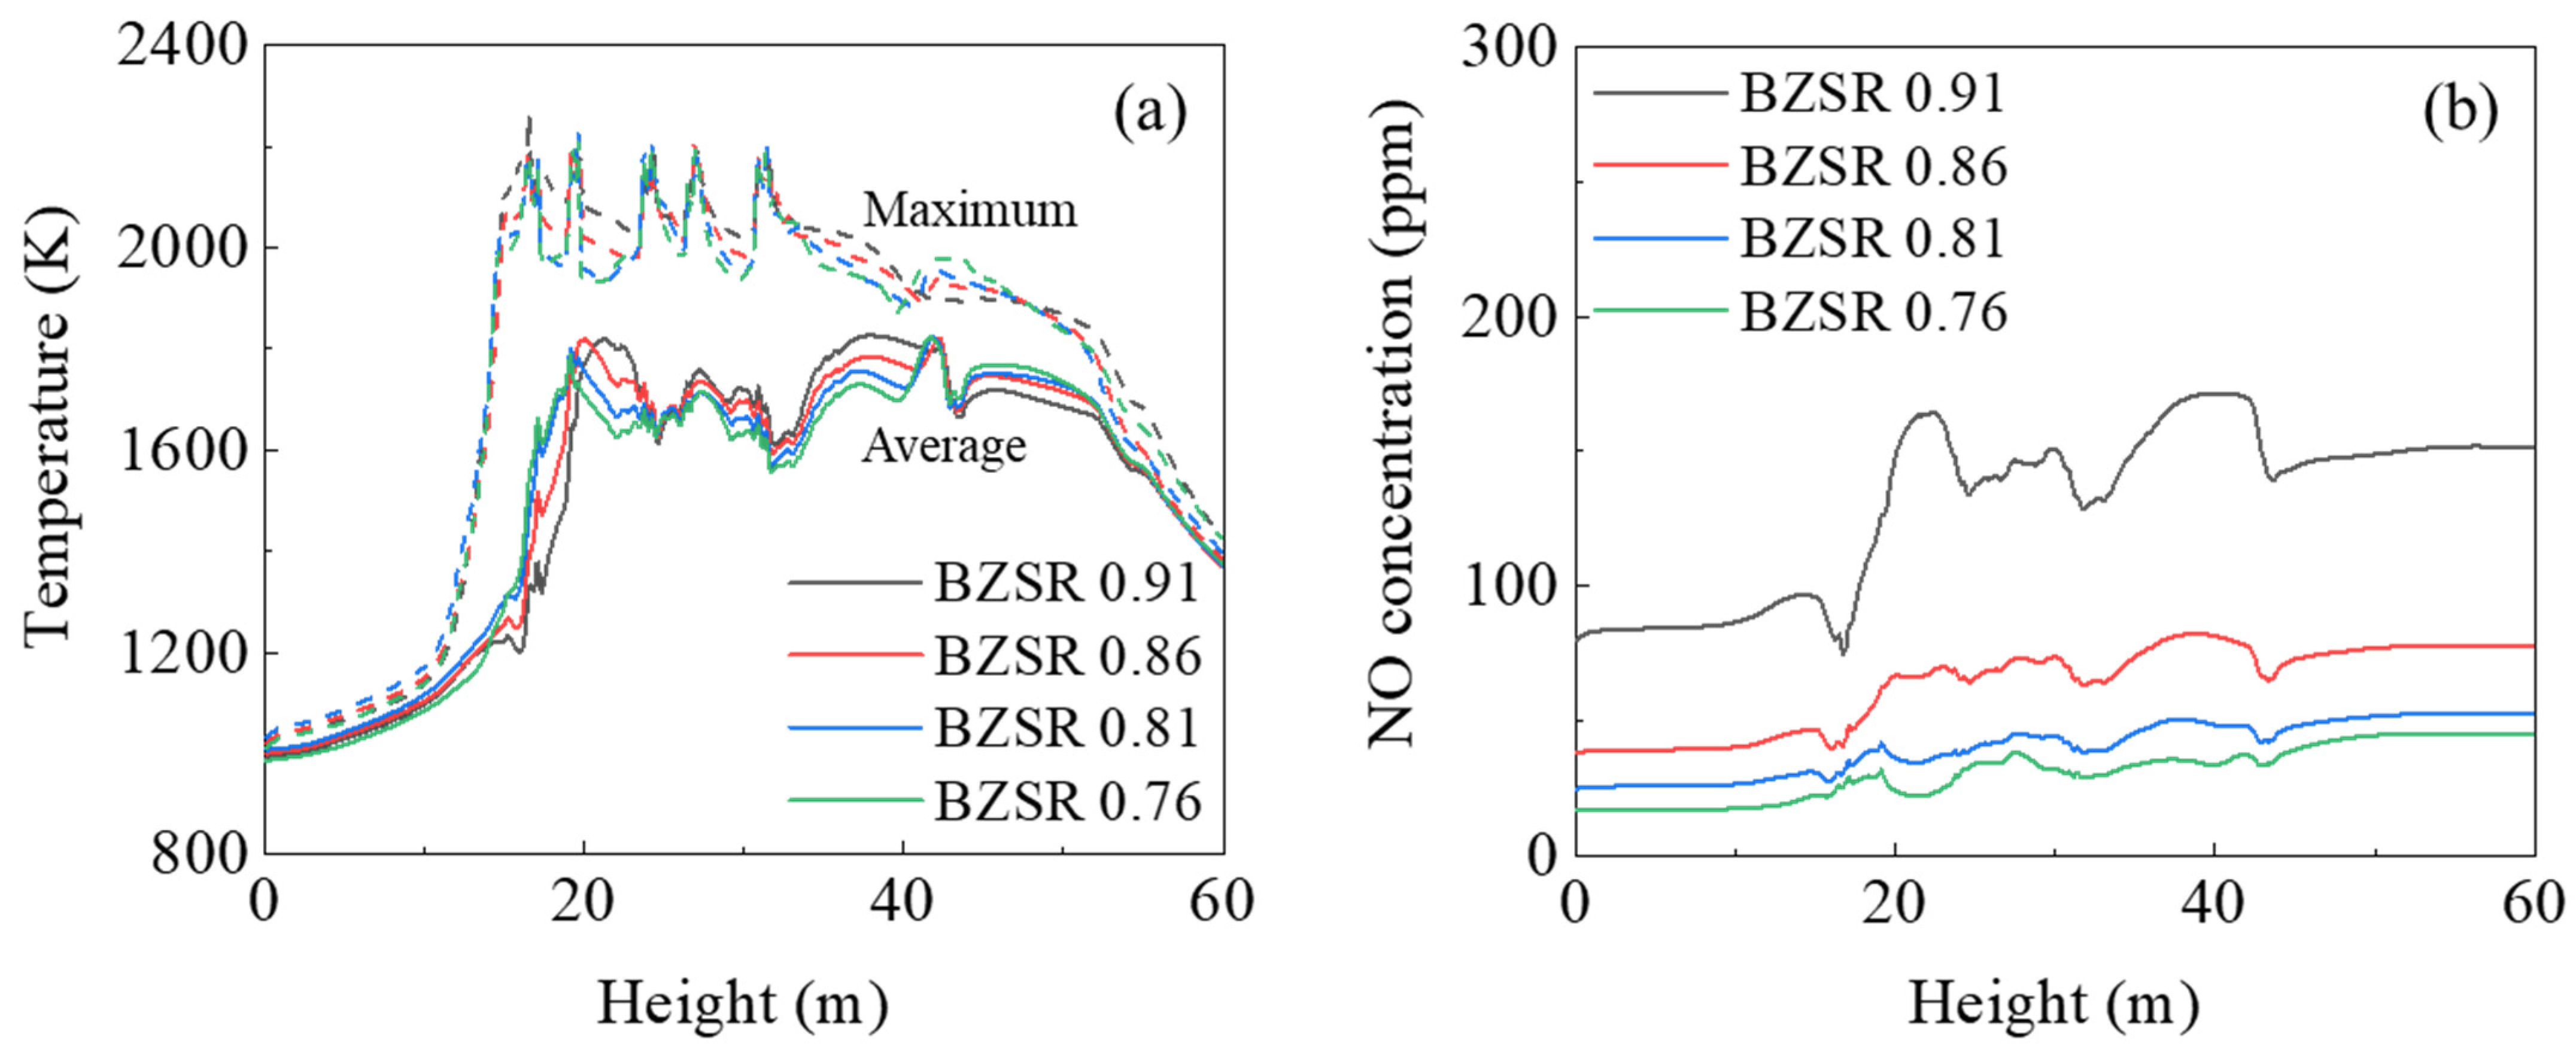
Figure 9 reveals how the gas temperature and NO mole fraction profiles varied under different BZSRs during gas firing. As the BZSR decreased, the average gas temperature decreased at a height of 20–40 m, whereas it increased at heights above 40 m. Thus, reducing the BZSR shifted the thermal load upwards in the furnace, which could reduce the waterwall heat absorption in the burner zone. The changes in maximum gas temperature under different BZSRs followed the average gas temperature. However, the BZSRs of 0.81 and 0.76 showed similar maximum temperature profiles below 40 m. These changes may have affected the NO profile inside the furnace. As the formation rate of thermal NO increases with increasing temperature, local high temperature regions play an important role in the formation of NOx. Therefore, as shown in Figure 9b, the NO level decreased as the BZSR decreased, but changes in NO were small when BZSR dropped from 0.81 to 0.76. Thus, NOx emissions from the boiler would likely not reduce further, even if the BZSR were to be reduced further.
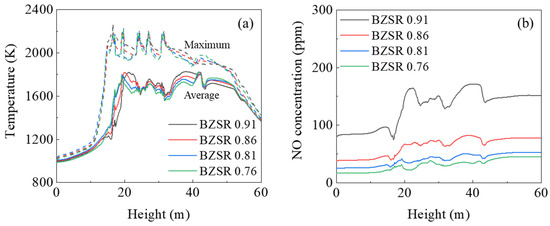
Figure 9.
(a) Gas temperature and (b) NO mole fraction profiles with different burner zone stoichiometric ratios (BZSRs).
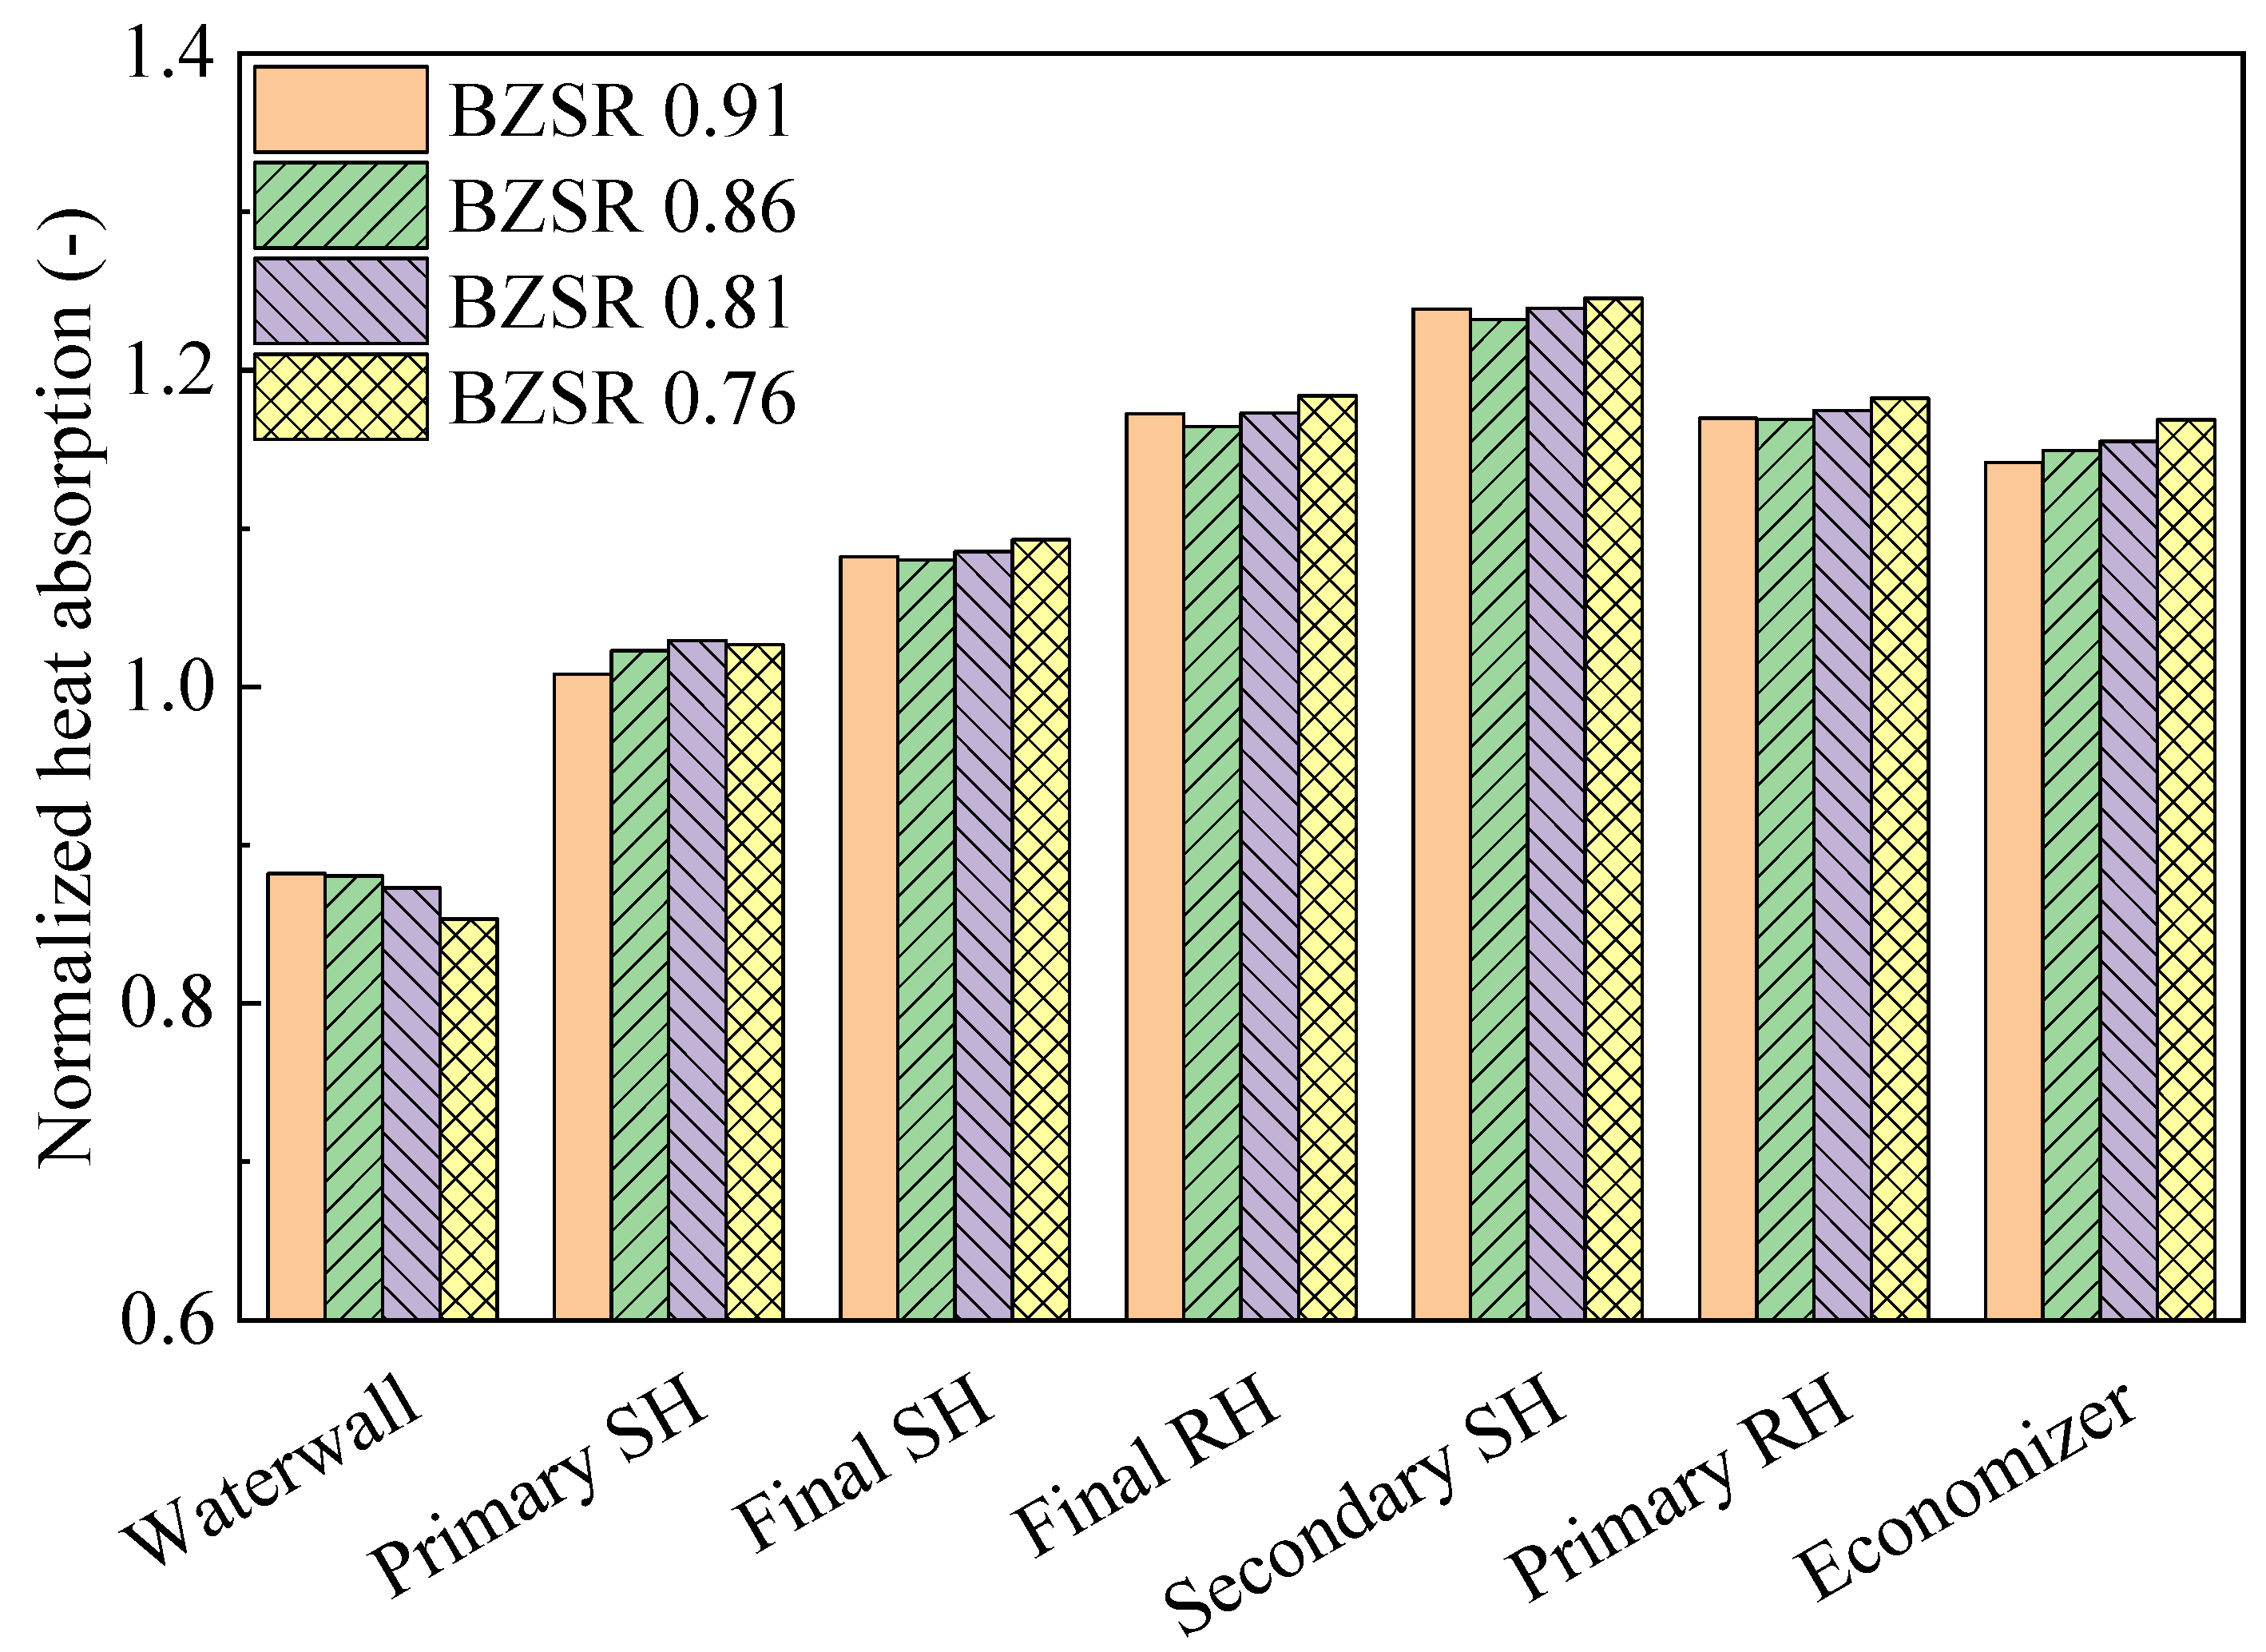
Figure 10 shows the heat absorption characteristics of each component under different BZSRs during gas firing (each heat absorption value was normalized to that of the coal-fired boiler). The waterwall heat absorption decreased exponentially as the BZSR decreased. When the BZSR was reduced from 0.91 to 0.76, the heat absorption decreased from 88% to 85% compared with that in the coal-firing case. In contrast, all other tube bundles were generally negatively correlated with the BZSR. However, when the BZSR decreased from 0.91 to 0.86, the heat absorption values of the final SH, final RH, and secondary RH all decreased. As the BZSR increased from 0.86 to 0.91, the heat absorption of the waterwall increased slightly. However, the decrease in the heat absorption of the primary SH was greater than the increase in the heat absorption of the waterwall owing to the lowest FEGT (1670 K). Thus, at a BZSR of 0.91, the flue gas temperatures near the final SH, final RH, and secondary SH were all higher than that at a BZSR of 0.86. However, these differences in heat absorption were insignificant (<1 MW). Across all gas-firing cases, the differences in heat absorption did not exceed 1.5%. The differences in heat absorption between the coal and gas combustion were approximately 10% in the waterwall and up to 24% in the tube bundles. Thus, a significant change in heat absorption thus occurred when converting from coal to methane gas in the boiler, with the BZSR having a relatively low contribution. Therefore, the optimal BZSR was instead determined here in relation to the NOx emissions. In addition, when switching fuel, it would be difficult to control the heat transfer profile solely by adjusting the air distribution. Thus, alternative approaches, such as using an attemperator, changing the heat absorption surfaces, and decreasing the operation load, may be required.

Figure 10.
Normalized heat absorption with different burner zone stoichiometric ratios (BZSRs).
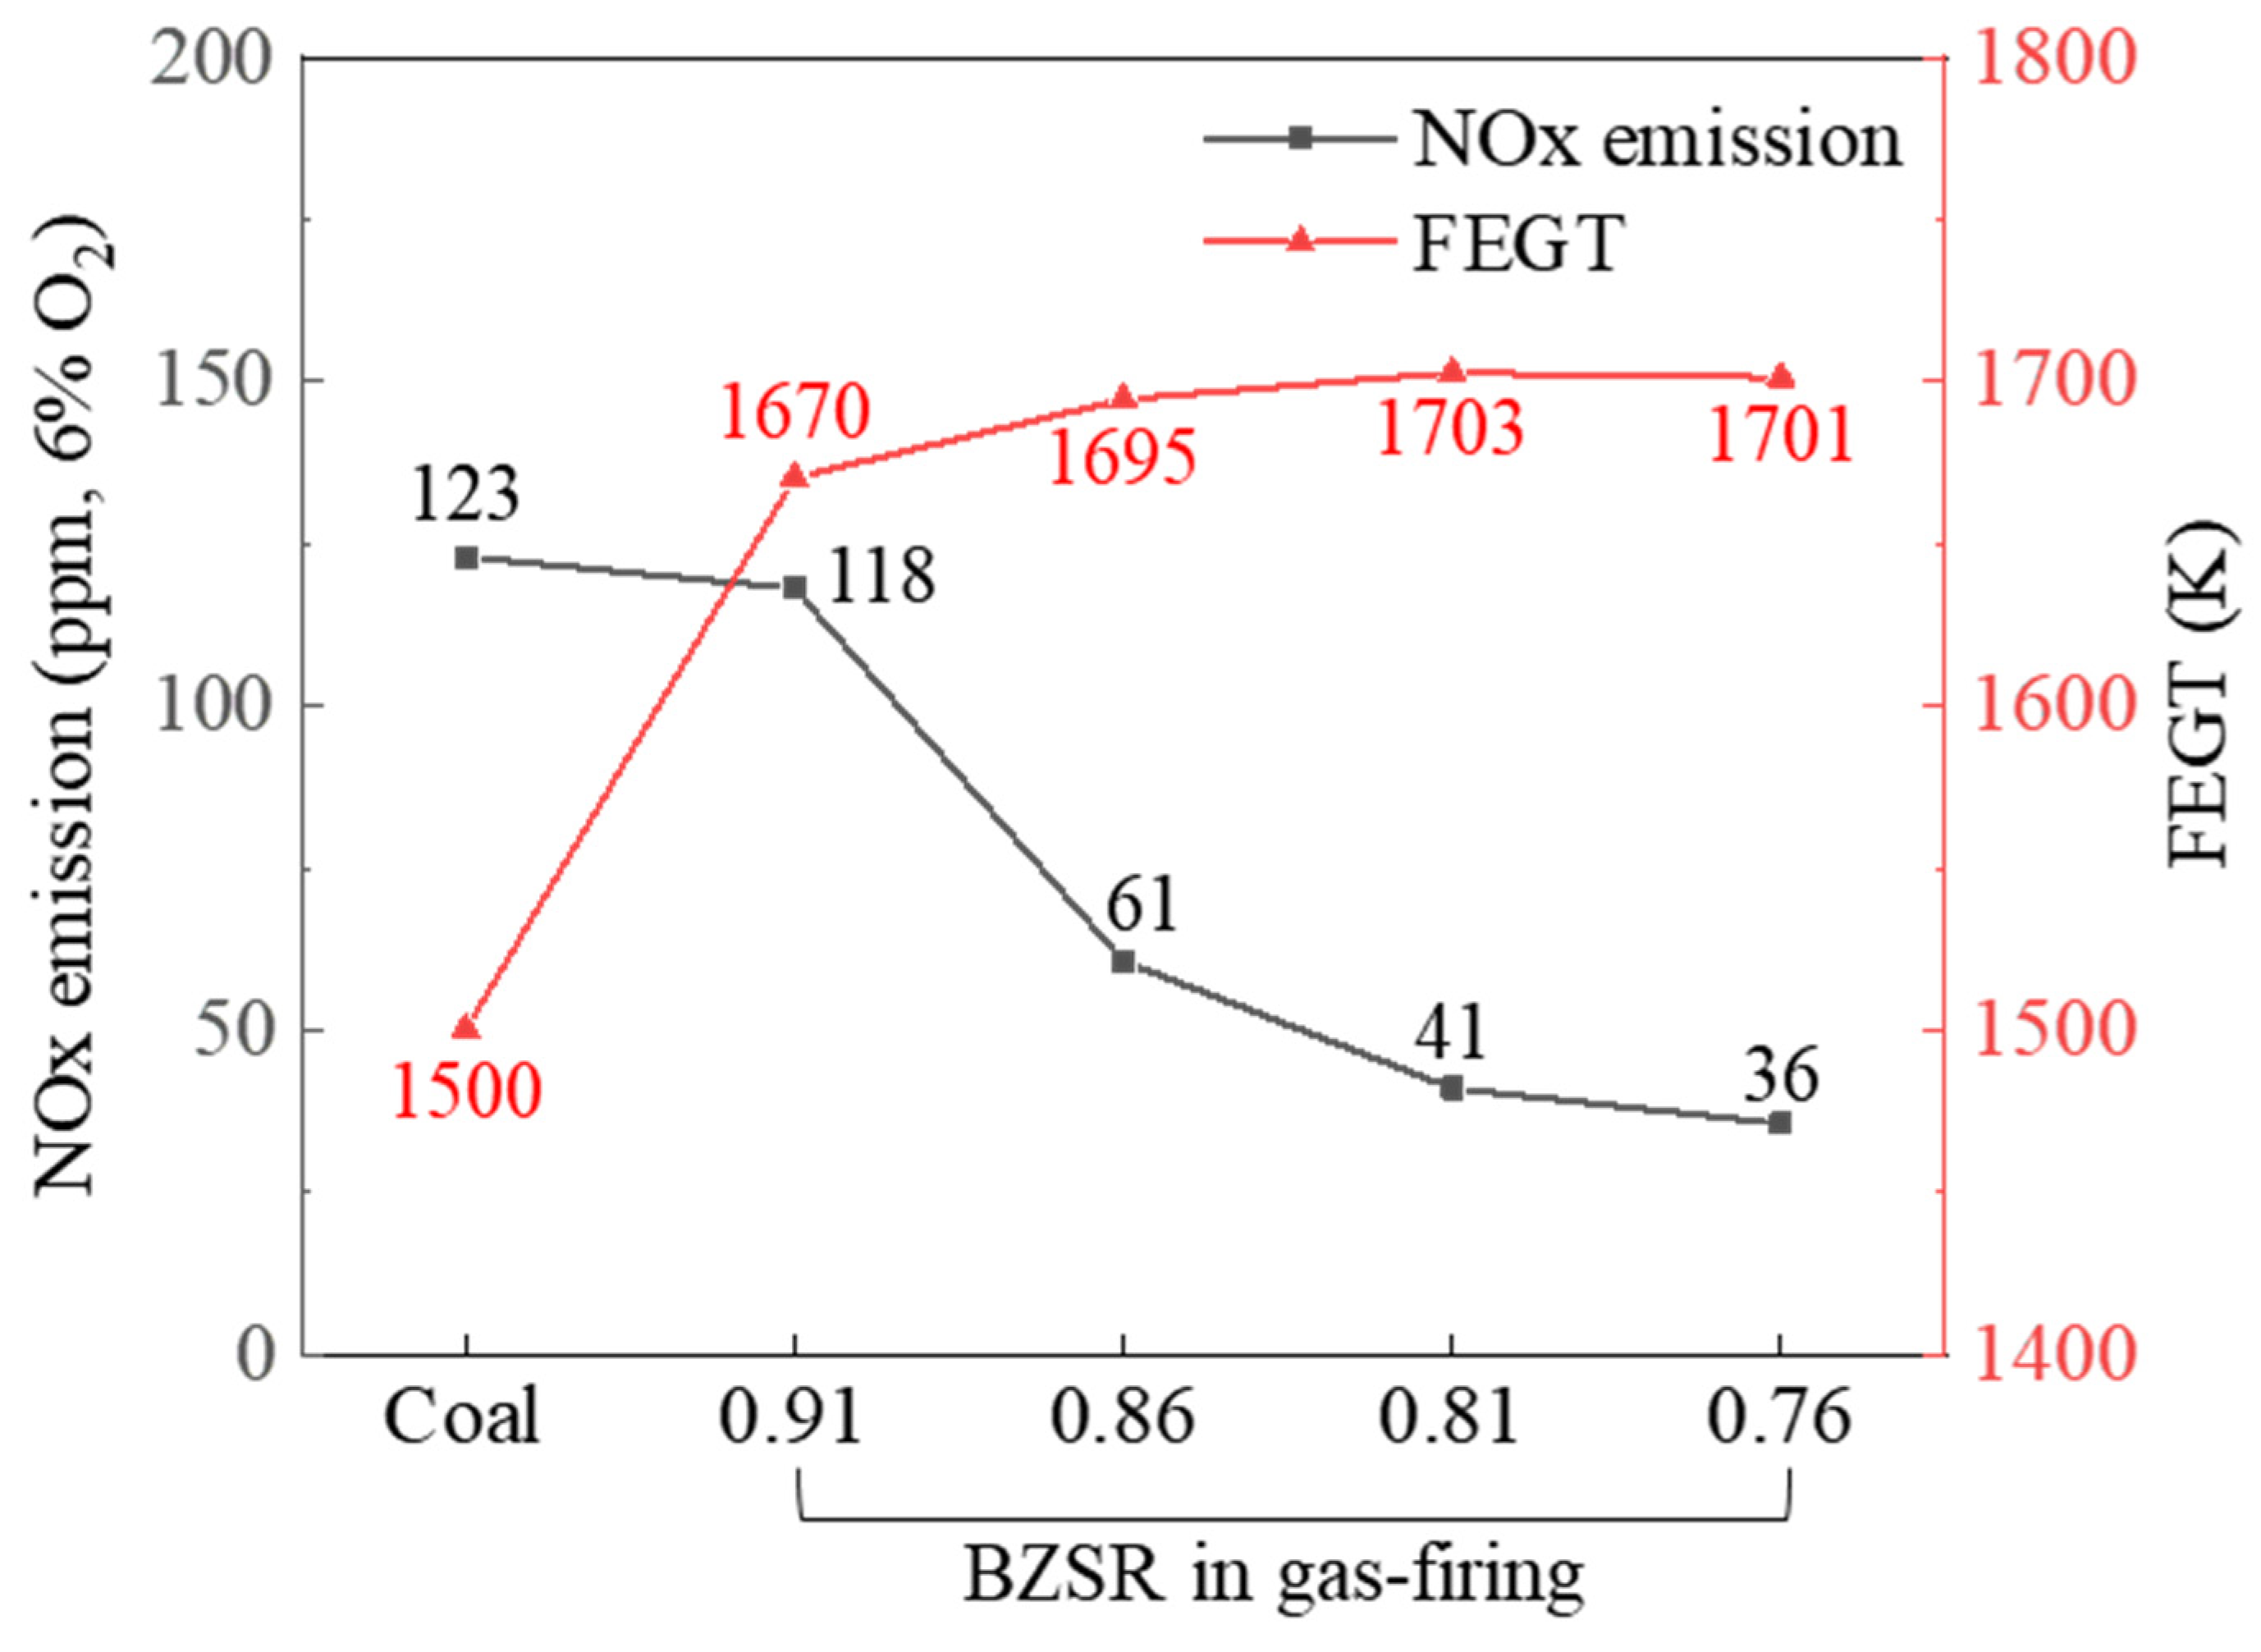
Figure 11 shows the modelled NOx emissions at the boiler outlet and the FEGT, for both the coal and gas firing cases. The NOx emissions in the gas firing case were exponentially proportional to the BZSR. At a BZSR of 0.91, the NOx emissions were comparable to those of coal. FEGT increased significantly following the conversion of the boiler to methane. The FEGT increased with decreasing BZSR, but this change was relatively small. Therefore, when converting Boryeong Unit 3 to run on methane, the BZSR could be increased to slightly lower the FEGT. However, if other methods could be developed to reduce the FEGT, a lower BZSR would be preferable, as this would help reduce the boiler’s NOx emissions.
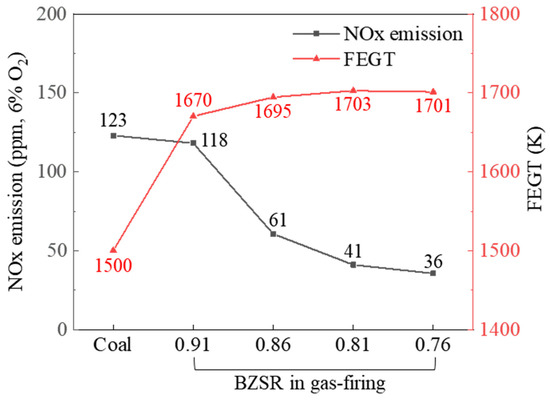
Figure 11.
NOx emissions and furnace exit gas temperature (FEGT) under coal- and gas-firing cases.
4. Conclusions
CFD simulations were conducted to explore the feasibility of converting a coal-fired boiler to operate using methane in order to reduce CO2 emissions. First, the simulation results of a coal-fired boiler, Boryeong Unit 3, were validated against on-site measurements, revealing the accuracy of the simulation. Subsequently, gas firing was simulated in the coal boiler to determine the gas temperature distribution, NOx emissions, and heat transfer characteristics, with the results being compared with those of an existing coal-fired boiler. In addition, the effects of BZSR on the heat transfer profile and NOx emissions were evaluated. The main conclusions of this study are as follows:
- The good agreement between the simulated results and the measured values indicated that the simulation method is capable of predicting the boiler performance. It was proved that this boiler model can evaluate heat transfer profile and NOx emission characteristics in consideration of not only fuel properties but also operating conditions.
- Converting the boiler to run on methane increased the average gas temperature at the top of the furnace; the local maximum temperature also increased by 200–400 K. However, the low emissivity of the methane flame increased heat absorption in the tube bundles in the convection pass, at the expense of lowering heat absorption in the waterwall.
- Increasing the BZSR logarithmically increased the waterwall heat absorption, but NOx emissions increased exponentially. Even at a BZSR of 0.91, considerable differences remained compared with the heat transfer profile of the existing coal-fired boiler. It is unlikely that these differences could be rectified solely by adjusting the air distribution. Therefore, additional alternatives to reduce the FEGT would be required to implement gas firing in Boryeong Unit 3.
Although heat transfer-related issues were identified, the conversion of coal-fired boilers to run on methane gas is clearly beneficial for the reduction of emissions, including CO2 and NOx. Therefore, future studies should investigate the possibility of lowering the load during gas-firing in coal boilers, as this could help lower the FEGT.
Author Contributions
Conceptualization, K.-M.K. and G.-B.K.; Data curation, K.-M.K.; Formal analysis, K.-M.K., G.-B.K. and B.-H.L.; Funding acquisition, C.-H.J.; Investigation, G.-B.K. and Y.-H.B.; Methodology, K.-M.K.; Project administration, G.-B.K.; Software, K.-M.K.; Supervision, C.-H.J.; Validation, K.-M.K.; Visualization, K.-M.K.; Writing—original draft, K.-M.K., B.-H.L. and Y.-H.B.; Writing—review and editing, K.-M.K. All authors have read and agreed to the published version of the manuscript.
Funding
This work was supported by a 2-Year Research Grant of Pusan National University and by a Human Resources Development Program (No. 20204030200030) grant of the Korea Institute of Energy Technology Evaluation and Planning (KETEP) funded by the Ministry of Trade, Industry, and Energy of the Republic of Korea.
Institutional Review Board Statement
Not applicable.
Informed Consent Statement
Not applicable.
Conflicts of Interest
The authors declare no conflict of interest.
References
- Wang, Y.; Lou, S.; Wu, Y. Coordinated planning of transmission expansion and coal-fired power plants flexibility retrofits to accommodate the high penetration of wind power. IET Gener. Transm. Distrib. 2019, 13, 4702–4711. [Google Scholar] [CrossRef]
- Pronobis, M. Chapter 10—Increasing flexibility of boiler operation. In Environmentally Oriented Modernization of Power Boilers, 1st ed.; Pronobis, M., Ed.; Elsevier: Amsterdam, The Netherlands, 2020; pp. 291–307. [Google Scholar]
- Pescia, D. Flexibility in Thermal Power Plants—With a Focus on Existing Coal-Fired Power Plants; Agora Energiewende: Berlin, Germany, 2017. [Google Scholar]
- Kumar, S.; Kwon, H.-T.; Choi, K.-H.; Cho, J.-H.; Lim, W.; Moon, I. Current status and future projections of LNG demand and supplies: A global prospective. Energy Policy 2011, 39, 4097–4104. [Google Scholar] [CrossRef]
- Lin, J.; Mou, D. Analysis of the optimal spatial distribution of natural gas under ‘transition from coal to gas’ in China. Resour. Energy. Econ. 2021, 66, 101259. [Google Scholar] [CrossRef]
- Alvarez, R.A.; Paranhos, E. Air Pollution Issues Associated with Natural Gas and oil Operations. EM: Air and Waste Management Associations’ Magazine for Environmental Managers. 2012, pp. 22–25. Available online: http://citeseerx.ist.psu.edu/viewdoc/download?doi=10.1.1.699.2532&rep=rep1&type=pdf (accessed on 22 November 2021).
- Cascio, E.L.; Borelli, D.; Devia, F.; Schenone, C. Key performance indicators for integrated natural gas pressure reduction stations with energy recovery. Energy Convers. Manag. 2018, 164, 219–229. [Google Scholar] [CrossRef]
- Li, C.; Zheng, S.; Li, J.; Zeng, Z. Optimal design and thermo-economic analysis of an integrated power generation system in natural gas pressure reduction stations. Energy Convers. Manag. 2019, 200, 112079. [Google Scholar] [CrossRef]
- IEA. Word Energy Outlook. 2021. Available online: https://www.iea.org/reports/world-energy-outlook-2021 (accessed on 19 November 2021).
- Gonzalez-Salazar, M.A.; Kirsten, T.; Prchlik, L. Review of the operational flexibility and emissions of gas- and coal-fired power plants in a future with growing renewables. Renew. Sustain. Energy Rev. 2018, 82, 1497–1513. [Google Scholar] [CrossRef]
- Binkiewicz, F.J.; Kleisley, R.J.; McMahon, B.E.; Monacelli, J.E.; Roth, D.A.; Wong, D.K. Natural Gas Conversions of Existing Coal-Fired Boilers; White Paper MS-14, Babcock & Wilcox Power Generation Group, Inc.: Barberton, OH, USA, 2011. [Google Scholar]
- Salovaara, J. Coal to Natural Gas Fuel Switching and CO2 Emissions Reduction. Ph.D. Thesis, Harvard College, Cambridge, MA, USA, 2011. [Google Scholar]
- Deng, J.; Wang, X.; Wei, Z.; Wang, L.; Wang, C.; Chen, Z. A review of NOx and SOx emission reduction technologies for marine diesel engines and the potential evaluation of liquefied natural gas fueled vessels. Sci. Total Environ. 2021, 766, 144319. [Google Scholar] [CrossRef]
- Kim, K.-M.; Kim, G.-B.; Lee, B.-H.; Jeon, C.-H.; Keum, J.-H. Methane gas cofiring effects on combustion and NOx emission in 550 MW tangentially fired pulverized-coal boiler. ACS Omega 2021, 6, 31132–31146. [Google Scholar] [CrossRef]
- Dusatko, G. Gas Cofiring Assessment for Coal Fired Utility Boilers; Technical Report for Electric Power Research Institute: Chicago, IL, USA, 2000. [Google Scholar]
- U.S. Energy Information Administration. Capital Cost and Performance Characteristic Estimates for Utility Scale Electric Power Generating Technologies; U.S. Department of Energy: Washington, DC, USA, 2020.
- Han, Y.; Shen, B.; Zhang, T. A techno-economic assessment of fuel switching options of addressing environmental challenges of coal-fired industrial boiler: An analytical work for China. Energy Procedia 2017, 142, 3083–3087. [Google Scholar] [CrossRef]
- Mills, S. Combining Solar Power with Coal-Fired Power Plants, or Cofiring Natural Gas; Report by IEA Clean Coal Centre: London, UK, 2017. [Google Scholar]
- Bedilion, R. Technology considerations for coal-to-natural gas conversions. In Proceedings of the EIA Energy Conference, Washington, DC, USA, 26–27 June 2017. [Google Scholar]
- Black, S.; Bielunis, D. Challenges when converting coal-fired boilers to natural gas. In Proceedings of the CIBO Industrial Emissions Control Technology Conference & Natural Gas Conversion Workshop, Portland, ME, USA, 5–8 August 2013. [Google Scholar]
- Pronobis, M. Chapter 6—Replacing coal with other fuels. In Environmentally Oriented Modernization of Power Boilers, 1st ed.; Pronobis, M., Ed.; Elsevier: Amsterdam, The Netherlands, 2020; pp. 167–176. [Google Scholar]
- ANSYS. Fluent Theory Guide 19.2; ANSYS, Inc.: Canonsburg, PA, USA, 2018. [Google Scholar]
- Shih, T.-H.; Liou, W.W.; Shabbir, A.; Yang, Z.; Zhu, J. A new k-ϵ eddy viscosity model for high Reynolds number turbulent flows. Comput. Fluids 1995, 24, 227–238. [Google Scholar] [CrossRef]
- Baum, M.M.; Street, P.J. Predicting the Combustion Behavior of Coal Particles. Combust. Sci. Technol. 1971, 3, 231–243. [Google Scholar] [CrossRef]
- Field, M.A. Rate of Combustion of Size-Graded Fractions of Char from a Low Rank Coal between 1200 K–2000 K. Combust. Flame 1969, 13, 237–252. [Google Scholar] [CrossRef]
- Magnussen, B.F. On the Structure of Turbulence and a Generalized Eddy Dissipation Concept for Chemical Reaction in Turbulent Flow. In Proceedings of the Nineteenth AIAA Meeting, St. Louis, MO, USA, 12–15 January 1981. [Google Scholar]
- Kim, J.P.; Schnell, U.; Scheffknecht, G. Comparison of different global reaction mechanisms for mild combustion of natural gas. Combust. Sci. Technol. 2008, 180, 565–592. [Google Scholar] [CrossRef]
- Howard, J.B.; Williams, G.C.; Fine, D.H. Kinetics of carbon monoxide oxidation in postflame gases. Symp. Int. Combust. 1973, 14, 975–986. [Google Scholar] [CrossRef]
- Pasternak, I.S.; Gauvin, W.H. Turbulent heat and mass transfer from stationary particles. Can. J. Chem. Eng. 1960, 38, 35–42. [Google Scholar] [CrossRef]
- Gnielinski, V. Berechnung mittlerer Wärme- und Stoffübergangskoeffizienten an laminar und turbulent überströmten Einzelkörpern mit Hilfe einer einheitlichen Gleichung. Forsch. Ing. 1975, 41, 145–153. [Google Scholar] [CrossRef]
- Gnielinski, V. Heat transfer in cross-flow around single rows of tubes and through tube bundles. In VDI Heat Atlas, 2nd ed.; Stephan, P., Ed.; Springer: Berlin/Heidelberg, Germany, 2010; pp. 725–729. [Google Scholar]
- Wang, H.; Zhang, C.; Liu, X. Heat transfer calculation methods in three-dimensional CFD model for pulverized coal-fired boilers. Appl. Therm. Eng. 2020, 166, 114633. [Google Scholar] [CrossRef]
- Johnson, T.R.; Bee’r, J.M. The zone method analysis of radiant heat transfer: A model for luminous radiation. J. Inst. Fuel 1973, 46, 301–309. [Google Scholar]
- Biermann, P.; Vortmeyer, D. Wärmestrahlung staubhaltiger Gase. Wärme-Und Stoffübertragung 1969, 2, 193–202. [Google Scholar] [CrossRef]
- Vortmeyer, D.; Kabelac, S. Gas radiation: Radiation from gas mixtures. In VDI Heat Atlas, 2nd ed.; Stephan, P., Ed.; Springer: Berlin/Heidelberg, Germany, 2010; pp. 979–988. [Google Scholar]
- Hill, S.C.; Douglas Smoot, L. Modeling of nitrogen oxides formation and destruction in combustion systems. Prog. Energy Combust. 2000, 26, 417–458. [Google Scholar] [CrossRef]
- De Soete, G.G. Overall reaction rates of NO and N2 formation from fuel nitrogen. Symp. Int. Combust. 1975, 15, 1093–1102. [Google Scholar] [CrossRef]
- Levy, J.M.; Chan, L.K.; Sarofim, A.F.; Beér, J.M. NO/char reactions at pulverized coal flame conditions. Symp. Int. Combust. 1981, 18, 111–120. [Google Scholar] [CrossRef]
- Kandamby, N.; Lazopoulos, G.; Lockwood, F.C.; Perera, A.; Vigevano, L. Mathematical modeling of NOx emission reduction by the use of reburn technology in utility boilers. In Proceedings of the ASME International Joint Power Generation Conference and Exhibition, Houston, TX, USA, 14–16 October 1996. [Google Scholar]


Publisher’s Note: MDPI stays neutral with regard to jurisdictional claims in published maps and institutional affiliations. |
© 2021 by the authors. Licensee MDPI, Basel, Switzerland. This article is an open access article distributed under the terms and conditions of the Creative Commons Attribution (CC BY) license (https://creativecommons.org/licenses/by/4.0/).