Abstract
Strict regulations and acts have been imposed to limit NOx and carbon emissions. The power generation industry has resorted to innovative techniques to overcome such a low level of tolerance. Amongst those in the literature, CO2-argon-steam oxyfuel (CARSOXY) gas turbines have theoretically been proven to offer an economically sustainable solution while retaining high efficiency. Although theoretical studies have characterized CARSOXY, no experimental evidence has been provided in the literature. Therefore, this paper attempts to experimentally assess CARSOXY in comparison to a CH4/air flame. OH* chemiluminescence integrated with OH Planar Laser-Induced Fluorescence (PLIF) imaging has been utilized to study flame stability and flame geometry (i.e., the area of highest heat intensity ( center of highest heat intensity ()) over a range of working fluid Reynolds’ numbers and oxidizing equivalence ratios. In addition, the standard deviation of heat release fluctuations has been utilized as the base-criteria to compare the stability performance of CARSOXY to CH4/air combustion. Moreover, turbulence-chemistry interactions have been described using Damköhler numbers and by plotting Borghi regime diagrams. This paper suggests a modified numerical approach to estimate Damköhler numbers and plot regime diagrams for non-premixed combustion by utilizing the Buckingham π theorem based on experimental observations and results. CARSOXY flames showed lower flame intensity than that of the CH4/air flame throughout the entire interval by approximately 16%, indicating higher heat release. The Damköhler numbers of the CARSOXY flame were also greater than those of the CH4/air flame in all conditions, indicating more uniform CARSOXY flames. It was found that the tendency of the CARSOXY flame of approaching the concentrated reaction zone is greater than that of the CH4/air flame.
1. Introduction
The vast majority of gas turbines use air as an oxidizer. Such a practice has, cumulatively, been accountable for a large part of the greenhouse effect over the last 30 years, with CO2 and nitrogen oxides (NOx) being significant contributors [1]. To limit NOx and carbon emissions, strict regulations and acts have been imposed. To name a few, the Clean Air Act 1990 of the United States reduced the tolerated NOx emission level from 75 ppm to 10 ppm within less than 15 years [2]. Similarly, the Climate Change Act 2008 of the United Kingdom requires 80% of 1990 carbon emission levels to be reduced within 30 years [3]. An efficient approach to comply with these strict emission margins is oxyfuel combustion [4]. By eliminating N2, NOx emissions are eliminated, while carbon emission can be captured more easily by utilizing cost-effective capturing processes [5]. Oxyfuel combustion can enhance efficiency while maintaining a relatively low level of CO2 emissions by further carbon capture and storage techniques, which are considered one of the imperative requirements for future fossil-fueled gas turbines [6]. Theoretical studies [6,7] have been conducted on oxyfuel gas turbines to cover multidisciplinary issues. The authors of [7] have theoretically proven that oxyfuel combustion increases cycle efficiency by 13% compared to air-driven gas turbines.
Nevertheless, using high concentrations of oxygen has several complexities. Most importantly, oxyfuel flame temperatures exceed those of fuel/air flames. Therefore, these temperatures tend to be beyond the material design limits of existing gas turbines [8]. However, the flame temperature can be controlled by recirculating the captured carbon back into the gas turbine to dilute the working fluid (an oxidizing mixture such as air or CO2-Ar-O2). The literature includes studies that both theoretically and experimentally characterize O2/CO2/CH4 combustion [9,10,11,12,13]. However, the high level of CO2 circulated back to the oxidizer typically decreases chemical kinetics and causes a reduction in laminar flame speed [13]. As reported by [13], the addition of CO2 oxy-combustion impacts kinematic viscosity, thermal conductivity, and mass diffusivity, thus affecting flammability limits. O2/CO2/CH4 mixtures with an oxygen fraction of 36% can only achieve 79–82% flammability of air-CH4 in the range of the Reynolds numbers considered [13]. Therefore, it can be concluded that high oxygen levels are required to maintain the same flammability region as for air/CH4.
It must also be noted that carbon capture and storage (CCS) techniques reduce the gas turbine cycle efficiency. As reported by [11], a gas-fired plant’s cycle efficiency without CCS drops from approximately from 55% to 44% if CCS is integrated. Attempting to attain the same power output level as that without CCS essentially results in an increase in the gas turbine size, which reduces the plant’s compactness [13].
Injecting the working fluid with inert gases with high heat capacities, such as argon, can increase power outputs, making up for the CCS efficiency losses. Moreover, humidification can also be employed to raise even further power outputs [12,13,14].
The implementation of these concepts is referred to as CO2-argon-steam oxyfuel (CARSOXY) gas turbines. Previous research [14,15] clearly shows that a gas turbine’s performance can be increased by using humidification and evaporation. In addition, heat exchangers are excellent methods of heat recovery [13]. These methods have a higher potential to increase the cycle efficiency when a CARSOXY mixture is used as the working fluid [13,14]. If a suitable cycle configuration is used under specific operation conditions, high thermo-economic benefits can be reached.
Moreover, a CO2-Ar-Steam mixture can enhance efficiency while maintaining a relatively low level of CO2 emissions by further carbon capture and storage techniques, which are considered one of the imperative requirements for future fossil-fueled gas turbines [12,13,14,15]. Several theoretical studies have been conducted on CARSOXY gas turbines to cover multidisciplinary issues. Al-Doboon et al. [12] have theoretically proven that CARSOXY increases cycle efficiency by 13% compared to air-driven gas turbines (the estimated efficiency is an upper limit). Fawwaz-Alrebei et al. [14] have theoretically identified the ultimate working conditions of CARSOXY gas turbines and optimized CARSOXY blends. Moreover, the feasibility of producing CARSOXY through an economically efficient approach has also been addressed elsewhere [14]. The techno-economic sustainability of producing a continuous supply of argon for the CARSOXY blend has been analyzed in previous studies [6,13,14,15]. As indicated in these studies, the CARSOXY cycle has been shown to be more cost-effective than an air-driven gas turbine. The CARSOXY cycle’s Modified Internal Rate of Return (MIRR) is about 2.2 percent higher than that of the air-driven cycle. Furthermore, the CARSOXY cycle’s profitability index (PI) is 1.72, whereas the air-driven cycle’s is only 1.28.
Nevertheless, experimental campaigns are needed to demonstrate the practicality of this concept. As previously highlighted, experimental studies in the literature [12,13] characterize O2/CO2/fuel combustion but provide no evidence for CO2/Ar/O2/fuel combustion (CARSOXY).
Therefore, this paper attempts to experimentally characterize CO2/Ar/O2/fuel flames in a swirl burner typical of gas turbine systems. A comparative study was conducted to assess CO2/Ar/O2/CH4’s flame stability compared with that of air/methane flames.
2. Materials and Methods
2.1. Rig
A diffusive 20-kW generic burner was used to compare the CARSOXY to the CH4/air flames (Figure 1). The flame was stabilized with a quartz cylindrical confinement together with a swirler. The confinement was 30 cm long with a diameter of 8.5 cm. The confinement top was open to the environment and fitted on top of the burner exit. A swirl number of 1.5 was used together with a ninety-degree divergent nozzle (inner diameter = 2.8 cm). Fuel was supplied to the burner through the fuel intake, which was directly connected to the diffusive injector. The working fluid was supplied to the burner through the working fluid intake. Mixing fuel with the working fluid only occurred at the burner exit; the mixing distance was . OH chemiluminescence and planar laser-induced fluorescence of OH radicals (OH-PLIF) were used in this study. A CCD camera was integrated into an Intensified Relay Optic (IRO) high-speed gated image intensifier. The optics associated with the system was an OH filter fitted on a 78 mm UV fixed-focal-length relay lens. The image intensifier was controlled by the I/I control unit, which was remotely controlled by the DaVis 7 software. The LaVision band-pass filter captured the OH radicals at 315 nm nm with transmissivity of 70%. The intensifier gate signal pulse width time was set at 400 with a gain of 85% for Chemiluminescence analyses, while the setting for PLIF was at 0.05 and 80%, respectively. The intensified image was finally captured by the 10 Hz CCD camera, which has a resolution of (688 520 pixels) at 16 bits. This provided an (r y) field of view (60 45 mm) and 0.0113 resolution.
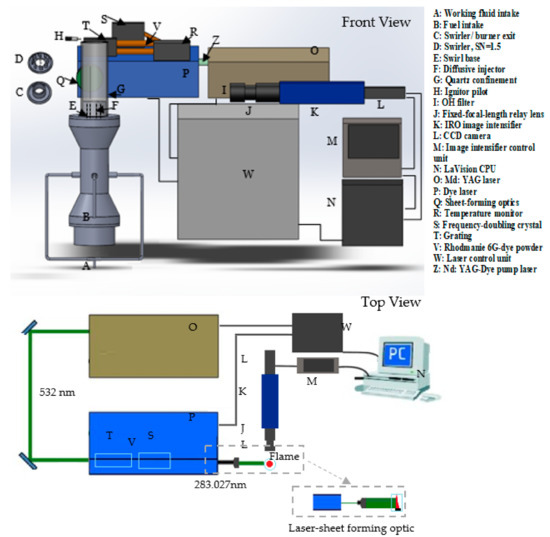
Figure 1.
Experimental setup.
The experiment setup is shown in Figure 1 and Figure 2. As shown in Figure 1, the PLIF system consisted of a SIrah PrecisionScan dye laser and a Continuum Precision Nd: YAG laser. The latter pumped the dye laser by a 532 nm beam—Z in Figure 1—with a frequency of 10 Hz. The pulse duration range for each shot was 5–10 ns at 532 nm. The linewidth of the SIrah PrecisionScan dye laser was 2.7 pm at 570 nm using 2400 lines/mm, 60 mm long grating. The exact wavelength of the OH radical excitation was achieved by using a solution of Rhodamine 6G dye powder and ethanol. The dye solution had a fundamental wavelength of 562 nm. However, the grating was remotely controlled and was able to modify the dye laser fundamental wavelength with an accuracy of 0.001 nm. The grating was adjusted such that the fundamental wavelength became 566 nm.
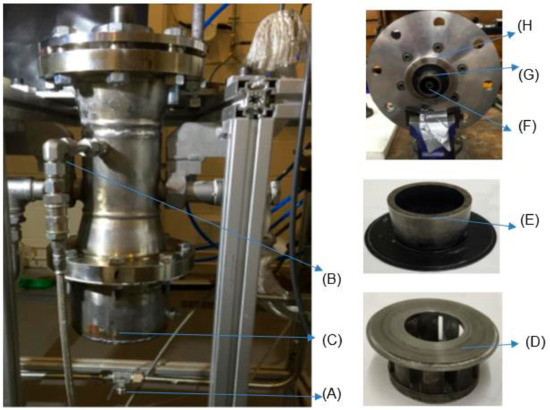
Figure 2.
The 20-kW generic burner system: (A) working fluid intake, (B) fuel intake, (C) speaker container, (D) swirler, SN = 1.5, (E) swirler/burner nozzle, divergent angle = 90°, (F) diffusive injector, (G) swirl base, (H) confinement base.
The laser beam was then directed to a frequency-doubling crystal, which halved the beam’s wavelength (283 nm) to excite the OH radicals. The dye laser beam’s final wavelength was tuned to 283.027 nm to consider the OH ground state distribution dependence on temperature. This wavelength had the lowest Boltzmann factor (the lowest temperature dependence) for CH4 combustion, at 573 K and 1.1 bar [16] (the operating condition of this PLIF analysis). The laser-sheet optic was used to illuminate a larger cross section of the fluid by converting the dot-shaped laser beam into a laser sheet (Figure 1). Sheet-forming optics were utilized to convert the line beam (at 283.027 nm) into an approximately 20 mm wide and 1–2 mm thick laser sheet. Finally, the laser sheet passed through the quartz.
2.2. Uncertainties
The experiment’s used working fluid and CH4 mass flow controllers had an uncertainty of ±1.25% FS [17]; the full ranges were 440 L/min and 4.8 L/min, respectively. Constant uncertainty values of (±1.25% × 440 L/min = ±5.5 L/min) and (±1.25% × 4.8 L/min = ±0.06 L/min) were concluded for the working fluid and CH4 flow rates, respectively.
The molar fractions of CARSOXY were normalized so that it contained zero H2O molar fraction (dry combustion). Therefore, a cylinder of 29% carbon dioxide, 32% oxygen, and 39% argon was used to supply the burner with the necessary working fluid. The findings of a previous study [18] reveal that adding H2O to the oxyfuel combustion impacts combustion characteristics, with a longer ignition delay, quicker burnout, and improved overall combustion characteristics (CCI). Normalizing the molar fractions was performed using ASPEN PLUS software, as shown in Table 1.

Table 1.
The actual filled molar fraction values of carbon dioxide, oxygen, and argon.
The cylinder has filling relative tolerances of 5% for each component with respect to its molar fraction [19]. Therefore, the actual filled molar fraction values of the components are specified in Table 1. The purity of methane (methane CP grade) was 99.5%, as reported by the supplier [19]; the 0.5% impurity was due to the content of other gases (Table 2).
Table 2.
Methane impurities of methane CP grade [19].
2.3. Experimental Matrix
The experimental matrix was chosen for the comparison of CARSOXY and CH4/air flames at constant thermal power (i.e.), using 1 L/min of methane at 1.5 bar and 25 °C, Equation (1). This thermal power level allows the usage of a low methane flow rate; thus, the effects of the relatively higher working fluid flow rate on the overall characteristics of the flame are more significant. As this study focuses on identifying the effect of the working fluid on the flame, it is crucial to ensure that the flame’s overall behavior is mainly driven by the oxidizing working fluid rather than the fuel flow rate. Therefore, the methane flow rate was maintained constant and as low as possible, thus enabling the study of laminar and transient flow regimes.
The molar fractions of CARSOXY suggested by [12] were normalized such that it contained zero H2O molar fraction (dry combustion) (Table 3). Working fluids were supplied to the burner at 1 bar and 25 °C. Eight average Reynolds numbers () were maintained constant for the working fluids (air and CO2-Ar-O2), (2000–3750, with a step of 250). Moreover, nine oxidizing equivalence ratios () were maintained constant for CH4/air and CARSOXY, (35–70, with a step of 4.375), Equations (1)–(4). The interval of the equivalence ratio differs from those of the premixed combustion for the following reasons:
Table 3.
Experiment matrix.
- 1-
- The operability limits of non-premixed diffusive combustion are broader than those of premixed combustion, allowing the combustion to occur at the limits of the equivalence ratio.
- 2-
- The equivalence ratios have been calculated based on the oxygen content described in Equations (2)–(4).
The thermo-fluid properties (µ,, , , , and V) correspond to the experimental setup as those have been obtained using ASPEN PLUS, in correspondence with the experiment matrix and conditions, in which the obtained data from ASPEN PLUS were synchronized to CHEMKIN. Using the thermo-fluid properties (µ,, , and) of CARSOXY and air together with the dimensional properties (A and of the burner exit, and V were calculated, Equations (5)–(7). Therefore, the thermo-fluid (µ,, , , , and V) properties of CARSOXY and air were obtained by simulating all attempts under the experiment setup conditions using ASPEN PLUS.
Table 3 shows the corresponding attempts at constant for air and CARSOXY and displays the corresponding of the attempts at constant for air and CARSOXY. The full description of equilibrating the equations of reactions is described in a previous study [20].
This paper has adopted the original method of estimating the Da number of nonpremixed oxyfuel combustion proposed by [21] and then suggests the modified Da number. Therefore, the chosen interval of Re is based on the recommendation of [21] (i.e., the Re interval of [1000–4000]).
2.4. Data Analyses and Numerical Post-Processing
The heat release fluctuation was calculated using the instantaneous and averaged integral pixel intensities of 500 background-corrected images ( and, using a MATLAB code to perform Equations (8) and (9), respectively). This technique quantifies chemiluminescence based on the summation of all pixel intensities [22]. This paper applies the standard deviation concept to quantify the chemiluminescence fluctuation () over time. Standard deviation is a statistical technique that measures data points’ tendency to be far from the mean value [23]. This paper utilizes this concept, described in Equation (10) [23], by processing the chemiluminescence fluctuation datapoints using the built-in standard deviation statistical function in MATLAB.
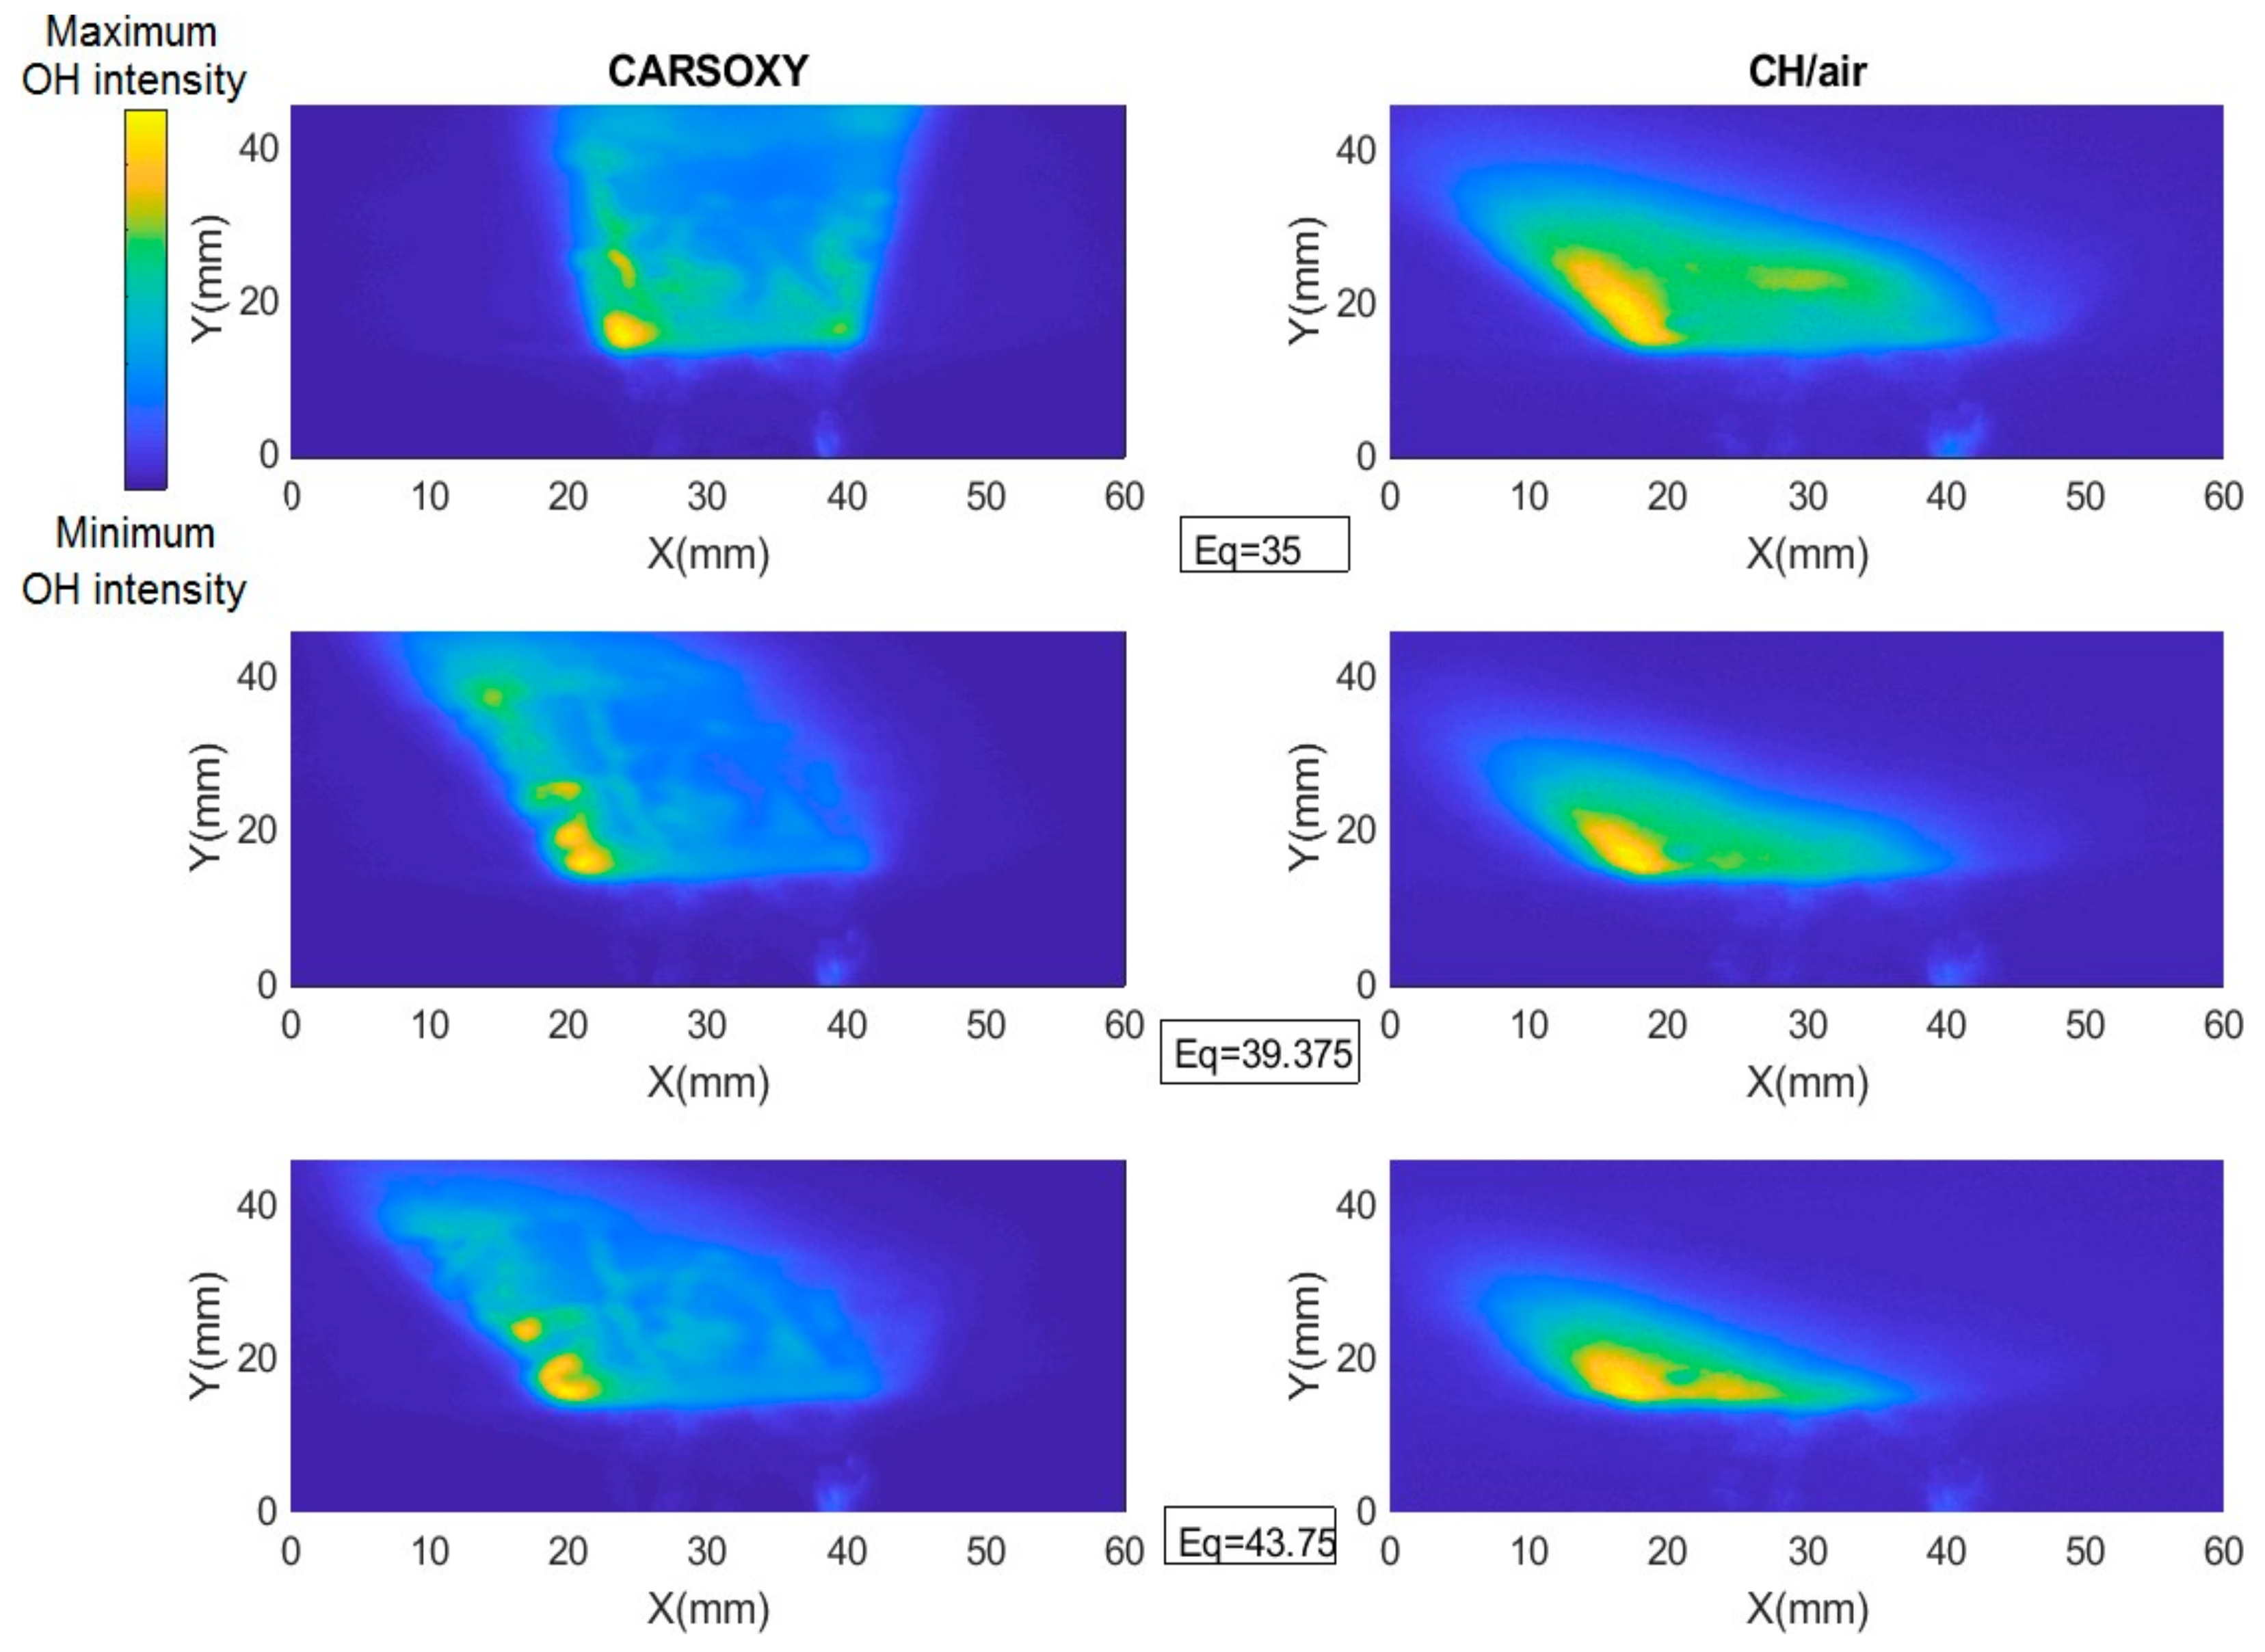
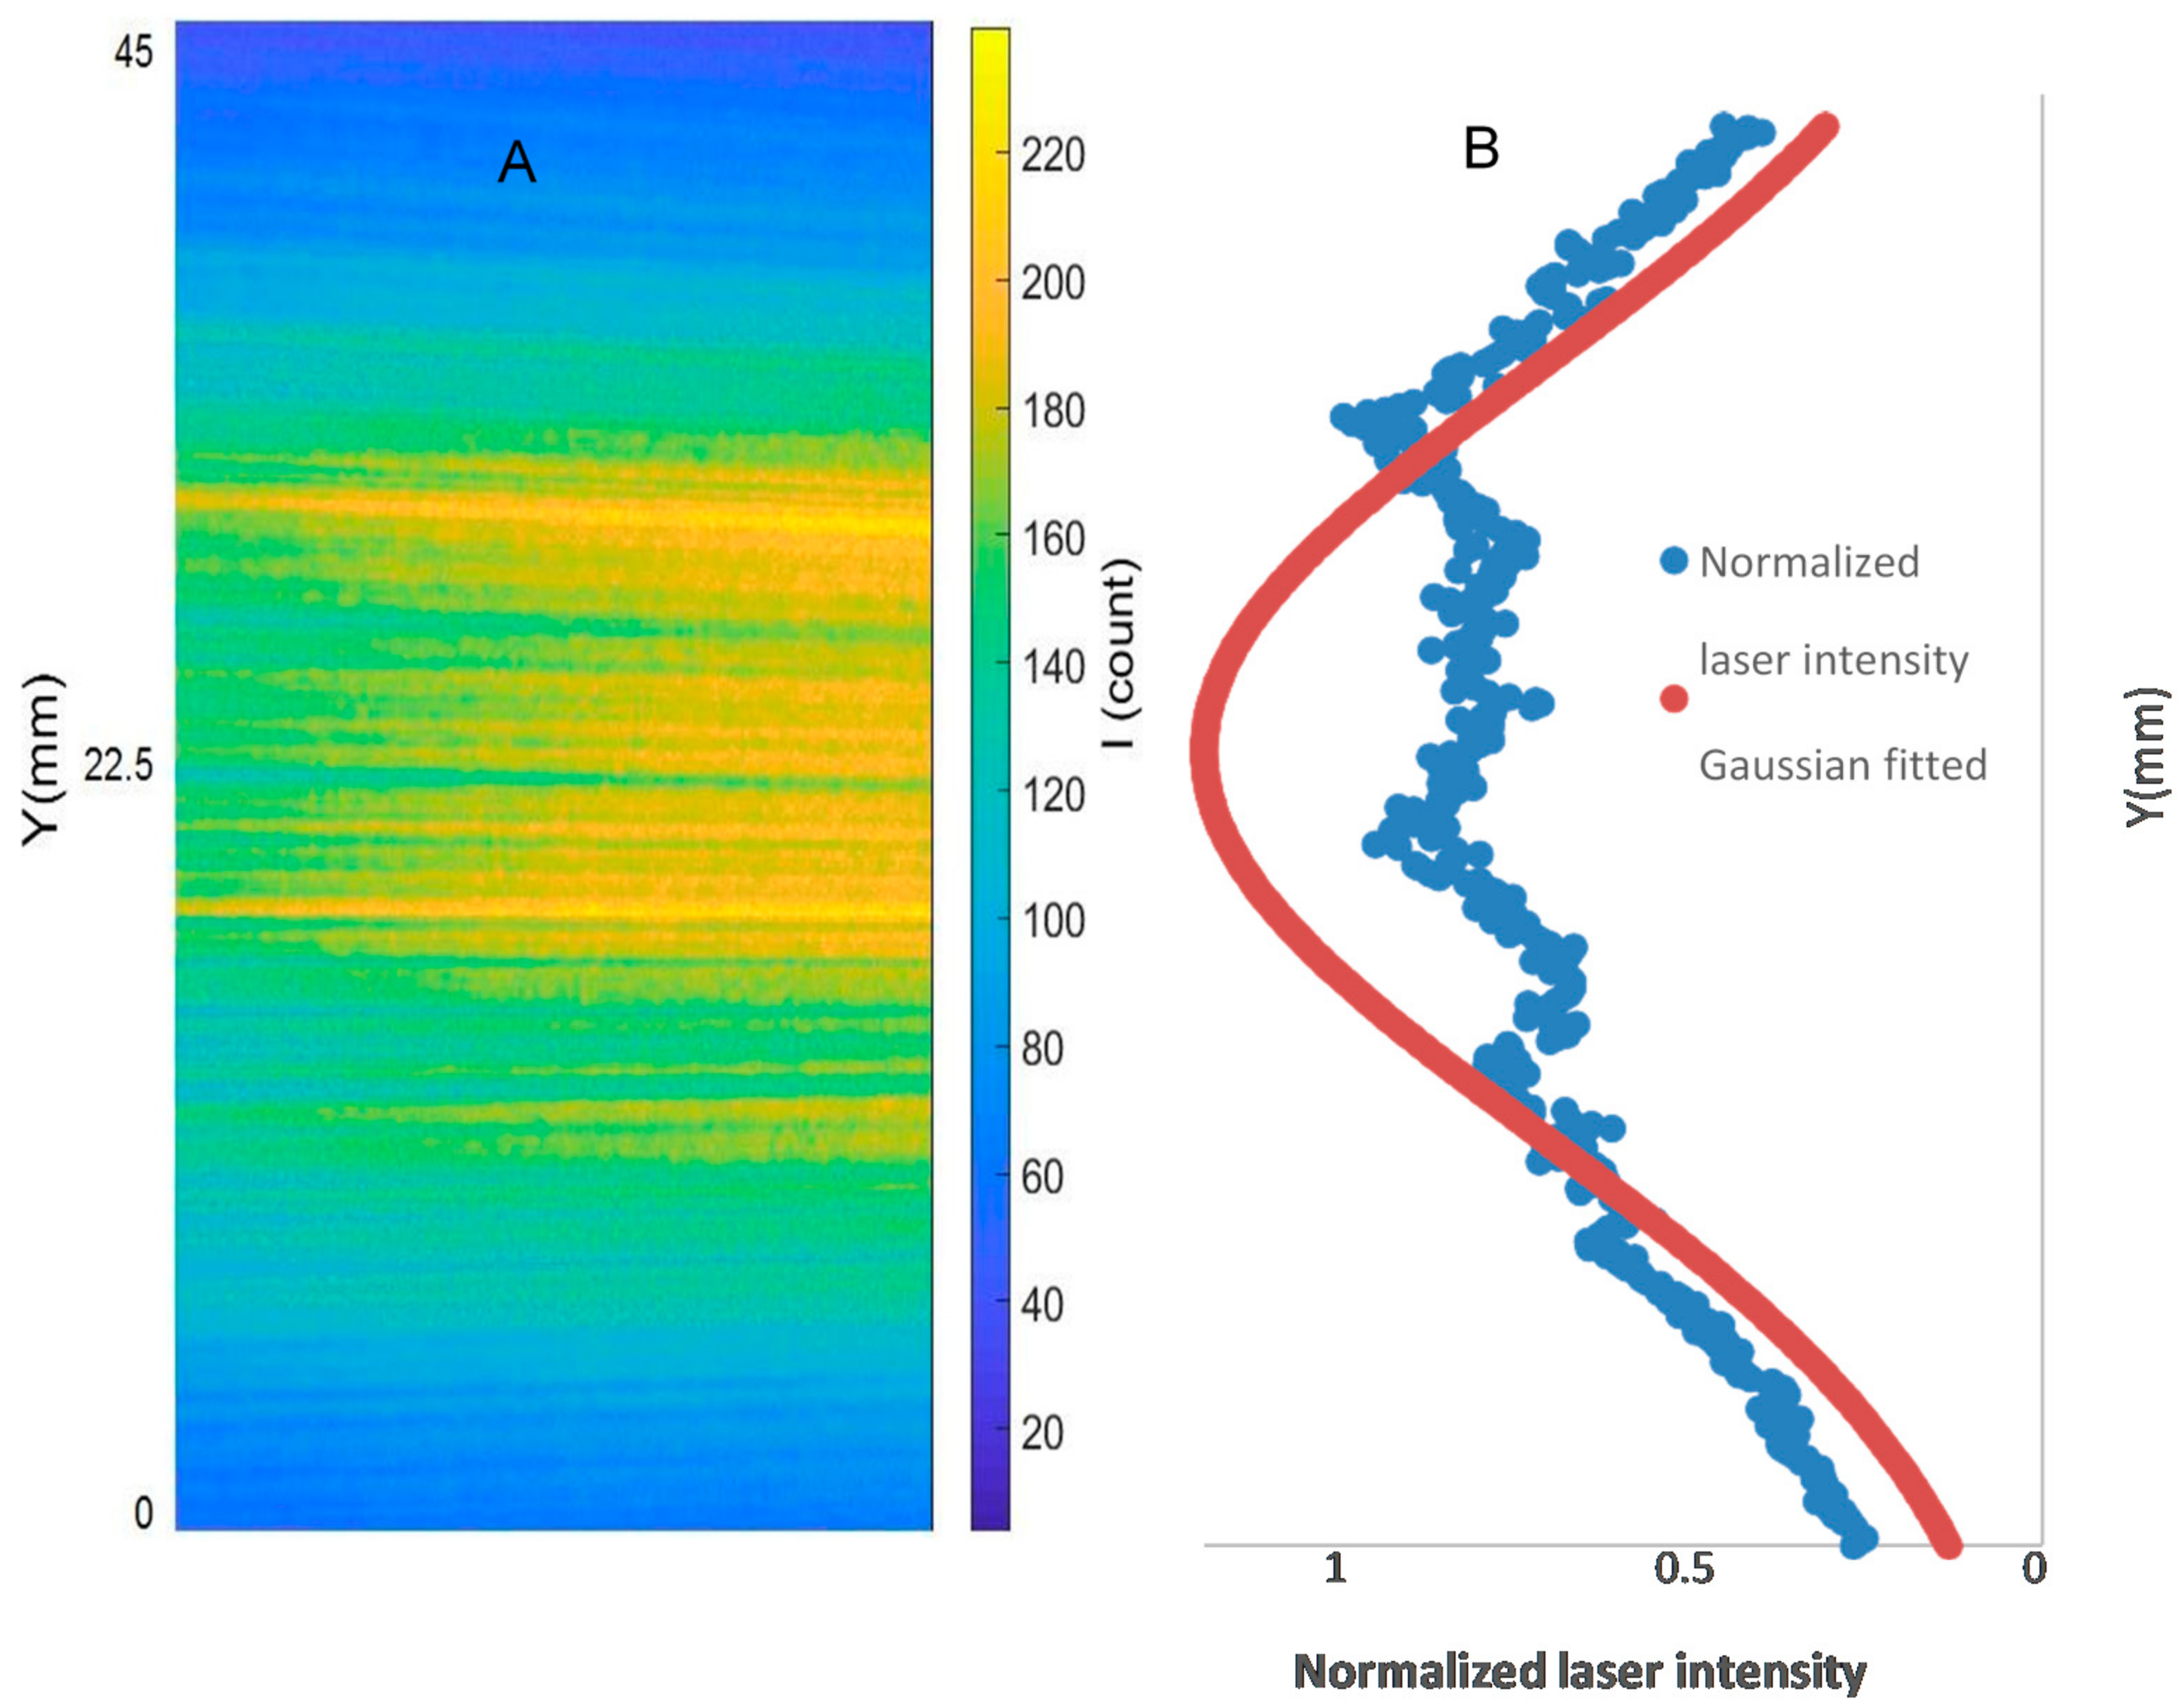
The image processing conducted for the PLIF analyses includes background correction, noise filtering, correction for the laser sheet intensity distribution, correction for shot-to-shot laser energy variation, and temporal averaging. Five hundred images were captured for each PLIF case in accordance with [22,24]. The laser energy for each image was measured using a LaVision energy monitor. The pixel intensities for each image were normalized to the maximum measured laser energy. Another 500 background images were captured with laser firing and with the quartz present in the field of view but without a flame in the burner. These 500 images were temporally averaged and subtracted from each instantaneous image (image with a flame). The results of the PLIF images of the area of the highest heat intensity were obtained for laser energy shot-to-shot, and laser-sheet corrected images. Figure 3A,B shows sample cases at Reynolds numbers (i.e., 2000–2750) and at (i.e., 35–43.75), respectively. As shown in Figure 4A, the laser intensity (I) varied along the Y axis. Therefore, The Y-I pixel intensities for the laser sheet profile (Figure 4A) were normalized to the maximum measured laser intensity (i.e., the pixel intensities along the Y axis were divided by the maximum measured laser intensity). The results of the normalized intensities were plotted in a Y-I curve, as shown in Figure 4B, blue peaks. The normalized intensities were then curve-fitted using a Gaussian distribution function (Equation (11)) in MATLAB-cftool. The curve-fitted laser sheet normalized intensity is represented in Figure 4B as a red peak.
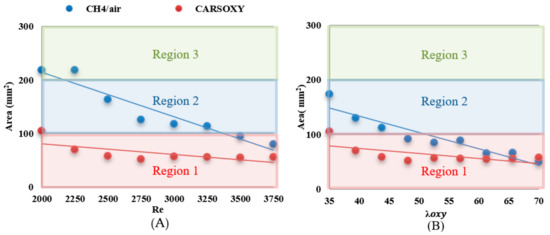
Figure 3.
of CARSOXY and CH4/air over (A) working fluid at and (B) .

Figure 4.
PLIF laser sheet intensity (A) and Gaussian fit to intensity distribution (B) for image correction.
Laser light intensity across the laser sheet follows a Gaussian distribution, which has the highest laser intensity towards the middle of the sheet and intensity decrease towards the edges, towards the y-direction of the field of view. Therefore, it was necessary to ensure that the pixel intensities were increased where the laser energy is lower than the maximum laser energy across the laser sheet. This was accomplished by converting the averaged and background corrected laser sheet image into an (X-Y-I) MATLAB matrix. Laser sheet profiles (Y-I carves) were plotted across the X directions, which were finally averaged into one curve. Using the curve-fitting built-in “cftool” function in MATLAB, the normalized laser sheet intensity profile was fitted with a Gaussian distribution. Once the Gaussian fit was obtained, it was applied to correct images using Gaussian fit at the maximum gradients (where there was a sudden change of the normalized Gaussian fitted intensity).
After applying the previously mentioned image corrections, a MATLAB code from [25] was adopted to characterize the main features of a flame. This technique initially found the maximum pixel intensity, which corresponded to. Once this location was determined, the maximum directional intensity change (maximum gradient) was identified on either side of the maximum pixel.
This generated a line that corresponded to the flame brush thickness at the highest OH intensity (. Finally, the corrected images were rescaled to binary images using a threshold of 70%, as recommended by [16]. This benchmarked the regions with high intensity and allowed MATLAB to calculate its area .
The image processing conducted for the PLIF analyses includes background correction, noise filtering, correction for the laser sheet intensity distribution, correction for shot-to-shot laser energy variation, and temporal averaging. After applying the previously mentioned image corrections, an edge detection algorithm was applied to the final image to examine the qualitative properties of the flame, which were then used to calculate the Damköhler numbers (Da) under varying operating conditions.
Laser energy shot-to-shot variation: 500 images were captured for each PLIF case of study; this choice of the number of images is based on the recommendation regarding PLIF analyses from [15]. The laser energy for each image was measured using the LaVision energy monitor. The pixel intensities for each image were normalized to the maximum measured laser energy by multiplying the pixel intensities of each instantaneous image by the ratio of its corresponding laser energy to the maximum laser energy.
Background and laser sheet image corrections: 500 images were captured with laser firing and with the quartz present in the field of view but without a flame in the burner. These 500 images were temporally averaged and subtracted from each instantaneous image of the case of study (image with a flame). Laser light intensity across the laser sheet followed a Gaussian distribution, with the highest laser intensity towards the middle of the sheet and an intensity decrease towards the edges, towards the y-direction of the field of view. Therefore, it was necessary to increase the pixel intensities where the laser energy was lower than the maximum laser energy across the laser sheet. This was accomplished by converting the averaged and background corrected laser sheet image—Figure 4A—into an (X-Y-I) MATLAB matrix. Laser sheet profiles (Y-I carves) were plotted across the X directions, which were finally averaged into one curve (Figure 4B). Using the carve-fitting built-in “cftool” function in MATLAB, the normalized laser sheet intensity profile was fitted with a Gaussian distribution, Equation (11), where is the Gaussian fitted intensity of the normalized intensity at Y position.
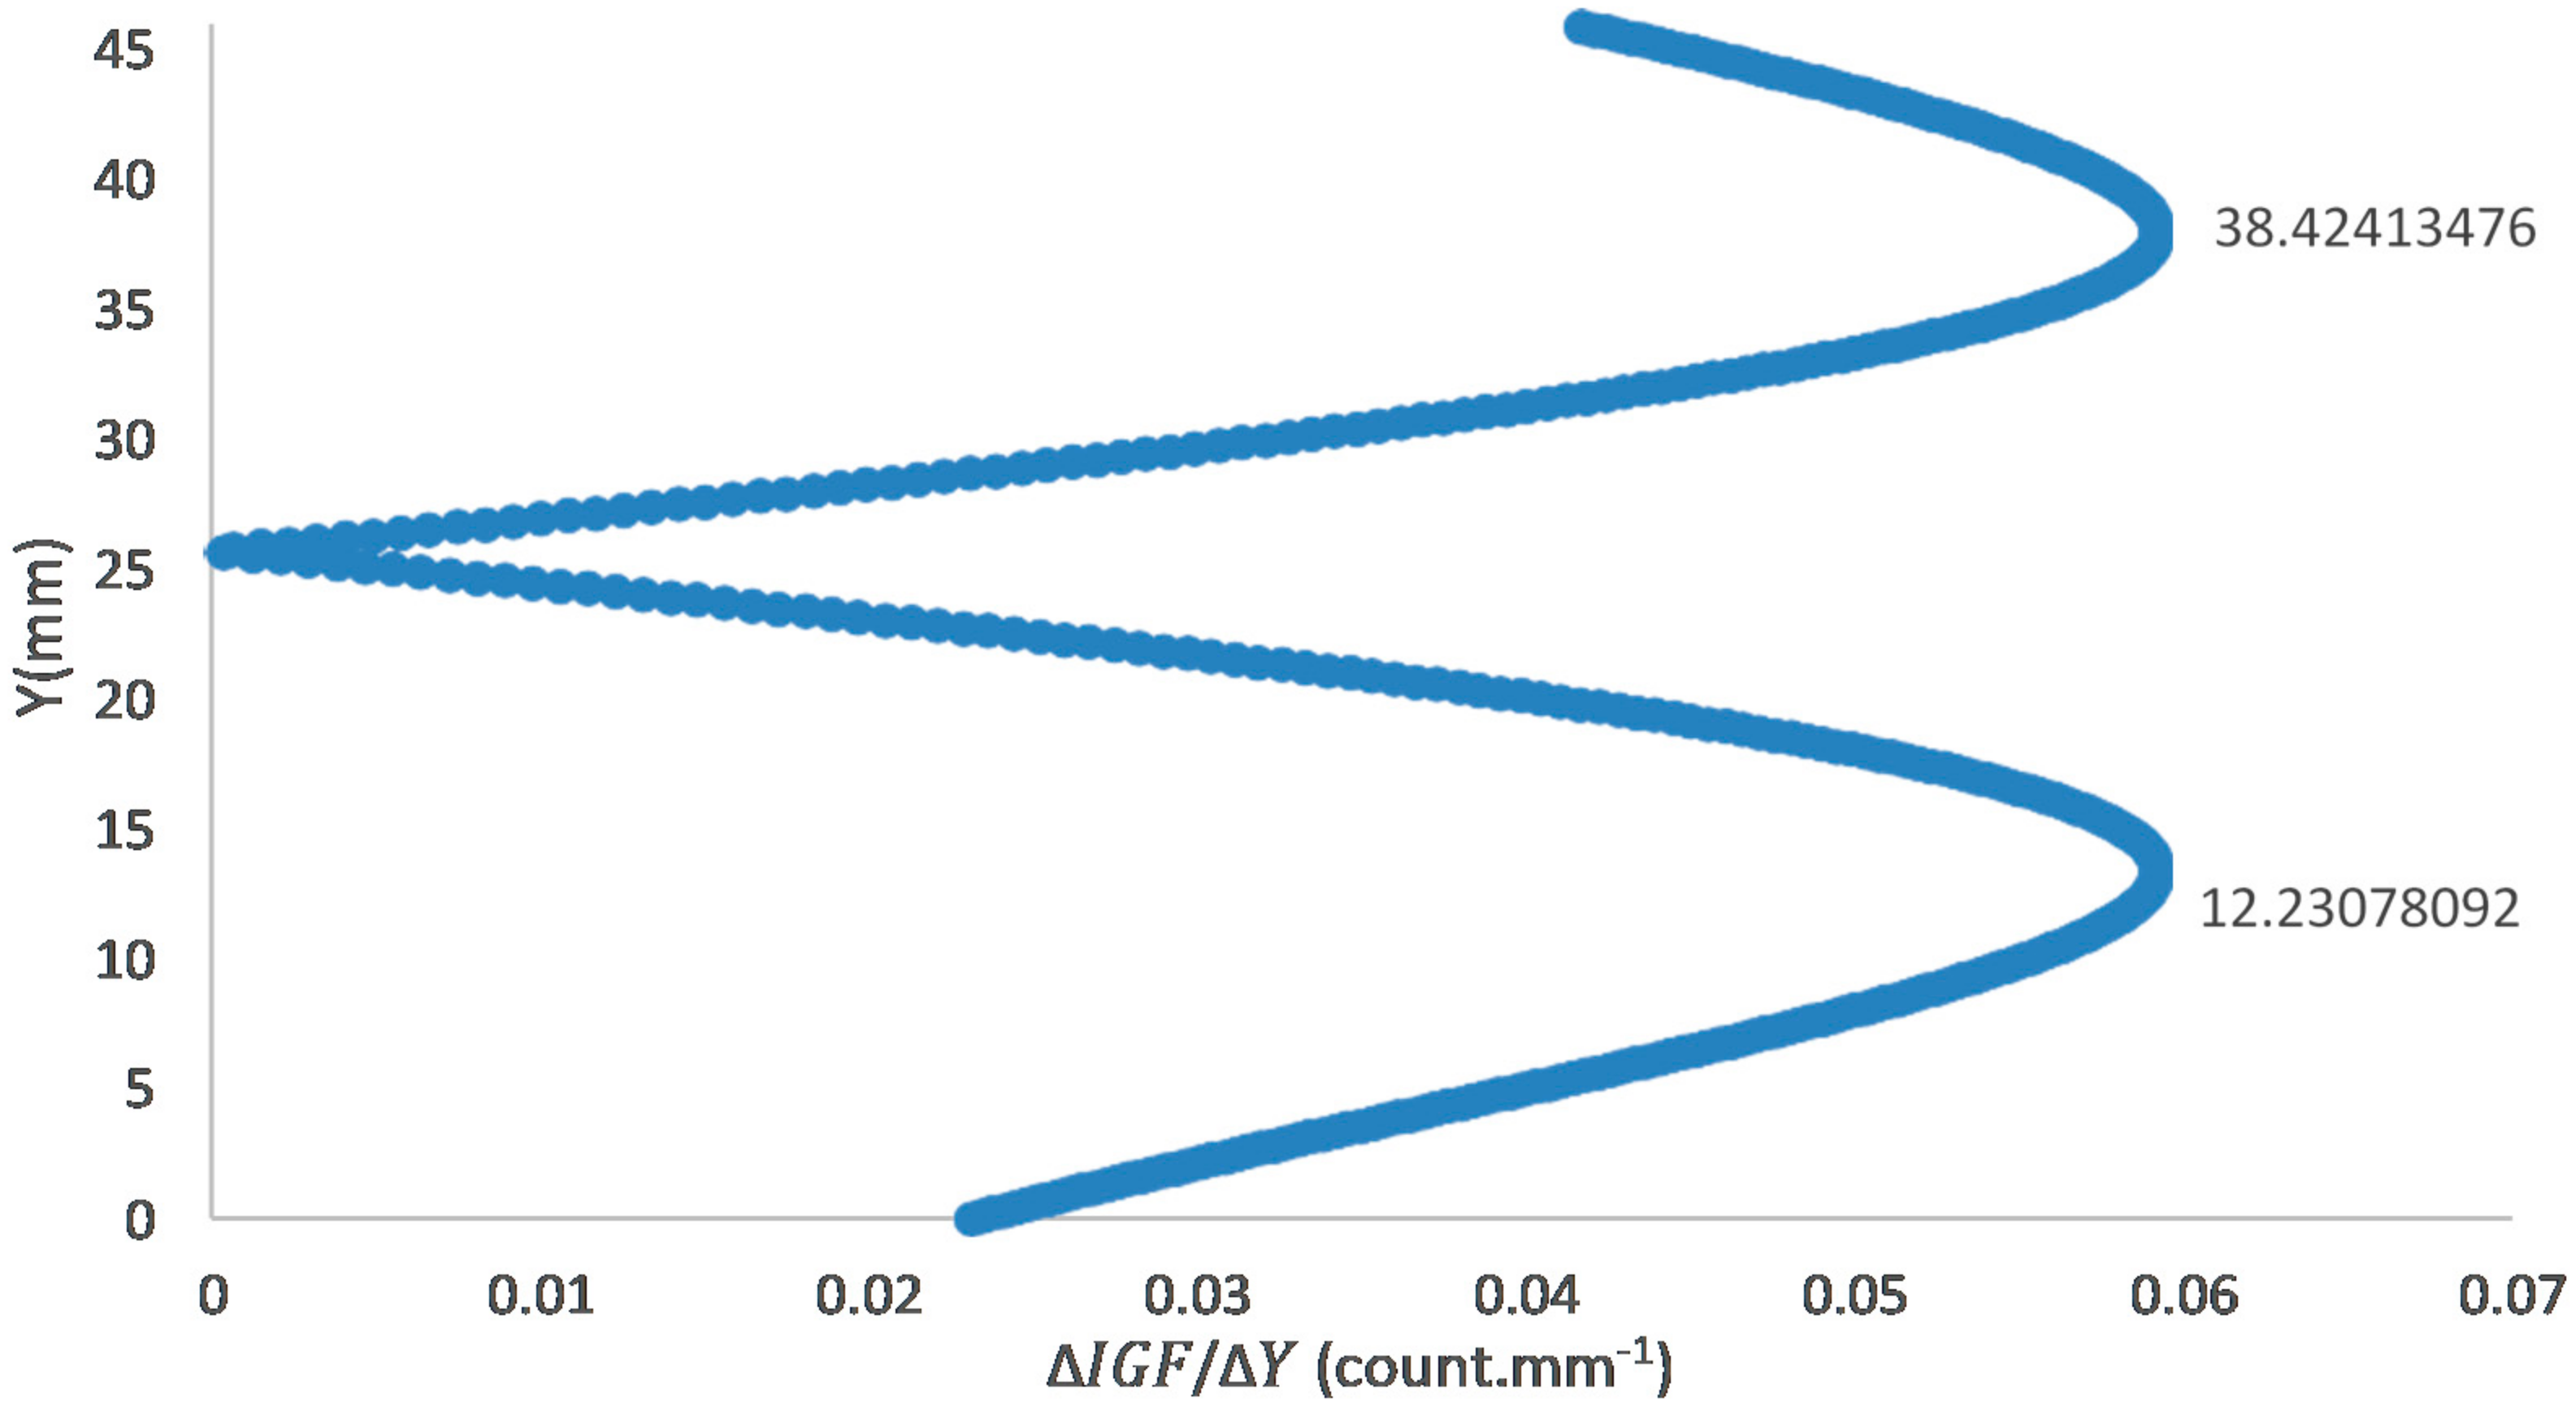
The Gaussian fit is utilized for laser sheet profiles because it provides a statistically symmetric representation of averaged sheet intensity with significant fluctuating components [20,23]. The absolute gradient and the Gaussian fit were plotted, as shown in Figure 3B and Figure 5, respectively.

Figure 5.
Absolute gradient of the Laser sheet Gaussian fit.
2.5. Damköhler Number and Borghi Analyses
Once the main features of a flame were obtained, Damköhler numbers and Borghi regime diagrams were plotted. Damköhler number is a parameter that describes the turbulence-chemistry interaction by correlating the characteristic flow time to the characteristic chemical time. Typically, the characteristic flow time is defined by the integral time scale (). In fact, Da is described as the ratio between and , Equation (12) [26]. is described as the time during which a particle is influenced by its previous position [21].
For, is shorter than, which corresponds to a fast chemical reaction that occurs in a thin layer [21]. This implies that the flame can be assumed to be “thin” and can be identified as a laminar flame, called a “flamelet” [21,27].
However, a more specific and numeric definition to describe a non-premixed flame is provided by [21], Equation (13).
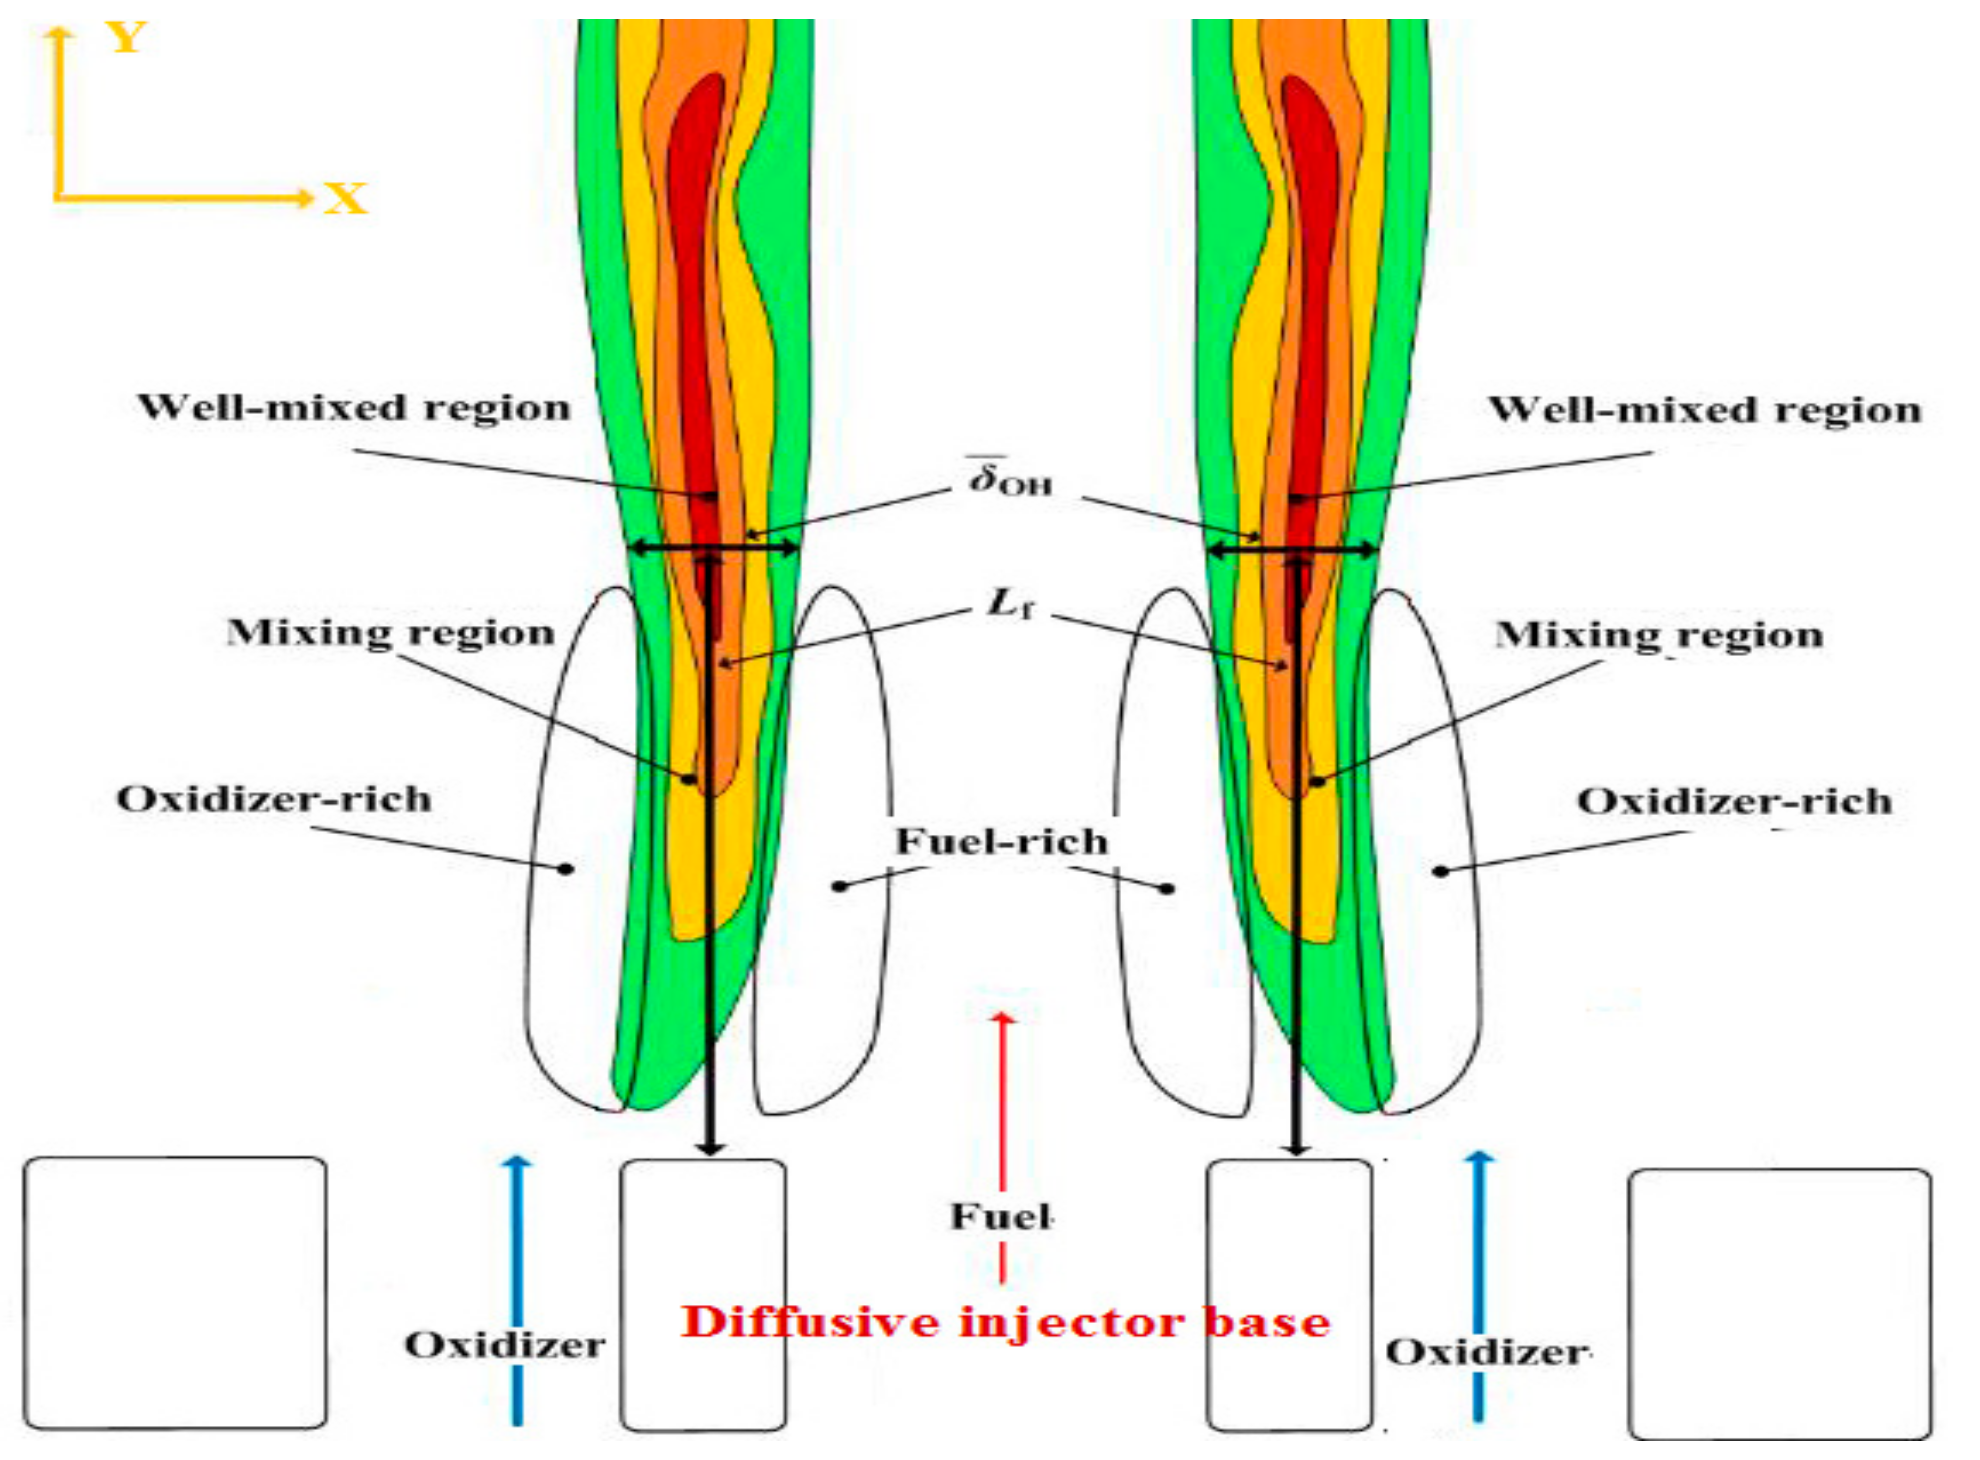
Figure 6 provides visual definitions of the parameters (: the flame base location where the maximum OH intensity is found and : flame brush thickness), which were used to perform the Damköhler analyses, Section 3.2. On the other hand, while estimating the area of the highest heat intensity did not contribute to performing the Damköhler analyses, it did provide an additional characterization of the flame geometry as detailed in Section 3.1.

Figure 6.
Schematic representation of the flame reproduced from [21].
is the injection velocity (velocity of fuel at the diffusive injector outlet) in mm/s. It can be measured for 1 L/min at the diffusive injector outlet area (1.96 × 10⁻⁵ m2) using Equation (7). The corresponding is 1.7 m/s. is numerically described for a non-premixed flame by [21], Equation (14).
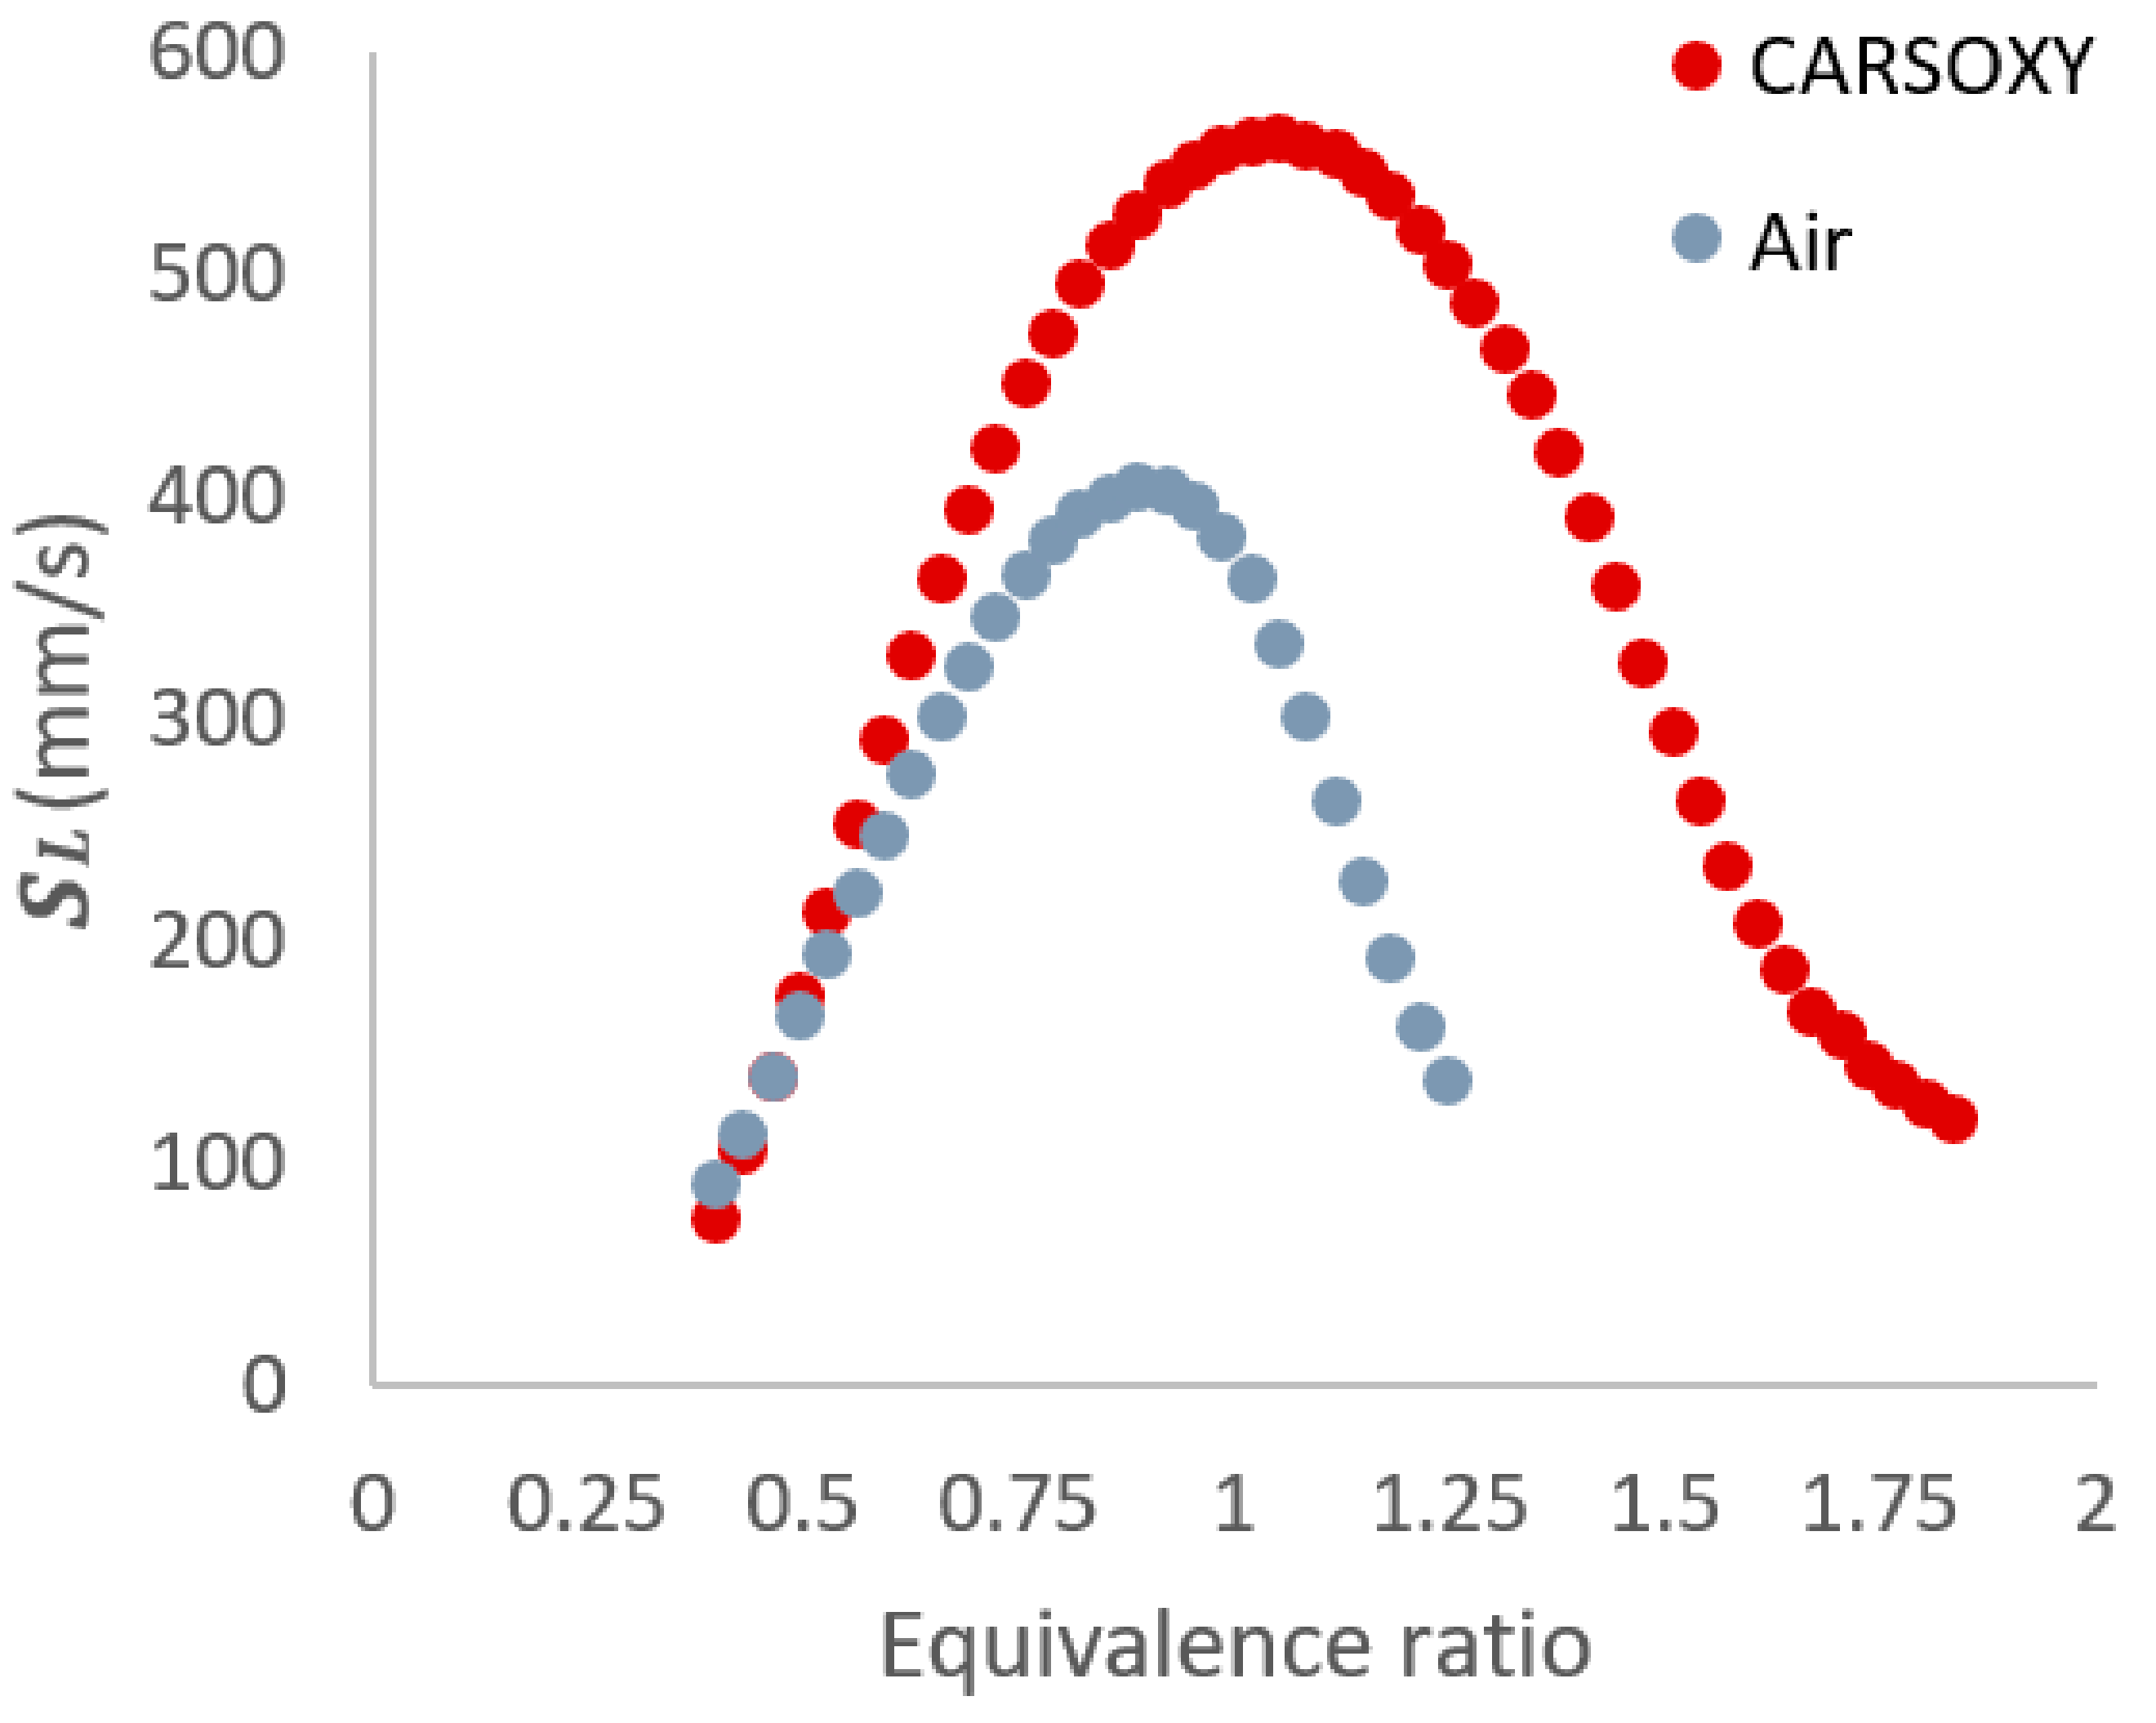
Finally, in a similar manner to the approach suggested by [21], the laminar burning velocity (the speed at which a laminar combustion wave propagates relative to the unburned gas mixture) at the stoichiometric condition (560 mm/s and 399 mm/s for CO2-Ar-O2/CH4 and CH4/air flames, respectively) was obtained using the CHEMKIN package of the ANSYS software. The ‘GRI-Mech 3.0’ mechanism was applied to the built-in ‘Flame speed freely propagating’ sample to obtain. Figure 7 shows for a CH4/air flame and a CH4/CO2-Ar-O2 flame at a range of equivalence ratios. As far as the flame speed is concerned (the only parameter obtained from GRI-Mech 3.0 and used in this paper), its prediction was validated for oxyfuel combustion as reported by [28]. In addition, other studies [29,30,31,32] have used GRI-MECH 3.0 to predict laminar flame speed. Therefore, following the approaches adopted in those studies [31,32,33] on oxyfuel combustion, the GRI-Mech 3.0 has been adopted for this study. In addition, the results of the laminar flame speed corresponded to the operability limits that were studied in a previous study [33] using the same specified parameters (i.e., within the equivalence ratios of 0.4–1.25 and 0.4–1.84 for the CH4/air and CH4/CO2-Ar-O2 flames, respectively).

Figure 7.
for a CH4/air flame and a CH4/CO2-Ar-O2 flame at a range of equivalence ratios.
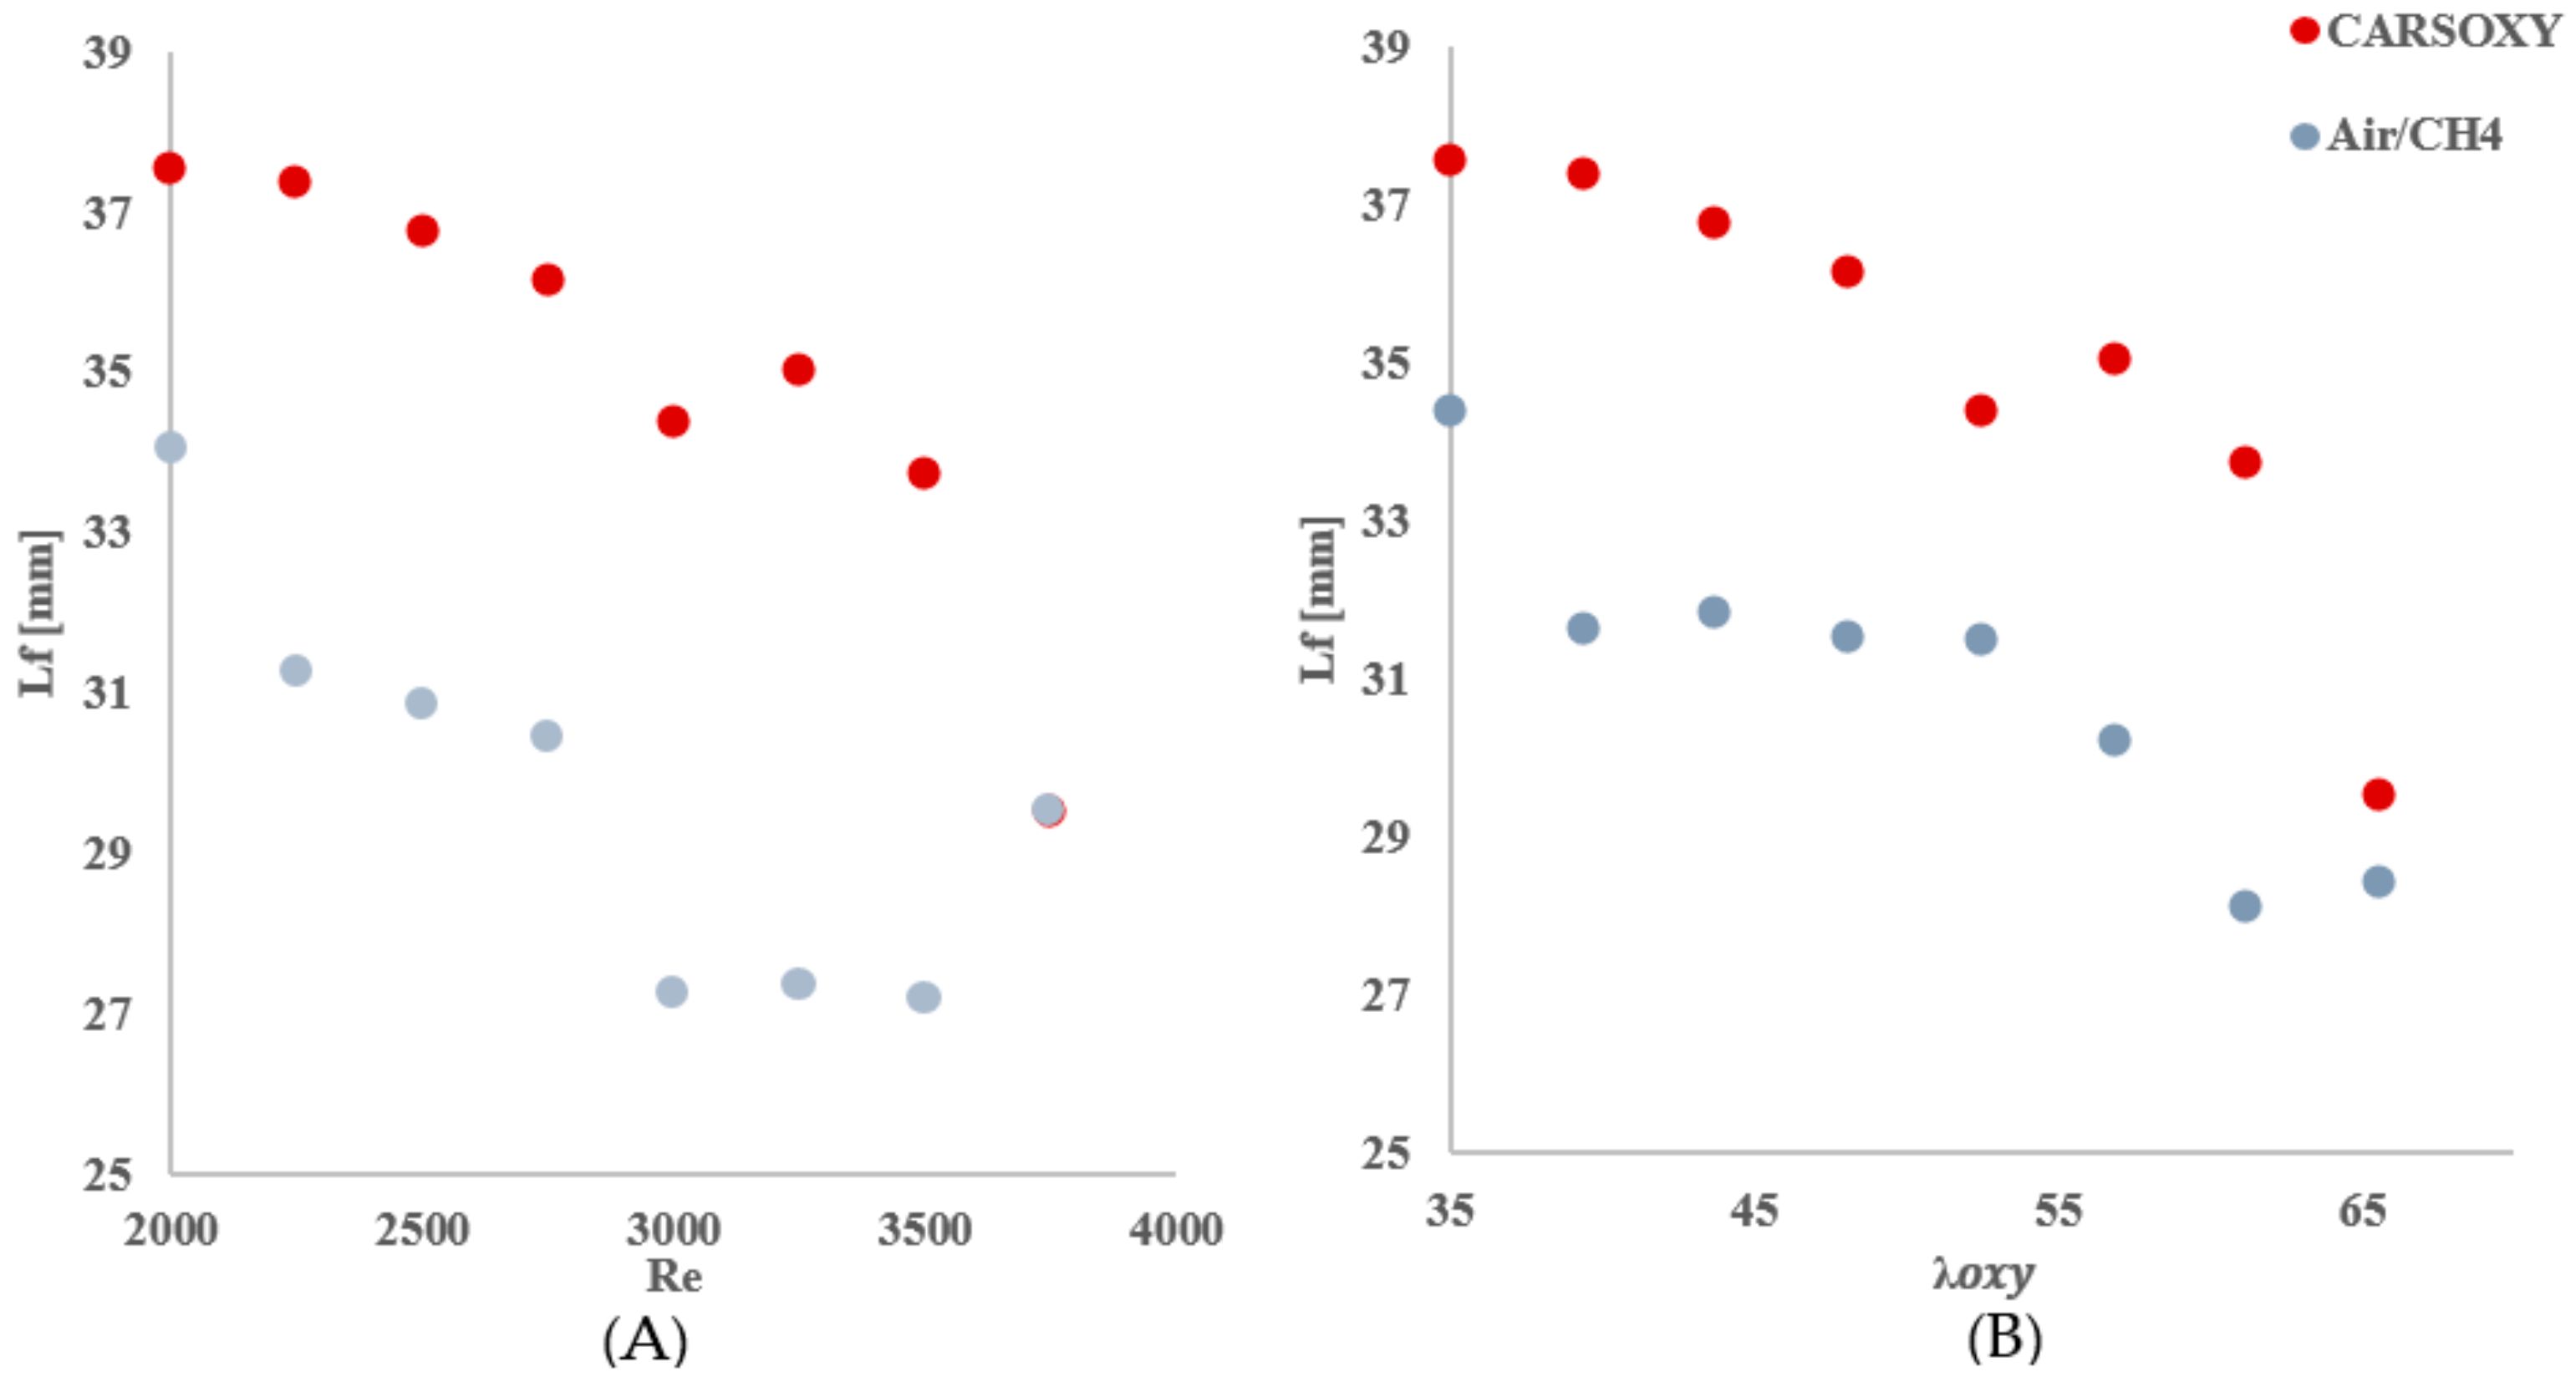
As mentioned in Section 2.4, the center of the highest heat intensity () was measured. However, the significance of those results—Table 4, Figure 8—is not necessarily to distinguish CARSOXY flame from the CH4/air flame. Instead, those results are used to highlight the effects of increasing the working fluid velocity (increasing the Reynolds number or ) on the and , thus justifying the modified versions of the Damköhler number and Borghi regime diagram, which take into account the working fluid velocity , as discussed in Section 2.6.
Table 4.
over (A: working fluid at ) and (B:).
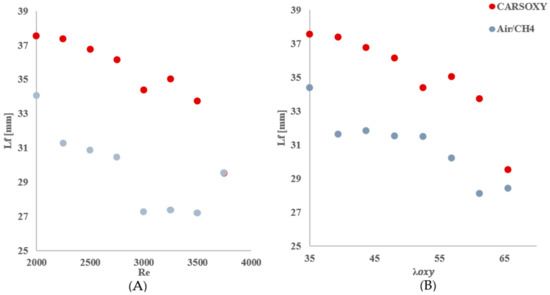
Figure 8.
over (A) working fluid at and (B) .
2.6. Modified Damköhler Number and Borghi Regime Diagram
This paper’s novelty is based on suggesting a modified formula of the Damköhler number based on experimental observations. The authors of [21] defined the characteristic flow time as the ratio of the to , as it was observed that decreases with increasing, Equation (15).
The same behavior of was also observed in this study when increasing the working fluid velocity (increasing the Reynolds number). Therefore, this paper suggests modifying to, Equation (16). The proposed Equation of was obtained using the Buckingham π theorem [27]. Similarly, the relative velocity was adjusted to to modify the Borghi diagram.
The authors of [21] defined the characteristic flow time as the ratio of the to as it was observed that decreases with increasing. The same behavior of was also observed in this study when increasing the working fluid velocity (increasing the Reynolds number), Figure 9 and Table 4.

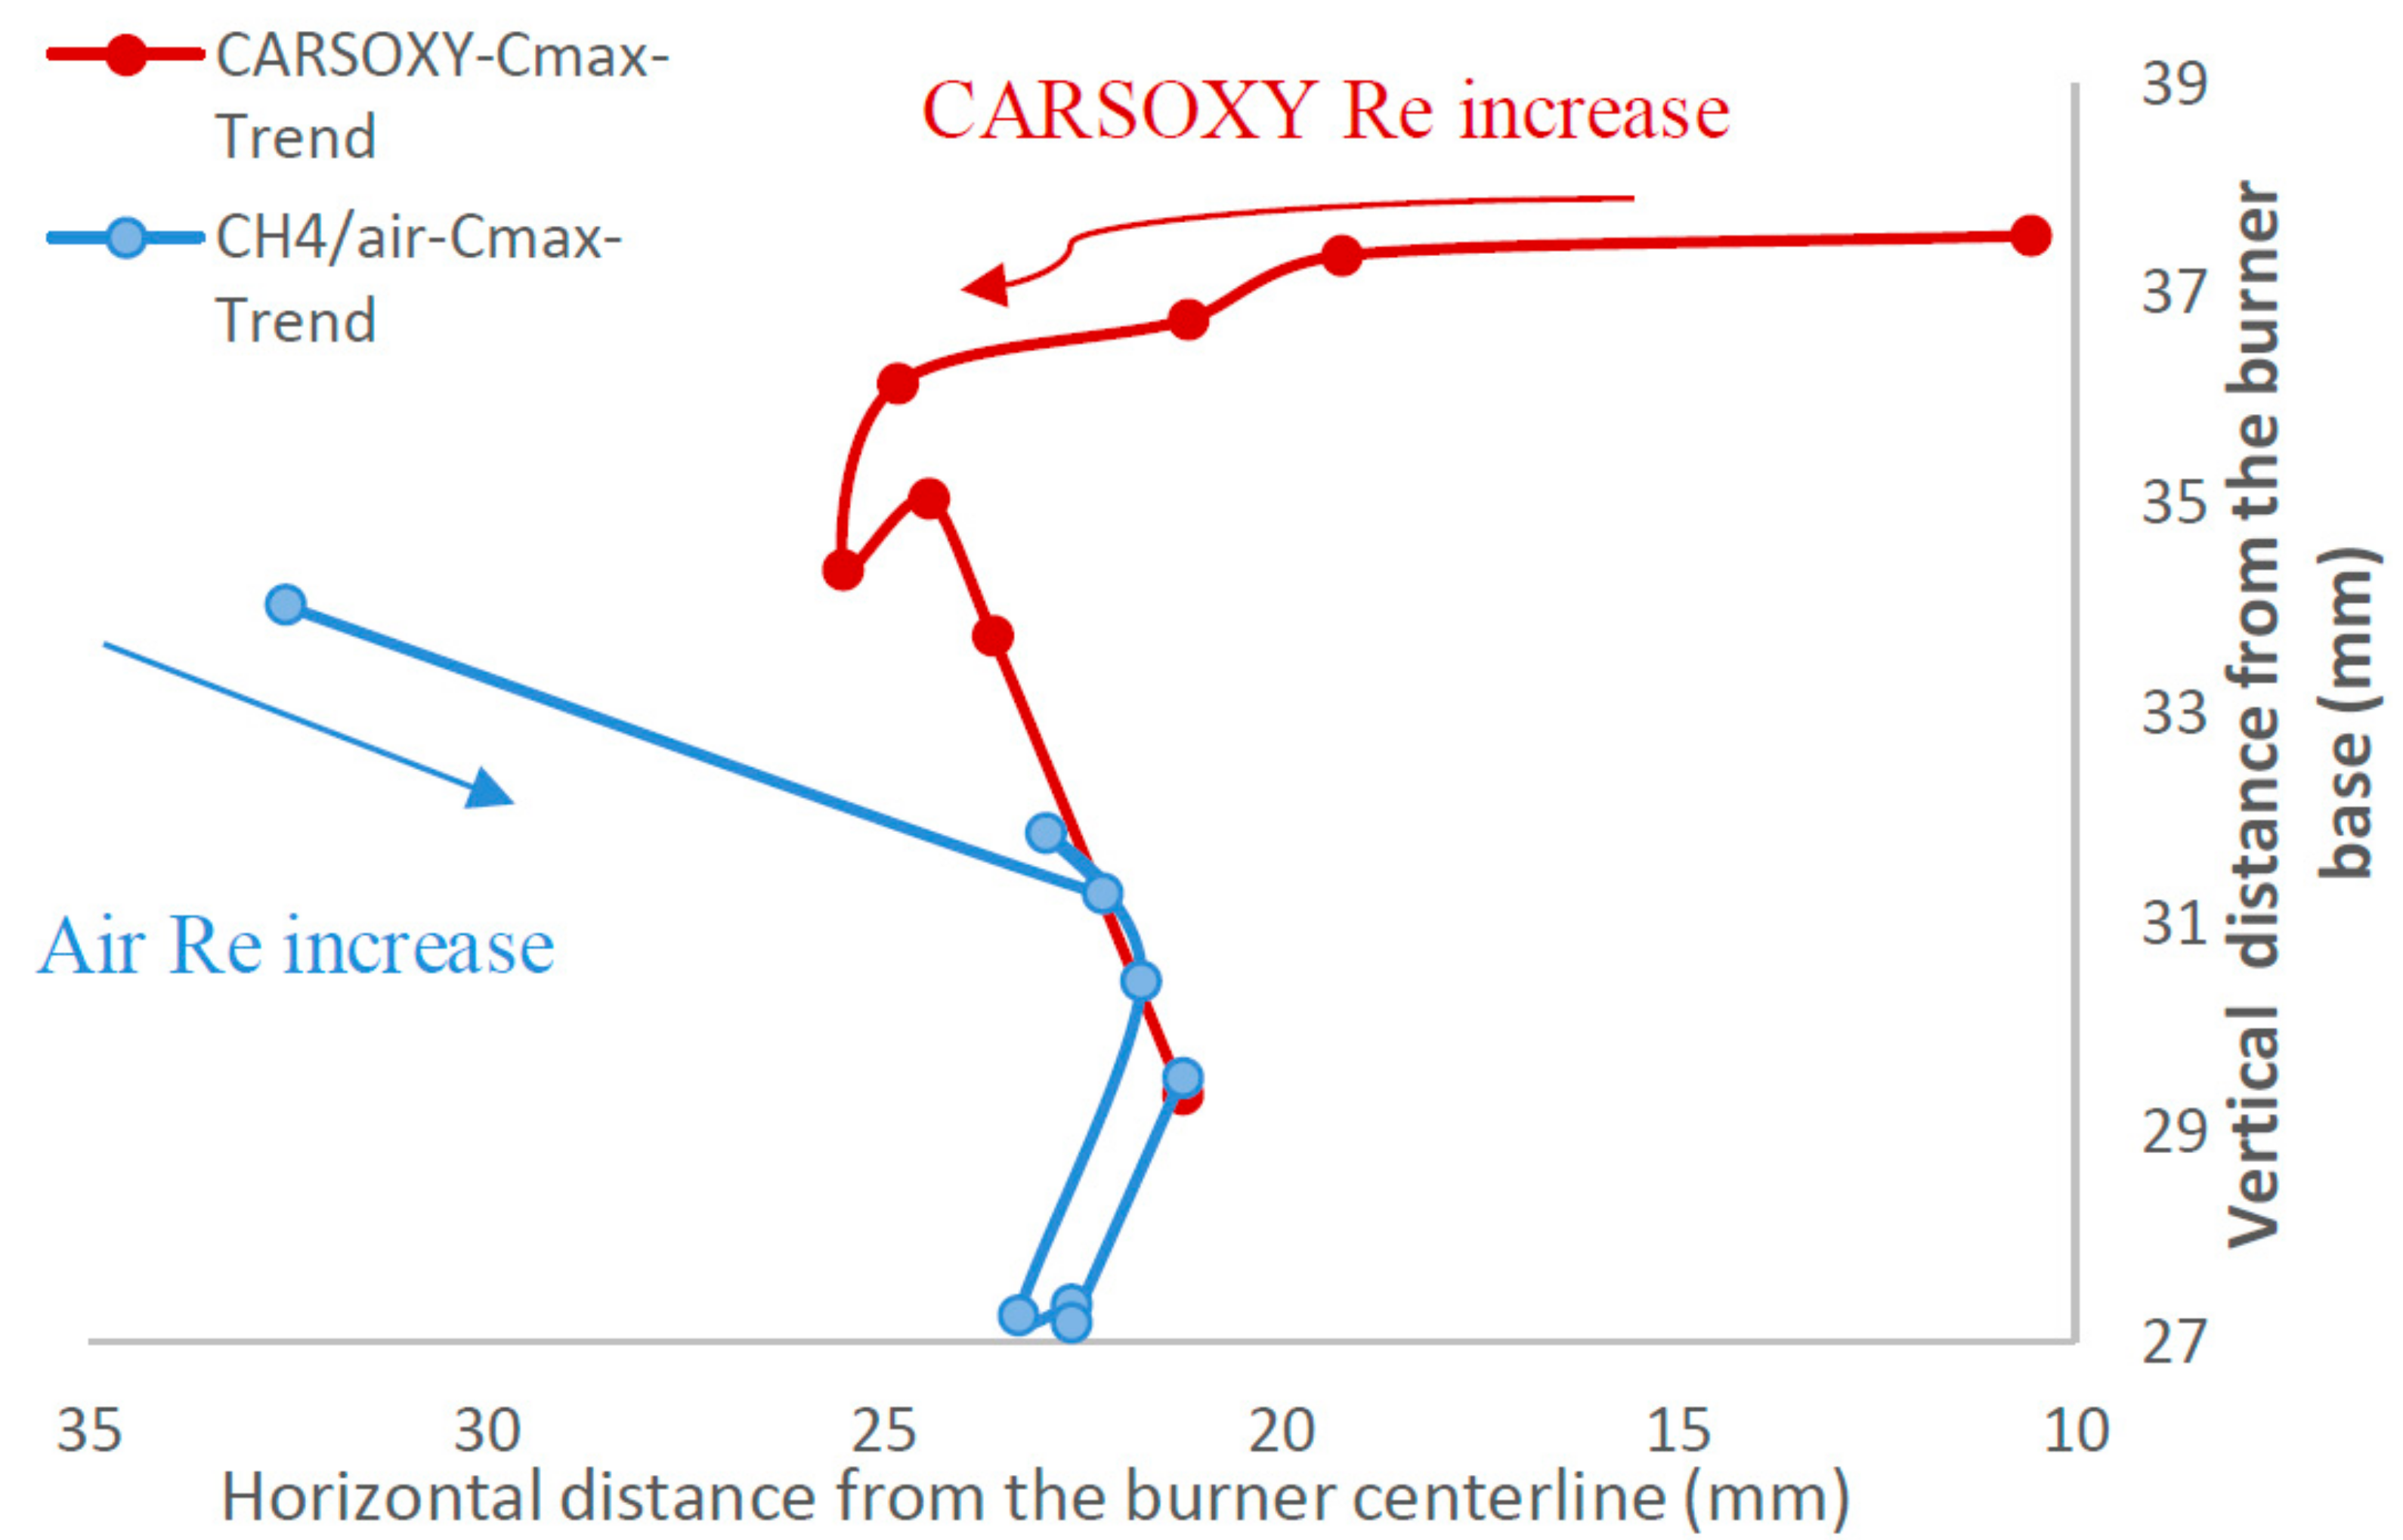
Figure 9.
at constant working fluid Reynolds numbers [2000–3750] and of 1 L/min Reynolds numbers [2000–3750] and of 1 L/min.
The fuel injection flow rate was maintained constant (of 1 L/min), and thus was constant. This implies that any increase in is only due to an increase in . Similarly, [21] defined as the ratio of flame brush thickness at the highest heat intensity location to the laminar flame speed () at the stoichiometric condition. However, the experiment was conducted at constant pressures and temperatures, and thus the stoichiometric was constant. This implies that any increase in is only due to an increase in . Therefore, based on the definitions from [21] of andand the specific setup of the experiment, patterns are only correlated to and . As a result, Da increases (the flame becomes more laminar) if and/or increases and/or decreases, respectively. Therefore, this paper suggests modifying to. The proposed Equation of was obtained using the Buckingham π theorem [27]. Similarly, the relative velocity was adjusted to to modify the Borghi diagram. Those results in Figure 9 and Table 4 are used to highlight the effects of increasing the working fluid velocity (increasing the Reynolds number or ) on the and , thus justifying the modified versions of the Damköhler number and Borghi regime diagram, which take into account the working fluid velocity .
3. Results
3.1. OH Trends
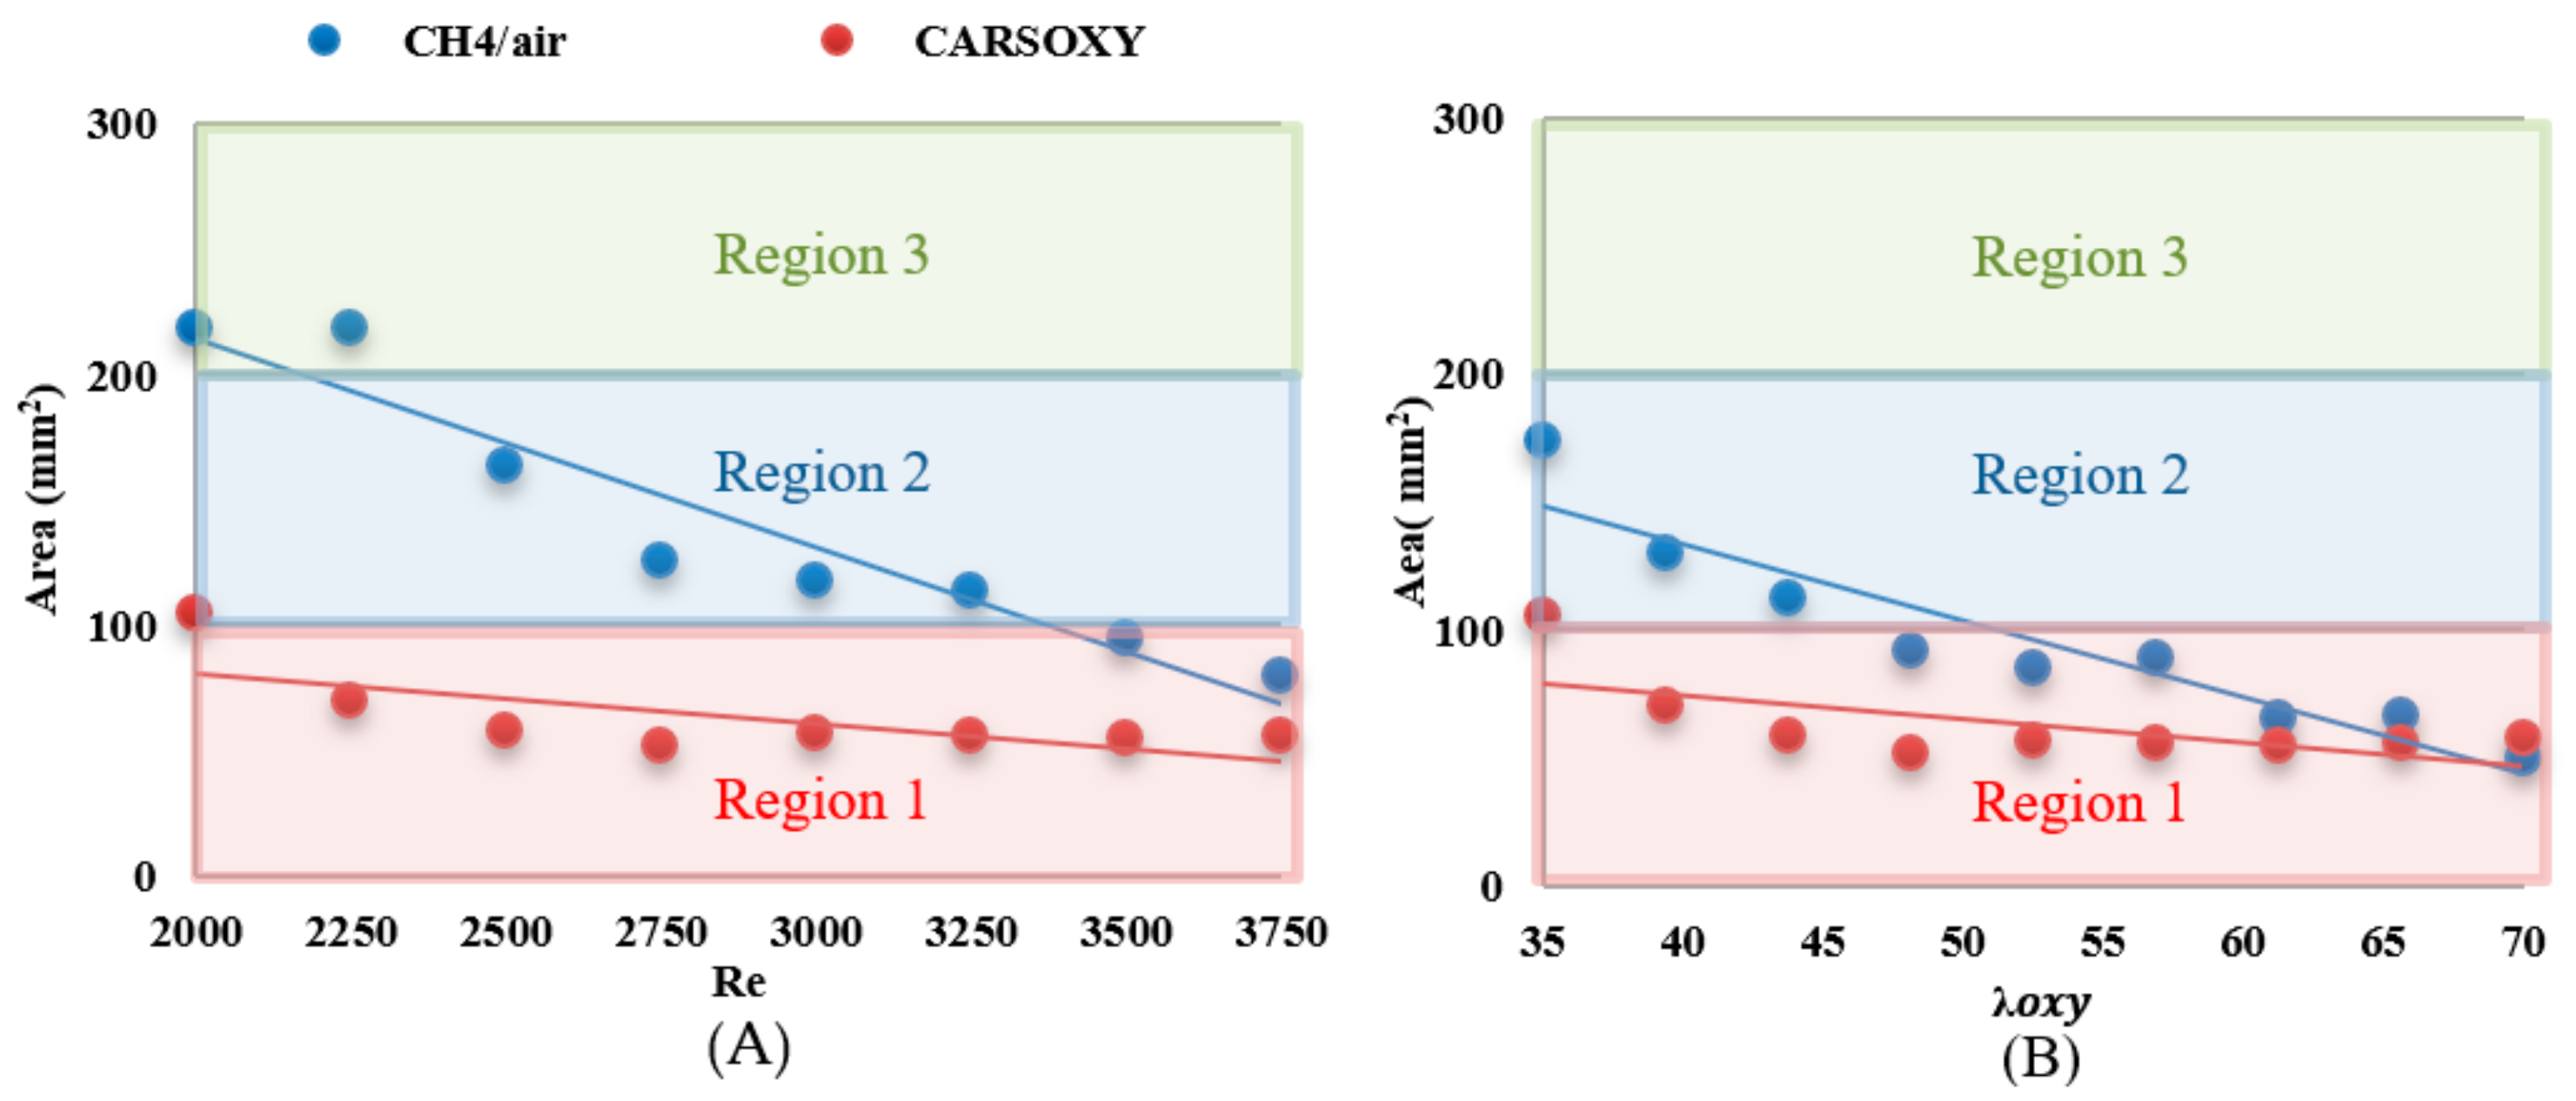
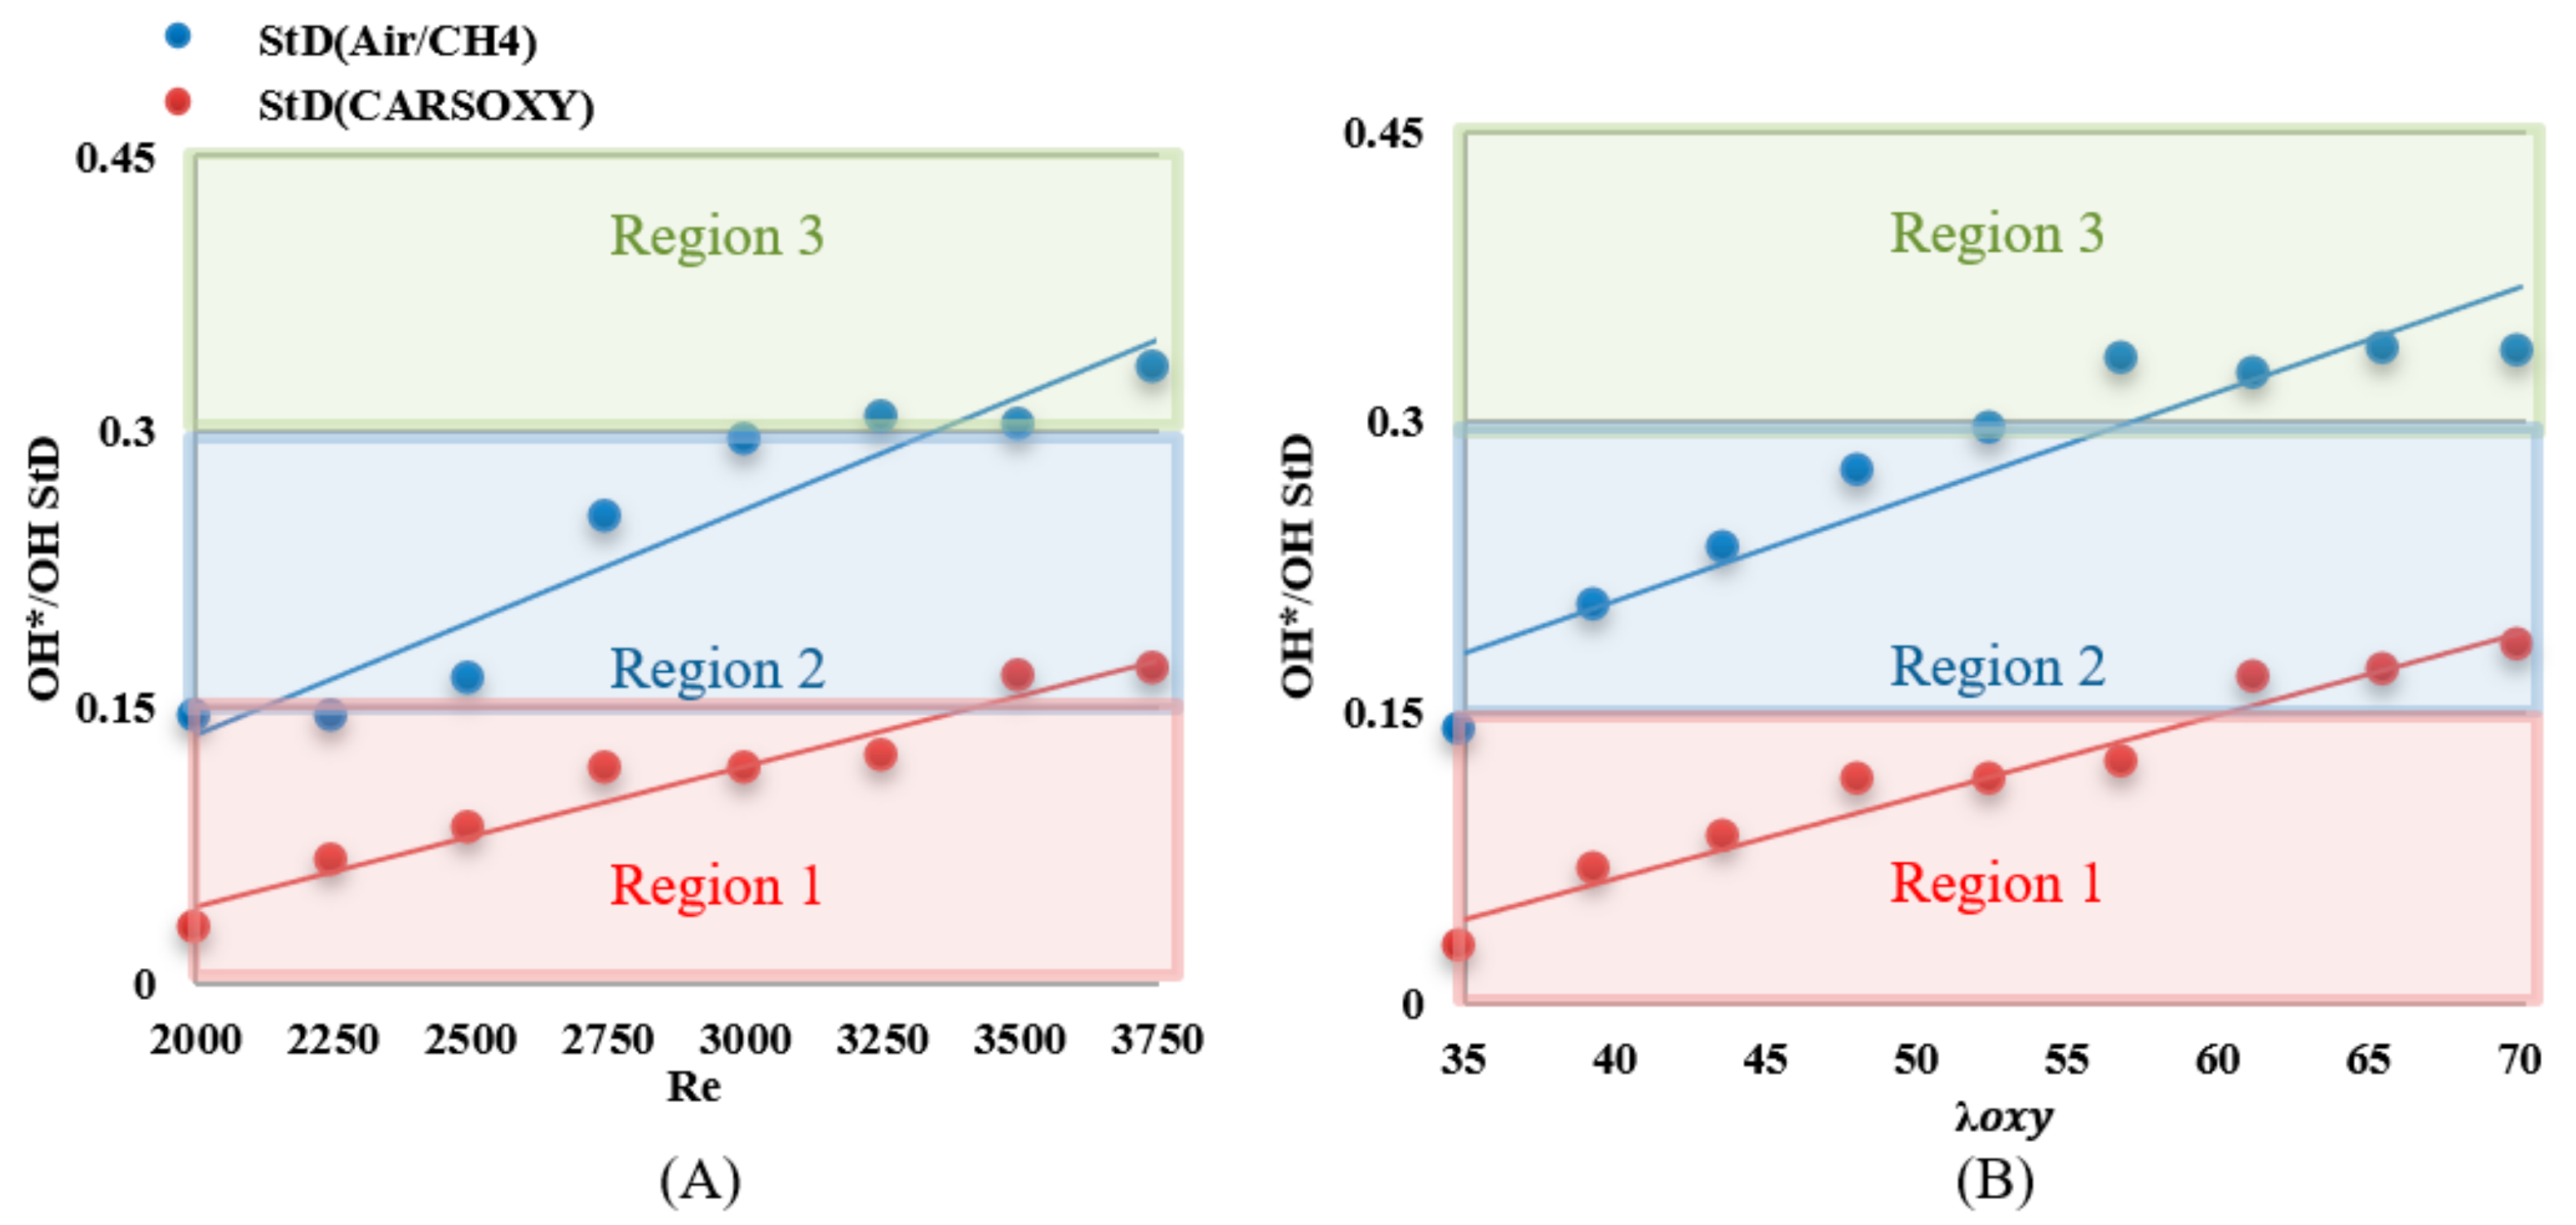
The results were limited by the [0–0.45] interval. This interval was divided into three equally spaced regions (i.e., region 1: [0–0.15], region 2: [0.15–0.3], and region 3: [0.3–0.45]). Regions 1, 2, and 3 represent low, average, and high heat release fluctuation compared to the other recorded datapoint, respectively. Figure 10A shows the standard deviation () of the heat release fluctuations () over the working fluid Reynolds number interval of [2000–3750] at of 1 L/min. As a datapoint transfer from region 1, which is limited by the interval of [0–0.15] to 3, it represents an increase in heat release fluctuation. Those of the CARSOXY flames were mainly focused in region 1 while concentrated in region 2 for CH4/air, indicating a more stable heat release trend for CARSOXY than CH4/air.
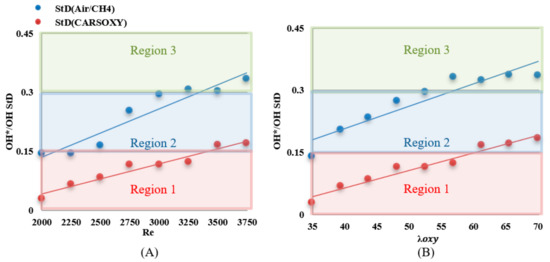
Figure 10.
of CARSOXY and CH4/air over (A) working fluid at and (B) .
CARSOXY and CH4/air flames’ tendency to approach higher regions (i.e., region 2 and 3, respectively) has increased compared to those trends over the working fluid Reynolds number interval. The fluctuations increased for high reynolds number and equivalence ratio for both flames.
As the Reynolds number of the working fluid increases, the working fluid velocity increases. The reduction in the area size in both flames is directly caused by the substantial increase in turbulence due to the increased working fluid velocity, allowing a higher mixing level between fuel and the working fluid. Thus, reducing the available time for reactant particles to spread, and reducing the area of the highest intensity. These findings agree well with other similar studies [31].
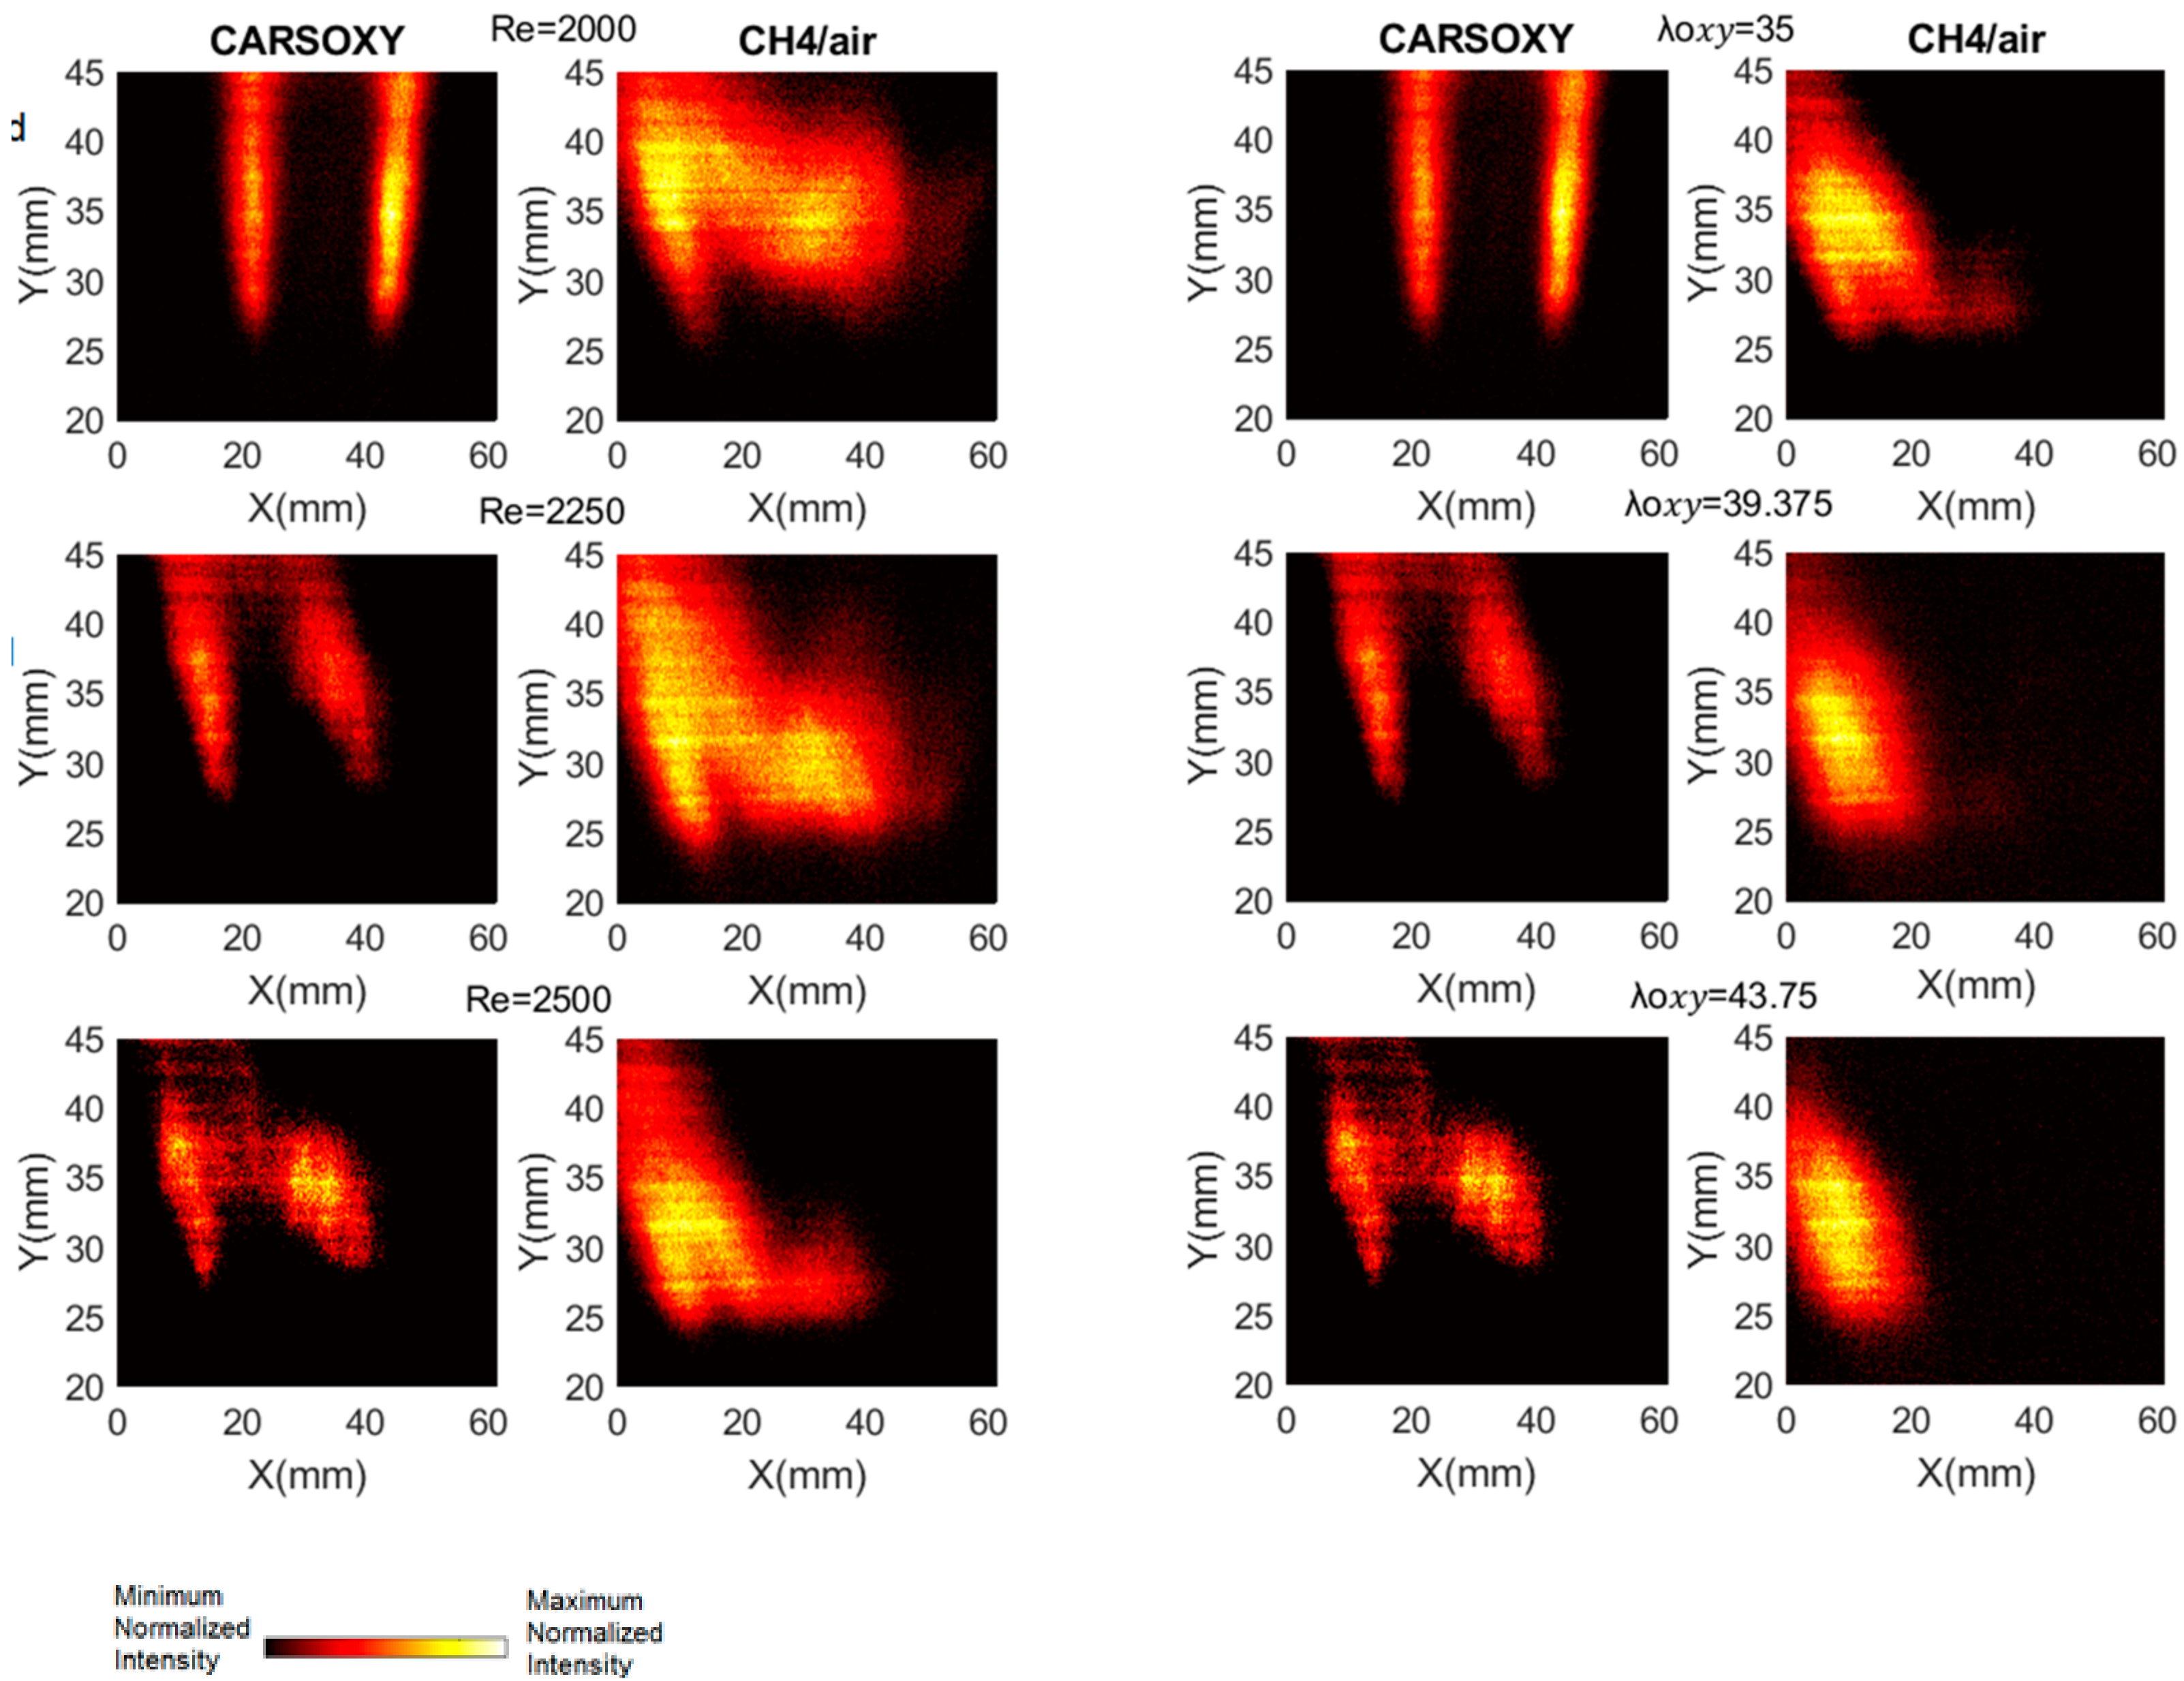
As discussed in Section 2, the results of the PLIF images of the area of the highest heat intensity were obtained for laser energy shot-to-shot and laser-sheet corrected images. Figure 7B and Figure 11A show sample cases at Reynolds numbers (i.e., 2000–2750) and at (i.e., 35–43.75), respectively. The results of the entire and intervals are summarized in Figure 3A and Figure 6B.
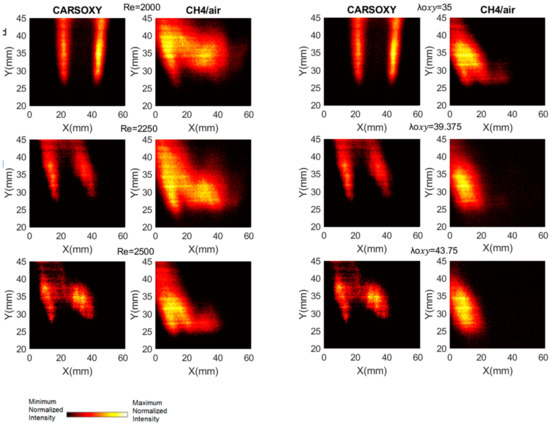
Figure 11.
PLIF sample images at (left-hand side) working fluid at and (Right-hand side) . The flame centerline is located at x = 30 mm. The corresponding chemiluminescence images are shown in Appendix A.
The results were limited by the [0–300] mm interval. This interval was divided into three equally spaced regions (i.e., region 1: [0–100] mm, region 2: [100–200], and region 3: [200–300]). Regions 1, 2, and 3 represent low, average, and high compared to the other recorded datapoint, respectively. As the datapoint transfers from region 1 to 3, it represents an increase in the highest heat intensity area. For those of the CARSOXY, flames were mainly focused in region 1, while concentrated in region 2 for CH4/air, indicating a more condensed area of highest heat intensity for CARSOXY compared to CH4/air. Remarkably, as the increases—Figure 3A—the difference in between both flames decreases (i.e., at , of CARSOXY is only 70% of that of CH4/air). The pattern for in Figure 3B approximately followed the same pattern as those at constant.
Nevertheless, as the working fluid flow rate increases (i.e.), of the CH4/air flame is less than that of the CARSOXY flame. However, as has been experimentally observed, further reduction in the of the CH4/air flame is only anticipated up to the of 85, since the flame blows out at this limit while the CARSOXY flame blows out at higher limits; thus can be further reduced.
As reported in similar studies [32], flame symmetry is dependent on the choice of the mass flux of fuel and the equivalence ratio. Thus, ensuring symmetric flames within diffusive flames is achieved by identifying the corresponding experimental matrix. However, within the chosen experimental matrix (Table 3), which was selected to perform a comparative analysis between CARSOXY and CH4/air over working fluid at and, the loss of flame symmetry occurred. In addition, the confinement top was open to the atmosphere, possibly allowing external turbulence, thus causing the loss of flame symmetry. However, as the scope of this study is to characterize CARSOXY performance through Borghi diagrams in comparison to CH4/air within the conditions specified in Table 3, future studies will be necessary to ensure flame symmetry.
3.2. Damköhler Numbers and Combustion Diagrams
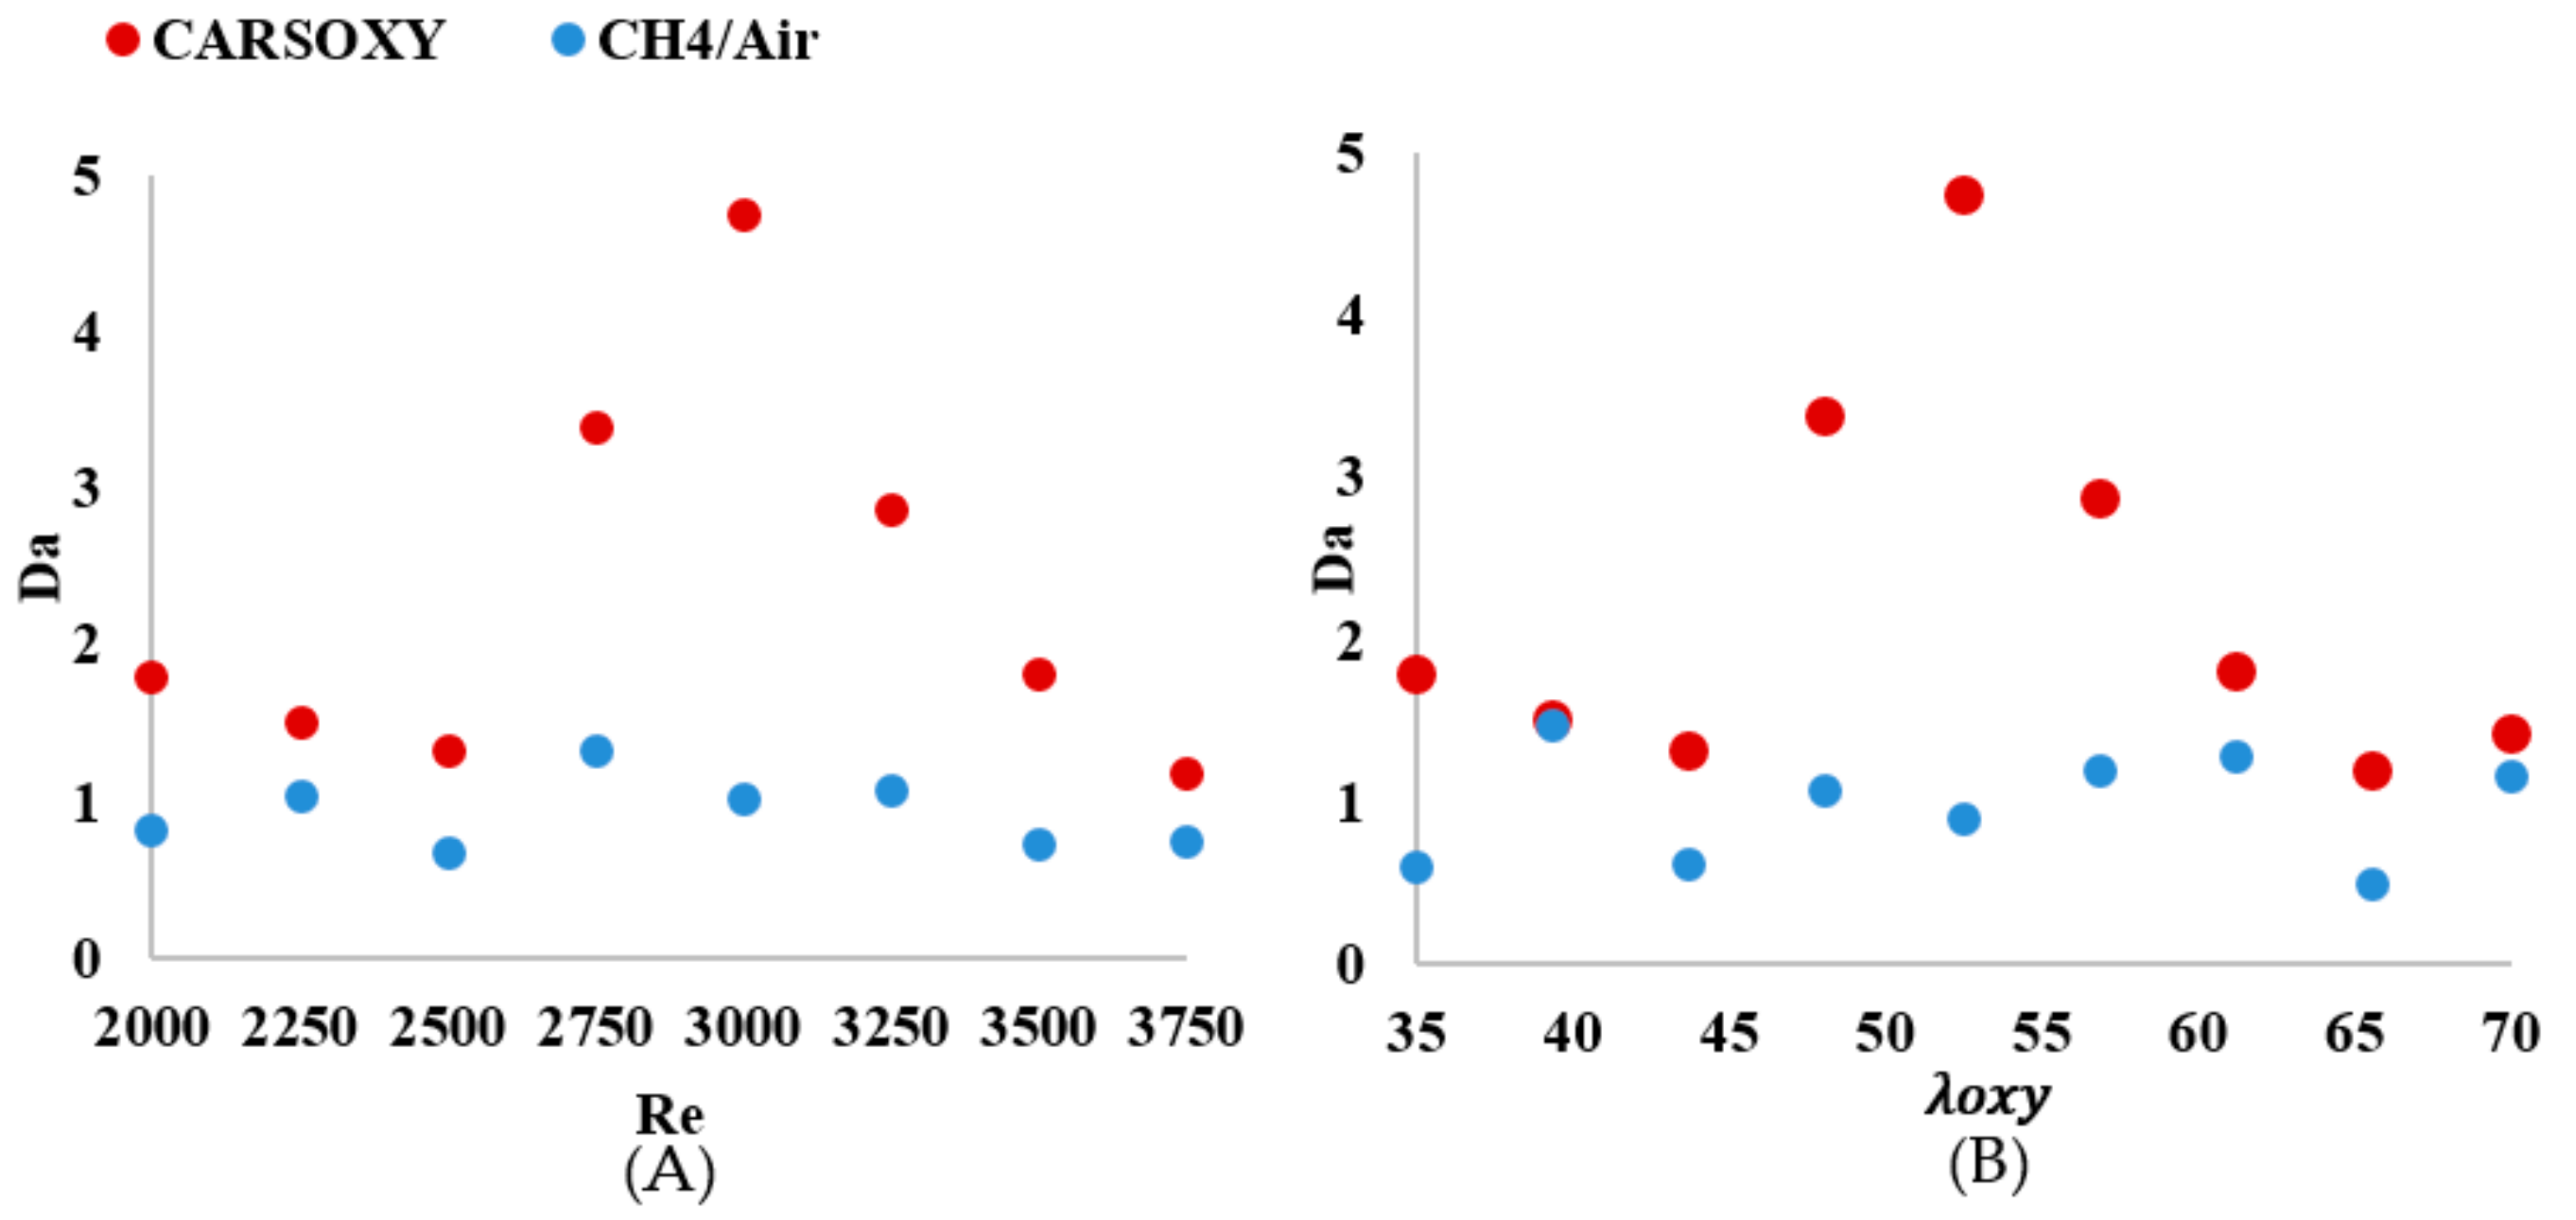
As shown in Figure 12A, the of the CARSOXY is greater than one in all conditions, indicating thin uniform flames throughout the interval ([2000–3750]). This indicates that the rate of chemical reaction is faster than characteristic flow velocity. At, the CARSOXY flame showed the greatest . However, the rapidly decreases beyond (i.e., at ). On the other hand, the of the CH4/air flame was lower than that of the CARSOXY flame. In fact, at , and 3750, . The greatest combustion condition of the CH4/air flame was identified at , where. The patterns for the increase in—Figure 12B—generally followed the same behavior as in Figure 12A. However, at certain conditions (i.e., = 35, 43.75, and 65.625), the of the CH4/air flame was significantly low (i.e.).
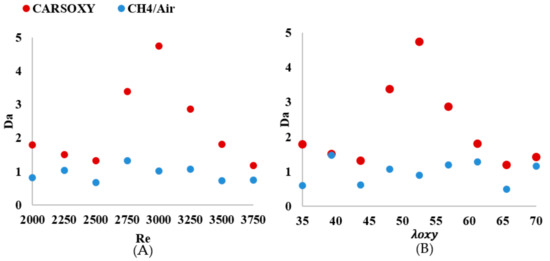
Figure 12.
number over (A) working fluid at and (B) .
A regime diagram was plotted with axes of the relative velocity () versus the relative length scale () based on the Borghi proposal [33]. As suggested by [21], the Borghi diagram for non-premixed flames can be divided into two regions, i.e., a concentrated reaction zone and a broken reaction zone. As the relative length scale decreases and/or the relative velocity increases, the flame exhibits a more broken reaction zone. Similarly, as the relative length scale increases and/or the relative velocity decreases, the flame exhibits a more concentrated reaction zone.
As discussed in Section 2, each flame type (CARSOXY and CH4/air) has its own laminar speed at stoichiometric conditions (i.e., = 559.2 mm/s and 398.837 mm/s for CO2-Ar-O2/CH4 and CH4/air flames, respectively). Since of the CARSOXY flame is higher than that of the CH4/air flame, the relative velocity of the CARSOXY flame was lower than of CH4/air. This shifted the CARSOXY data points below those for CH4/air and towards the concentrated reaction zone in the Borghi diagram, which was plotted for CARSOXY and CH4/flames at constant [2000–3750] and of 1 L/min (Figure 13A). Nevertheless, the CARSOXY flame also approached the concentrated reaction zone at high relative length scales (i.e., at = 3000, 3250, and 2750). The relative length scale to the relative velocity ratio patterns for the increase in —Figure 13B—generally followed the same behavior as those for the increase in the Reynolds number in Figure 13A. At, both the CH4/air and CARSOXY flames exhibit the highest tendency to approach the broken reaction zone.
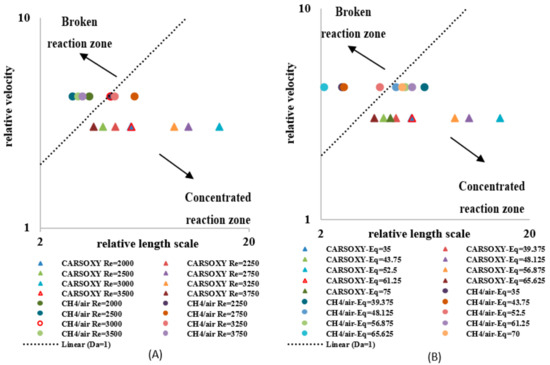
Figure 13.
Borghi regime for (A) working fluid at and (B) . The segmentation of this figure follows the Borghi combustion regime [33] convention, in which the broken and connected reaction zones are separated by the Da = 1 line.
As investigated in earlier studies [21], the latter trend appears to be observed due to a chemical reaction time that is much shorter than the mixing time (i.e., fast chemistry) for Da > 1. Thus, the flame reaction layer is assumed to be thinner than the diffusion layer, implying that even the smallest mixing length scale does not affect the structure of the thin reaction layer [21]. Thus, the flame can be assumed to be very thin, and it can be identified as a laminar flame element, called a flamelet. As highlighted by a previous study [34], the increase in Da with increasing Re is observed due to the fast chemistry (as shown in Figure 7), while the decrease in Da with increasing Re is due to reduction in mixing time since the turbulent intensity and scalar dissipation rate increase with increasing Re.
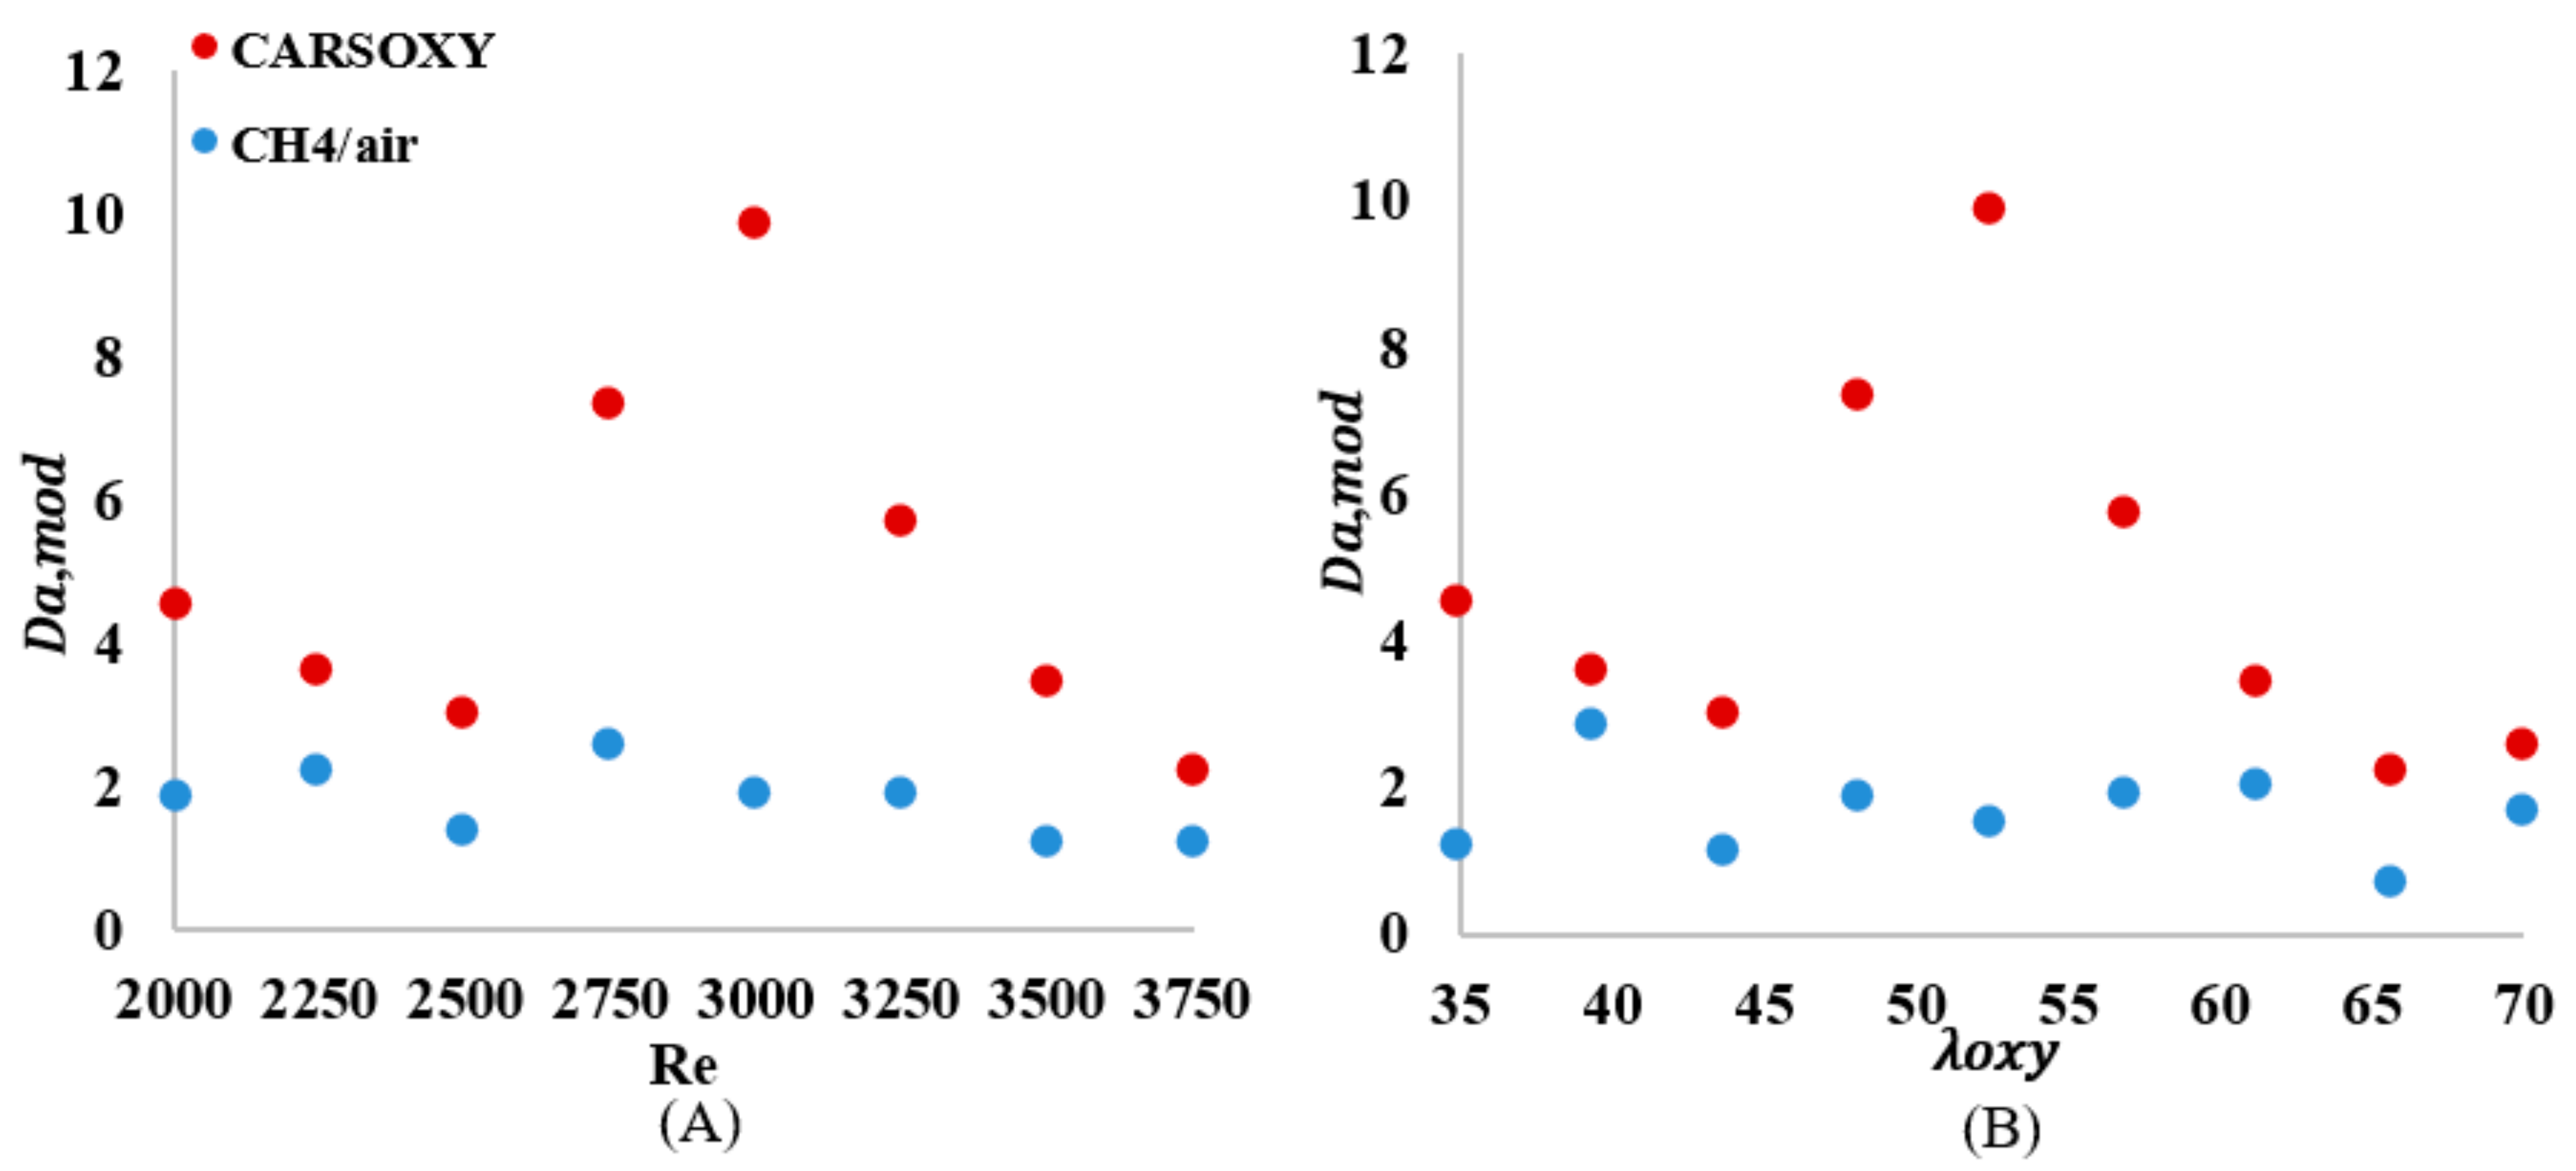
As previously mentioned, the flow velocity was also included in the analyses to provide a more adequate Da () to the conditions analyzed. Although just shifted all data points upwards, as compared in Figure 12A and Figure 14A, since the modified relative velocities were lower than the unmodified relative velocity , the data points in the Borghi diagram (Figure 15A) were redistributed towards the concentrated reaction zone in variable magnitudes. Depending on for each case (see Table 3), the same effects of the modified characteristic flow time and relative velocity for increasing were observed on the and Borghi diagram for increasing (Figure 14B and Figure 15B).
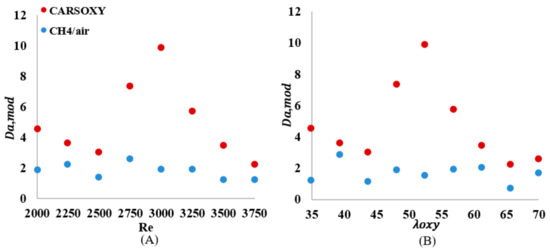
Figure 14.
number over (A) working fluid at and (B) .

Figure 15.
Modified Borghi regime for (A) working fluid at and (B) . The segmentation this Figure follows the Borghi combustion regime [33] convention, where the broken and connected reaction zones are separated by the Da = 1 line.
In addition, numerical correlations describing the results with respect to the Re are shown in Table 5 and Table 6. Those numerical correlations have been generated by curve-fitting the experimentally generated results using MATLAB-cftool, thus anticipating the analyzed parameters for a broader interval of Re to be related to the Re found in the typical gas turbine (Table 5 and Table 6).
Table 5.
Da correlations as functions of Re.
Table 6.
correlations as functions of Re.
As previously mentioned, the flow velocity has also been included in the analyses to provide a more adequate Da () to the conditions analyzed. Although just shifted all data points upwards, as compared in Figure 7A and Figure 9A, since the modified relative velocities were lower than the unmodified relative velocity , the data points in the Borghi diagram (Figure 15A) were redistributed towards the concentrated reaction zone in variable magnitudes.
As discussed in Section 2, the modified approach of estimating the Da number and plotting the combustion regime diagram considers the effect of the working fluid velocity ; thus, the variations between the unmodified (Figure 12 and Figure 13) and the modified approaches (Figure 9 and Figure 10) is directly related to the effect of the working fluid velocity. Depending on for each case (see Table 3), the same effects of the modified characteristic flow time and relative velocity for increasing were observed on the and Borghi diagram for increasing , Figure 14B and Figure 15B.
4. Discussion
Essentially, the standard deviation ) of the CARSOXY flame was lower than that of the CH4/air flame throughout the entire interval of by approximately 16%, indicating higher heat release than that of the CH4/air flame. In addition, the patterns have been approximated to linear trends, and the slope of the CARSOXY was found to be less than that of the CH4/air flame, indicating that the difference between the standard deviations of both flames is anticipated to become more significant as the increases (i.e.,).
Simultaneously, the average of the CARSOXY flame is 45% of the CH4/air flame. However, as the increases, the difference in between both flames decreases. Although the criteria provides an indication of flame stability, it does not highlight the flame turbulence-chemistry interaction. Therefore, the Damköhler number analyses suggested by [21] for non-premixed combustion have been performed. The of the CARSOXY flame was greater than one and greater than that of the CH4/air in all conditions, indicating that the rate of chemical reaction is faster than the characteristic flow velocity in comparison to CH4/air flames throughout the interval ([2000–3750]).
By plotting the Borghi regime diagram suggested by [21], it has been found that the tendency of the CARSOXY flame of approaching the concentrated reaction zone is greater than that of the CH4/air flame since the relative velocity of the CARSOXY flame was lower than that of CH4/air. Nevertheless, the CARSOXY flame also approached the concentrated reaction zone in the Borghi diagram as it exhibits a large relative length scale, thus allowing the flame to have a higher tendency to approach the concentrated reaction zone, indicating that the rate of chemical reaction is faster than characteristic flow velocity in comparison to CH4/air flames.
The modified Damköhler number and Borghi regime diagram, which take into account the effect of , have been plotted. The Damod of both flames have been higher than the unmodified , while maintaining the same order of magnitude and trend. Since the modified relative velocities were lower than, the data points in the Borghi diagram were redistributed towards the concentrated reaction zone in variable magnitudes, depending on of each case. Therefore, the modified Damköhler number and Borghi regime diagram have correlated the tendency of the flame to approach the concentrated reaction zone with the velocity of the working fluid (). In contrast, the original approaches anticipated the flame tendencies of approaching the concentrated reaction zone without including the effects of , which, as shown in Figure 15, have played an important role in redistributing data points over the modified Borghi regime diagram.
In addition, assessing the performance of the CARSOXY flame against the CH4/air flame at constant eliminates the role of high O2 content in CARSOXY and highlights the combined effect of CO2 and argon in CARSOXY. For the interval, CARSOXY patterns in comparison to CH4/air followed approximately the same patterns as those plotted for the interval (i.e., higher oxygen levels in CARSOXY compared to CH4/air). Therefore, it can be concluded that CO2 and argon have a significant effect on changing the CARSOXY flame behavior in comparison to the CH4/air flame. CARSOXY flame indicated a more stable heat release trend and a more condensed area of highest heat intensity than CH4/air. Moreover, the of the CARSOXY was always greater than that of the CH4/air flame in all conditions, indicating more thin and uniform flames, thus indicating that the rate of chemical reaction is faster than the characteristic flow velocity in comparison to CH4/air flames.
However, quantifying the effect of each individual CARSOXY component on the flame behavior is recommended as a future research goal by testing CH4/CO2-O2, CH4/Ar-O2 flames against CH4/air flame at constant equivalence ratios to identify the role of CO2 and Ar, respectively.
Finally, the results presented in this paper contribute to the effort of promoting CARSOXY to industry. Previous research [14,15] clearly shows that a gas turbine’s performance can be increased by using humidification and evaporation. In addition, heat exchangers are excellent methods of heat recovery [13]. These methods have a higher potential to increase cycle efficiency when a CARSOXY mixture is used as the working fluid [14,15]. If a suitable cycle configuration is used under specific operation conditions, high thermo-economic benefits can be reached.
Moreover, a CO2-Ar-Steam mixture can enhance efficiency while maintaining a relatively low level of CO2 emissions by further carbon capture and storage techniques, which are considered one of the imperative requirements for future fossil-fueled gas turbines [13,14,15]. Several theoretical studies have been conducted on CARSOXY gas turbines to cover multidisciplinary issues. Al-Doboon et al. [12] have theoretically proven that CARSOXY increases cycle efficiency by 13% compared to air-driven gas turbines. Fawwaz-Alrebei et al. [14] have theoretically identified the ultimate working conditions of CARSOXY gas turbines and optimized CARSOXY blends. Moreover, the feasibility of producing CARSOXY in an economically efficient approach has also been addressed elsewhere [14,15]. The techno-economic sustainability of producing a continuous supply of argon for the CARSOXY blend has been analyzed in previous studies [13,14].
Nevertheless, experimental campaigns are needed to demonstrate the practicality of this concept. As previously highlighted, experimental studies in the literature [14,15] characterize O2/CO2/fuel combustion but provide no evidence for CO2/Ar/O2/fuel combustion (CARSOXY).
Therefore, this paper attempts to experimentally characterize CO2/Ar/O2/fuel flames in a swirl burner typical of gas turbine systems. A comparative study has been conducted to assess CO2/Ar/O2/CH4’s flame stability compared with an air/methane flame.
5. Conclusions
This paper has experimentally assessed CARSOXY in comparison to a CH4/air flame using OH* Chemiluminescence integrated with OH PLIF imaging techniques in terms of turbulence-chemistry interactions. The main conclusions of this study are summarized as follows:
Based on the criteria of the standard deviation of heat release fluctuations, the CARSOXY flame indicated a more stable heat release trend compared to the CH4/air flame.
The CARSOXY flame indicated a more condensed area of the highest heat intensity compared to the CH4/air flame.
The of the CARSOXY was always greater than that of the CH4/air flame in all conditions, indicating more thin and uniform flames, and also thus indicating, moreover, that the rate of chemical reaction is faster than the characteristic flow velocity in comparison to CH4/air flames.
As demonstrated in the Borghi diagram, the tendency of the CARSOXY flame to approach the concentrated reaction zone was higher than that of the CH4/air flame, thus indicating more uniform flames with a chemical reaction rate that is faster than the characteristic flow velocity.
Part of the novelty of this paper is the suggestion of a modified formula of the Damköhler number based on experimental observations. The modified Damköhler number and Borghi regime diagram have correlated the tendency of the flame of approaching the concentrated reaction zone to the velocity of the working fluid (), while the original approaches anticipated the flame tendencies of approaching the concentrated reaction zone without including the effects of .
Author Contributions
Conceptualization, O.F.A., A.I.A., S.M., P.B. and A.V.M.; methodology, O.F.A., A.I.A., S.M., P.B. and A.V.M.; software O.F.A., A.I.A., S.M., P.B. and A.V.M.; validation, O.F.A., A.I.A., S.M., P.B. and A.V.M.; formal analysis, O.F.A., A.I.A., S.M., P.B. and A.V.M.; investigation, O.F.A., A.I.A., S.M., P.B. and A.V.M.; resources, O.F.A., A.I.A., S.M., P.B. and A.V.M.; data curation, O.F.A., A.I.A., S.M., P.B. and A.V.M.; writing—original draft preparation, O.F.A., A.I.A., S.M., P.B. and A.V.M.; writing—review and editing, O.F.A., A.I.A., S.M., P.B. and A.V.M.; visualization, O.F.A., A.I.A., S.M., P.B. and A.V.M.; supervision, O.F.A., A.I.A., S.M., P.B. and A.V.M.; project administration, O.F.A., A.I.A., S.M., P.B. and A.V.M.; funding acquisition, O.F.A., A.I.A., S.M., P.B. and A.V.M. All authors have read and agreed to the published version of the manuscript.
Funding
This research was funded by [the Qatar National Research Fund] grant number [NPRP13S-0203-200243].
Informed Consent Statement
Not applicable.
Acknowledgments
The authors gratefully acknowledge the support from the Welsh European Funding Office (WEFO) through its program “Flexible Integrated Energy Systems (FLEXIS)”, project no. 80835. The authors would like to thank Malcolm Seaborne for his technical support during experimental set-up. This publication was made possible by NPRP 13 grant # (NPRP13S-0203-200243) from the Qatar National Research Fund (a member of the Qatar Foundation). The findings herein reflect the work and are solely the responsibility of the authors. Open Access funding provided by the Qatar National Library.
Conflicts of Interest
The authors declare no conflict of interest.
Nomenclature
| Area of the highest heat intensity () | |
| Burner Cross-sectional area () | |
| Location of the highest heat intensity (mm) | |
| Background corrected pixel intensity | |
| Damköhler number | |
| The modified Damköhler number | |
| I | Intensity (count) |
| Horizontal pixel | |
| Vertical pixel | |
| Hydraulic diameter (m) | |
| The outer diameter of the swirler nozzle (m) | |
| The flame base location where the maximum OH intensity is found (mm) | |
| Lower Heating Value (kJ/kg) | |
| Actual Oxygen Mass Flow Rate (g/s) | |
| Actual Fuel Mass Flow Rate (g/s) | |
| Mass flow rate of fuel (kg/s) | |
| Number of oxygen molecules in stoichiometric combustion of CH4 (=2) | |
| Number of CH4 molecules in stoichiometric combustion (=1) | |
| Number of images | |
| N | Molar fraction |
| Actual oxygen to fuel ratio | |
| Stoichiometric oxygen to fuel (CH4) ratio (=2) | |
| Instantaneous heat release | |
| Average heat release | |
| Heat release fluctuation | |
| Thermal power (kW) | |
| Reynolds number | |
| Laminar flame speed (mm/s) | |
| Fuel injection velocity (mm/s) | |
| Velocity (m/s) | |
| Volume flow rate (m3/s) | |
| The volume flow rate of fuel (L/min) | |
| The volume flow rate of working fluid (L/min) | |
| X | Horizontal direction |
| Y | Vertical direction |
| Flame brush thickness | |
| Oxygen to fuel equivalence ratio | |
| Dynamic Viscosity (kg/ms) | |
| Kinematic viscosity (m2/s) | |
| Density (kg/m3) | |
| Standard deviation of heat release fluctuation ( | |
| Characteristic chemical time (s) | |
| Characteristic flow (integral time scale) (s) |
Appendix A
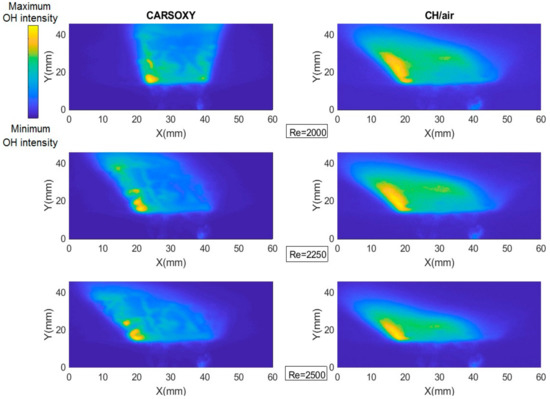
Figure A1.
Chemiluminescence sample images at A: working fluid at .
Figure A1.
Chemiluminescence sample images at A: working fluid at .
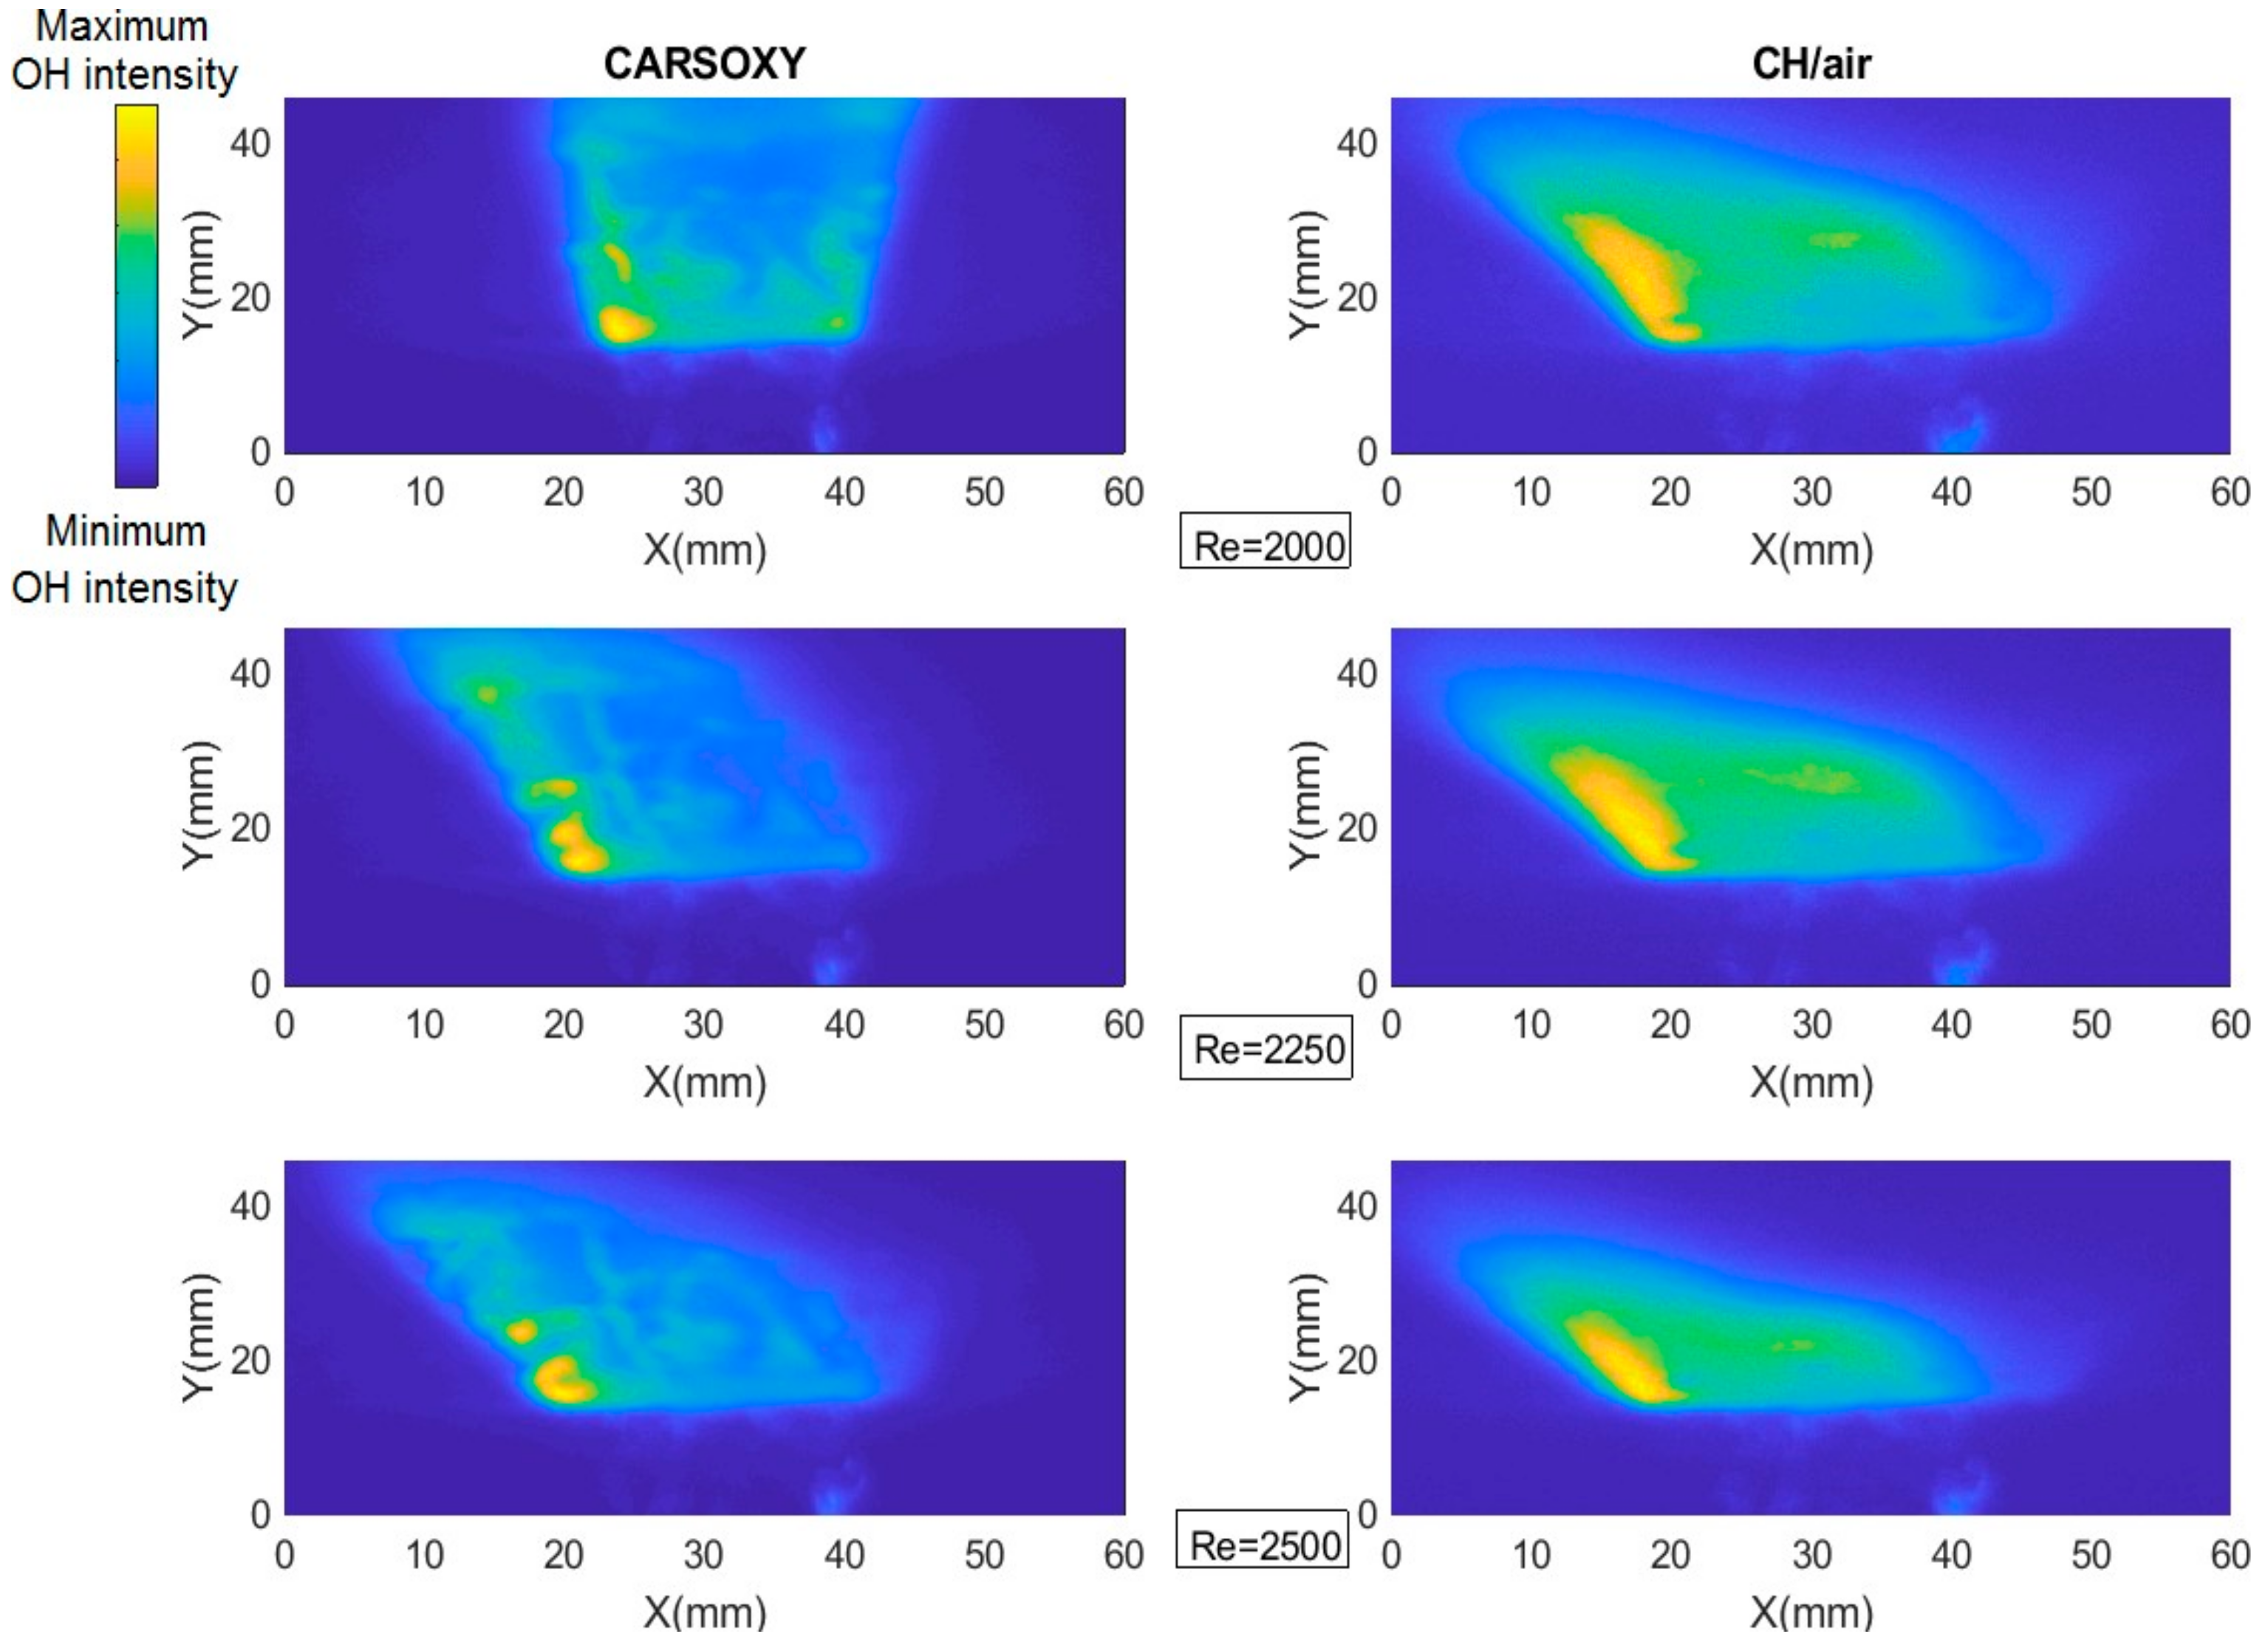
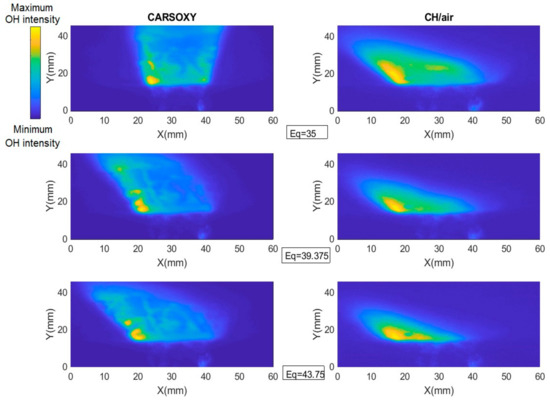
Figure A2.
Chemiluminescence sample images at .
Figure A2.
Chemiluminescence sample images at .
References
- Abdelhafez, A.; Rashwan, S.S.; Nemitallah, M.A.; Habib, M.A. Stability map and shape of premixed CH4/O2/CO2 flames in a model gas-turbine combustor. Appl. Energy 2018, 215, 63–74. [Google Scholar] [CrossRef]
- Schorr, M.M.; Chalfin, J. GE Power Generation. In Gas Turbine NOx Emissions Approaching Zero–Is It Worth the Price? GE Power Generation: New York, NY, USA, 1999. [Google Scholar]
- Committee on Climate Change. UK Regulations: The Climate Change Act—Committee on Climate Change. 2019. Available online: https://www.theccc.org.uk/tackling-climate-change/the-legal-landscape/the-climate-change-act/ (accessed on 5 June 2019).
- Liu, C.Y.; Chen, G.; Sipöcz, N.; Assadi, M.; Bai, X.S. Characteristics of oxy-fuel combustion in gas turbines. Appl. Energy 2012, 89, 387–394. [Google Scholar] [CrossRef]
- Li, H.; Yan, J.; Anheden, M. Impurity impacts on the purification process in oxy-fuel combustion based CO2 capture and storage system. Appl. Energy 2009, 86, 202–213. [Google Scholar] [CrossRef]
- Fawwaz-Alrebei, O.; Aldoboon, A.; Bowen, P.; Valera, A. Techno-economics of CO2-Argon-Steam Oxy-Fuel (CARSOXY) Gas Turbines. In Proceedings of the 6th International Conference on Engineering, Energy, and Environment (ICEEE), Bangkok, Thailand, 27–29 November 2019. [Google Scholar]
- Rashwan, S.S.; Essawey, A.H.I.; Abouarab, T.W. Experimental Investigation of Oxy-Fuel Combustion of CNG Flames Stabilized over a Perforated-Plate Burner; Nternational Flame Research Foundation, Cairo University: Cairo, Egypt, 2015. [Google Scholar]
- Stein-Brzozowska, G.; Maier, J.; Scheffknecht, G. Impact of the oxy-fuel combustion on the corrosion behavior of advanced austenitic superheater materials. Energy Procedia 2011, 4, 2035–2042. [Google Scholar] [CrossRef] [Green Version]
- Huang, Y.; Yang, V. Dynamics and stability of lean-premixed swirl-stabilized combustion. Prog. Energy Combust. Sci. 2009, 35, 293–364. [Google Scholar] [CrossRef]
- Xie, Y.; Wang, J.; Zhang, M.; Gong, J.; Jin, W.; Huang, Z. Experimental and numerical study on laminar flame characteristics of methane oxy-fuel mixtures highly diluted with CO2. Energy Fuels 2013, 27, 6231–6237. [Google Scholar] [CrossRef]
- Yokoyama, R.; Ito, K.; Matsumoto, Y. Optimal sizing of a gas turbine cogeneration plant in consideration of its operational strategy. J. Eng. Gas Turbines Power 1994, 116, 32–38. [Google Scholar] [CrossRef]
- Al-Doboon, A.; Gutesa, M.; Valera-Medina, A.; Syred, N.; Ng, J.H.; Chong, C.T. CO2-argon-steam oxy-fuel (CARSOXY) combustion for CCS inert gas atmospheres in gas turbines. Appl. Therm. Eng. 2017, 122, 350–358. [Google Scholar] [CrossRef]
- Fawwaz-Alrebei, O.; Aldoboon, A.; Bowen, P.; Valera, A. CARSOXY combined with Ammonia Production for Efficient, Profitable CCS cycles. In Proceedings of the International Gas Turbine Congress, Tokyo, Japan, 17–22 November 2019. [Google Scholar]
- Fawwaz Alrebei, O.; Al-Doboon, A.; Bowen, P.; Valera Medina, A. CO2-Argon-Steam Oxy-Fuel Production for (CARSOXY) Gas Turbines. Energies 2019, 12, 3580. [Google Scholar] [CrossRef] [Green Version]
- GmbH, L.; LaVision. Lavision.de. 2019. Available online: https://www.lavision.de/en/ (accessed on 15 October 2020).
- Kuo, K.K.Y.; Acharya, R. Fundamentals of Turbulent and Multiphase Combustion; John Wiley & Sons: Hoboken, NJ, USA, 2012. [Google Scholar]
- Controller, Mass. Mass Flow Controller. Bronkhorst. 2021. Available online: https://www.bronkhorst.com/en-us/campaign-en/mass-flow-controller/?gclid=EAIaIQobChMI-_HQreu98wIVDbjICh3aoABfEAAYASAAEgImrvD_BwE (accessed on 16 October 2020).
- Ma, L.; Chen, X.; Yu, S.; Fang, Q.; Zhang, C.; Chen, G. Effect of H2O on the combustion characteristics and interactions of blended coals in O2/H2O/CO2 atmosphere. J. Energy Inst. 2021, 94, 222–232. [Google Scholar] [CrossRef]
- Official BOC UK Online|Industrial Gases|Products & Solutions|Boconline UK. Boconline UK. 2021. Available online: https://www.boconline.co.uk/en/index.html (accessed on 17 October 2020).
- Alrebei, O.F.; Bowen, P.; Valera Medina, A. Parametric Study of Various Thermodynamic Cycles for the Use of Unconventional Blends. Energies 2020, 13, 4656. [Google Scholar] [CrossRef]
- Kim, T.Y.; Kim, Y.H.; Ahn, Y.J.; Choi, S.; Kwon, O.C. Combustion stability of inverse oxygen/hydrogen coaxial jet flames at high pressure. Energy 2019, 180, 121–132. [Google Scholar] [CrossRef]
- Runyon, J.O.N. Gas Turbine Fuel Flexibility: Pressurized Swirl Flame Stability, Thermoacoustics, and Emissions. Ph.D. Thesis, Cardiff University, Cardiff, UK, 2017. [Google Scholar]
- Bland, J.M.; Altman, D.G. Statistics notes measurement error. BMJ 1996, 312, 1654. [Google Scholar] [CrossRef] [PubMed] [Green Version]
- Luque, J.; Crosley, D. LIFBASE (Version 2.1.1). SRI Report No. MP 99-009. SRI International. 1999. Available online: https://www.sri.com/engage/products-solutions/lifbase (accessed on 18 October 2020).
- Han, Z.; Hochgreb, S. The response of stratified swirling flames to acoustic forcing: Experiments and comparison to model. Proc. Combust. Inst. 2015, 35, 3309–3315. [Google Scholar] [CrossRef] [Green Version]
- Emadi, M.; Karkow, D.; Salameh, T.; Gohil, A.; Ratner, A. Flame structure changes resulting from hydrogen-enrichment and pressurization for low-swirl premixed methane–air flames. Int. J. Hydrog. Energy 2012, 37, 10397–10404. [Google Scholar] [CrossRef]
- Hanche-Olsen, H. Buckingham’s pi-Theorem. NTNU. 2004. Available online: http://www.math.ntnu.no/~hanche/notes/buckingham/buckingham-a4.pdf (accessed on 19 October 2020).
- Hu, F.; Li, P.; Guo, J.; Wang, K.; Liu, Z.; Zheng, C. Evaluation, development, and validation of a new reduced mechanism for methane oxyfuel combustion. Int. J. Greenh. Gas Control 2018, 78, 327–340. [Google Scholar] [CrossRef]
- Naik, S.V.; Laurendeau, N.M. Quantitative laser-saturated fluorescence measurements of nitric oxide in counter-flow diffusion flames under sooting oxyfuel conditions. Combust. Flame 2002, 129, 112–119. [Google Scholar] [CrossRef]
- Al-Doboon, A. A Novel Blend, CARSOXY, as a Working Fluid for Advanced Gas Turbine Cycles. Ph.D. Thesis, Cardiff Univeristy, Cardiff, UK, 2019. [Google Scholar]
- Kim, H.K.; Kim, Y.; Lee, S.M.; Ahn, K.Y. Studies on combustion characteristics and flame length of turbulent oxy-fuel flames. Energy Fuels 2007, 21, 1459–1467. [Google Scholar] [CrossRef]
- Shi, W.; Tian, Y.; Zhang, W.Z.; Deng, W.X.; Zhong, F.Y.; Le, J.L. Experimental investigation on flame stabilization of a kerosene-fueled scramjet combustor with pilot hydrogen. J. Zhejiang Univ.-Sci. A 2020, 21, 663–672. [Google Scholar] [CrossRef]
- Borghi, R. Turbulent combustion modelling. Prog. Energy Combust. Sci. 1988, 14, 245–292. [Google Scholar] [CrossRef]
- Zhang, K.; Ghobadian, A.; Nouri, J.M. Comparative study of non-premixed and partially-premixed combustion simulations in a realistic Tay model combustor. Appl. Therm. Eng. 2017, 110, 910–920. [Google Scholar] [CrossRef]


Publisher’s Note: MDPI stays neutral with regard to jurisdictional claims in published maps and institutional affiliations. |
© 2021 by the authors. Licensee MDPI, Basel, Switzerland. This article is an open access article distributed under the terms and conditions of the Creative Commons Attribution (CC BY) license (https://creativecommons.org/licenses/by/4.0/).